A Low-Cost Vehicular Traffic Monitoring System Using Fog Computing
by
 , , , and
Spiridon Vergis
1,*,† ,
,
Vasileios Komianos
2,
Georgios Tsoumanis
3,
Athanasios Tsipis
1,† and
and
Konstantinos Oikonomou
1,† 1
Department of Informatics, Ionian University, 49100 Corfu, Greece
2
Department of Audio and Visual Arts, Ionian University, 49100 Corfu, Greece
3
Department of Informatics and Telecommunications, University of Ioannina, 47100 Arta, Greece
*
Author to whom correspondence should be addressed.
†
The 4th South-East Europe Design Automation, Computer Engineering, Computer Networks and Social Media Conference (SEEDA 20 September 2019, University of Piraeus, Piraeus-Greece).
Smart Cities 2020, 3(1), 138-156; https://doi.org/10.3390/smartcities3010008
Submission received: 22 January 2020
/
Revised: 1 March 2020
/
Accepted: 13 March 2020
/
Published: 19 March 2020
Abstract
:With the rapid increase of vehicles in use worldwide, the need for efficient traffic monitoring systems has arisen. This work proposes a low-cost vehicular traffic monitoring system using IoT devices and fog computing. The system is based on a three-tiered architecture which is composed of (i) the mobile tracking system that records the positions of the vehicles using GPS technologies; (ii) the information gathering system which gathers all the data collected by the mobile tracking system; and (iii) the fog devices that process the data collected and extract the information needed. The system is tested in the town of Corfu during a period of increased tourism when the traffic is considered to be relatively dense. The mobile tracking system devices are placed on taxis and with the help of professional taxi drivers the accuracy of the data collected is evaluated. The system is able to record the movement of the vehicles accurately using its own independent data. The results can be remotely accessed by utilizing fog and cloud computing infrastructure established to process the data and upload it on a server. The system is used to give a better understanding of the speed variance in the center of the town during different dates and hours. In conclusion the system presented in this study can be utilized to monitor the traffic and provide vital information about its behavior in relation to time.
1. Introduction
The issue of traffic congestion is a major concern to most road users for the last decades. The concept of traffic congestion can be addressed in various ways. The most commonly used definition is that of a road system containing blockages created by vehicles queued [1]. Even though the phenomenon does not present any imminent threats, it essentially costs all members of the urban community an adequate amount of money. Based on the research carried out by INRIX Industries [2], which analyze global road traffic data, during the year of 2018 the annual cost of traffic congestion (per driver) ranges between 350 to 2500 euros. Additionally it is common knowledge that this issue can be responsible for bringing the urban road users to stressful situations, by stalling them from reaching their destination. This in result leads them to alternative routes through narrow and unfamiliar streets, increasing the likelihood of a road accident.
Certain studies have analyzed the concept of vehicular traffic throughout the last few decades to understand its behavior [1,3]. Previous research indicated that the major causes of traffic congestion are (i) the infrastructure of the road network, (ii) the inefficient operation of the streets during periods of high demand [1] and various incidents such as accidents or road works [3]. The first cause requires a lot of time and resources to be dealt with and since the number of vehicles on the streets is increasing rapidly the demand will always exceed the capacity of the road network. On the other hand, the last two issues can be addressed faster and with different approaches. Analysis of data shows that “congestion reduces efficiency by 20% to 50%” and “a 20% capacity expansion is financially impossible” [1]. Also traffic congestion can be either recurring, hence predictable, e.g., during rush hours when dense traffic is expected, or non-recurring, therefore unexpected, due to other factors such as accidents or road blocks. As a result it is important to monitor the traffic density of a road network and examine its behavior.
In order to create a sustainable and livable environment many cities around the globe find smarter ways to deal with these problems. These cities are increasingly called Smart Cities [4]. The concept of Smart Cities has been the core of many studies for the last two decades. The factors that make a city smart can be drawn by the definition of Smart Cities. There is no specific and unique definition of the term Smart Cities since it is not yet mature to be considered an independent research area. The most common description is that of a city that combines Information and Communication technologies to optimize and speed up processes and find new solutions to city management complexity [5]. With the 5G network technology impending, the vision of Smart Cities has a lot of potential to become reality. The Internet of Things (IoT) concept can strengthen the idea of Smart Cities. IoT devices are smart and self-configuring objects that are connected to each other through a global network infrastructure. These IoT devices are usually small and energy efficient devices with low storage and processing capacity [6]. These devices can be broadly scattered and have the potential to create a low-cost, self-sustaining network. Using an IoT system could be a very effective approach for traffic monitoring and vehicle movement management. Possible solutions suggest the use of technologies such as cameras, sensors and various platforms to rely on elements such as the speed. Furthermore with the use of GPS technology it could be possible to evaluate the situation. However, to the authors’ knowledge, very few publications can be found in literature that address the issue of traffic monitoring using IoT devices and fog computing. Based on the aforementioned, this work proposes a low-cost vehicular traffic monitoring system using IoT devices and fog computing.
The main contribution of this study is that it introduces a new approach of vehicle traffic monitoring using IoT devices, sensors and fog devices. The low-cost system described uses GPS technology to monitor the movement of the GPS-equipped vehicles around the city and to estimate the traffic load during different time periods. A three-tier architecture is proposed for the presented system which consists of (i) the mobile tracking system devices that are placed on the vehicles and monitor their movement; (ii) the information gathering system devices that are broadly scattered around the town and collect the data recorded by the mobile tracking system devices; and (iii) the fog devices that process the gathered data and upload the results on a private cloud service provided by the Ionian’s University computing infrastructure. Given the fact that the data stored is of considerable size (the devices collect data about the vehicles’ movement every one (1) sec), two data reduction techniques are applied. The data reduction techniques remove any data that does not provide any useful information and they have the ability to reduce the data to 5% of the initial size. The system is put to the test in the Town of Corfu during a period of increased tourist activity when the traffic load in the center is heavy. The system is able to monitor the vehicles’ movement accurately and the information gathered is able to provide a precise representation of the traffic during different days and hours of this period. The open architecture of the presented system and its relatively low cost implementation and operation make it an appropriate solution for local authorities that plan to monitor vehicles’ traffic in order to gain knowledge on the traffic behavior and provide traffic related smart cities services.
The remainder of this paper is organized as follows: In Section 2 a brief overview of previous research is presented, based on the technological approaches each study presents. Section 3 analyzes the proposed system and it is divided into three subsections, one for each component. This system’s functionality is presented in Section 4 which consists of three subsections, where the different software components are outlined. The system test runs are examined in Section 5. The system’s limitation along with some findings discovered during the test runs, are presented in Section 6. Finally Section 7 draws conclusions regarding the proposed system and the tests along with guidelines for future work.
2. Past Related Work
The phenomenon of urban traffic has received much attention in the last couple of decades. In Nellore’s et al. [7] survey a plethora of traffic monitoring and management systems are presented.
Initial studies outline the use of image processing techniques to create a video-based real-time traffic monitoring system, like the one presented in Kilger’s work [8], which uses the shadows of the vehicles to detect their position and speed. A weakness in Kilger’s study is the fact that the system relies on the shadows of the vehicles which means that it works only under specific conditions. Kamijo et al. [9] developed an algorithm which uses image sequences to monitor the traffic and detect accidents at intersections. The approach of Kostia Robert [10] allows for vehicle detection during day and night with the use of background subtraction and road illumination agnostic.
Another early method is presented in the study of Zhang et al. [11], which suggests the use of cement-based piezoelectric sensors to monitor the traffic flow. A piezoelectric sensor works as a switch that turns on and off every time pressure is applied on it giving accurate real-time detection of vehicular traffic. Similar ideas comprise of the installation of embedded road sensors [12] and/or sound capturing devices (microphones) [13] that measure the traffic density using on-site computers. Such systems, though, are expensive to install and maintain.
The approach presented in Cho’s [14] study involves the use of a GPS device which monitors the movement of the vehicle and logs it. The system uses the data stored to estimate how heavy the traffic might be in the future. Similar to Cho’s study, Scofield et al. [15] propose different methods to predict expected traffic flow conditions by discovering road traffic patterns found in previously stored data. Kanistras’ et al. [16] study proposes the use of Unmanned Aerial Vehicles (UAVs) in collaboration with video-processing or radar systems for traffic surveillance and road tracking. Despite its potential, the system proposed in Kanistras’ et al. work requires time and resources to collect the data.
With the rapid advance of cellular networks, several studies have been carried out exploiting those services to monitor the traffic. In Janecek’s et al. [17] study is shown that mobile phone data can be used to measure the traffic based on anonymous data. A similar approach is presented in Handel’s et al. [18] work. A road traffic probing activity called the MOving VEhicle LOgger (MOVELO) is used to monitor the traffic conditions by exploiting the GPS in cellular phones. According to Lewandowski’s [19] work, the detection of passing vehicles as a form of traffic monitoring can be achieved by utilizing mobile devices (Smartphones) and Bluetooth Low Energy (BLE) Beacons which are placed on the side of the street. Based on D. Barth [20], Product Manager for Google Maps, the mobile application Google Maps uses the users’ phones to send anonymous bits of data back to Google describing how fast the users are moving. That data is used to create the traffic layers shown on Google Maps and to spot any possible traffic patterns to strengthen the systems calculations. Google Maps collects data in real-time from its users’ cell devices. It uses that data in collaboration with information regarding special events (e.g., holidays) to estimate the traffic density and to calculate the time needed for a vehicle to go from one location to another. For a user to make use of this service, Google Maps requires cellular data from a mobile services provider and provides only a small amount of services for free. The wide market adoption of Google Maps services makes it vulnerable to misuse, as quite recently an artist named Simon Weckert [21] managed to trick Google Maps into thinking that the traffic density on some roads was much bigger that it actually was. Simon exploited the fact that Google Maps relies on users’ cellular devices to estimate the traffic. This action not only affected the information provided by the service to the other users but also affected the route recommendation service resulting in remarkable traffic changes around these areas.
Due to their grown popularity, social networks have proven to be an adequate source of information. Chen et al. [22] present a system that exploits the content created by the social networks users (language, interactions with traffic-related events etc.) on popular social networks, such as Tweeter. Ribeiro et al. [23] propose a similar system that analyzes Foursquare and Instagram Data in real-time and can estimate the traffic conditions based on them. The main weakness in their studies is that the information relevant with traffic is limited and hard to extract.
More recent works highlight the use of Wireless Sensor Networks (WSN). Matsui et al. [24] presents a system with comprises of two devices, (i) a vehicle-mounted wireless ID device and (ii) a wireless roadside device. The former transmits the vehicle’s unique ID whenever the latter sends a request. As mentioned by Eng-Han et al. [25], a system composed of low-power devices with sensors placed on the roadside can also by used for traffic monitoring. The devices presented in Eng-Han’s work use various sensors, such as accelerometers, acoustic microphones and Magnetometers, to track the passing vehicles.
With the 5G network technology impending the vision of Smart Cities has a lot of potential to become reality. One of the many aspects of a Smart City is the concept of Smart Vehicles. Based on Noh’s [26] work, an adequate method of transmitting and monitoring traffic includes exploiting a vehicle’s various sensors to measure the traffic and transmit that data to other vehicles through Vehicle-To-Vehicle communication. Similarly Bauza et al. [27] propose a traffic monitoring technique which exploits Vehicle-To-Vehicle communications without the use of deplorable sensors.
Quite recently, considerable attention has been paid to IoT devices and their potential to improve the lifestyle in the cities. Wu He et al. [28] present a multilayered vehicular data cloud platform based on cloud computing and IoT technologies to improve different services such as traffic monitoring or road navigation. A real-time traffic information collection system is presented in HO Al-Sakran’s [29] work. The system ran in numerous simulations for testing. Sukode et al. [30] propose a similar approach to the aforementioned with additional sensors (to calculate traffic jams, density, weather pollution etc.) and a web application to monitor the results remotely. In Rizwan’s [12] work a low cost real-time smart traffic management system is presented. The system consists of embedded road sensors that gather data in real-time. The analyzed data can be accessed through a mobile application.
The main drawback of using cloud services to process the data is that it takes time for the data to be uploaded on the cloud, processed and sent back to the end users as useful information. Cloud computing can overcome that issue by exploiting fog devices that are between the cloud and the end users, to process the data. Ning Chen et al. [31] exploit the concept of fog computing to support an urban traffic monitoring system. In Huang’s et al. [32] work the concept of vehicular fog computing is explained along with its potential and the challenges arising with it. The concept of vehicular fog computing is further studied by Ning et al. [33]. In their work they compare Vehicular Fog Computing with Vehicular Cloud Computing and they further evaluate the concept of Vehicular Fog Computing as a real-time traffic monitoring system.
Even though the aforementioned works present only concepts of traffic monitoring systems or systems tested in small scale scenarios, similar systems have already been deployed in large-scale environments. In the state of Qatar similar techniques are already put to use as mentioned in Jabbar’s et al. [34] work which reviews and analyzes the existing traffic system of Qatar. An important parameter of traffic that worth examining is the Level of Service (LOS) indicator [35] which is commonly used to express the traffic congestion levels on highways in terms of vehicles per kilometer per lane (car/km/lane) and it is classified in six (6) levels from ranging from non-existent traffic to extremely dense traffic congestion. Moreover, the authors suggest that density is the most important parameter to identify traffic congestion and take advantage of connected vehicle technology and artificial intelligence to estimate the traffic density.
The proposed system is capable of collecting its own independent data using IoT technologies without relying on any third party software or services. A preliminary version of this study was published in the proceedings of The 4th South-East Europe Design Automation, Computer Engineering, Computer Networks and Social Media Conference (SEEDA 20 September 2019, University of Piraeus, Piraeus-Greece) showing that the system is capable of monitoring the traffic flow based on the motion data of the equipped vehicles. In contrast to Google Maps, the system does not rely to mobile telephony service providers for geo-location and data communication. In addition, it does not have known weaknesses that would allow misuse actions to affect the provided services. This work utilizes Fog Computing technologies to collect the data, extract information and forward the information to the cloud infrastructure allowing both decentralized and centralized access to the obtained information. The system’s open architecture allows organizations to setup their own low cost implementations while its ability to provide open data enables the development of added value services for local authorities and businesses.
3. Overall System Description
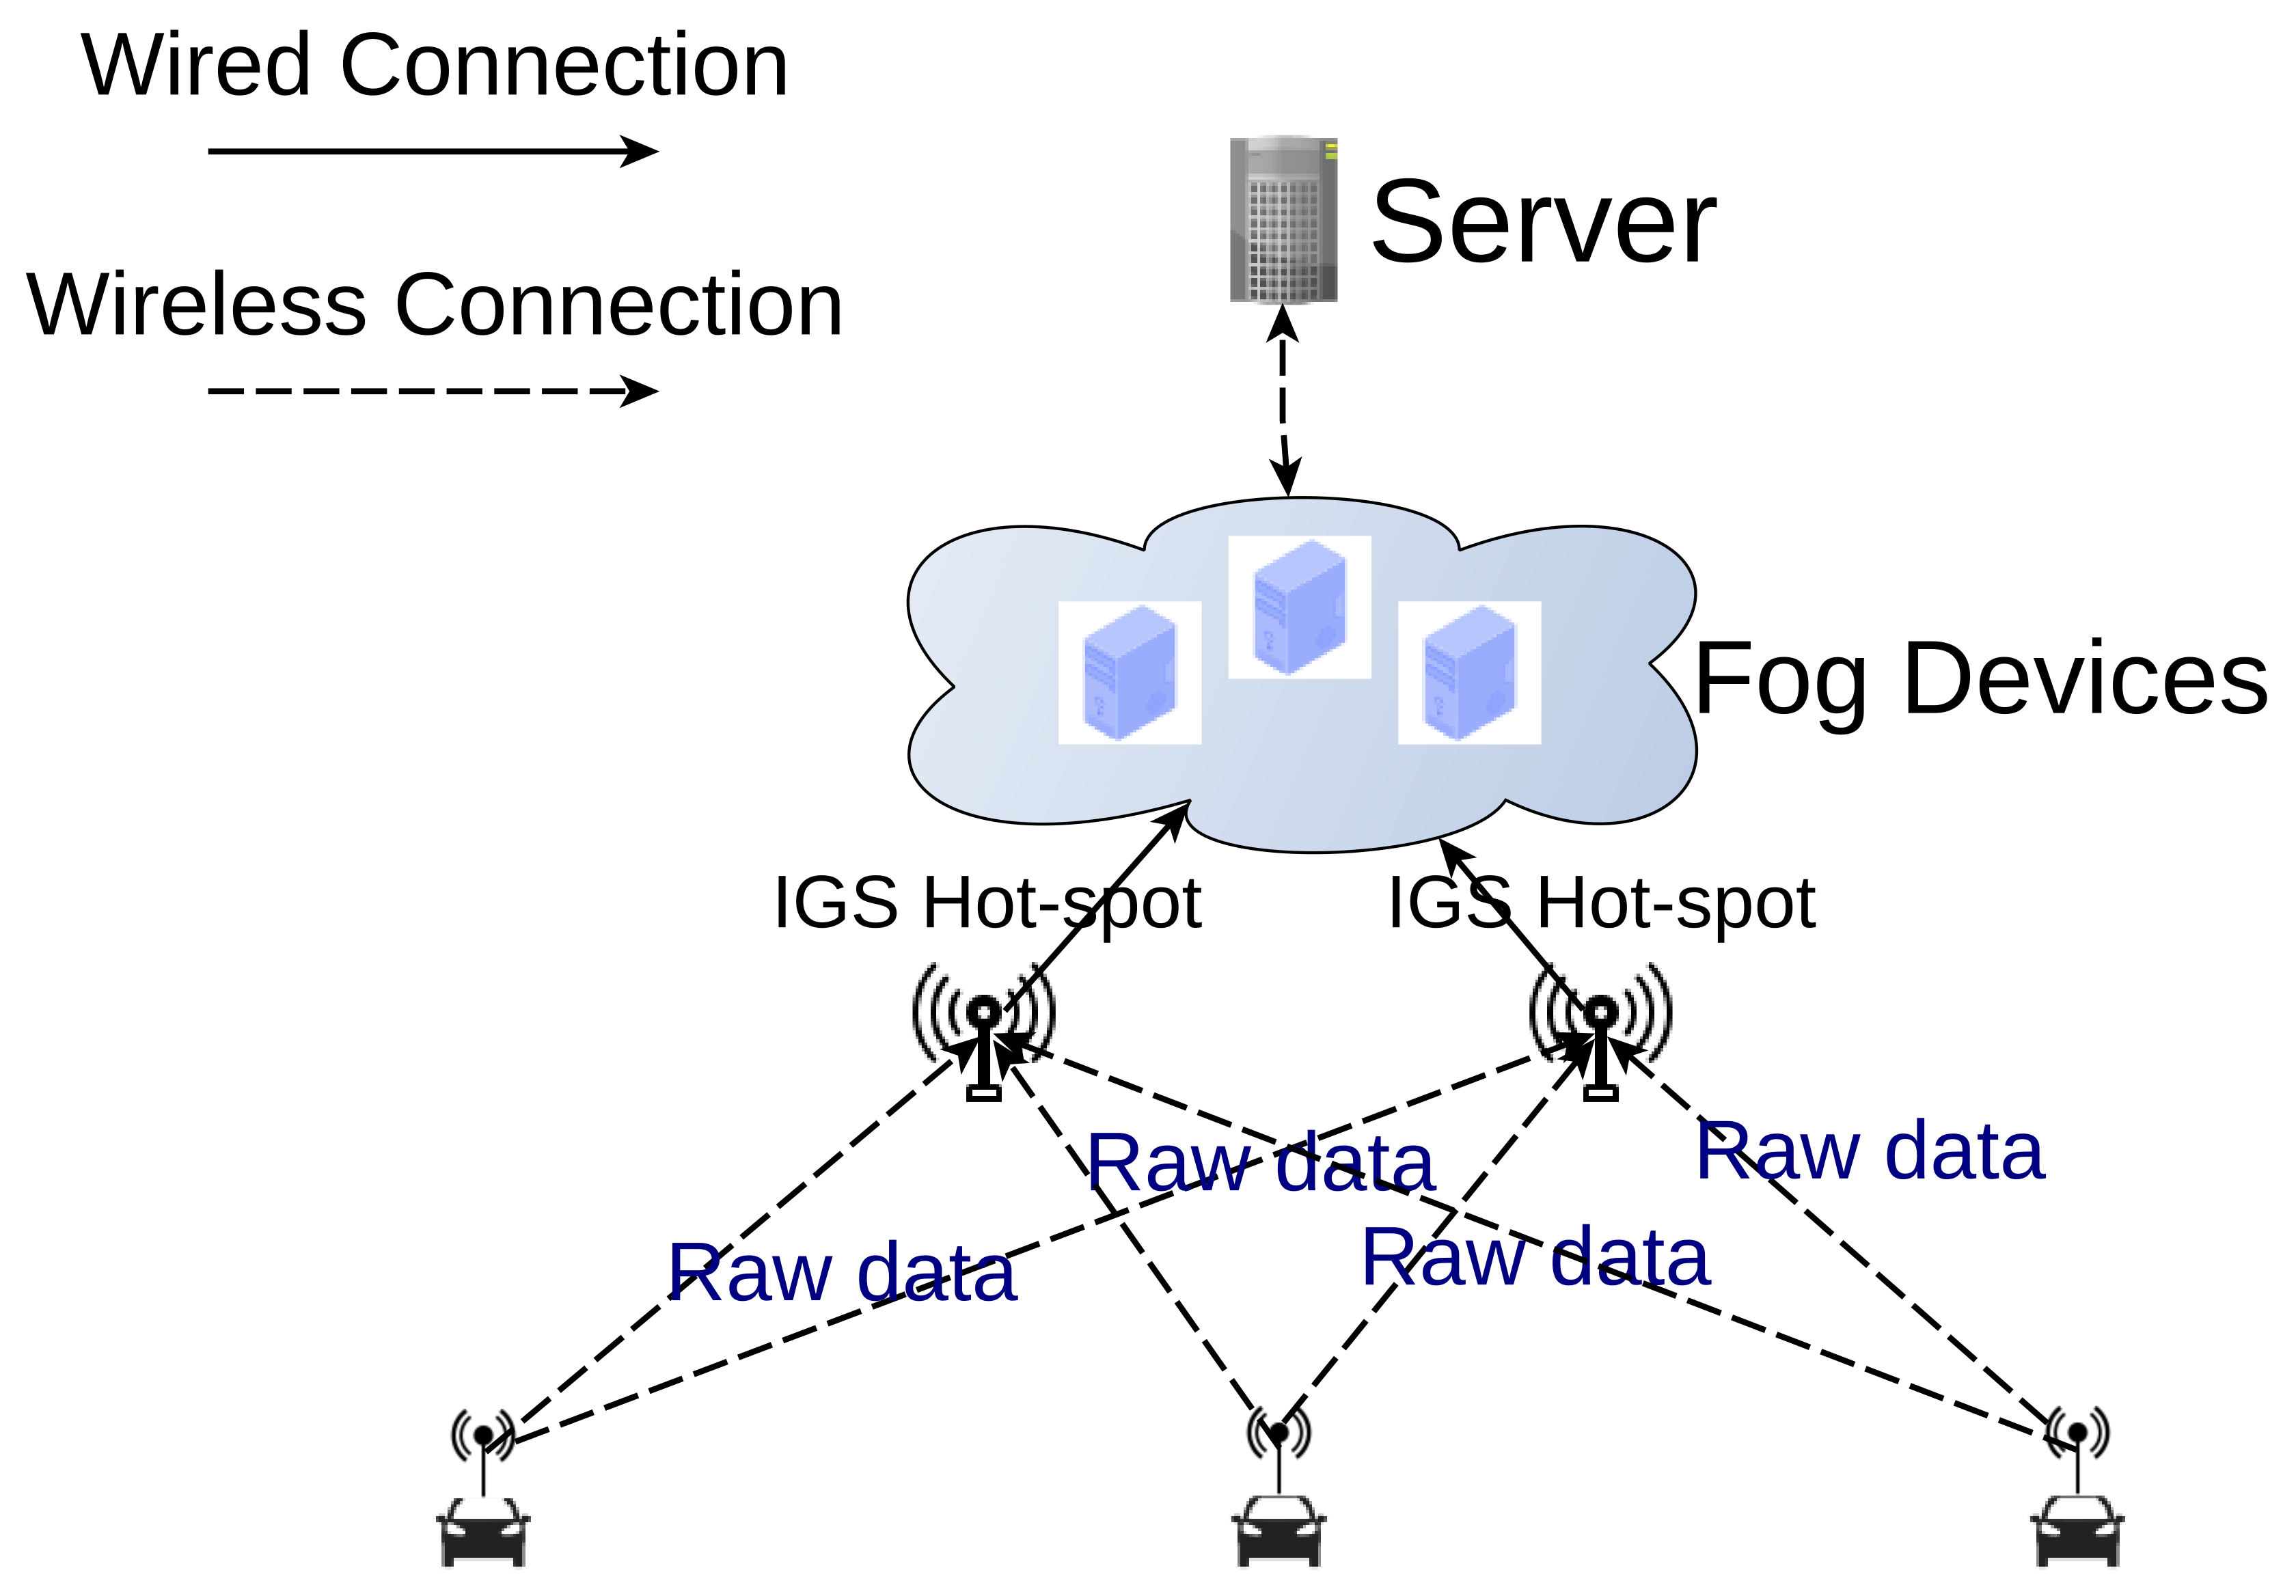
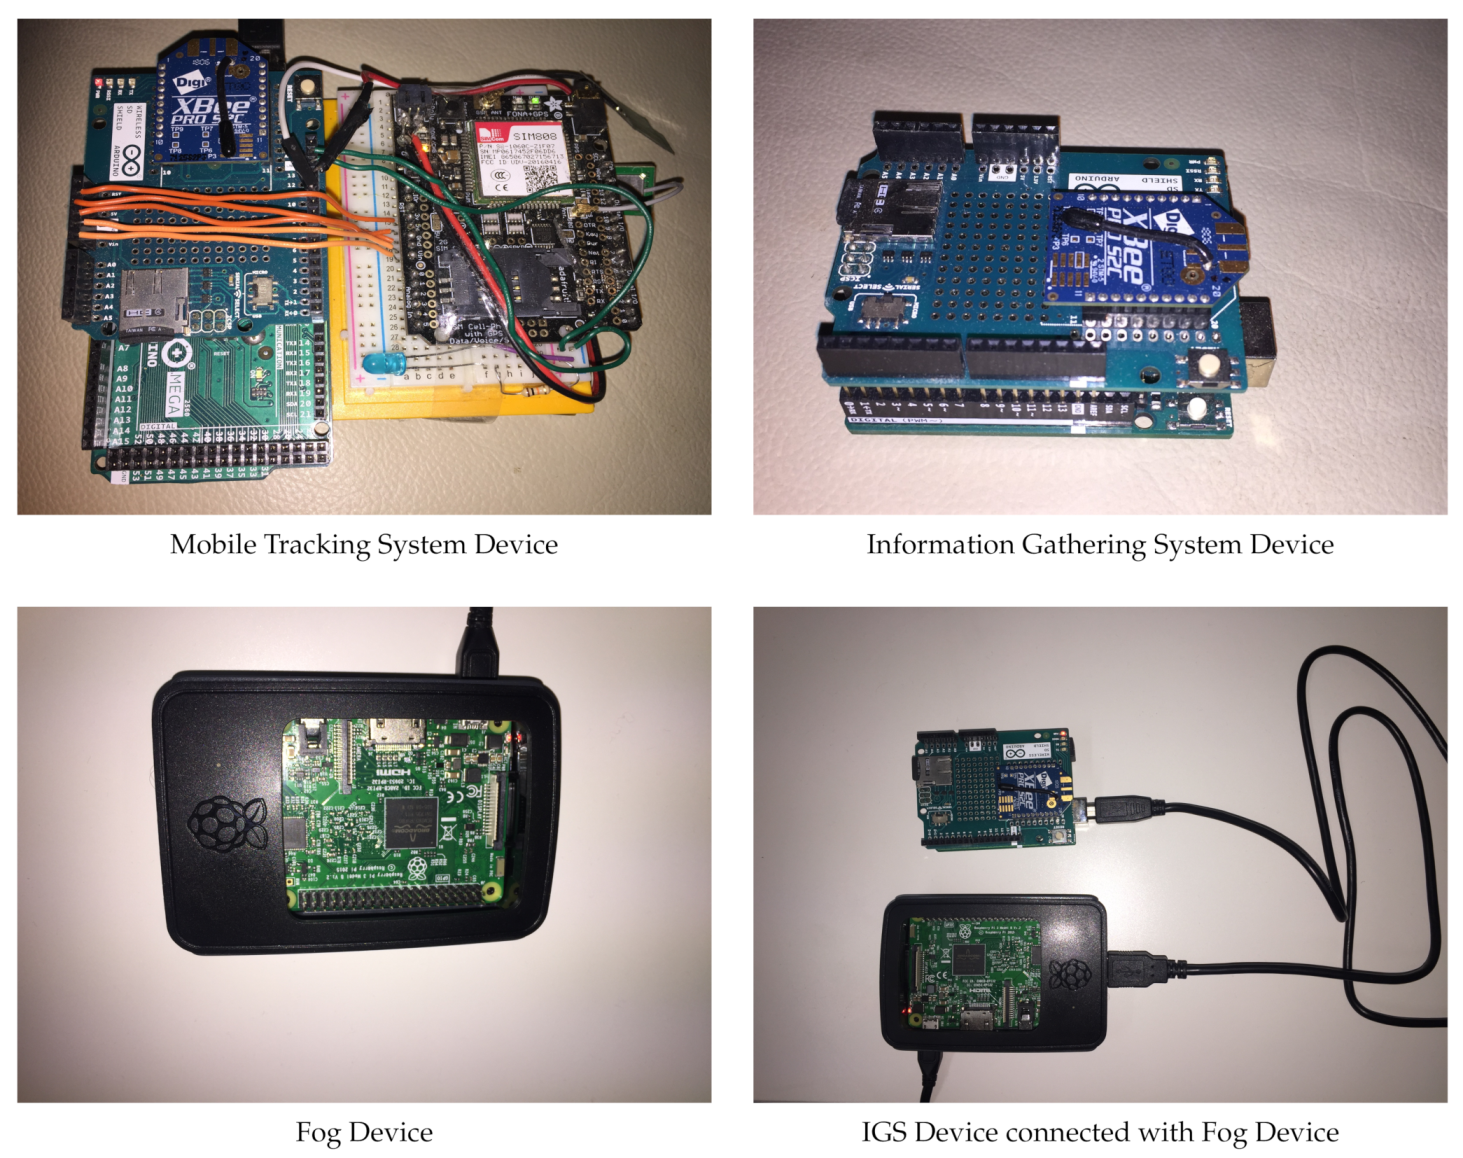
In this study a vehicle tracking approach is developed in order to be a scalable low-cost solution. The presented vehicle tracking system (VTS) consists of low-cost modern prototyping platforms and hardware which compose its three-tier architecture. The three-tier architecture of the VTS is composed of the mobile tracking system (MTS), the information gathering system (IGS) and the Fog Devices (FD) system as shown in Figure 1 and which are further discussed in the next paragraphs. The hardware used in each system is presented in Figure 2.
3.1. Mobile Tracking System
The Mobile Tracking System (MTS) monitors the road traffic exploiting GPS technologies [36]. The MTS devices are attached to vehicles and are responsible for the vehicle movement surveillance and monitoring. The data gathered by the MTS devices is afterwards sent to the IGS hot-spots and then collected and processed into useful information by the FDs.
Every MTS device consists of a GPS module that collects the geographical position of the vehicle, a computing platform which controls the system, a storage unit where the raw data is stored and a RF module which allows the presented systems to inter-operate. As a result, these devices can monitor the movement of a vehicle without the assistance of any third-party dependencies. The GPS module used in the system is called “FONA 808 Cellular + GPS Shield” [37] and it is constructed by Adafruit. For the control of the system’s components the computing prototyping platform Arduino Mega 2560 [38] is used. Placed on the Arduino Mega 2560 is a micro-SD Shield [39] equipped with a SD Card, where all the raw data is stored, and a Xbee RF Radio Module [40], used as a communications module. The Xbee radio module [41] is a RF module based on the IEEE 802.15.4-2003 standard and it is suitable for point-to-point over-the-air communication. It’s design makes it energy efficient, which in turn makes it appropriate for the MTS. The configuration of the module is also easier compared to other RF modules since it has its own configuration platform (XCTU). The GPS module is connected to this prototyping platform (PP) through jumper cables that connect the I/O(input/output) pins of the Arduino board to the I/O pins of the GPS module.
3.2. Information Gathering System
Since the MTS devices have a limited storage, data offloading hot-spots have to be established. Therefore the IGS devices where deployed. The IGS devices are broadly scattered throughout the town and their main purpose is to gather all the raw data collected by the MTS devices and to save it in a proper format for the FDs to access and process.
Every IGS device consists of a computing platform which controls the system, a storage unit, where the raw data gathered by the MTS devices is stored, and a RF module which allows these devices to communicate with the MTS devices. The computing prototyping platform Arduino Uno is used in this system to control its components, similarly to the MTS. Placed on the Arduino Uno [42] board is a SD Shield equipped with a SD Card, where all the raw data is stored, and a Xbee RF Radio Module, used as a communications module. Since the outdoor range of the Xbee antenna is 140 m on a line of sight, the IGS devices are responsible for handling cases of failed communication. For different and large scale applications, more expensive modules with longer range can be used, but the presented work focuses on an inexpensive deployment and the Xbee RF module is considered a low cost radio module.
3.3. Fog Devices
All the raw data gathered by every hot-spot is retrieved by single-board computers that are being used as FDs. Raspberry Pi 3 [43] computers are used as FDs in this work. The FDs process the data retrieved by the hot-spots and upload the extracted information along with the raw data on a Server so that they can be later remotely accessed and reused by the other users. Every FD is connected to an IGS device through a cable and consequently they can establish a communication through a serial port.
4. System Functionality Approach
The VTS proposed in present work relies on a plethora of software components to collect the data and process it. Every software component is specifically designed for each system described in Section 3 and each one executes multiple processes such as data collection, communication and data processing. In this section, the term “record” implies a set of data collected from the GPS module at a specific time which contains the coordinates (longitude and latitude) of the vehicle along with a timestamp which indicates the time the data was captured.
4.1. Data Collection Approach
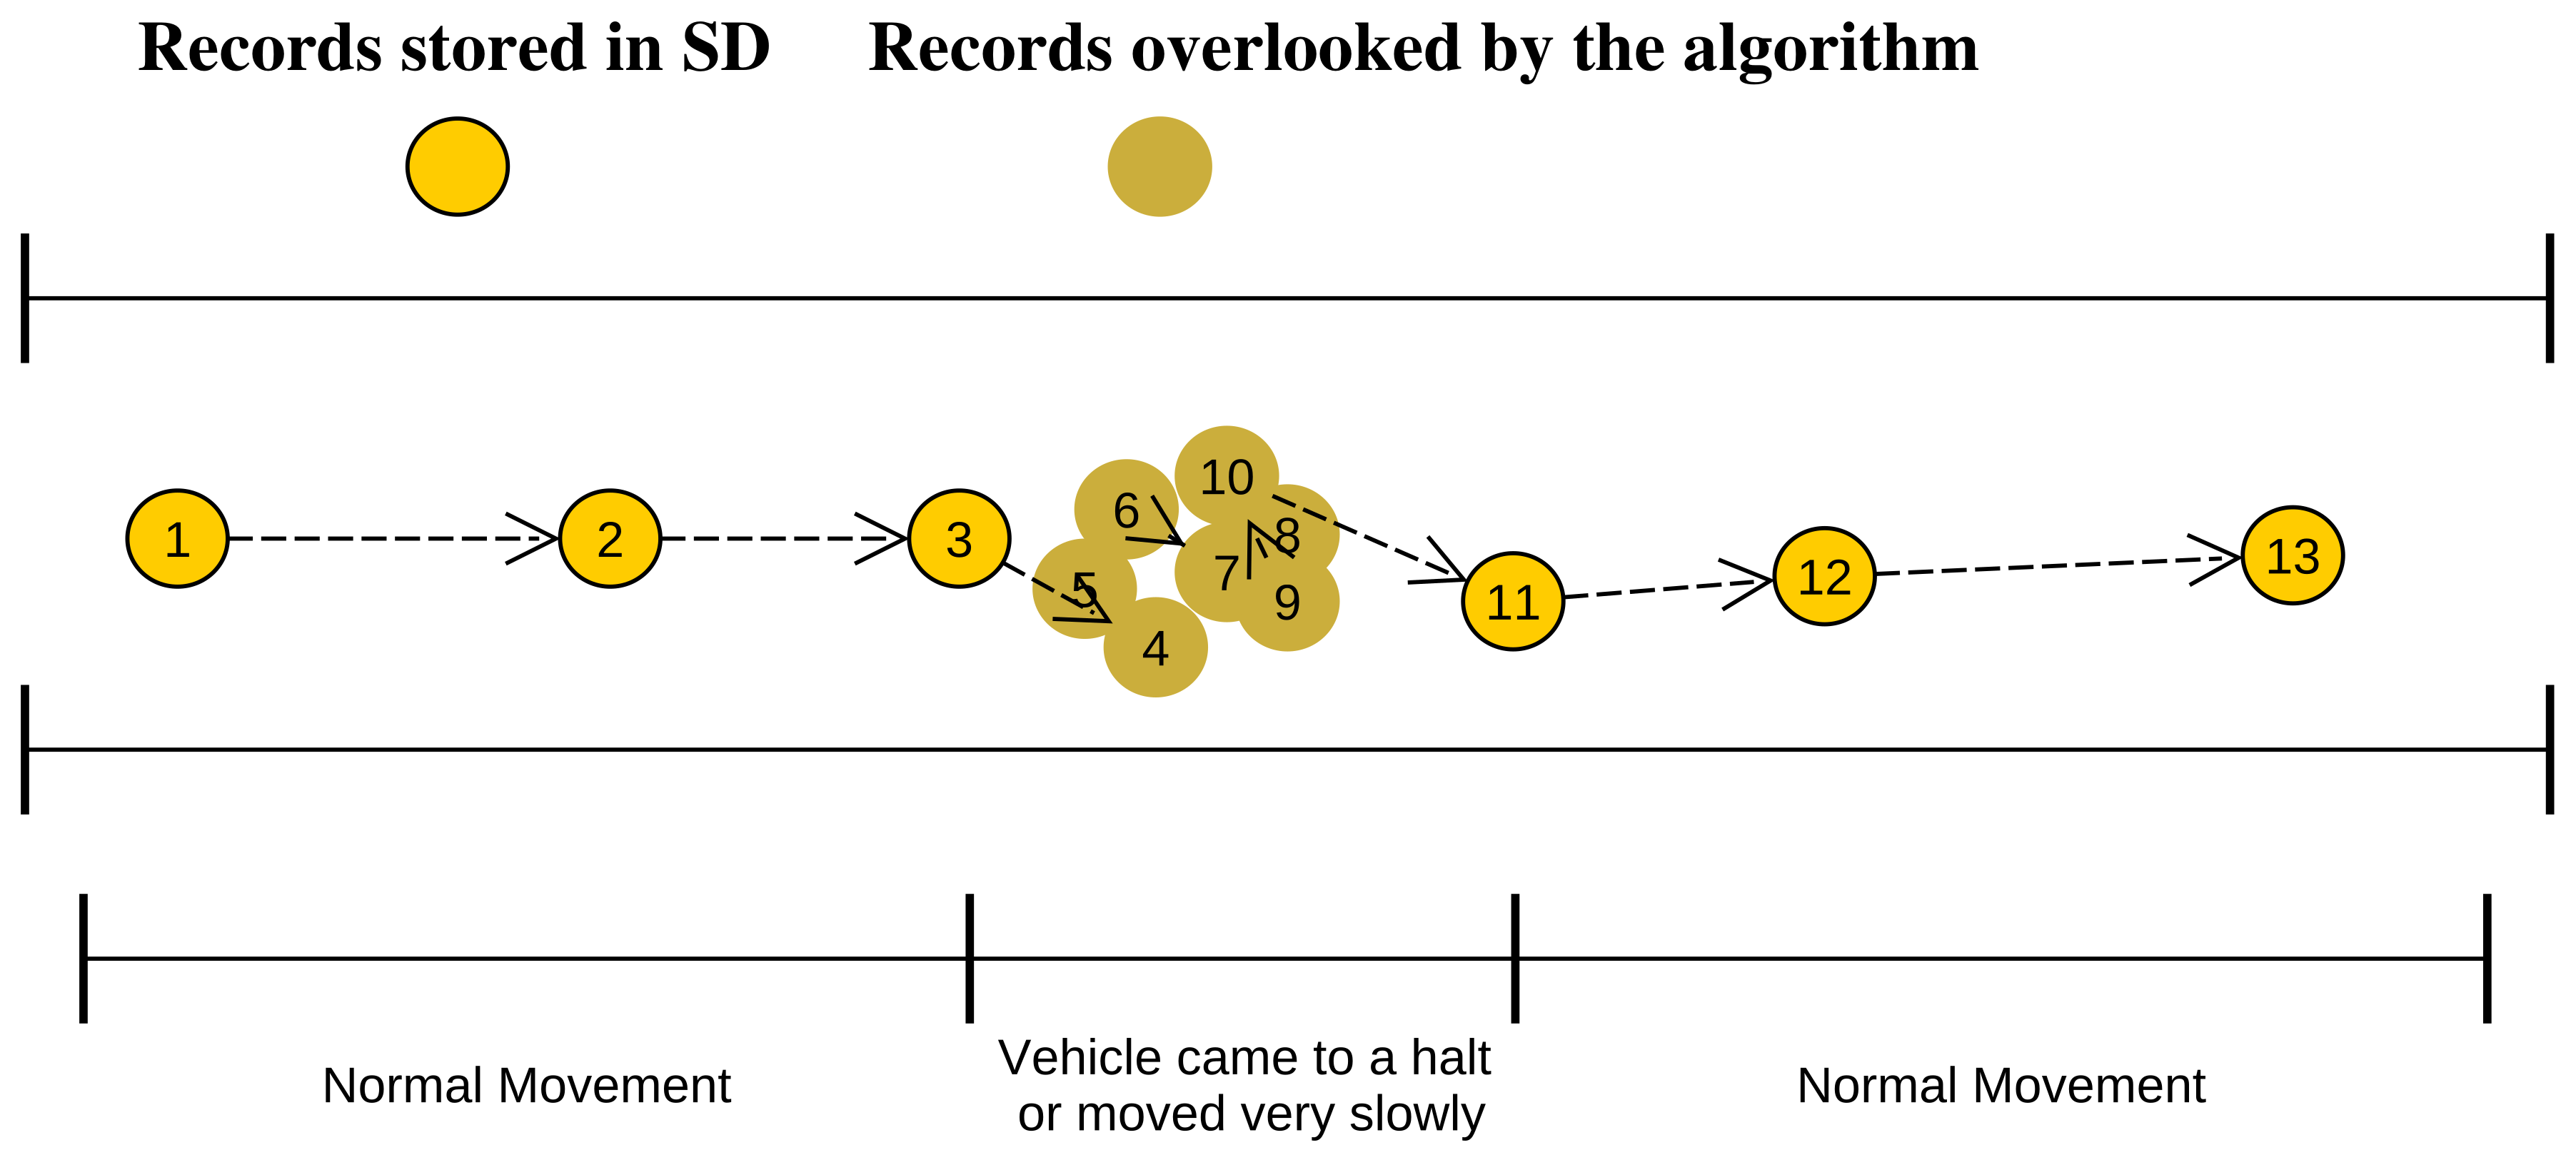
As mentioned above, the GPS antenna collects data over a particular interval of time (during the testing period it is observed that for = 1 record/sec the data is adequate - it is important not to have scarce records over one second apart in order to be able to extract reliable information). On the other hand the data collected by every MTS daily is of considerable size (approximately 86,400 records). As a result data reduction techniques can be applied to remove any records that do not provide any useful information and also reduce the number of the records stored in the SD. In this context two data reduction techniques are proposed. One is applied when the vehicle comes to a halt for a certain period and the other is applied when the vehicle is moving on a straight course.
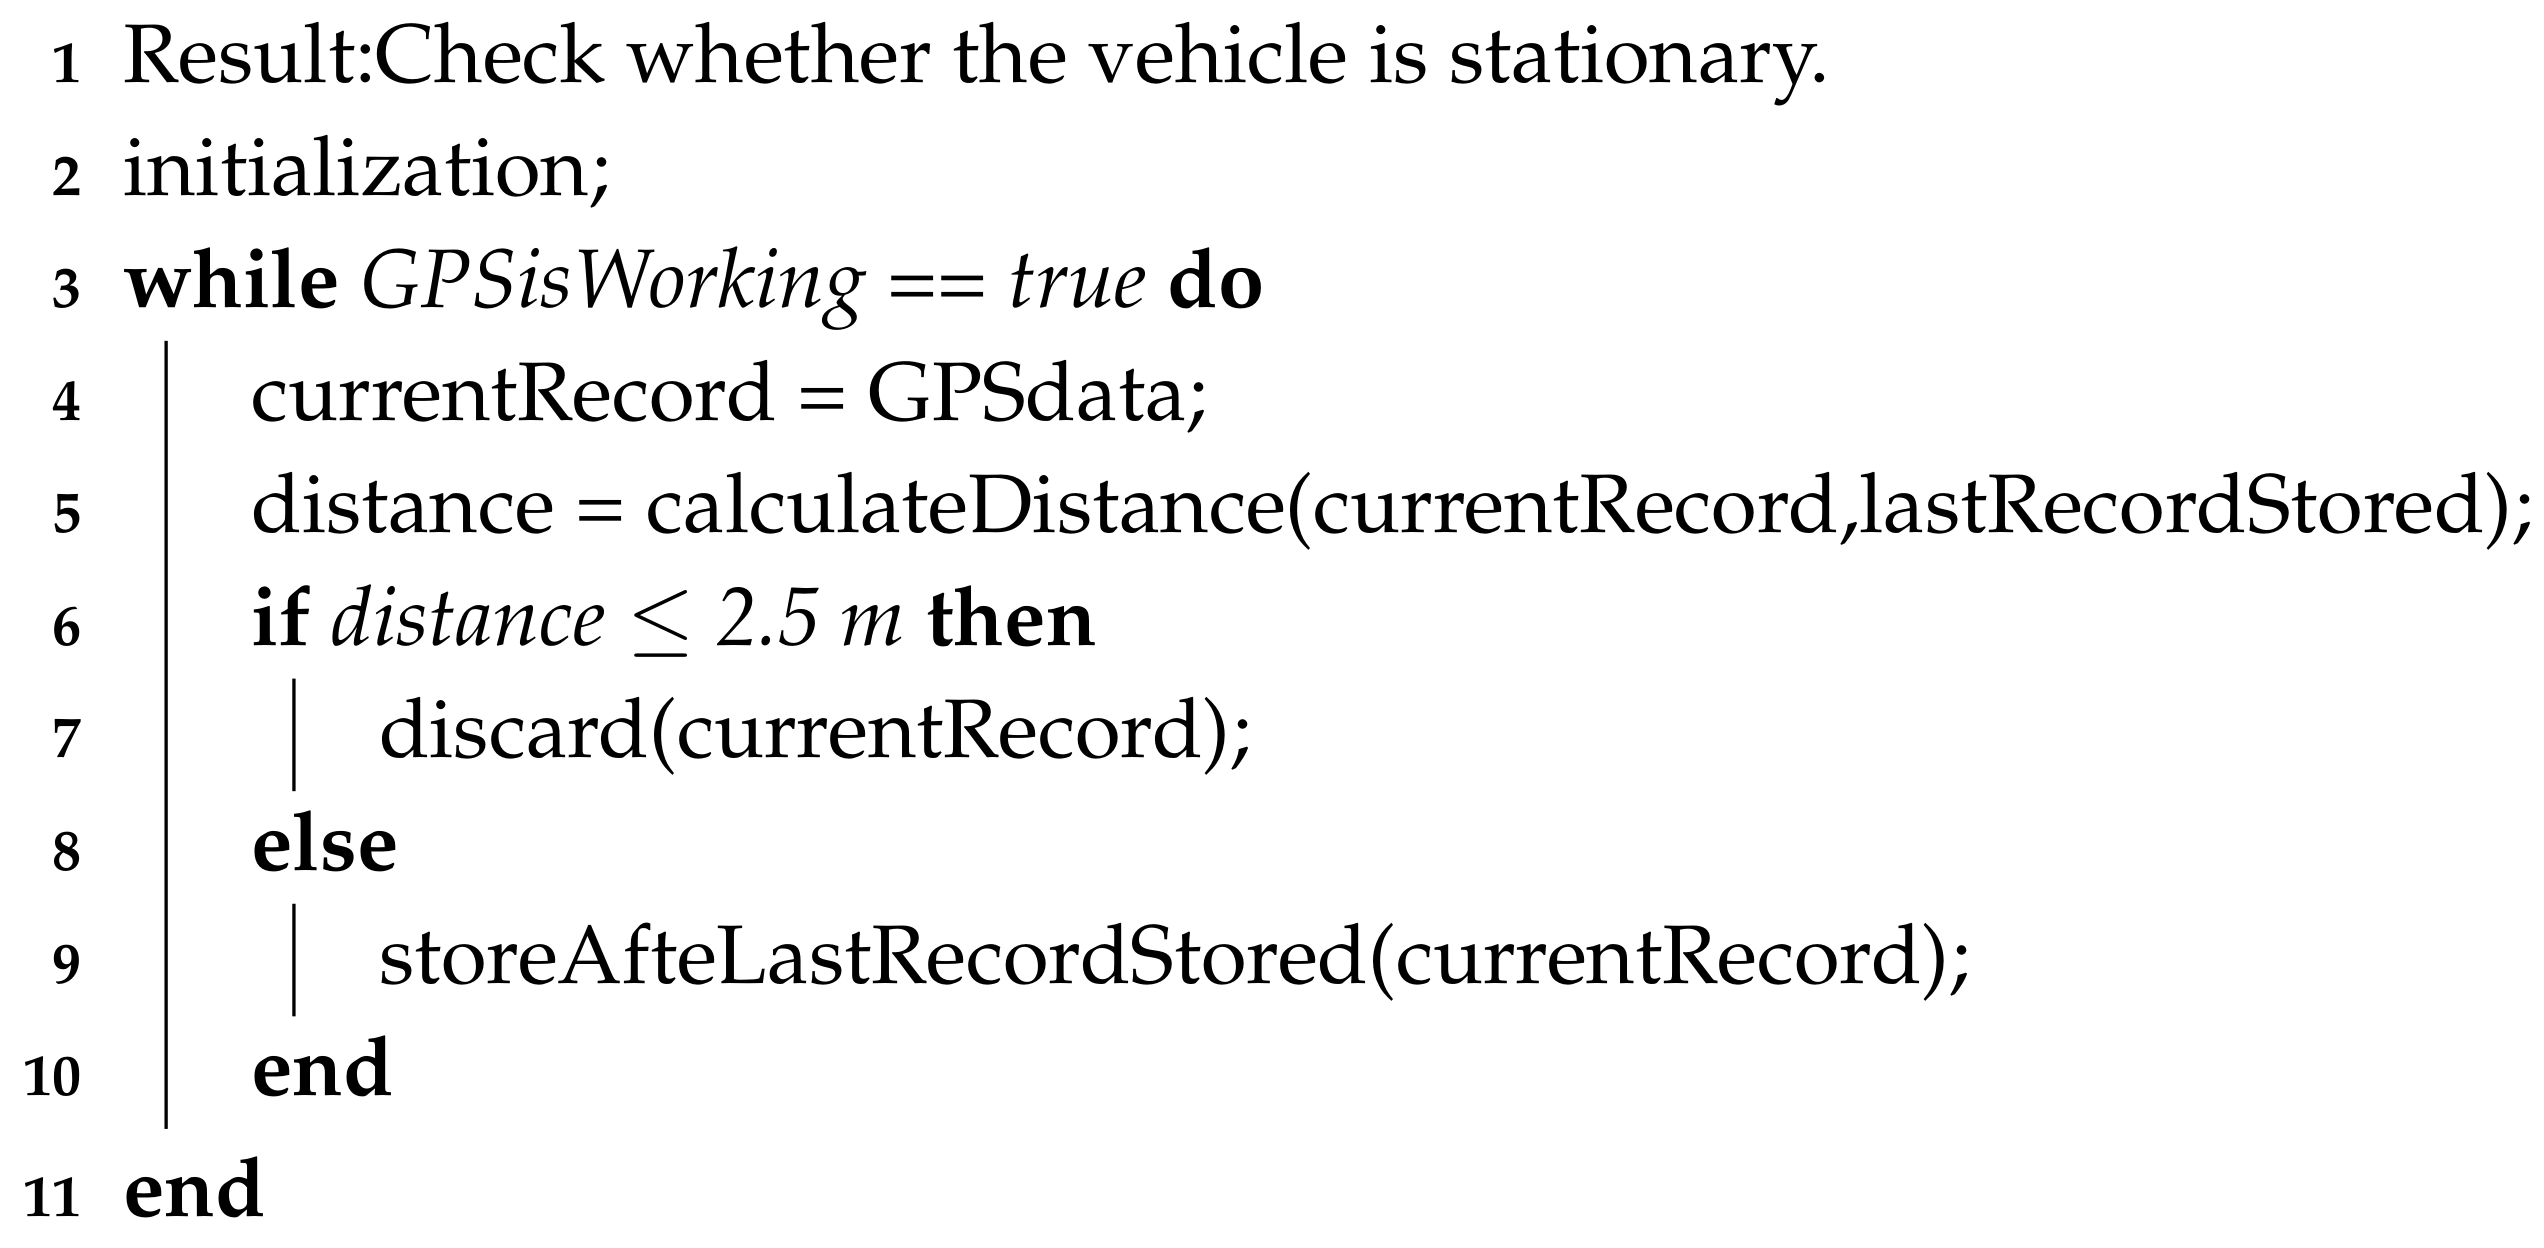
For the first data reduction technique, the system calculates the general traversal of the vehicle based on the last two recorded records. The system assumes that the vehicle has come to a stop when the distance d between these records is less than a specific threshold (the threshold in the presented system is set to m due to the inaccuracy of the hardware used ). The distance is calculated as which indicates the distance between the vehicle’s current position and its previous position . When the calculated distance is less than the defined threshold, the system discards the last record it collected. This comparison is executed repeatedly until the vehicle starts moving again. At the end of this process the system has kept only the first and the last record recorded on that spot. This data reduction technique is presented graphically in Figure 3 and the algorithm of this technique is presented in Algorithm 1.
| Algorithm 1: Data Reduction Algorithm 1 |
 |
As mentioned above, the second data reduction technique is applied when the vehicle is moving on a straight course. To do that, the system checks whether the vehicle’s direction changes. More specifically the system calculates the turning angle using this formula:
where is the angle and are the vectors created by the last three recorded positions , , using these formulas
and
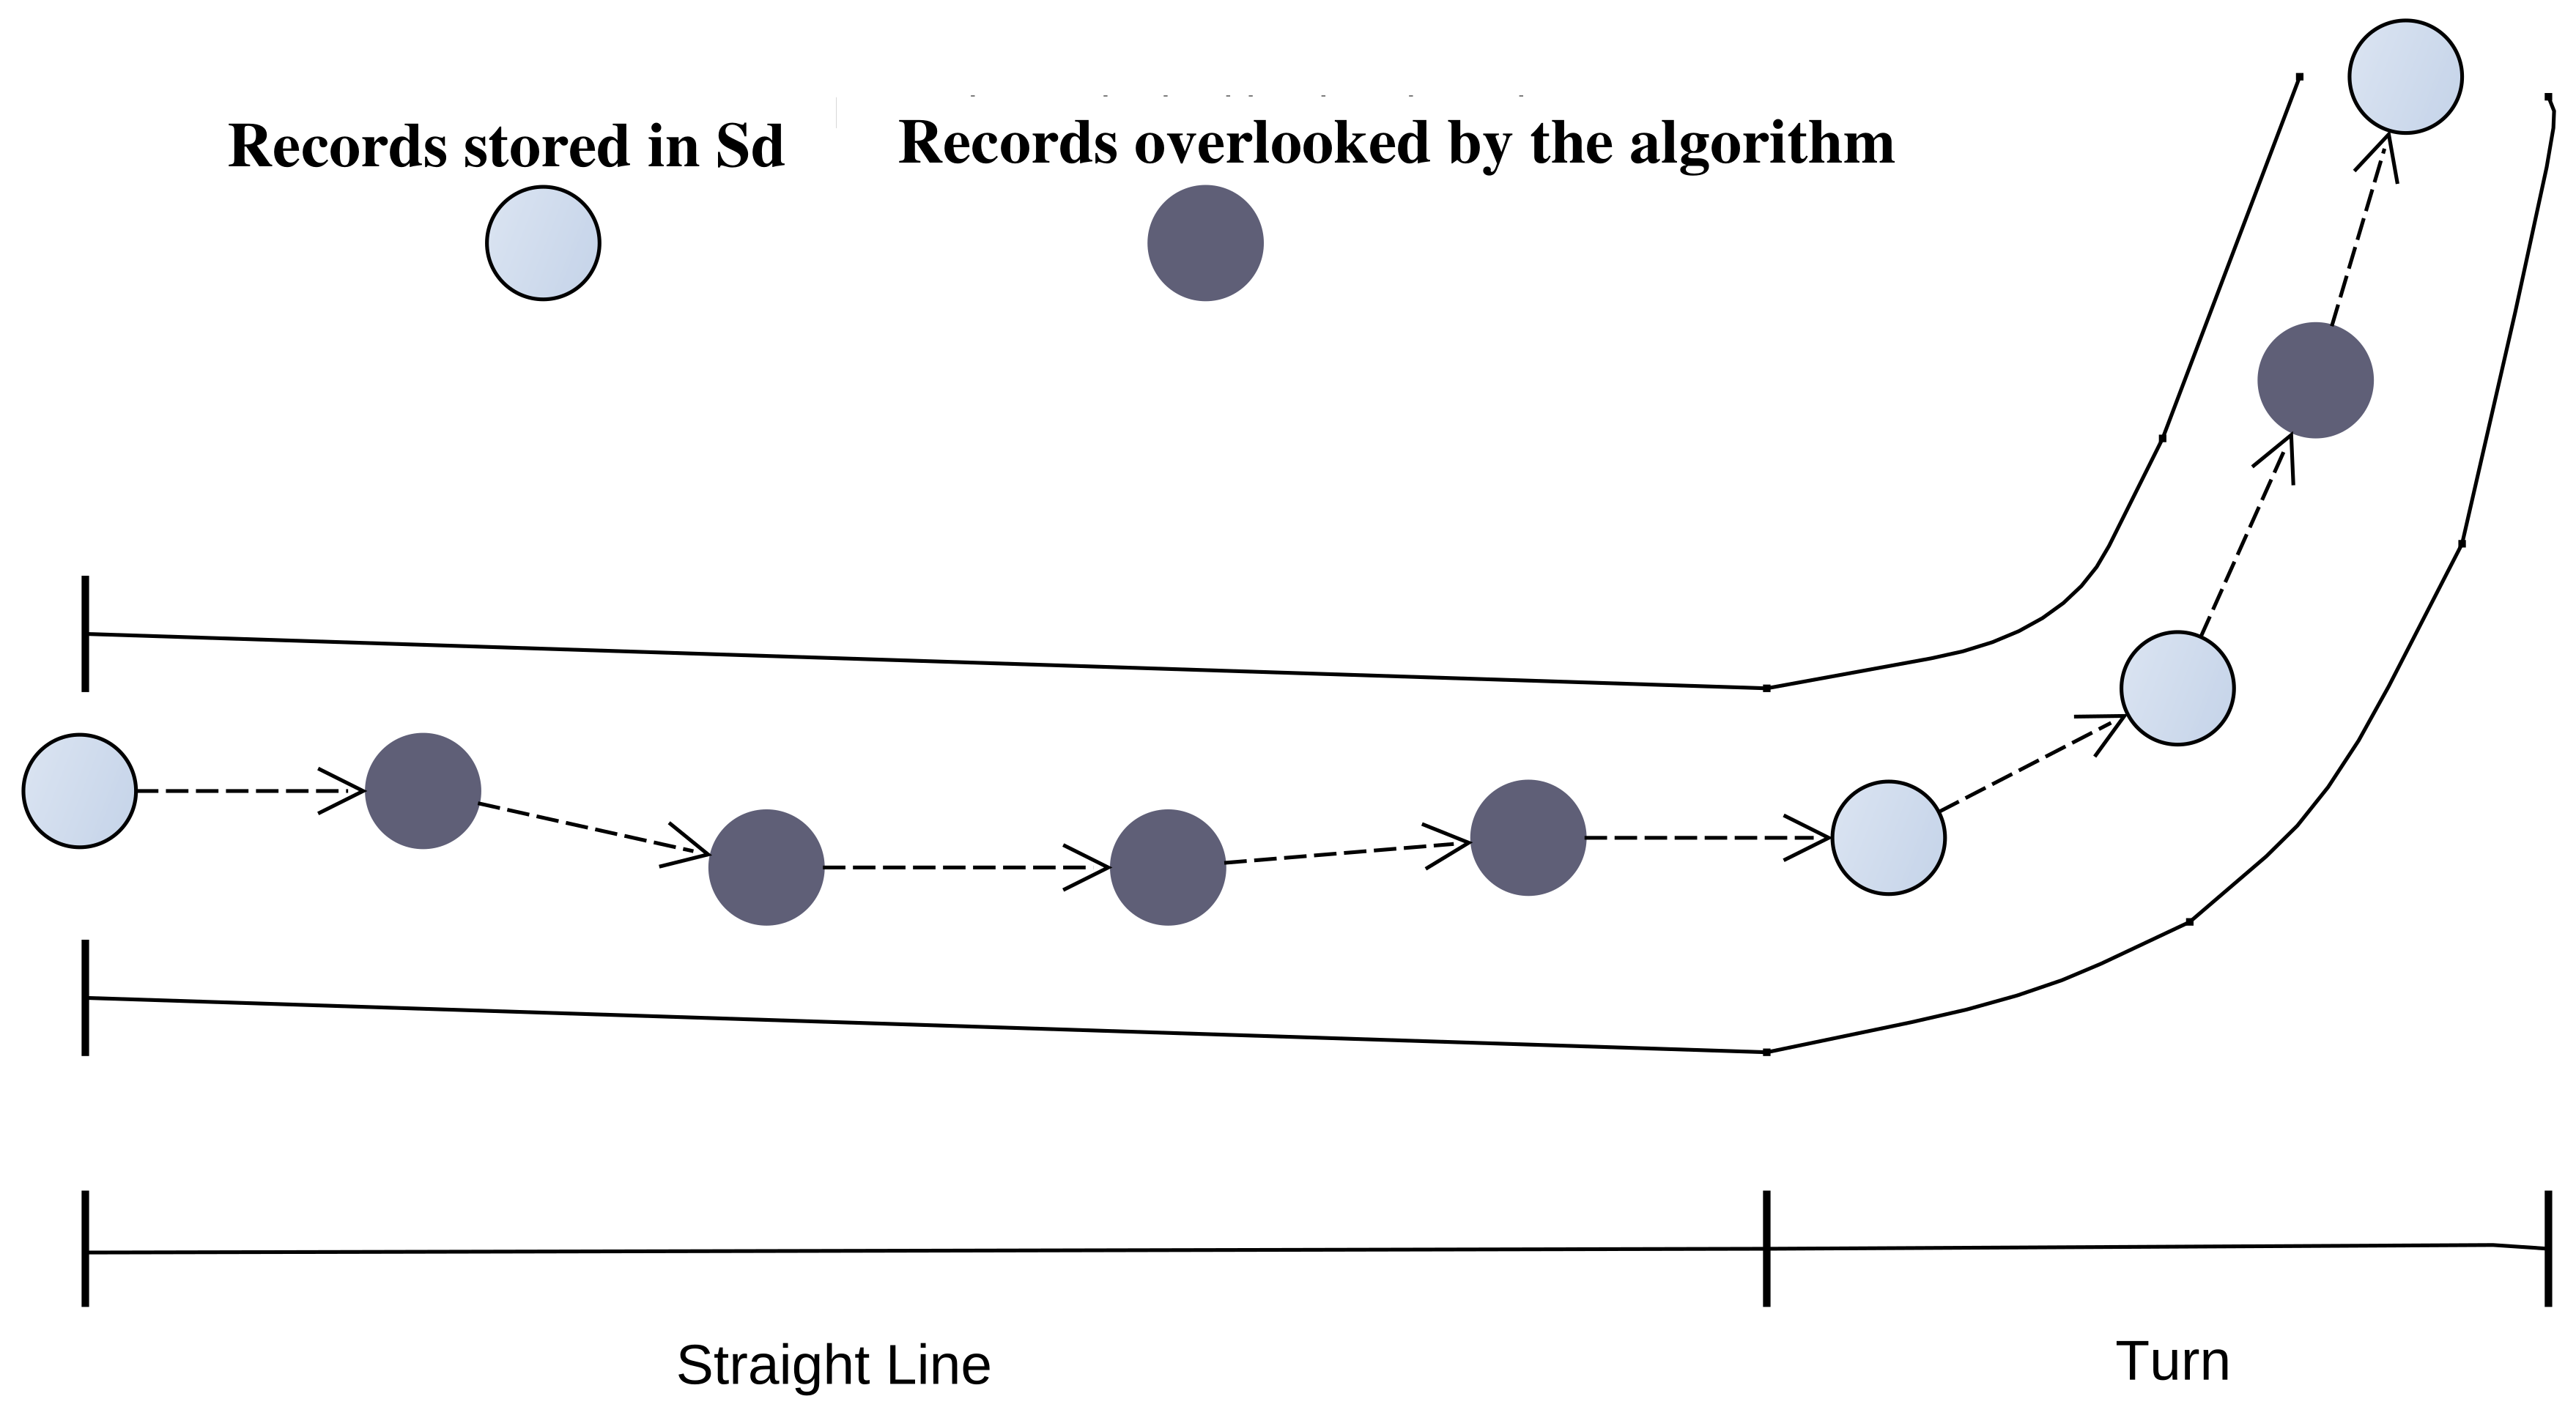
The turning threshold is set to 20, by taking into consideration the antenna’s inaccuracy, the road network particularities where current work is validated. When the angle is less than the threshold the system discards the second position and stores the other two. This process is executed repeatedly and eventually the system stores only two records for that straight course, the first and the last record gathered on that course. A graphical representation of this process is presented in Figure 4 and the algorithm of this technique is presented in Algorithm 2.
| Algorithm 2: Data Reduction Algorithm 2 |
 |
Based on a small test carried out, during a period of four days, the system collected approximately 20,000 records which means that almost 95% of the initial records were discarded.
4.2. Subsystems’ Communication
All the information collected by the MTS devices must be gathered by the system in order to be processed. Therefore the MTS devices communicate with the IGS devices to offload the data collected. All that data is afterwards retrieved by the FDs for processing. In this section the communication will be described from each subsystem’s perspective. For the rest of this paper, the term frame indicates a packet created by the MTS device which contains the address of the device, a set of data and the size of the data.
When an IGS device is powered on, it starts seeking for other devices to communicate with, repeatedly, until it gets a response. When a MTS device is close enough for the IGS device to spot, the IGS device sends a request for communication. If the IGS device spots more than one MTS devices within its range it stores their addresses in an array and it sends a communication request to them, one at a time (the IGS device will not send a communication request to another device unless the communication with the previous one is finished). Once a communication has been established then the data gathering procedure begins. The IGS device awaits for a frame of data from the MTS device. Once it receives a frame it extracts and stores the data. When all the data is stored successfully, the IGS device sends a request message indicating that it is ready to receive and process the next frame. Once the communication is finished, the IGS device sends a communication request to the next MTS device stored in the array or it starts seeking for MTS devices in its area if there aren’t any other addresses stored in the array.
Once a MTS device receives a communication request it stops collecting records from the GPS and starts sending the data stored in the SD. Since the amount of data gathered in the SD is usually bigger than the size of the packet it can send (each packet can contain up to 84 bytes of data), the system separates the data in smaller data packets and sends each data packet independently (frames). The MTS device sends one frame at a time and awaits for an acknowledgment from the IGS device to send the next frame. That way the buffer of the IGS device will not overflow with frames and every data packet will be stored correctly. The last frame is labeled by the MTS device as “last” so that the IGS device will know that the communication can end. Once the communication is finished successfully, the MTS device deletes all the data stored in the SD and resumes the records collection.
One of the problems encountered during the first tests was the fact that the communication can end abruptly since the MTS devices are mobile. To overcome that the IGS devices will wait for a certain time window after sending the request. That time window allows for communication restoration in case of a connection error. In present study the time window is set to s. The MTS device might be unresponsive when it performs data storage operations (which usually lasts approximately five (5) sec) and this is why the IGS devices wait for that certain time window. The IGS device assumes the MTS device is inoperative or out of range and moves on to the next MTS device if it doesn’t receive a message in that time window.
A similar process is executed by the MTS device with the only difference that the time window is much smaller ( s) since the IGS device doesn’t execute other processes while waiting for the next frame. If the MTS device doesn’t get a response, it assumes the communication ended abruptly and it resumes collecting GPS records without deleting the data stored in the SD. The MTS device keeps track of the last successfully transmitted record, in order to resume the data transmission from that record when a communication with an IGS device is established again.
In every offloading hot-spot there is a FD which communicates with an IGS device through a serial port. The FD monitors the serial port of the IGS device and when it spots a new set of data, it stores it. Once the IGS device receives a new data packet the FD captures that data and stores it in a .csv file locally.
4.3. Data Processing Approach
The data stored in every FD is also uploaded on a common directory which can be remotely accessed by the public. Along with the raw data the FDs upload the extracted information on that directory. That data can be used by the local authorities and transport specialists.
Initially each record is given a label describing the location and its characteristics (one-way roads, narrow streets, etc.). The system contains a set with all the areas with distinctive characteristics and their geo-locations. The system is calculating the proximity of the record’s geo-location to those of the areas with distinctive characteristics in order to label it. Once this is done, the system starts the data extraction process by calculating the vehicles movement in that area.
The first element calculated is the speed of the vehicle at every point. Since the data contains only coordinates and not the speed at that point, the system can calculate the average speed of the vehicle by measuring the distance/difference between the two points over the difference between the two timestamps. The mathematical formula used by the system is
By calculating the difference between two records , the system can spot where a data reduction technique was applied or when the GPS module was out of order (e.g., during the communication with an IGS device). When sec then the system operated normally ( = 1 record/s). If Section (30 min) then the system assumes the vehicle was parked and it doesn’t calculate the speed between these two records.
The system compares also the speed of the vehicle, at that point, with the previous speed records stored in that area to estimate the traffic density during that time. All the previously recorded speed records are stored in a .csv file, which the system uses to compare the calculated average speed to the previous records. The system has five (5) categories to describe the state the vehicle was at, Slower than normal, Normal movement, Straight movement for N sec, Car stopped for N sec, Car moved very slow for N sec. The first two states are used for s and the last three states are used for s when a data reduction technique is applied. An example of the extracted information is presented in Table 1. In the present approach the data processing is distributed to many FDs.
The information is saved in a .csv file and then uploaded on the common cloud to be reused and accessed remotely for public use. In present work a common cloud is created in a server using OwnCloud. That cloud is open for the public to access.
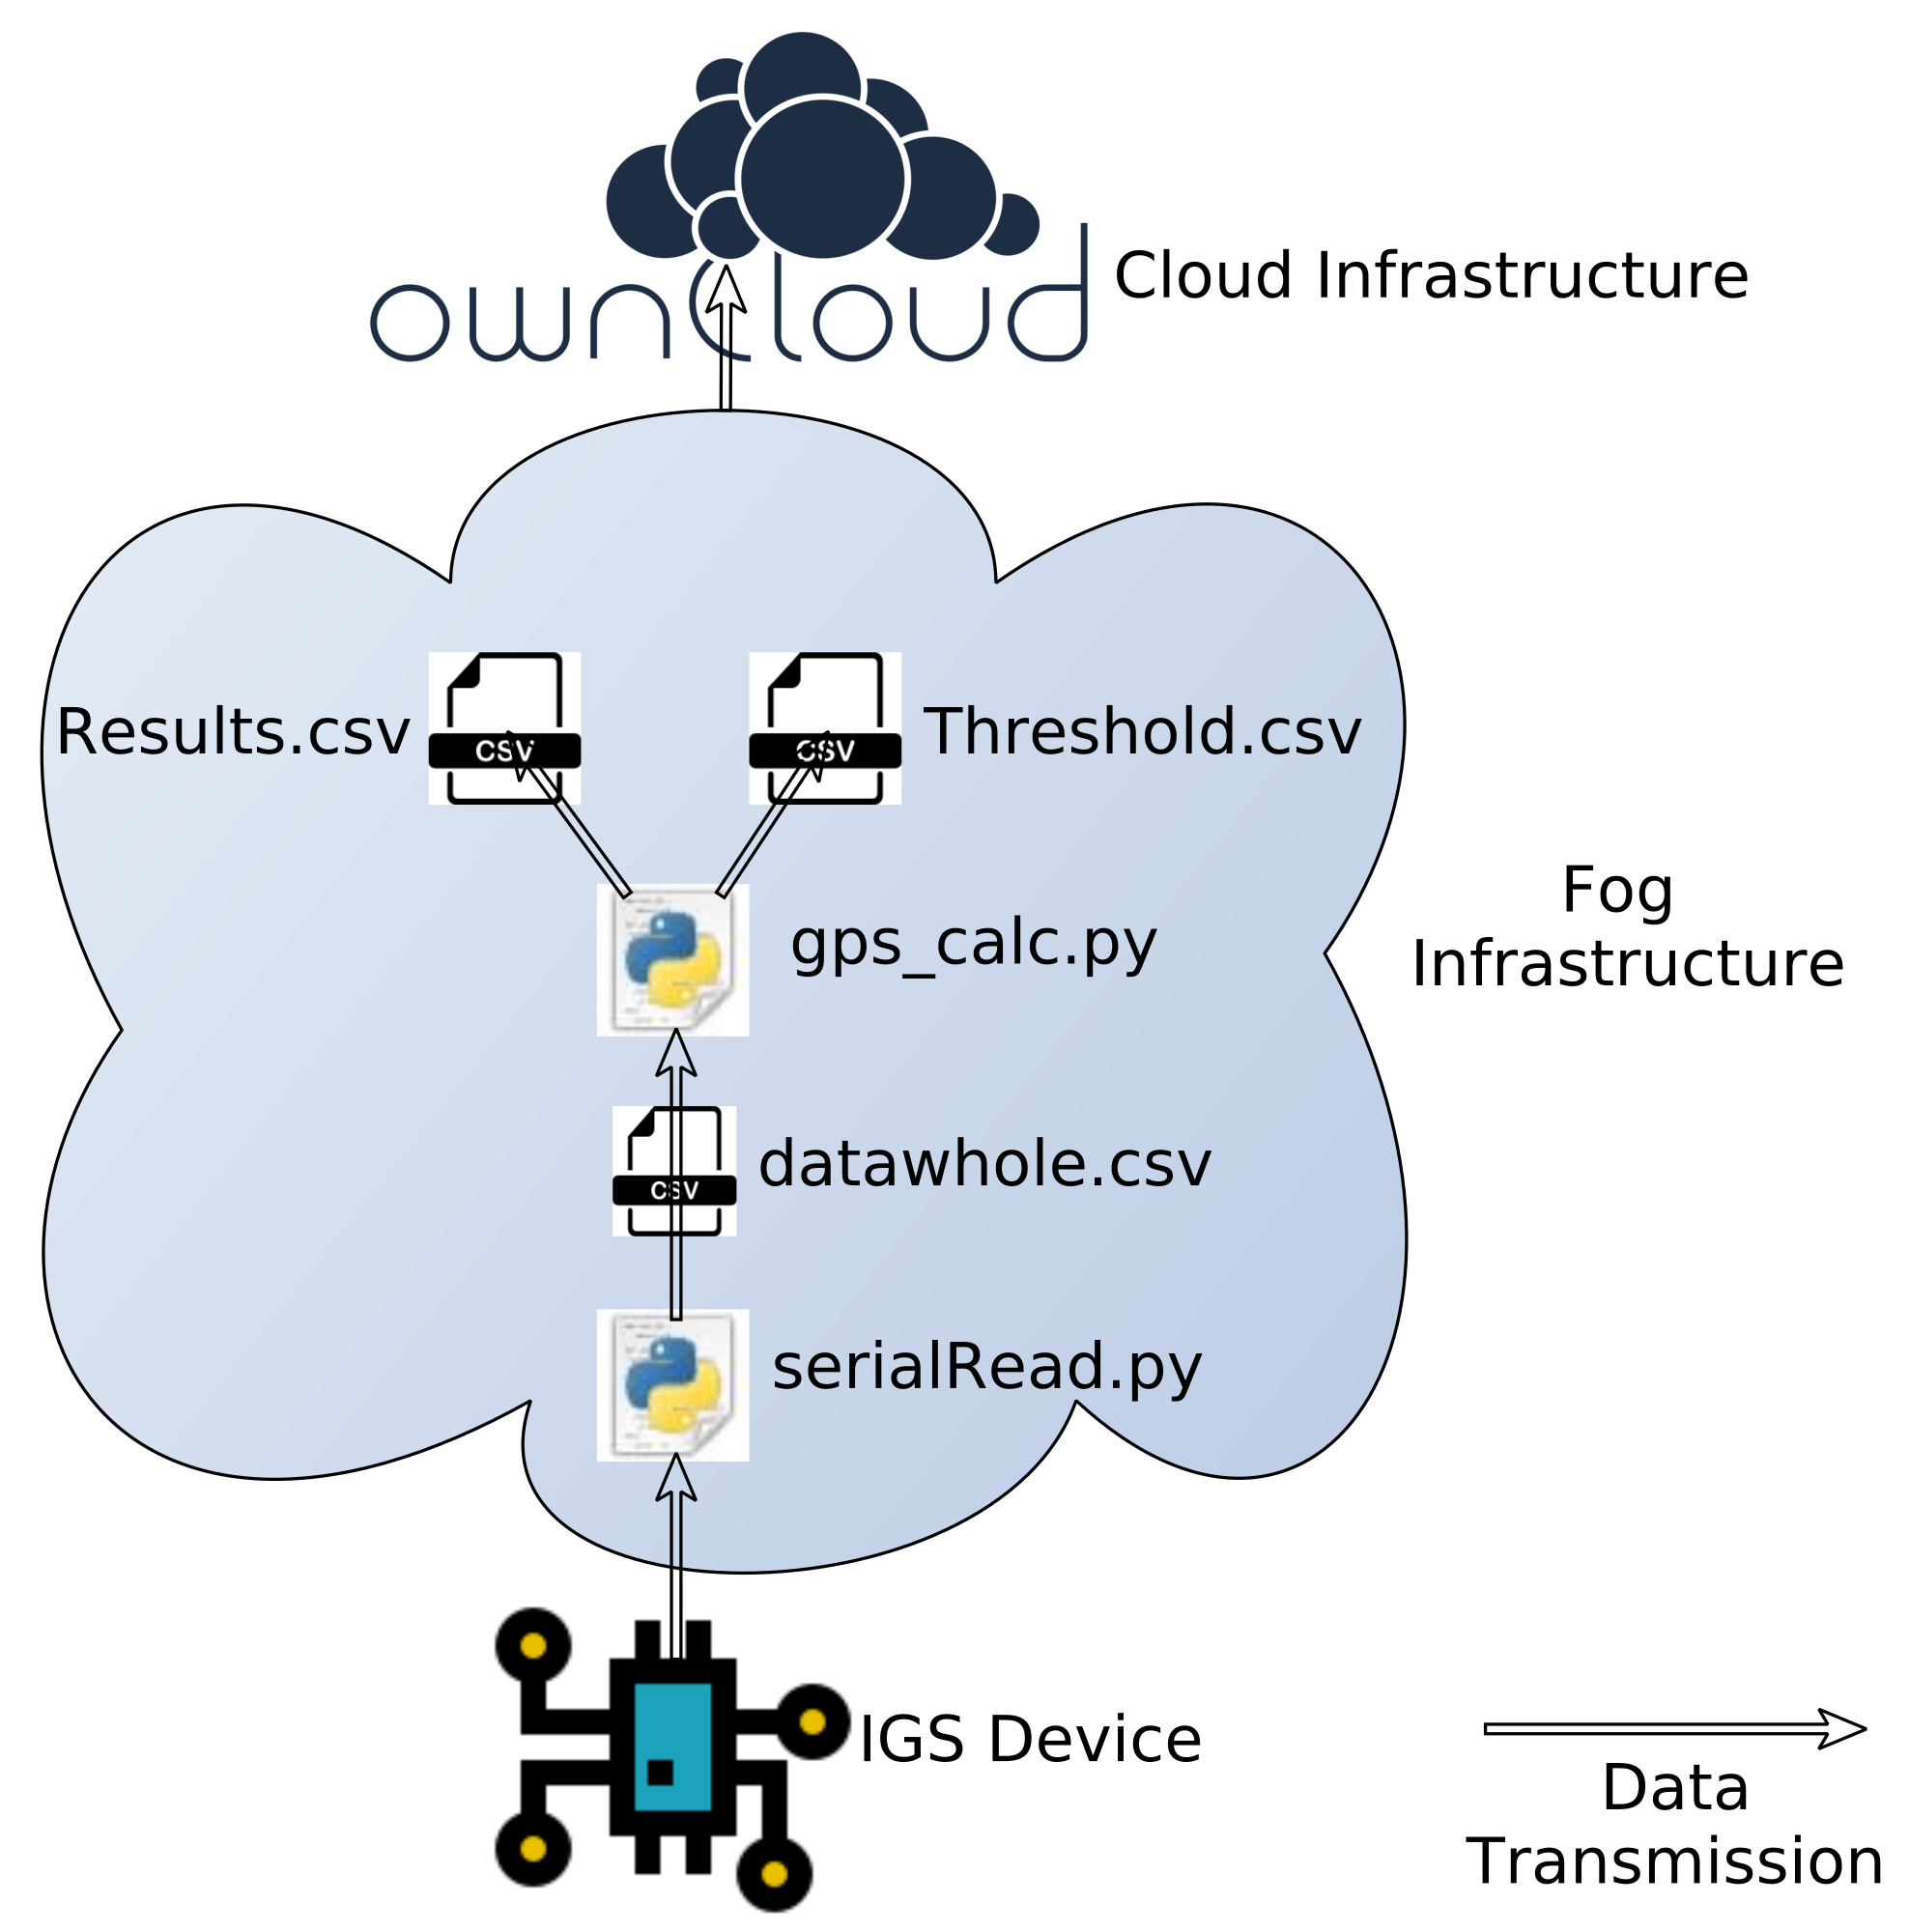
Each FD contains a directory which includes five (5) files in total (i) datawhole.csv, (ii) Threshold.csv, (iii) Results.csv, (iv) serialRead.py, and (v) gps_calc.py just as shown in Figure 5. Each directory synchronizes with the OwnCloud directory to keep the stored records up to date. In other words, the server is now able to merge the information of multiple IGS devices into one file. Apart from the files where the data and the information is stored, each directory includes the scripts used by the FDs to collect the data and extract the information needed. More precisely the file named datawhole.csv contains all the raw data collected by the IGS devices. The file named Threshold.csv includes all the previous speed records which the system uses to compare the calculated average speed and describe the state of the vehicle. All the information extracted by the system is stored in the file named Results.csv. Every FD runs both ’.py’ scripts as presented in Figure 5. The script named serialRead.py monitors the serial communication with the IGS device and stores data during every MTS-IGS communication. The second script is named gps_calc.py and it is responsible for extracting the information needed and saving it in the file named Results.csv.
5. System Tests and Results
In order to test the system’s functionality two taxis are equipped with MTS devices for a total of 30 days in the town of Corfu. Two offloading hot-spots are placed in the center of the town. Each one is placed close to a taxi station since most taxis drive frequently through the taxi stations and occasionally spend some time in the taxi rank. Therefore that time can be utilized to offload some of the data collected.
5.1. Data Collection
For the data collection of the presented tests the period from the end of July until the end of August is selected due to the increased work load of the taxis and the increased traffic load of the road network. During this period the system creates a record of the vehicles’ movement around the town during most of the hours of each day as the taxis used in the experimental runs, operate for approximately 16 hours every day during that period and they have 30 transfers on average per day.
During this period the system collected approximately 70.000 records in Corfu. From this period, 14 days are selected in order to check the system’s effectiveness. These 14 days are selected based on the plurality of the taxis transfers in the center of the town, as days with very few records are not considered sufficient to represent the traffic flow and thus are discarded. For each one of the selected days, the professional drivers are given a form to fill at the end of the day, in which they have to give their own estimation of the traffic they encounter during different time periods. The drivers’ input is used to cross-validate the accuracy the data provided by the considered system. Specifically each form is separated in two sections and the drivers have to choose between three answers (Light Traffic, Normal Traffic, Dense Traffic):
- Traffic Evaluation Throughout the Day
- Traffic Evaluation During Different Time Periods
- —
- Morning (02:00–08:00)
- —
- Noon (08:00–14:00)
- —
- Afternoon (14:00–20:00)
- —
- Night (20:00–02:00)
These forms are used to check whether the speed recorded, represents the drivers’ input.
5.2. Results Analysis
The collected data for the selected period are analyzed to calculate the speed of the vehicles and to estimate the traffic load in comparison with the input provided by the professional drivers.
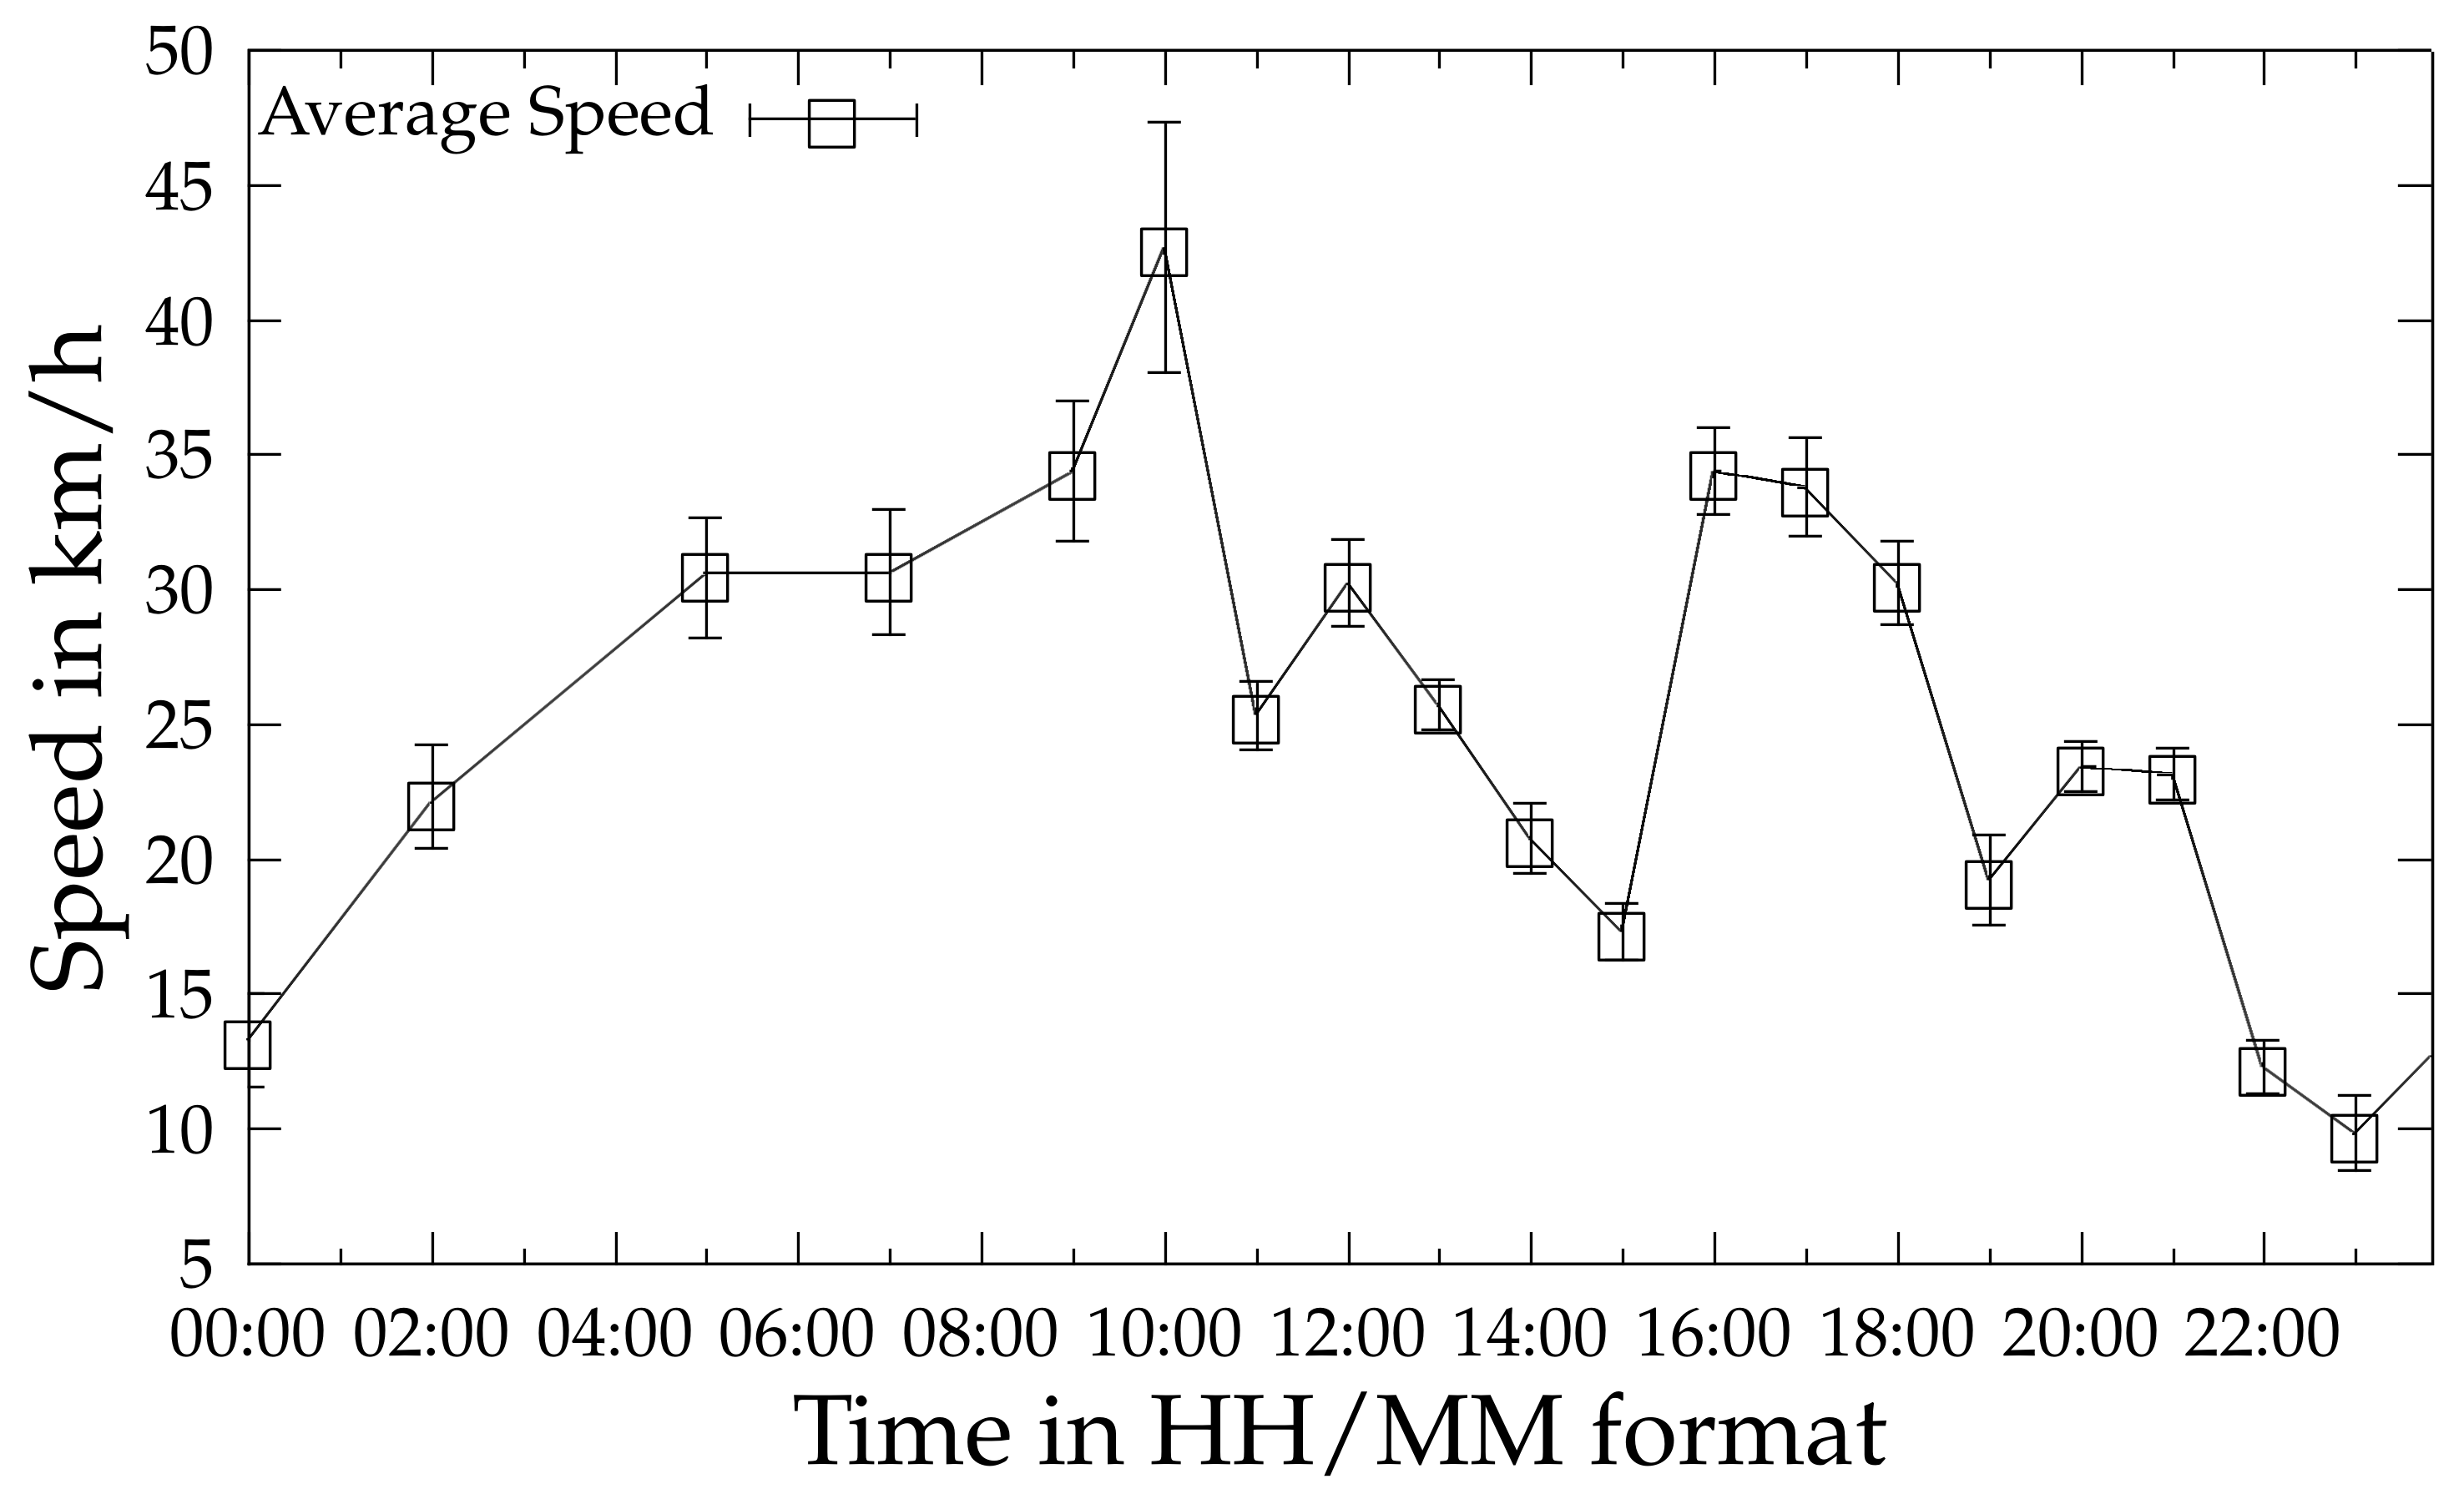
In Figure 6 the average speed on hourly basis for the selected period is depicted calculated by this formula
where i iterates through the days of the selected period and h is the hour for which the average speed in calculated.
As presented in the Figure 6 the speed recorded by the vehicles between 02:00 in the morning and 08:00 ranges between 22 and 43 km/h. During those early morning hours the traffic on the streets is relatively scarce, to the best of the drivers’ knowledge. It is observed that the average speed of the vehicles between 10:00 and 13:00 shows a major reduction, which can be explained by the fact that during these hours the traffic on the roads is significantly more dense compared to the aforementioned hours (many of the island’s visitors visit the town during these hours). Most businesses in Corfu close down for a short period during the middle of the day which lasts for approximately four (4) hours (from 14:00 to 18:00) and during that time the traffic load in the center of the town is reduced. Consequently, the speed recorded during these hours rises again. During the late afternoon and night hours the speed of the vehicles keeps reducing. The lowest average speed is recorded around 21:00 and between 20:00 and 00:00 the speed ranges between ten (10) and fifteen (15) km/h. Based on the professional drivers’ knowledge, this is the busiest time of the day for the center of the town.
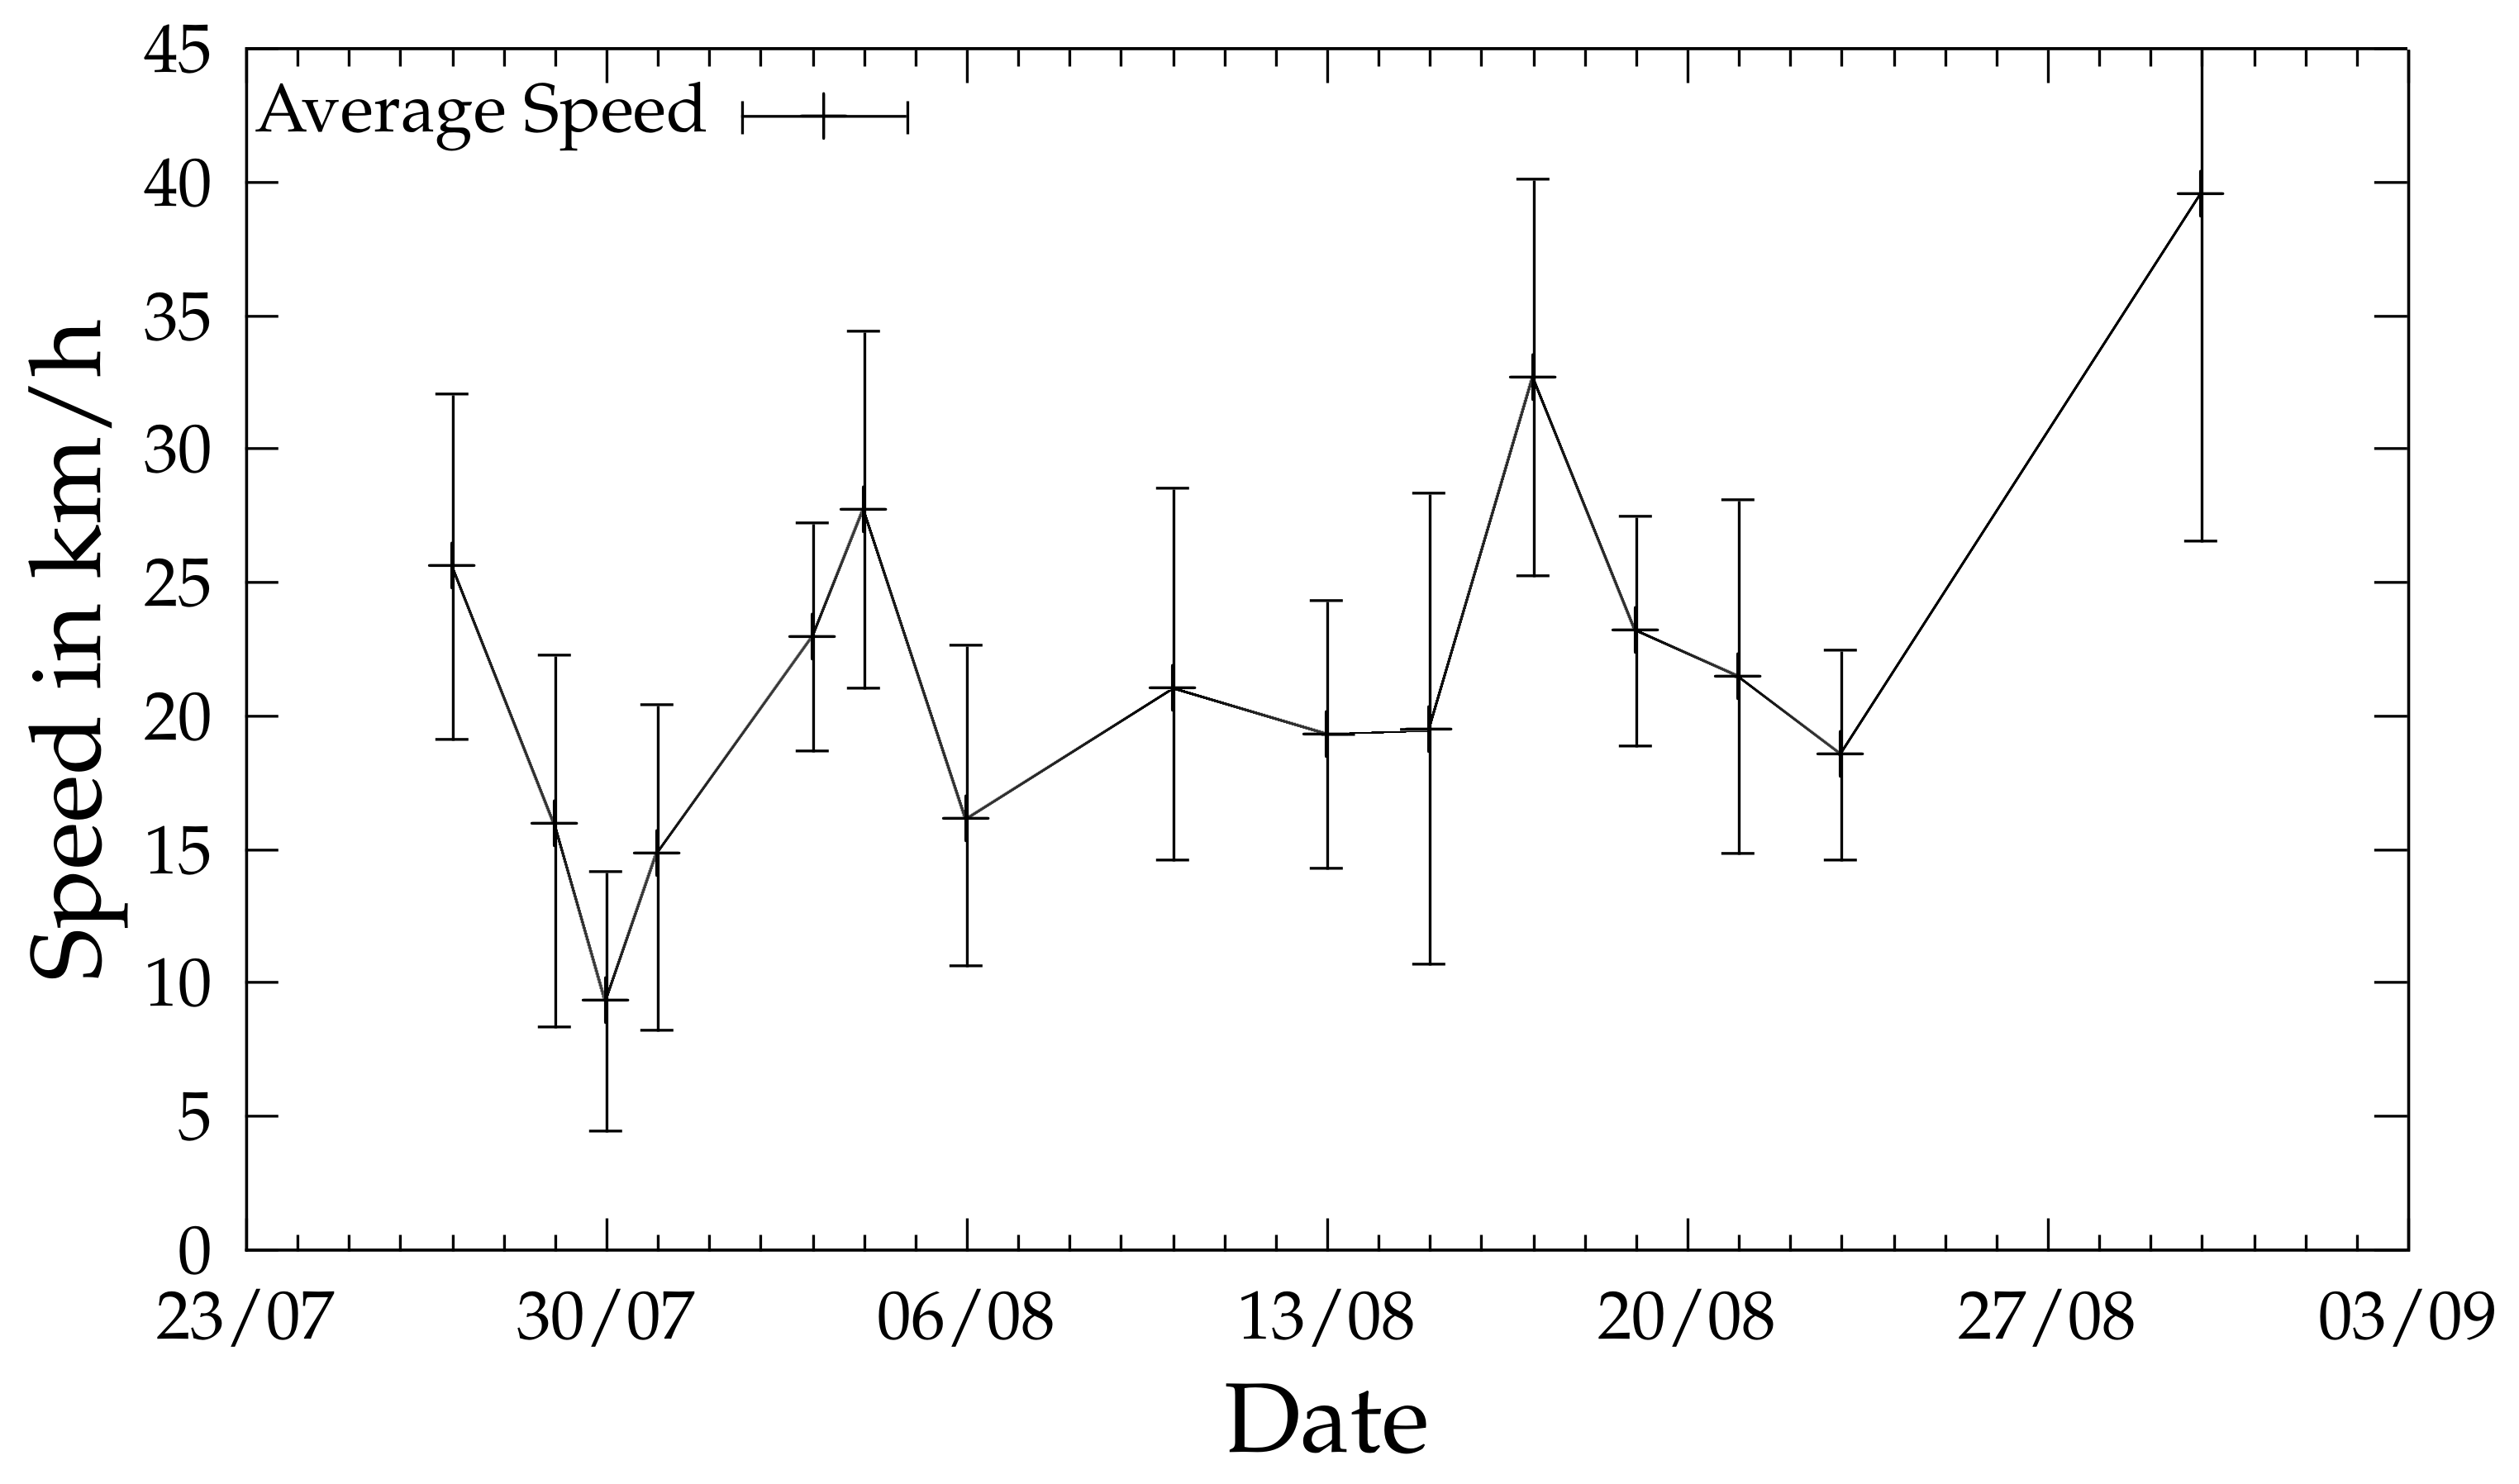
The average speed spotted in every date separately is presented in Figure 7. More precisely for every one of the selected dates, the average speed is calculated based on this formula
where i points to one of the dates selected and j points to the speed records of that . Based on the professional drivers’ traffic estimations, the busiest time of the season starts around the end of July and ends around the 21st of August. Their testimony is confirmed by the data recorded during that period. As seen in the Figure 7 the recorded average speed of the vehicles until the 21st of August ranges between 15 and 25 km/h. From that point on the speed keeps increasing slightly since the busiest time of the season has ended and the center of the town is not as crowded as before. By the beginning of September the speed is already significantly higher, compared to those of the aforementioned dates.
6. Discussion
In this study, a low-cost vehicular traffic monitoring system using IoT devices, fog and cloud computing, is presented. During the first implementation of the system (part of it was presented in the SEEDA conference), very few information was gathered—very short information gathering period—and the main point of interest was a specific road in the historic part of Corfu where the traffic is known to become quite dense during the summer season. Therefore the system run again for a period of 30 days.
This time the data is cross-validated with the testimonies provided by the professional drivers. The IGS devices are also deployed in multiple taxi stations to check the system’s behavior under real circumstances. The cloud computing infrastructure is better developed in order to be able to receive information from multiple IGS devices and merge the data in a single file. As a result, the proposed system can be utilized by local authorities to gain knowledge about the traffic behavior, both on a hourly and daily basis.
Through the analysis of the data gathered other issues that are yet unaddressed come to light. An important parameter of traffic condition is the vehicle density. The presented system can be extended easily and with low additional cost in order to estimate vehicle density on a transport network based on distance measurements of any precedent and/or succeeding vehicles of the equipped vehicle. A vehicle equipped with the Ultrasonic ranging module HC—SR04 provides 2 cm—400 cm non-contact measurement function which can be used to detect if there are precedent and/or succeeding vehicles in short distance and in addition to measure the distance in the available range (2 cm—400 cm). The considered system modification would provide valuable information in case of high vehicle density where the distance between vehicles is short but is unable to provide measurements in low density situations where the distance among vehicles is longer.
The existence of dense traffic has a grave impact on the emissions released by the vehicles. Therefore this study could be utilized by researchers interested in calculating the emission release increase during such periods of dense traffic. A possible application could involve the use of a K30 10,000 ppm Sensor Module to monitor the CO2 emissions of each vehicle and how they are affected by the traffic conditions. More cost efficient alternatives, like the Sharp GP2Y1010AU0F dust sensor, could be scattered around a large area to measure the air quality.
The successive operation of the system imposes that it could be deployed on a larger scale and provide assistance, not just to the local authorities, but also to other drivers and even researchers that could use the same architecture to test other vehicular parameters, such as emissions or traffic violations. Such a deployment, though, requires the equivalent number of MTS device equipped vehicles to cover a large geographical area. The same goes for the IGS devices installed, since the delay of the network relies solely on the rate the data is offloaded to the IGS devices and uploaded on the OwnCloud Server. It is important though not to overfill an area with devices since the collisions of the messages could overflow the network [44]. The presented data could be used as an example and benchmark for future large scale deployments with similar architecture. The cost of each of the devices used in this work is approximately 50€. Additional expenses are not required due to the absence of third party dependencies and the system can be replicated with cheaper devices as well—Table 2 shows the different RF modules that can replace the Xbee radio module used in this work.
As presented, the system was able to collect the data from the VTS devices successfully even when a low range radio module. Thus other similar modules can be utilized in order to work as the means of communications between the MTS devices and the IGS devices. A very promising candidate, for large scale deployment of a similar system, would be the SX1272 LoRa module which can easily work over long distances [45]. In Table 2 similar RF radio modules, that could be used in a similar architecture, are presented.
The proposed system is three-tiered traffic monitoring system that could by adopted by other researchers to further examine the traffic behavior or study other vehicular parameters. During the testing of the system some limitations were presented. The data is not collected in real-time by the fog devices to by processed, therefore the presented system has a notable disadvantage to any real-time data collection system. The due to the lack of MTS devices, small scale test runs are implemented and therefore the information acquired from them cannot represent the traffic behavior entirely. The system relies solely on the speed of the vehicles to monitor the traffic conditions which could result in false results (e.g., a vehicle could be driving slowly because the drives wants to, not because the traffic is dense). Other relevant traffic performance indicators can be studied, such as the density of the traffic or the emissions estimation.
An important issue that arises from this work is the consideration of the factors that are important for large scale execution. In this work two taxis are equipped with MTS devices. The use of other types of vehicles (professional or not) would be important to be questioned in future work as specific vehicle types may perform specific routes with particular driving behavior, e.g., city buses follow specific routes and often stop to existing bus stations. Especially, in the case of taxi vehicles there are additional factors to be considered, e.g., the areas in which they usually provide services as well as possible business specific limitations or even legislative issues that affect their operation. Another important issue to be addressed is the number of vehicles to be equipped with the MTS device. As stated in Section 4.1, a subset of the recorded days is used due to the fact that there are days with small or zero number of taxi transfers for the selected taxis. According to the previous it is reasonable to consider the increase of the equipped vehicles as an approach to obtain sufficient traffic monitoring data even in days with relatively low taxi demand. Nevertheless, the obtained data do not provide insights on the number of vehicles that could provide reliable traffic monitoring information but it is suggested that the characteristics of the transport network, e.g., the size of the area to be monitored as well as centrality and connectivity, should be taken into consideration.
7. Conclusions and Future Work
To conclude, the present paper proposes a low-cost vehicular traffic monitoring system using IoT devices and fog computing. The presented VTS is based on a three-tiered architecture which consists of modern hardware. More specifically, the system is composed of MTS devices, which are attached on vehicles and collect records about their location using GPS technologies, IGS devices, that gather the data collected by the MTS devices, and FDs that process that data and upload it on a server to be remotely accessed and reused. The MTS and the IGS devices are implemented on the prototyping platform of Arduino and the fog computing infrastructure consists of single-board computers manufactured by Raspberry. The prototyping platform of Arduino is compatible with many other sensors and modules which allows room for improvement to support more applications and also to rely on other elements apart from the speed of the vehicle. The server directory utilized, is created with the use of OwnCloud suite and the extracted information is uploaded on that directory.
The system is tested during a period of 30 days in the historic town of Corfu during a period of increased increased tourist activity. Two MTS devices are placed on two taxis and two IGS devices are placed close to taxi stations in the center of the town. The results of this test run showed that the proposed system is capable of gathering accurate data of the vehicles movement and by presenting the average speed of the vehicles both on an hourly and a daily basis is capable of estimating the traffic flow for the considered area and time period. It is observed that the recorded speed of the vehicles during the test matches the testimonies of the professional taxi drivers’ as well the estimation of the traffic flow. The proposed system can be exploited by the local authorities to gain a better understanding of the traffic behavior.
The results show that an increased number of records is required in order to assess effectively the traffic flow conditions. To increase the number of records collected daily, the MTS devices will be placed in additional public transportation vehicles, such as buses, and even civilian vehicles. In addition, a simple traffic density rating system will be created where every driver will rate the traffic density encountered at the end of every day (e.g., on a scale from one (1) {no traffic} to five (5) {dense traffic} or on the scale of the LOS indicator). Furthermore, other issues arise from the testing of the proposed system. Due to the limited inventory of hardware available, the problem of finding the optimal placement for the stationary devices arises, also known as facility location problem. Another issue is the data offloading frequency, which can be addressed by adopting a transmission technique similar to an opportunistic transmission approach. Finally, the data collected by the proposed system can be further examined to estimate the time needed for a vehicle to go from one specific location to another or the LOS indicator of the traffic congestion level. The aforementioned draw guidelines for future work regarding smart cities applications to enable local authorities to monitor and control traffic flow during different periods of the day, the month and/or the year or even provide routing solutions which is a service of vital importance in case of emergencies.
Author Contributions
Conceptualization, K.O.; Data curation, S.V.; Funding acquisition, K.O.; Investigation, G.T.; Methodology, S.V. and V.K.; Supervision, G.T. and K.O.; Validation, A.T.; Visualization, A.T.; Writing—original draft, S.V.; Writing—review and editing, S.V., V.K. and A.T. All authors have read and agreed to the published version of the manuscript.
Funding
This research received no external funding.
Acknowledgments
This research was supported by local professional drivers of Corfu. Their support is gratefully acknowledged. The present work is partially supported by project “A Pilot Wireless Sensor Networks System for Synchronized Monitoring of Climate and Soil Parameters in Olive Groves”, (MIS 5007309) which is partially funded by European and National Greek Funds (ESPA) under the Regional Operational Program “Ionian Islands 2014–2020”.
Conflicts of Interest
The authors declare no conflict of interest.
Abbreviations
The following abbreviations are used in this manuscript:
| MTS | Mobile Tracking System |
| IGS | Information Gathering System |
| VTS | Vehicle Tracking System |
| WSN | Wireless Sensor Network |
| IoT | Internet of Things |
| UAV | Unmanned Aerial Vehicle |
| 5G | Fifth Generation of cellular network technology |
| GPS | Global Positioning System |
| km/h | Kilometers per Hour—Speed Metric |
References
- Chen, C.; Jia, Z.; Varaiya, P. Causes and cures of highway congestion. IEEE Control Syst. Mag. 2001, 21, 26–32. [Google Scholar]
- Home—INRIX INDUSTRIES. Available online: http://inrix.com/ (accessed on 17 March 2020).
- Rao, A.M.; Rao, K.R. Measuring urban traffic congestion-a review. Int. J. Traffic Transp. Eng. 2012, 2, 286–305. [Google Scholar]
- Gil-Garcia, J.R.; Pardo, T.A.; Nam, T. What makes a city smart? Identifying core components and proposing an integrative and comprehensive conceptualization. Inf. Polity 2015, 20, 61–87. [Google Scholar] [CrossRef]
- Toppeta, D. The smart city vision: How innovation and ICT can build smart,“livable”, sustainable cities. Innov. Knowl. Found. 2010, 5, 1–9. [Google Scholar]
- Arasteh, H.; Hosseinnezhad, V.; Loia, V.; Tommasetti, A.; Troisi, O.; Shafie-Khah, M.; Siano, P. Iot-based smart cities: A survey. In Proceedings of the 2016 IEEE 16th International Conference on Environment and Electrical Engineering (EEEIC), Florence, Italy, 7–10 June 2016; pp. 1–6. [Google Scholar]
- Nellore, K.; Hancke, G. A survey on urban traffic management system using wireless sensor networks. Sensors 2016, 16, 157. [Google Scholar] [CrossRef] [PubMed] [Green Version]
- Kilger, M. A shadow handler in a video-based real-time traffic monitoring system. In Proceedings of the IEEE Workshop on Applications of Computer Vision, Palm Springs, CA, USA, 30 November–2 December 1992; pp. 11–18. [Google Scholar]
- Kamijo, S.; Matsushita, Y.; Ikeuchi, K.; Sakauchi, M. Traffic monitoring and accident detection at intersections. IEEE Trans. Intell. Transp. Syst. 2000, 1, 108–118. [Google Scholar] [CrossRef] [Green Version]
- Robert, K. Video-based traffic monitoring at day and night vehicle features detection tracking. In Proceedings of the 2009 12th International IEEE Conference on Intelligent Transportation Systems, St. Louis, MO, USA, 4–7 October 2009; pp. 1–6. [Google Scholar]
- Zhang, J.; Lu, Y.; Lu, Z.; Liu, C.; Sun, G.; Li, Z. A new smart traffic monitoring method using embedded cement-based piezoelectric sensors. Smart Mater. Struct. 2015, 24, 025023. [Google Scholar] [CrossRef]
- Rizwan, P.; Suresh, K.; Babu, M.R. Real-time smart traffic management system for smart cities by using Internet of Things and big data. In Proceedings of the 2016 International Conference on Emerging Technological Trends (ICETT), Kollam, India, 21–22 October 2016; pp. 1–7. [Google Scholar]
- Chen, S.; Sun, Z.; Bridge, B. Automatic traffic monitoring by intelligent sound detection. In Proceedings of the Conference on Intelligent Transportation Systems, Boston, MA, USA, 12 November 1997; pp. 171–176. [Google Scholar]
- Cho, M.G.; Yu, Y.J.; Kim, S. The system for predicting the traffic flow with the real-time traffic information. In International Conference on Computational Science and Its Applications; Springer: Berlin, Germany, 2006; pp. 904–913. [Google Scholar]
- Scofield, C.L.; Cahn, R.C.; Hersch, J.; Stoppler, W.; Yakich, V.R.; Huang, T.M.; Barker, A. Predicting Expected Road Traffic Conditions Based on Historical And Current Data. U.S. Patent No. 9,257,041, 9 February 2016. [Google Scholar]
- Kanistras, K.; Martins, G.; Rutherford, M.J.; Valavanis, K.P. Survey of unmanned aerial vehicles (UAVs) for traffic monitoring. In Proceedings of the 2013 International Conference on Unmanned Aircraft Systems (ICUAS), Atlanta, GA, USA, 28–31 May 2013; pp. 2643–2666. [Google Scholar]
- Janecek, A.; Valerio, D.; Hummel, K.A.; Ricciato, F.; Hlavacs, H. The cellular network as a sensor: From mobile phone data to real-time road traffic monitoring. IEEE Trans. Intell. Transp. Syst. 2015, 16, 2551–2572. [Google Scholar] [CrossRef]
- Händel, P.; Ohlsson, J.; Ohlsson, M.; Skog, I.; Nygren, E. Smartphone-based measurement systems for road vehicle traffic monitoring and usage-based insurance. IEEE Syst. J. 2013, 8, 1238–1248. [Google Scholar] [CrossRef] [Green Version]
- Lewandowski, M.; Płaczek, B.; Bernas, M.; Szymała, P. Road Traffic Monitoring System Based on Mobile Devices and Bluetooth Low Energy Beacons. Wirel. Commun. Mob. Comput. 2018, 2018, 12. [Google Scholar] [CrossRef] [Green Version]
- Barth, D. The bright side of sitting in traffic: Crowdsourcing road congestion data. Off. Google Blog 2019, 3. [Google Scholar]
- WECKERT, S. Google Maps Hacks; O’Reilly Media, Inc.: Sevastopol, CA, USA, 2006. [Google Scholar]
- Chen, P.T.; Chen, F.; Qian, Z. Road traffic congestion monitoring in social media with hinge-loss Markov random fields. In Proceedings of the 2014 IEEE International Conference on Data Mining, Shenzhen, China, 14–17 December 2014; pp. 80–89. [Google Scholar]
- Ribeiro, A.I.J.T.; Silva, T.H.; Duarte-Figueiredo, F.; Loureiro, A.A. Studying traffic conditions by analyzing foursquare and instagram data. In Proceedings of the 11th ACM Symposium on Performance Evaluation of Wireless Ad Hoc, Sensor, & Ubiquitous Networks; ACM: New York, NY, USA, 2014; pp. 17–24. [Google Scholar]
- Matsui, T.; Yuzawa, H.; Kobayashi, A. Road Traffic Monitoring System. U.S. Patent No. 6,781,523, 24 August 2004. [Google Scholar]
- Ng, E.H.; Tan, S.L.; Guzman, J.G. Road traffic monitoring using a wireless vehicle sensor network. In Proceedings of the 2008 International Symposium on Intelligent Signal Processing and Communications Systems, Bangkok, Thailand, 8–11 February 2009; pp. 1–4. [Google Scholar]
- Noh, H.R. Method for Transmitting Traffic Information Using Vehicle to Vehicle Communication. U.S. Patent No. 9,159,231, 13 October 2015. [Google Scholar]
- Bauza, R.; Gozalvez, J.; Sanchez-Soriano, J. Road traffic congestion detection through cooperative vehicle-to-vehicle communications. In Proceedings of the IEEE Local Computer Network Conference, Denver, CO, USA, 10–14 October 2010; pp. 606–612. [Google Scholar]
- He, W.; Yan, G.; Da Xu, L. Developing vehicular data cloud services in the IoT environment. IEEE Trans. Ind. Inf. 2014, 10, 1587–1595. [Google Scholar] [CrossRef]
- Al-Sakran, H.O. Intelligent traffic information system based on integration of Internet of Things and Agent technology. Int. J. Adv. Comput. Sci. Appl. (IJACSA) 2015, 6, 37–43. [Google Scholar]
- Sukode, S.; Gite, S. Vehicle traffic congestion control & monitoring system in IoT. Int. J. Appl. Eng. Res. 2015, 10, 19513–19523. [Google Scholar]
- Chen, N.; Chen, Y.; Song, S.; Huang, C.T.; Ye, X. Smart urban surveillance using fog computing. In Proceedings of the 2016 IEEE/ACM Symposium on Edge Computing (SEC), Washington, DC, USA, 27–28 October 2016; pp. 95–96. [Google Scholar]
- Huang, C.; Lu, R.; Choo, K.K.R. Vehicular fog computing: Architecture, use case, and security and forensic challenges. IEEE Commun. Mag. 2017, 55, 105–111. [Google Scholar] [CrossRef]
- Ning, Z.; Huang, J.; Wang, X. Vehicular fog computing: Enabling real-time traffic management for smart cities. IEEE Wirel. Commun. 2019, 26, 87–93. [Google Scholar] [CrossRef]
- Jabbar, R.; Al-Khalifa, K.; Kharbeche, M.; Alhajyaseen, W.; Jafari, M.; Jiang, S. Applied Internet of Things IoT: Car monitoring system for Modeling of Road Safety and Traffic System in the State of Qatar. In Qatar Foundation Annual Research Conference Proceedings Volume 2018 Issue 3; Hamad bin Khalifa University Press (HBKU Press): Doha, Qatar, 2018; Volume 2018, p. ICTPP1072. [Google Scholar]
- Khan, S.M.; Dey, K.C.; Chowdhury, M. Real-time traffic state estimation with connected vehicles. IEEE Trans. Intell. Transp. Syst. 2017, 18, 1687–1699. [Google Scholar] [CrossRef]
- Li, X.; Zhang, X.; Ren, X.; Fritsche, M.; Wickert, J.; Schuh, H. Precise positioning with current multi-constellation Global Navigation Satellite Systems: GPS, GLONASS, Galileo and BeiDou. Sci. Rep. 2015, 5, 8328. [Google Scholar] [CrossRef] [PubMed]
- Adafruit. Adafruit FONA 800 Shield—Voice/Data Cellular GSM for Arduino. Available online: https://www.adafruit.com/product/2468 (accessed on 17 March 2020).
- Arduino. Arduino Mega 2560 Rev3. Available online: https://store.arduino.cc/arduino-mega-2560-rev3 (accessed on 17 March 2020).
- Arduino. Arduino Wireless SD Shield. Available online: https://store.arduino.cc/arduino-wireless-sd-shield (accessed on 17 March 2020).
- Digi. XBee-PRO S2C DigiMesh 2.4 Through-Hole Module W/Wire Antenna. Available online: https://www.digi.com/products/models/xbp24cdmwit-001 (accessed on 17 March 2020).
- Mayalarp, V.; Limpaswadpaisarn, N.; Poombansao, T.; Kittipiyakul, S. Wireless Mesh Networking with XBee. Available online: https://pdfs.semanticscholar.org/e97d/a845f0601005fb9c6601109f235cea3327be.pdf (accessed on 17 March 2020).
- Arduino. Arduino Uno Rev3. Available online: https://store.arduino.cc/arduino-uno-rev3 (accessed on 17 March 2020).
- Foundation, R.P. Raspberry Pi 3 Model B. Available online: https://www.raspberrypi.org/products/raspberry-pi-3-model-b/ (accessed on 17 March 2020).
- Magrin, D.; Centenaro, M.; Vangelista, L. Performance evaluation of LoRa networks in a smart city scenario. In Proceedings of the 2017 IEEE International Conference on Communications (ICC), Paris, France, 21–25 May 2017; pp. 1–7. [Google Scholar] [CrossRef]
- Khutsoane, O.; Isong, B.; Abu-Mahfouz, A.M. IoT devices and applications based on LoRa/LoRaWAN. In Proceedings of the IECON 2017-43rd Annual Conference of the IEEE Industrial Electronics Society, Beijing, China, 29 October–1 November 2017; pp. 6107–6112. [Google Scholar]
Figure 1.
Overall System Infrastructure. The mobile tracking system (MTS) gathers raw data and sends it to the information gathering system (IGS) which is connected to a FD that processes the data and uploads the extracted information on a server.
Figure 1.
Overall System Infrastructure. The mobile tracking system (MTS) gathers raw data and sends it to the information gathering system (IGS) which is connected to a FD that processes the data and uploads the extracted information on a server.

Figure 2.
Proposed System Hardware.

Figure 3.
This is the graphical representation of the data reduction technique applied when the vehicle is stationary. As shown in the figure, the GPS records never point at the same spot due to the antenna’s inaccuracy.
Figure 3.
This is the graphical representation of the data reduction technique applied when the vehicle is stationary. As shown in the figure, the GPS records never point at the same spot due to the antenna’s inaccuracy.

Figure 4.
This data reduction technique is applied when the vehicle is moving on a straight course. As shown in the figure the system stores only the first and the last record collected on that straight course and discards the rest.
Figure 4.
This data reduction technique is applied when the vehicle is moving on a straight course. As shown in the figure the system stores only the first and the last record collected on that straight course and discards the rest.

Figure 5.
The data is collected by the FDs, processed and uploaded on the common directory on the Cloud.
Figure 5.
The data is collected by the FDs, processed and uploaded on the common directory on the Cloud.

Figure 6.
The average speed of the vehicles spotted every hour is presented in this figure.

Figure 7.
The average speed of the vehicles spotted in every date is presented in this figure.


Table 1.
The form of the extracted information.
| Current Location | Speed | Movement Estimation | Time of Record | Date | Node |
|---|---|---|---|---|---|
| Central Corfu | 0.63 | Car stopped for 74.0 s | 15:11:08 | 13/8 | 41826c8e |
| Central Corfu | 0.73 | Car stopped for 53.0 s | 15:12:01 | 13/8 | 41826c8e |
| Central Corfu | 8.10 | Car moved very slow for 5.0 s | 15:12:06 | 13/8 | 41826c8e |
| Central Corfu | 31.83 | Car moved very slow for 3.0 s | 15:12:09 | 13/8 | 41826c8e |
| Central Corfu | 30.57 | Car moved very slow for 4.0 s | 15:12:13 | 13/8 | 41826c8e |
| Central Corfu | 31.56 | Car moved very slow for 2.0 s | 15:12:15 | 13/8 | 41826c8e |
| Central Corfu | 39.48 | Straight movement for 3.0 s | 15:12:18 | 13/8 | 41826c8e |
Table 2.
List of Radio Modules (prices may vary depending on the store).
| Module | Price | Range | Features |
|---|---|---|---|
| HM-10 Bluetooth module | 13.00 | 2–3 m. | Fast Operates with AT Commnads |
| XBee PRO S2C module | 25.00 | 140 m. | Coordinators, Routers, End Devices Easy to use Transmits through Serial XCTU platform to configure |
| XBee Wifi Module | 47.00 | 10 km. | Requires antenna Transmits through Serial XCTU platform to configure |
| RF Link Transmitter and Receiver—433 MHz | 2.00 | 3–100 m. | Operates with AT Commnads Requires antenna Simple and fast One-way Coms |
| nRF24L01 2.4 GHz Wireless Transceiver Module | 2.50 | 20–30m. | Operates with AT Commnads Short antenna Sensitive to noise |
| HC12 RF Module | 10.00 | 20–30 m. | Operates with AT Commnads Slow data transmission |
| CC1101 | 5.00 | 300–500 m. | Operates with AT Commnads |
| LoRA | 30.00 | 10–50 km. | Operates with AT Commnads Very good range |
© 2020 by the authors. Licensee MDPI, Basel, Switzerland. This article is an open access article distributed under the terms and conditions of the Creative Commons Attribution (CC BY) license (http://creativecommons.org/licenses/by/4.0/).
Share and Cite
MDPI and ACS Style
Vergis, S.; Komianos, V.; Tsoumanis, G.; Tsipis, A.; Oikonomou, K. A Low-Cost Vehicular Traffic Monitoring System Using Fog Computing. Smart Cities 2020, 3, 138-156. https://doi.org/10.3390/smartcities3010008
AMA Style
Vergis S, Komianos V, Tsoumanis G, Tsipis A, Oikonomou K. A Low-Cost Vehicular Traffic Monitoring System Using Fog Computing. Smart Cities. 2020; 3(1):138-156. https://doi.org/10.3390/smartcities3010008
Chicago/Turabian StyleVergis, Spiridon, Vasileios Komianos, Georgios Tsoumanis, Athanasios Tsipis, and Konstantinos Oikonomou. 2020. "A Low-Cost Vehicular Traffic Monitoring System Using Fog Computing" Smart Cities 3, no. 1: 138-156. https://doi.org/10.3390/smartcities3010008