Use of Social Media to Seek and Provide Help in Hurricanes Florence and Michael


Department of Civil, Construction, and Environmental Engineering, North Carolina State University, Raleigh, NC 27695, USA
*
Author to whom correspondence should be addressed.
Smart Cities 2020, 3(4), 1187-1218; https://doi.org/10.3390/smartcities3040059
Submission received: 28 August 2020
/
Revised: 29 September 2020
/
Accepted: 7 October 2020
/
Published: 14 October 2020
(This article belongs to the Special Issue Feature Papers for Smart Cities)
Abstract
:During hazardous events, communities can use existing social media networks to share information in real time and initiate a local disaster response. This research conducted a web-based survey to explore two behaviors around the use of social media during hurricanes: seeking help and responding to help requests. Through the survey, we sampled 434 individuals across several counties affected by 2018 hurricanes Florence and Michael, which were both designated by the National Oceanic and Atmospheric Administration as billion-dollar weather disasters. The survey questions collected data about demographics, social media use habits, perceptions towards social media, hurricane damages, and actions taken during a hurricane to seek and provide help. The Theory of Planned Behavior (TPB) was used to conceptualize and frame parameters that affect intentions and behaviors regarding the use of social media during hurricanes to seek and provide help. Survey responses are analyzed using statistical regression to evaluate hypotheses about the influence of factors on seeking help and responding to help requests. Regression analyses indicate that attitude and perceived behavioral control predict intention to access social media during a hurricane, partially supporting the TPB. Intention and experiencing urgent damages predict help-seeking behaviors using social media. Posting frequency to social media under normal conditions and the number of help requests seen during the event predict help-responding behaviors. Linear regression equations governing intention and behavior were parameterized using survey results. The factors underlying social media behavior during hurricanes as identified in this research provide insight for understanding how smart information technologies, such as personal devices and social media networks, support community self-sufficiency and hazard resilience.

1. Introduction
Information and communications technology (ICT), including social media, is an essential aspect of smart connected cities [1]. Community members provide real-time observations and reactions about their city through social media updates, creating easily accessible networks to share information quickly among peers [2]. Real-time information sharing is a smart city functionality that is an important component of hazard response, as social media users provide and access information about resources to supplement conventional means of emergency aid [3,4,5,6]. For example, social media platforms provide hazard response features, including crisis mapping and virtual safety check-ins [7]. Whatsapp is a messaging service that was widely used by 2018 flooding victims in Kerala, India to share their locations [8]. During Hurricane Sandy (2012), the American Red Cross used Instagram photos to identify heavily damaged areas [9], and researchers used Twitter data to develop models of evacuation behaviors in hurricanes [10]. In 2018, Facebook launched a suite of services under their Crisis Response Hub, which includes a geolocated webpage for individuals to find or offer help and share information. Natural disaster data can be collected through crowdsourced and geotagged social media information for purposes including flood forecasting [11]. Social media analytics have been coupled with census, remote sensing, or information from governmental bodies in several applications to generate insight about disaster impacts [12]. While some research studies have explored the parameters that influence social media behaviors under normal circumstances [13,14,15,16,17,18] and the influences that affect decisions to evacuate or prepare for a disaster [19,20,21], there is a lack of data and information around social media behaviors during a hazard. Knowing how individuals use social media to request and provide help during disasters can inform emergency communication planning, resource allocation, and coordination among different actors in response efforts.
The goal of this research is to explore how social media is used during hurricanes and to identify the parameters that influence decisions to use social media during a hurricane to seek help and respond to requests for help. Hurricanes inflict high winds, rainfall, and storm surges, which interrupt the critical infrastructure services of cities. Under a changing climate, hurricanes are becoming slower with more opportunity for inundation and heightened impacts on lives and property [22]. As a result of flooding and damages, individuals can become stranded without food, clean water, or the means to move to safety. Smart technologies that enhance social connectedness can improve hurricane response and consequence mitigation [23]. This manuscript uses a survey-based approach to explore how social media was used by populations affected by 2018 hurricanes Florence and Michael. The survey was conducted to collect Theory of Planned Behavior (TPB) information related to perceptions and use of social media. In total, 434 survey responses were collected. Path analysis was conducted using TPB parameters to identify if social media perceptions and habits predict intention to access social media, help-seeking behaviors, and help-responding behaviors during a hurricane. In addition to testing canonical TPB components of attitude, subjective norms, and perceived behavioral control, the TPB was extended to test for the effects of additional variables, including experiencing damages, frequency of making social media posts, and the number of help-seeking posts seen.
2. Background
2.1. Social Media Use in Resilient Smart Cities
Smart cities consist of interconnected engineered infrastructure and ICT, which function together to meet the demands for resources and services of urban constituents [1]. Social behaviors affect the diffusion of information and can have a major effect on the performance of interconnected ICT and infrastructure systems. Users share updates about the level of service provided by infrastructure and can influence the way that their peers perceive and use infrastructure. Responsive and human-centered smart cities can use capabilities of ICT to provide two-way communication, informing citizens about infrastructure and allowing citizens to participate in decision-making processes that affect public safety and quality of life [24]. In their review of big data use cases for smart city applications, Lim and Maglio [25] identify major types of ICT employed by cities, including geographic and visualization software, Internet of Things (IoT) for real-time data transmission, blockchain for data security, and cloud computing for data storage and processing. Development and planning of smart cities and smart infrastructure projects need to be informed through data and understanding about the intention and behavior of individuals around the adoption of emerging technologies [26]. Social tmedia is an ICT tool that functions as an interactive online platform to facilitate generating and sharing content about users’ reactions. On social media, “millions of city dwellers share their daily observations, thoughts, feelings, and experiences”, providing potential benefits for smart city operations [2]. The vast human-sensed information captured by social media has not yet been fully utilized for smart city planning, management, and engagement [27]. Several frameworks exist to leverage useful event monitoring information from social media data, such as text classification methods to generate incident intelligence reports from tweets [28] and rapid flood mapping based on social media photos [29]. Social media platforms can provide real-time feedback for communities affected by hazards through crowdsourced damage reports, wellness checks, and capabilities to seek help and respond to the needs of victims [30].
2.2. Social Media Use during Hurricanes
Traditional media, such as radio and television, remain important and reliable information sources during an emergency [31]. Unlike social media, however, traditional communication channels function only to disseminate news and lack an interactive component. In 2010, the American Red Cross surveyed 1058 Americans about the burgeoning role of social media during disasters and emergencies. They found that 75% of respondents participate in social media networking, and that 16% of respondents used social media to obtain information about an emergency [32]. Additionally, 86% of respondents reported that they would use Facebook to report their safety, and 18% of respondents would use digital media if traditional emergency services, like 9-1-1, were unreachable [32]. The user-created nature of social media creates some limitations in its use, as there is a risk of spreading misinformation [31]. Despite limitations, social media enables a two-way dialogue between government bodies or relief organizations and individuals [4]. Prior surveys and existing literature indicate that social media offers capabilities that can enhance disaster response and behavior modeling across sectors of the population [3,5,10,32].
The research described in this manuscript explores social media use during 2018 hurricanes Florence and Michael. These storms impacted populous cities, including New Bern, North Carolina and Panama City, Florida. Our analysis of publicly available data demonstrates that social networking sites were used during these events. For example, CrowdRelief.net is a crowdsourced website to coordinate rescue operations and supplies, where nearly 800 help requests were filed during Hurricanes Florence and Michael. We conducted a Twitter analysis to better understand help-seeking and response phenomena during Hurricanes Florence and Michael. We used DiscoverText, a proprietary software offering paid access to tweets, to collect 29,000 tweets related to Hurricane Florence from 13–19 September 2018. Using text analytics, 963 tweets were identified that directly related to rescue activities, including language around victims being stranded, wellness checks, and rising water (Figure 1). The most frequently used word in this set of 963 tweets was “help”, with 602 occurrences.
2.3. Theory of Planned Behavior
The survey that is developed in this research is based on the TPB to characterize behaviors around accessing social media during a hurricane to seek and provide help. Although human behavior is difficult to predict, several psychological theories suggest that there is a discernible pattern to individual behaviors. The TPB poses that an intention to engage in a behavior is predictable from attitude, subjective norms, and perceived behavioral control [33]. Attitude is an individual’s feeling that an action is favorable or unfavorable. A subjective or social norm is an individual’s perception about whether their peers would approve of a behavior. Perceived behavioral control refers to the degree to which an individual feels they have agency and can perform a behavior. Intention is formed when a positive attitude, subjective norms, and a high perceived behavioral control align, and individuals are likely to choose a behavior for which they have an intention [34]. The TPB has been extensively tested in empirical studies to understand a wide range of behaviors, including the use of information technology [35], and to provide insight on the use of smart technologies for informing the design of effective smart city solutions [26].
The TPB has been widely applied as a model to describe human interactions with information technologies [13] and decision-making about social media [15,16,17,18]. The TPB can provide essential understanding of the perceptions and use of smart technologies. In previous studies, attitude and subjective norms were found to significantly predict intention to use social networking websites, and intention predicted social networking behaviors [15]. Further research found that self-identity significantly predicts both intended and actual social media use [15]. Another study found that attitude and perceived behavioral control are significant predictors of an intention to participate in virtual communities [17]. Perceived behavioral control is a significant predictor of social media behavior, as those who do not feel self-efficacy with a computer are not likely to have an online presence [18]. Attitudes, subjective norms, and perceived behavioral control, in addition to narcissism, were shown to predict an intention to post self-pictures, and intention predicted the behavior of posting “selfies” to social media [16]. Much of the literature on TPB and social media use agrees that performing a certain social media behavior is predictable from an intention to use social media [15,16,18].
The TPB has also been used to describe people’s behaviors in emergency situations [19,20,21,36,37]. Attitudes, subjective norms, and perceptions of behavioral control are significant predictors of intention to prepare for a disaster [21]. TPB parameters were tested using responses to a telephone survey of hurricane damages after Hugo and Andrew, and the results demonstrated that subjective norms and a strong understanding of risk were important in forming an intention to evacuate [19]. Self-efficacy, or the feeling that one is able to understand and execute certain actions, is an aspect of perceived behavioral control that was identified as an important predictor of the behavior of seeking hazard information [20]. Attitude, subjective norms, and perceived behavioral control also have been demonstrated to significantly predict willingness to drive through flooded waterways [36].
3. Hypothesis Development and Proposed Models
According to the TPB, attitude, subjective norms, and perceived behavioral control underlie an intention to act, and intentions predict behavior. This research tests the hypothesis that attitude, subjective norms, and perceived behavioral control predict an intention to access social media during a hurricane. Additionally, we hypothesize that certain social media use habits, specifically the frequency of making posts, predict intention. This research explores how intention predicts two types of social media behaviors related to hazard: help-seeking and help-responding. In this context, help-seeking behaviors request emergency rescue or supplies, and help-responding behaviors provide aid, such as performing a rescue or sharing a help post to garner attention. We hypothesize that, in addition to intention, experiencing hurricane damages would motivate a behavior to seek help. Finally, we test a hypothesis that seeing many help posts influences decisions to engage in help-responding behaviors. All hypotheses are tested by conducting a path analysis of scored survey responses. Concept models of the casual linkages between these factors are proposed and tested via multiple linear regression in path analysis. The first model predicts help-seeking behavior (Figure 2a), and the second model predicts help-responding behavior (Figure 2b).
The hypothesis testing is repeated for three groupings of the survey responses: North Carolina, Florida, and the combined sample. This approach is selected to determine if there are any differences in the predictors of behavior based on hurricane location or intensity. Local factors, specific storm forecasts, and risk perception likely play a role in the forming of intentions and behaviors. The two hurricanes included in this sample were different categories on the Saffir–Simpson hurricane wind scale. By assessing the different hurricanes both individually and as a combined sample, we explore the possibility of different drivers of intention and different urgency effects for Category 5 (Hurricane Michael) and Category 4 (Hurricane Florence) events.
3.1. Attitude toward Social Media
Applications of the TPB demonstrate that a positive attitude toward an action predicts an intention to perform that action [38]. Prior studies indicate that a positive attitude toward social media is related to receiving positive gratification and can motivate behaviors such as posting self-pictures [16]. Positive perception of social media connections—that social media are useful, enjoyable, and reliable—may motivate intention to access social media during a hurricane. Conversely, those who do not enjoy social media platforms and do not feel these are reliable may be less likely to use social media to find help or information during an emergency.
Hypothesis 1 (H1).
Attitude toward social media is positively related to an intention to use social media during a hurricane.
3.2. Subjective Norms
Another factor that may drive the use of social media is the desire for inclusion among peers, and social normative factors have been shown to predict social media use among a sample of 17–24 year old users [15]. Individuals who feel that their friends and relatives use social media may be more inclined to access social media for actions such as finding help, checking on others, and responding to requests for help.
Hypothesis 2 (H2).
Subjective norms about social media are positively related to an intention to use social media during a hurricane.
3.3. Perceived Behavioral Control
Literature indicates that perceived control can significantly impact behavior and reduce the effects of attitude on intention. For example, in a study about sustainable practices among residents of a Finnish city, many people had a positive attitude about environmentalism, but few intended to take sustainable actions [39]. Situational control, such as stress, time constraints, and lack of knowledge, created barriers to the adoption of a sustainable lifestyle [39]. Barriers to using social media can be reduced if an individual feels in control while navigating social media, such as understanding how to log in and search for information. High perceived behavioral control can increase the likelihood that one would intend to use social media platforms during a hurricane.
Hypothesis 3 (H3).
Perceived behavioral control in using social media is positively related with an intention to use social media during a hurricane.
3.4. Intention
According to the TPB, actual behaviors are preceded by an intention to perform that behavior [33]. Hypothesis H4 reflects that the intention to use social media during the hurricane positively predicts actual social media behaviors. Hypothesis H4a proposes that the intention to use social media positively predicts the behavior of seeking help, and H4b proposes that intention predicts the behavior of responding to social media help requests.
Hypothesis 4a (H4a).
The intention to use social media during a hurricane is positively related to help-seeking behaviors using social media during a hurricane.
Hypothesis 4b (H4b).
The intention to use social media during a hurricane is positively related to performing a help-responding behavior using social media during a hurricane.
3.5. Urgency
In this analysis, urgency is defined as the severity of damages that are experienced, measured by the damage cost and damage type (Q18 and Q21 in Appendix A). Expansions of the TPB indicate that external interventions can be the deciding factor in whether a behavior is performed. In a study of more than 700 survivors of Hurricanes Hugo and Andrew, one-third of respondents did not evacuate because they did not feel a serious threat [19]. A TPB study of 175 Australian drivers demonstrated that an individual’s level of perceived severity of flooding relates to their willingness to drive during a flood event [36]. Failure to recognize urgency has also been demonstrated through the application of TPB to predict the risky behavior of entering floodwaters [40]. Urgency may also be experienced as an immediate need for help, beyond the severity of damages. As urgent conditions such as high winds, floodwater, and electrical outages develop, the need for help can escalate and force the transformation from intention to action. Hurricane damages that are perceived as severe and pose immediate threat could predicate the behavior of seeking help through social media (H5a). Hypothesis H5b reflects that individuals who experience urgent damages are likely to disengage in help-responding behaviors, as they would be focused on self-preservation.
Hypothesis 5a (H5a).
Urgency of hurricane damage is positively related to the help-seeking behaviors using social media during a hurricane.
Hypothesis 5b (H5b).
Urgency of hurricane damage is negatively related to help-responding behaviors using social media during a hurricane.
3.6. Posting Frequency
Social media habits under normal non-hazard conditions may contribute to predictions of how an individual uses social media during a hurricane event. Active social media users frequently post updates to their online communities [41]. Those who are already active may be more inclined to access social media during a hazard event. Other TPB studies of social media behavior have included parameters beyond attitude, subjective norms, and perceived behavioral control (PBC) as predictors of intention, finding narcissism [13] and self-identity [15] to influence social media activity. The relationship between posting frequency and intention to use social media during a hurricane is tested here. H6 proposes that posting frequency positively predicts intention to access social media during a hurricane.
Hypothesis 6 (H6).
Posting frequency on social media is positively related to an intention to use social media during a hurricane.
3.7. Number of Help Posts
A help request post during a hurricane can describe a specific, urgent need (examples are shown in Figure 1), and a user who sees a large number of help-requesting posts may be more likely to respond. Hypothesis 7 states that if more requests for help are seen, an individual is more likely to offer a help response.
Hypothesis 7 (H7).
The number of help requests seen on a social network is positively related to help-responding behaviors using social media during a hurricane.
4. Method
4.1. Sample
The survey was developed and distributed to zip codes that were affected by Hurricanes Florence and Michael during the the 2018 hurricane season. All participants consented to sharing information about their social media use, hurricane experiences, and demographics. The survey consisted of 51 questions and took approximately 10 min to complete. Respondents indicated their state and then responded to a survey that specifically referenced Hurricane Florence or Michael (a generic form of the survey is shown in Appendix A). All respondents were incentivized with the chance to win a 50 USD Amazon gift card, which was awarded to one participant that was selected randomly. Responses were collected in North Carolina and Florida within three weeks of the landfall of Hurricanes Florence and Michael, respectively.
The survey was developed and distributed in rapid response to Hurricane Florence and was subsequently deployed for Hurricane Michael. The survey is shown in detail in Appendix A. In total, 442 respondents participated in the online survey, and the final sample size (N = 434) reflects the final pool of quality-controlled responses. A soft-launch survey pilot was conducted with Qualtrics for a brief, several day period directly after Hurricane Florence occurred, in which about 10% of the total sample size was collected. After this pilot, quality control measures were enforced to validate and assess the survey instrument. These included eliminations of partial responses, nonsense responses, and responses that were completed in less than one-third of the average response time. Seventy-one percent of the respondents were recruited via Qualtrics, which collected representative responses by text and email from people living within a list of targeted zip codes in North Carolina and Florida. The remaining 29% of respondents self-selected to participate after the survey was distributed by the researchers to Facebook community interest groups and Twitter.
All respondents were residents of North Carolina (233) or Florida (201) during the 2018 hurricane season. Most responses were collected from coastal North Carolina and the panhandle of Florida, which are regions that were significantly affected by Hurricanes Florence and Michael, respectively (Figure 3). Demographics are shown in Table 1. The median income ranged from 40,000 USD to 59,999 USD, and 49% of respondents held at least a college degree. Most participants were women (70%). The imbalance of the sex ratio that exists in the sample, however, reflects real-world social media demographics, where 78% of American women use at least one social media platform, compared with 65% of men [42].
Our survey of 434 individuals using social media during Hurricanes Florence and Michael is smaller in scope than the representative sample in a survey of social media use during a crisis conducted by the Red Cross in 2010 (N = 1058) [32]. However, our sample size exceeds sample size used in studies that apply the TPB for understanding social media use, including a survey of young adults assessing addictive social media behaviors (N = 233) [15], a sample of 89 Instagram users engaging in picture posting behaviors [16], and a survey of intention to participate in virtual communities (N = 165) [17]. Other limitations around the survey questions and sample are described in depth in the Discussion section.
4.2. Measures
4.2.1. Theory of Planned Behavior Variables, Intention, and Behaviors
TPB variables, including attitude (A), subjective norms (), and perceived behavioral control () were evaluated using six survey questions (Q6–Q11 in Appendix A). Each question was answered using the Likert seven-point scale, where 1 = “Strongly Agree” and 7 = “Strongly Disagree”. Cronbach’s alpha assesses internal consistency, testing whether multiple Likert scale questions reliably measure the same latent variable (e.g., attitude). Cronbach’s alpha at 0.7 and above indicates acceptable agreement [44]. We explored alternative pairings of TPB questions to test consistency and group questions. For example, when responses to the question Q8, “People generally respond to what I put on social media (my posts are usually liked, retweeted, shared)”, were evaluated against responses to “I think social media is a good resource for information”, a low alpha value (0.595) indicated that these questions do not consistently measure the same variable. Ultimately, two questions tested attitude: “I think social media is a good resource for information” (M = 2.68, SD = 1.47) and “I enjoy using social media” (M = 2.23, SD = 1.16). The two items relating to attitude have an acceptable internal consistency ( = 0.739). Subjective norms were tested by “Most people I know use social media” (M = 1.75, SD = 0.95). Perceived behavioral control was tested using the following questions: “People generally respond to my posts on social media” (M = 2.58, SD = 1.32); “I know how to use social media to find information I care about” (M = 2.19, SD = 1.23); and “I think social media is easy to use” (M = 2.02, SD = 1.08). The PBC questions have a strong internal consistency ( = 0.803).
An intention to use social media during the hurricane (I) was measured using the survey question: “Did part of your preparation for the hurricane include charging up devices (like laptop or phone) so you could access social media?” (Q14) Responses are scored in binary, with “Yes” receiving a score of 1 and “No” and “Not Sure” responses being zero.
The metric for social media help-seeking behaviors () was created from binary responses to “Did you use social media to request emergency help (trapped, rescue, or injured) during [hurricane]?” and “Did you use social media to request food, water, or supplies (including medical or fuel) that you lacked access to because of the hurricane?” (Q32 and Q36). A value of 2.0 was assigned to individuals who said “Yes” to both questions and indicated that they used social media to seek both emergency help and supplies.
Help-responding behavior was evaluated using the question “Did you respond to seeing a post for help?” (Q43). Help-responding behaviors () are assigned values for each response based on the activity reported. A value of 2.0 is assigned to highly active responses, indicated by individuals who physically went to respond to the request for help or called 9-1-1 on the behalf of the help seeker. Passive responses, including sharing or tagging others to get attention for a help request, are assigned a value of = 1.0. For responses that did not interact with the post, or did so much later via a donation, is assigned as zero. values are cumulative over all actions; for example, a respondent who went in person to help and also reposted is assigned = 3.0. The maximum possible score is five, in which the respondent would select all option choices of Q43: sharing the post (+1 point), tagging to get others’ attention (+1), calling 9-1-1 on behalf of the poster (+2), and going to help (+2).
4.2.2. Hurricane Damage Measures
Urgency (U) is a metric quantifying the severity of hurricane damages that were experienced. Urgency is scored based on the response to two questions: “Did your household experience any of the following emergency situations because of the hurricane?” and “Estimate the cost range of damages to your home during the hurricane.” The points assigned to responses are shown in Table 2. Damages are accumulated to calculate the value of U; for example, a respondent who reported both flooding in the house and a physical injury would receive . The two survey questions showed a high internal consistency ( = 0.795). For quality control in assigning urgency and behavior scores, an independent researcher reviewed one-fourth of the responses and the scoring criteria, providing scores that were in agreement with scores assigned by the authors.
4.2.3. Posting Frequency and Number of Help Posts Seen
Posting frequency was measured by the question (Q12), “On the social media platform you use most, about how often do you make a post?”. Responses were assigned a score () based on frequency: multiple times a day ( = 5.0); about once a day ( = 4.0); about once a week ( = 3.0); every few weeks ( = 2.0); and once per month ( = 1.0).
The number of help requests seen () was assessed from responses to “Did you see anyone you know asking for help on social media?” Those that reported seeing multiple help requests received two points; those who reported seeing at least one help post received one point; and no points were assigned if the respondent did not report seeing any help requests.
5. Results
5.1. Survey Results: Social Media Use
Descriptive statistics demonstrate the normative use of social media among survey respondents. Participants responded to two questions about social media use, reporting how often they check social media and how often they make posts to social media: multiple times a day (71%), about once a day (16%), about once a week (4%), every few weeks (2%), less than once a month (2%), and never (4%). The distribution of responses to these questions across demographic groups is shown in Figure 4. The nineteen respondents who indicated they never used social media were not shown subsequent questions about regular social media use. Older respondents (45–65+) reported checking social media less often, but posting more often, when compared with younger respondents (Figure 4a). Middle- and high-income respondents reported checking social media and posting to social media marginally less often compared with low-income respondents (Figure 4b). Women reported making posts more often than men (Figure 4h), and advanced degree holders post more infrequently than less educated groups (Figure 4g). The most commonly used social media platforms were Facebook (43%), Instagram (22%), Twitter (17%), and Snapchat (13%). On the platform that they use most often, 74% of participants actively use social media to make a post or share information at least once a week, and 27% of respondents post multiple times a day.
Eighty percent of respondents used some form of social media during or shortly after a hurricane. The most used platform was Facebook (Figure 5). This finding is consistent with a study reporting that Facebook is the most popular virtual network for community engagement [45]. Facebook includes features that may explain why it emerged as the primary platform respondents used during hurricanes, including a “Mark Myself Safe” feature that asks if users are safe from a hazard near their location. Sixty-nine percent of participants reported seeing at least one request for help on their social network, and Facebook was the most common platform where respondents saw a help request posted.
People used social media during the hurricanes for the following functions: to let people know they were safe (37%), to share updates from their location (32%), to seek supplies (13%), to organize help for someone else (9%), and to seek emergency help (2.5%). Emergency help is defined as help needed for being trapped, needing rescue, or experiencing an injury. Of the small percentage of respondents seeking emergency help, eight saw someone respond to or interact with their post, and the median response time to receive the help as requested in the post was reported as 30 min to one hour. Help-seekers are those who reported seeking supplies or seeking emergency help (15.5% of respondents). Responses to help are reported by platform: 90% of Twitter users who requested supplies via a social media post saw someone respond to their post, compared with 88% of Facebook users, 84% of Instagram users, and 63% of Snapchat users.
Figure 6 explores how social media was used by North Carolina respondents during Hurricane Florence and by Florida respondents in Hurricane Michael. More people cited using social media as a resource to find supplies during Hurricane Michael (42) than in Hurricane Florence (23). The most commonly selected purpose for using social media during a hurricane was to “Let others know I was safe” in both North Carolina (37.8%) and Florida (37.7%). A nonparametric Mann–Whitney U test was applied to the social media use responses to Q40 from both states to determine if social media use differed during the two hurricanes. The critical value of the U-statistic is a function of the sample size for each response to to Q40 “Complete the following sentence. During [hurricane], my household used social media to”. The results of the Mann–Whitney test indicate that in this combined study, regardless of hurricane category or location, the purposes for which people used social media during a hurricane are not statistically different.
5.2. Survey Results: Hurricane Damages
Survey questions were assessed to determine user-reported hurricane damages. Ninety percent of respondents experienced power outages during a hurricane. Hurricane Michael had greater impacts on respondents than Hurricane Florence. For Hurricane Michael, 72% of respondents reported property damages, while 59% of respondents reported property damages due to Hurricane Florence. Longer power outages were reported during Hurricane Michael (median of more than one week) than Hurricane Florence (median of four to five days). The median range of reported property damage costs associated with Hurricane Michael was from 10,000 to 50,000 USD, and less costly damages were reported during Hurricane Florence. Reported damage costs also varied by income demographics (Figure 7). In North Carolina, households with incomes greater than 80,000 USD reported more instances of expensive damages valuing at 50,000 USD or more. In Florida, the middle-income group earning between 40,000 and 80,000 USD reported the most instances of very expensive damages.
5.3. Survey Results: TPB and Regression Parameters
Attitude, engagement level, and perceived behavioral control (), such as confidence while navigating social media, vary by demographics, including age and education level. The six TPB questions contained a seven-point Likert scale to measure attitude, subjective norms, and perceived behavioral control in regard to social media use (1 = “Strongly Agree” to 7 = “Strongly Disagree”). Ninety-six percent of the total survey respondents answered TPB questions. Figure 8 shows the distribution of survey responses to questions related to attitude (Q6 and Q7), subjective norms (Q11), and perceived behavioral control (Q8, Q9, and Q10) over several key demographics. The responses to the TPB questions are generally positive, indicating positive attitude, subjective norms, and perceived behavioral control around using social media among respondents (Figure 8). The older population (65+) disagreed more than other groups that they enjoy using social media and that it is a good resource for information (Figure 8: Attitude). This age group also displayed a more negative perceived behavioral control toward using social media (Figure 8: Perceived Behavioral Control).
Survey respondents self-reported intention and help-seeking and help-responding behaviors. Three hundred and forty nine respondents indicated an intention to use social media during the hurricane. A total of 66 respondents received a help-seeking behavior () score of at least 1.0 by responding that they used social media to seek emergency help or supplies. One hundred and eighty three respondents indicated they responded to help posts seen on social media and received a score for . Ninety-one survey-takers provided only one social-media-based response, and thus received a score of 1.0 for sharing the post or tagging others to bring attention to the post. Thirty-five respondents received an score of 2.0 or above.
5.4. Correlation
Correlation was assessed to determine if the hypothesized predictors, including TPB parameters, posting frequency, urgency, and number of help posts seen, can be treated as independent variables in the subsequent regression analyses. Figure 9 displays the correlation between parameters included in regression analyses of the full set of survey responses. Correlation matrices and variance inflation factor (VIF) values (Table 3) are indicators that are used to detect multicollinearity in multiple regression analyses. Multicollinearity is very likely at correlations above 0.9 [46], and VIF values should not exceed 10 [47]. As shown in Figure 9, the highest correlated pairing is perceived behavioral control () and attitude at 0.71. New variables that are introduced in this study, including posting frequency, number of help posts seen, and urgency, are not highly correlated with the existing TPB attributes. Multicollinearity is not detected in the regression models for intention, help-seeking behavior, or help-responding behavior, as all VIF values are below 2.0 (Table 3), and the correlations between the variables in the multiple regression analyses are not indicative of multicollinearity.
5.5. Theory of Planned Behavior Regression Analysis
Path analysis was applied to explore the potential sequence of relationships linking the TPB variables to intention and intention to behaviors, as shown in Figure 2. In this approach, linear relationships are assumed to link predictors, or regression parameters, with predictands, and linear regression is used to determine the significance of regression parameters. This approach is similar to the approach taken in previously reported TPB studies [15,16,48]. Attitude, subjective norms, perceived behavioral control, and posting frequency responses were tested as predictors of intention to access social media during a hurricane. Intention and urgency of damages were tested as predictors of help-seeking behaviors, and intention, urgency, and number of help requests seen were tested as predictors of help-responsive behavior. Hypothesis testing was performed for North Carolina respondents, Florida respondents, and the combined datasets.
Table 4 presents the results of linear regression that tests attitude (A), subjective norms (), perceived behavioral control (), and posting frequency () for predicting an intention to use social media during the hurricane (I). In Florida, was the only significant predictor of an intention to use social media during the hurricane. In North Carolina, attitude, subjective norms, and posting frequency were important predictors of intention, but did not appear significant. In the combined sample, attitude, posting frequency, and were significant predictors of an intention to access social media during a hurricane. Although the R2 value is low for the overall model, goodness-of-fit is difficult to assess in a model of human behavior. The F statistic was largest for the hypothesis test on the combined sample, indicating that the regression model fits the survey data better than a model with no explanatory variables.
Urgency of hurricane damages (U) and the intention to use social media (I) were tested as predictors of the behavior of using social media for help-seeking behavior during a hurricane () (Table 5). Urgency of the damages is significant for predicting a help-seeking behavior across all three datasets, which confirms that help-seeking behaviors on social media increase with the severity of hurricane damages. In the combined sample, both intention and urgency were significant predictors of help-seeking behavior, which reinforces the TPB principle that intention is an antecedent to behavior [33].
Intention to use social media (I), urgency (U), posting frequency (), and the number of help requests seen () were tested to predict help-responding behavior (Table 6). The number of help requests seen is included in linear regression, even though it was not part of the hypothesis formulation. We used an empirical approach to evaluate if any of the antecedents of intention (attitude, perceived behavioral control, and posting frequency) could predict help-responding behaviors. This empirical analysis found that posting frequency is a significant predictor of help-responding behaviors, and it is included in the regression model reported in Table 6. Number of help requests seen () was highly significant for Florida, but not North Carolina. Posting frequency is a significant predictor of help-responding behavior for the three datasets. In the combined sample, posting frequency and the number of help requests seen were highly significant in predicting help-responding behavior.
Hypothesis Testing and Concept Model
The results of linear regression (Table 4, Table 5 and Table 6) were used to analyze hypotheses H1–H7, and are shown in Table 7. For the combined dataset, attitude, perceived behavior control, and posting frequency emerged as significant predictors of intention to access social media during a hurricane, validating H1, H3, and H6. Intention is a significant predictor of help-seeking behaviors, supporting Azjen’s theory and Hypothesis H4a. Urgency of damages also corresponds to increasing help-seeking behaviors during a hurricane, in agreement with H5a. Frequently posting on social media and seeing social media help requests were found as positively related to help-responding behaviors, supporting H7.
Only two of the hypotheses about the factors that predict social media behaviors during a hurricane were accepted in all three respondent pools (North Carolina (NC), Florida (FL), combined). Experiencing urgent damages predicts whether people seek help using social media, and the number of help posts seen predicts help-responding action (H5a and H7). Contrary to Hypothesis 5b, urgency was positively related to help-responding behaviors for both Florida and North Carolina respondents. Intention to access social media during the hurricane was not predictive of help-responding behavior in any of the respondent pools (H4b). Subsequently, we took an empirical approach, as described above, to evaluate which of the antecedents of intention predict help-responding behaviors, and found that posting frequency is a significant predictor of help-responding behaviors. Across the three datasets, only the number of social media help requests seen () was a significant predictor of help-responding behaviors (Table 7).
Figure 10 presents significant relationships identified by linear regression analysis on the concept models in Figure 2 for the combined sample of 434 respondents. The model for help-responding behavior includes the relationships that were found through hypothesis testing and empirical testing (Figure 10b). As shown in Table 7 and Figure 10, constructs of the TPB support predictability of help-seeking behaviors, but do not represent help-responding behaviors well. The lack of fit may be attributed to the design of the instrument or the dataset, which did not include as many respondents that displayed help-responding behaviors. Future research can improve the instrument and explore theories and constructs that may better explain spontaneous response to help requests during hazards and natural disasters.
6. Discussion
Social media is a resource to facilitate community resilience through self-organization and spontaneous, altruistic response to those seeking help during a hazard event. The interactive nature of social media provides information and a network that can be used to improve hurricane response. Existing studies have identified that social media can play an important role during a hazard for real-time information acquisition [4,5,6,9]. This research conducts and analyzes a survey to explore how individuals are using social media during hurricanes to seek and provide help. While other studies have specifically used the TPB to explain disaster preparedness [21] and flood risk perceptions [19,20,36], this is the first application of the TPB to explain social media use during a disaster.
The path analyses of the survey responses that are reported here partially support the TPB. We identify additional factors that affect social media help behaviors, extending the TPB to better describe help-seeking and help-responding behaviors. In the full respondent pool, attitude and perceived behavioral control predicted intention to access social media, and intention significantly predicted behavior to seek help on social media. Here, we propose the behavior of actively engaging on social media, or posting frequently, as a new extension of the TPB. Frequent social media activity was identified as a significant predictor of intention to access social media. This research evaluates how damages affect help-seeking and help-responding behaviors. The hurricane damages reported include extensive power outages in both storm events, and property damages amounting to more than 1000 USD were experienced by 72% of Floridan respondents and 59% of North Carolinian respondents. Approximately half of the respondents who reported receiving hurricane damages estimated those damages at 10,000 USD or more. Urgent hurricane damages are a significant predictor of help-seeking behavior. An intention to access social media was not found as a significant predictor for help-responding behaviors. Subsequently, the variables that predict intention were tested, and posting frequency, or general social media activity level, were found to significantly influence help-responding behaviors. Help-responding behavior was also affected by the number of help posts seen by the responder, and those who saw a higher percentage of their network reaching out for help were more likely to respond. In the combined pool of responses, intention was a predictor of help-seeking behavior, in accordance with the TPB and related literature [15,16,18].
Important survey insights about social media use include that the most used platform was Facebook, and the most common use of social media during the hurricane was to mark oneself as safe. These results corroborate results of other studies reporting that Facebook is the most frequently cited platform during hazards, and that Facebook is a key platform to post safety information [32]. Descriptions of how social media is being used during a hazard event and definitions of people’s social media behaviors during disasters are needed to capitalize on these platforms as a hazard response tool. An intention to access social media during the hurricane was indicated by 80% of survey respondents, demonstrating importance of connectedness and real-time information for disaster planning. In all, 17.5% of respondents reported using social media to seek help, with needs including seeking food, water, and medical supplies or requesting emergency help while trapped. Nearly half of respondents (42%) indicated responding to help posts by sharing, reposting, calling for help, or even physically going to help the poster. Reports of these behaviors indicate the two-way dialogue forming on social media between help-seekers and responders and suggest interesting community-led hazard response dynamics.
Social media can be a powerful tool for community engagement, but previous studies note inequities, such as communities with lower levels of unemployment engaging less on virtual platforms [45]. In this survey, there is marginal difference among different groups in two measures of social media activity: how often social media is checked and how often posts are made (Figure 4). Older people may not benefit from emergency help that is available via social media, as survey results indicate they check social media marginally less often. Older people post more, so they could be instrumental in reposting, which increases resilience of a community overall. The frequency of checking social media is the same regardless of education level, although those with advanced degrees post less often. On average, women and men reported checking social media just as often, and women make posts more often. These demographic trends are important to consider, as hazard planning that incorporates social media requires knowledge of which groups may be neglected due to their presence on social media. Further research is needed to explore ways of engaging more households across social media to ensure that community resilience is improved for underserved groups. Social media insights can be socioeconomically skewed and can lack spatial context, as only three percent of all tweets are geotagged [50]. A lack of geolocated data can create unnecessary difficulties in help and rescue efforts; however, users may be reluctant to share location data due to privacy concerns. New platforms for sharing and protecting data are needed to mitigate emergencies while protecting security and privacy.
6.1. Limitations
The survey instrument was developed, briefly piloted, and deployed in rapid response to the 2018 Hurricane Florence. The survey relies on respondents’ memories to self-report their hurricane damages and subsequent behaviors. The survey was developed quickly to ensure that distribution began within three weeks of the landfall of Hurricane Florence to preserve the accuracy of respondents’ recall. The study was expanded to include Hurricane Michael, which occurred shortly after Florence. Due to the time-sensitive nature of data collection, the survey instrument was tested to a limited degree, and some questions should be improved for future distribution. For example, the measure testing , “Did you see anyone you know asking for help regarding [hurricane] on social media?” (Q41) limits the participants’ answers to the number of posts published by users they are acquainted with and excludes help requests that may have been visible from more distant connections. Potential response bias could be mitigated by removing the phrase “you know” for future applications of the survey. The bias introduced by this question, however, is not considered as significant, as the response choices do not ask for respondents to report specific numbers of posts, but rather an estimate of the number of posts.
The design of the survey questions may also contribute to some of the findings in this research that did not support the TPB. Subjective norms are a core component of the TPB, but were not significant in predicting intention in the combined study, and a weakness of the survey is that subjective norms were tested with only one question. Additional survey questions could improve the testing of the importance of subjective norms. In addition, other questions could be developed to define attitude and perceived behavioral control to reduce a slight correlation between these two parameters. Responses to questions about providing help to others may be inflated due to the self-reported nature of collecting responses. Social desirability bias is a documented trend in which people tend to portray themselves as good persons willing to help others in a written survey [51]. Strategies such as an indirect line of questioning around responsive behaviors and providing multiple-answer choices were used to mitigate this bias [51]. However, the behavior data in this study were self-reported by the survey respondents, with repercussions on the reliability and validity of the questionnaire. Ideally, behavioral information could be corroborated with another source, such as records of respondents’ social media activity.
In this study, all final concept models had low R2 values, indicating that model fit could be improved and that other explanatory variables underlying intention and behaviors exist. There are limits to how well the TPB variables—including attitude, subjective norms, and PBC—alone can explain actual decision-making, and criticisms of the TPB are that it does not include unconscious influences of behavior, like fear, which may be a significant factor during a hazard event [52]. Not all predictors of intention and behavior are consistent among the North Carolina, Florida, and combined response pools, and additional explanatory variables may be important in understanding behaviors. For example, residents of Panama City, FL may have more experience with hurricanes than those of New Bern, NC, and decisions around seeking and providing help may vary based on these experiences. Hurricane Florence had a lengthy approach period during which it weakened to a Category 1 hurricane, and it moved sluggishly across North Carolina once it made landfall, resulting in record-breaking rainfall. Michael was the strongest storm of the season and made landfall as a Category 5 hurricane with high wind speeds. These dynamics affect power outages, rates of damage, and flooding, which can affect the ability and propensity of individuals to use social media to seek help. Additional location-specific variables may be important to explore in future surveys around social media use during hurricanes.
Social media has limitations in emergency response during hazards, and social media may be a less trusted information source than traditional news media [31]. The scope of this work does not consider misinformation, which may be important in studies of information diffusion around a hazard. For example, Du et al. found that evacuation rates were lower when social media was considered as more influential than news broadcasts in an agent-based model of flood evacuation processes [37]. The survey instrument used in this research asks several questions about how people sought rescue and their use of 9-1-1 (: Q22–25). These questions, however, had a very poor response rate. Among Hurricane Florence respondents, 55 people reported experiencing an emergency, and the vast majority reported flooding in the home as the emergency type. Across Hurricane Michael respondents, 56 reported emergencies, which were reported primarily as flooding issues and some wind damage. Across both hurricanes, however, only eight respondents reported calling 9-1-1. In Hurricane Michael, all respondents who called 9-1-1 reported needing water rescue or being trapped on upper floors, roofs, or outside during a flood. Issues that resulted in calling 9-1-1 during Florence included flooding in the home, flooding in the business, physical injury, and needing water rescue. When asked specifically about needing emergency help, 12 respondents reported they used social media to find this help, more than those who reported calling 9-1-1, but by a very small, inconclusive margin. Among this small sample size, response time from social media was slower than 9-1-1, and the median satisfaction level with the help received from social media was slightly lower than that for the help received from 9-1-1. More respondents used social media to seek non-emergency help, such as acquiring essential supplies, evacuation information, storm updates, or road conditions.
6.2. Contributions and Future Work
The findings of this work indicate that in a combined sample of 434 individuals experiencing the effects of hurricanes Florence and Michael, attitude, perceived behavioral control, and posting frequency under normal circumstances on social media can predict whether people intend to use social media during a hurricane. Additionally, urgency of damages experienced and intention to use social media are predictive of whether people use social media to seek help. The TPB was not supported for explaining help-responding behaviors. Instead, frequency of posting to social media and number of help posts seen are important parameters to predict help-responding social media behaviors during hazard. The survey instrument and responses from this study have been made publicly available. The survey instrument captures perceptions about social media, reports of hurricane damages, and social media use behaviors; with refinement, it can be used in applications for other hurricanes or hazard types.
The sample of behavioral data during Hurricanes Florence and Michael collected could provide valuable insight to emergency managers who are developing approaches to communicate with the public about hurricanes. Additionally, the results indicated differences by state in the intention predictors. Attitude and subjective norms toward social media were significant drivers of intention in North Carolina, but not Florida. in using social media was related to intention in Florida but not North Carolina. Although our discussion focuses on the combined sample model due to goodness of fit, our results imply that specific storm forecasts, awareness around hurricanes, risk perception, and other local factors can affect intentions to use social media during a hurricane. Exploring additional explanatory variables and controlling for spatial fixed effects are important next steps in future work to develop a widely applicable model of social media help behaviors during hurricanes.
Finally, the relationships identified by this research can be used to inform new models quantifying community resilience resulting from social media behaviors. Ongoing research is applying agent-based modeling to dynamically simulate help-seeking and responding behaviors. Although we did not identify a relationship between subjective norms around social media and how people intend to use social media during a hurricane, our results do not discount the documented importance of social capital in building community disaster resilience [53]. There are many types of social capital provided by social media, such as creating bonds between close groups, bridges connecting acquaintances, and dialogue between governing agencies and constituents [53]. An agent-based modeling approach can represent peer-to-peer interactions among individuals and can simulate social networks of different size, linkage, and connectedness, encompassing social capital aspects beyond the norms around everyday social media use. The coefficients for the significant behavioral predictors identified in this study can be used to inform rules for how hypothetical communities of agents might behave during a simulated hurricane (Figure 10). By applying behavioral theory, surveys, and simulation to understand the motivations of help behaviors on social media, this research and follow-on work curates information that can help emergency managers and the public capitalize on the potential of social media as a hurricane response tool.
7. Conclusions
Social media is a virtual platform by which people can seek relief or respond and help during a crisis event. This work presents data about social media use habits, hurricane damages, and perceptions of social media based on a survey of populations who were affected by the Hurricanes Florence and Michael in 2018. During Hurricanes Florence and Michael, there is evidence of interactions between people who needed and offered help through social media platforms, such as on Twitter. The survey responses provided demographic information, hurricane damage records, and social media perceptions. The survey results indicate widespread damages from both the hurricane events. In the two hurricane events, the purposes for which social media was used were markedly similar across all respondents, with the most common action being to notify others of their safety. We proposed and tested hypotheses about which social media perceptions and habits influence intention as well as help-seeking and help-responding behaviors on social media networks.
Social media networks have a developing role in how people perceive and react during a crisis, and these technologies can be capitalized on within the paradigm of smart, resilient cities. This research assessed how people behave on social media during hurricanes, which is not well documented or understood, with a focus on behaviors that relate to helpfulness and consequence mitigation. Path analysis of the conceptual questions about the TPB yielded insights about behaviors of seeking help and responding. By conducting this survey and analysis, important metrics about hurricane damages and social media use by demographic were collected. Posting frequency, perceived behavior control, and attitude are important indicators of an intention to seek help from a social network. Intention and the presence of urgent hurricane damages influence the behavior of seeking help from the social network. An important contribution of this work is that posting frequency and the number of requests for help seen are found as antecedents of help-responding behavior. Although regression analyses partially supported the TPB, there are limitations in the use of behavioral theories to predict human behaviors. The results provide empirical support for the application of the TPB to social media behaviors during hurricanes, as a connection between attitude, perceived behavioral control, intention, and behavior was detected. While this work focuses on empirically testing why individuals decide to seek help or respond using social media during a hurricane, further research is needed to compare social media use behaviors with traditional help-seeking behaviors, such as calling 9-1-1 or reporting to rescue agencies. Because social media allows individuals to share local information and self-organize, new dynamics in emergency response can emerge, such as rapid diffusion of information and awareness. Social media users can respond directly within their networks with speed and proximity that may be unparalleled by traditional hazard response from a limited number of external rescuers.
Author Contributions
Conceptualization, E.Z.B.; Formal analysis, M.F.D.; Methodology, M.F.D.; Writing—original draft, M.F.D.; Writing—review & editing, E.Z.B. All authors have read and agreed to the published version of the manuscript.
Funding
This research was funded by National Science Foundation Graduate Research Fellowship grant number DGE-1746939. The survey was funded by he the North Carolina State University Department of Civil, Construction, and Environmental Engineering under rapid response grant.
Acknowledgments
The authors acknowledge the Cajun Navy Foundation and CrowdRelief.net and Rob Gaudet for sharing insight. This material is based upon work supported by the National Science Foundation Graduate Research Fellowship under Grant No. DGE-1746939 and a rapid response grant from the North Carolina State University Department of Civil, Construction, and Environmental Engineering. Any opinions, findings, and conclusions or recommendations expressed in this material are those of the authors(s) and do not necessarily reflect the views of the National Science Foundation.
Conflicts of Interest
The authors declare no conflict of interest. The funders had no role in the design of the study; in the collection, analyses, or interpretation of data; in the writing of the manuscript, or in the decision to publish the results.
Data Availability Statement
The full survey instrument and desensitized responses are publicly available on Open Science Framework, a cloud storage tool, retrievable from: https://osf.io/nz96u/?view_only=c4fa3d69f0044c0984a43ef6c3c3a89a.
Appendix A. Survey Questions
Below is a generalized version of the survey instrument. Where [hurricane] is used, respondents were shown either Florence or Michael, depending on the state of residence indicated.
General Social Media Use
Q1: How frequently do you use social media?
- Multiple times in a day (1)
- About once a day (2)
- About once a week (3)
- Every few weeks (4)
- Less than once per month (5)
- Never (6)
Q2: On which of these social media platforms do you have an account? Select all which apply:
- Facebook (1)
- Twitter (2)
- Snapchat (3)
- Instagram (4)
- Zello (5)
- Prefer not to say (6)
- None (7)
Q3: About how many Facebook friends do you have?
- Between 0 and 50 (1)
- Between 50 and 100 (2)
- Between 100 and 200 (3)
- Between 200 and 300 (4)
- More than 300 (5)
- I’m not sure (6)
- Prefer not to say (7)
Q4: About how many followers do you have on Twitter?
- Between 0 and 50 (1)
- Between 50 and 100 (2)
- Between 100 and 200 (3)
- Between 200 and 300 (4)
- More than 300 (5)
- I’m not sure (6)
- Prefer not to say (7)
Q5: About how many pages are you following on Twitter?
- Between 0 and 50 (1)
- Between 50 and 100 (2)
- Between 100 and 200 (3)
- Between 200 and 300 (4)
- More than 300 (5)
- I’m not sure (6)
Q6: I think social media is a good resource for information.
- Strongly agree (1)
- Agree (2)
- Somewhat agree (3)
- Neither agree nor disagree (4)
- Somewhat disagree (5)
- Disagree (6)
- Strongly disagree (7)
Q7: I enjoy using social media.
- Strongly agree (1)
- Agree (2)
- Somewhat agree (3)
- Neither agree nor disagree (4)
- Somewhat disagree (5)
- Disagree (6)
- Strongly disagree (7)
Q8: People generally respond to what I put on social media (my posts are usually liked, retweeted, shared).
- Strongly agree (1)
- Agree (2)
- Somewhat agree (3)
- Neither agree nor disagree (4)
- Somewhat disagree (5)
- Disagree (6)
- Strongly disagree (7)
Q9: I think social media is easy to use.
- Strongly agree (1)
- Agree (2)
- Somewhat agree (3)
- Neither agree nor disagree (4)
- Somewhat disagree (5)
- Disagree (6)
- Strongly disagree (7)
Q10: I know how to use social media to find information I care about.
- Strongly agree (1)
- Agree (2)
- Somewhat agree (3)
- Neither agree nor disagree (4)
- Somewhat disagree (5)
- Disagree (6)
- Strongly disagree (7)
Q11: Most people I know use social media.
- Strongly agree (1)
- Agree (2)
- Somewhat agree (3)
- Neither agree nor disagree (4)
- Somewhat disagree (5)
- Disagree (6)
- Strongly disagree (7)
Q12: On the social media platform you use most, about how often do you make posts?
- Multiple times in a day (1)
- About once a day (2)
- About once a week (3)
- Every few weeks (4)
- Less than once per month (5)
- Not sure (6)
- Prefer not to say (7)
Q13: Which state do you live in?
- Florida (1)
- North Carolina (2)
Q14: Did part of your preparation for the hurricane include charging up devices (like laptop or phone) so you could access social media?
- Yes (1)
- No (2)
- Not sure (3)
Q15: Was your residence located in a mandatory evacuation zone during [hurricane]?
- Yes (1)
- No (2)
- Yes, at first, but the evacuation was lifted (3)
- Not sure (4)
Q16: Did your household evacuate during [hurricane]?
- Yes (1)
- No (2)
- Not sure (3)
Q17: Was your property damaged during [hurricane]?
- Yes (1)
- No (2)
Q18: Please estimate the cost of property damages your household because of [hurricane]:
- Less than 1000 USD (1)
- 1000 USD to under 10,000 USD (2)
- 10,000 to under 50,000 USD (3)
- More than 50,000 USD (4)
- Not sure (5)
Q19: Did your household lose power during [hurricane]?
- Yes (1)
- No (2)
- Not sure (3)
Q20: About how long did the power outage last?
- Less than 24 h (1)
- One day (2)
- Two to three days (3)
- Four to five days (4)
- Six to seven days (5)
- More than one week (6)
- Not sure (7)
Q21: Did your household experience any of the following emergency situations because of [hurricane]? Select all which apply:
- Water rescue (being trapped on upper floors, roof, or outside during a flood) (1)
- Trapped car/car accident (2)
- Flooding in the house (3)
- Other (please describe): (5)
- We did not experience an emergency (6)
Q22: If you reQuired water rescue, how did you let people know you needed help? Select all which apply:
- Word of mouth, shouted for help (1)
- Called 9-1-1 (2)
- Made a post to social media (3)
- Called someone I know for help (4)
- Just waited/unable to ask for help (5)
- Other (please specify): (6)
Q23: Did any members of your household call 9-1-1 regarding [hurricane]?
- Yes (1)
- No (2)
- Not sure (3)
Q24: How long did it take to receive help from 9-1-1?
- Fewer than 15 min (1)
- 15 to 30 min (2)
- 30 min to one hour (3)
- Longer than one hour (4)
- I am not sure (5)
Q25: How satisfied were you by the amount of time it took to get help via 9-1-1?
- Extremely satisfied (1)
- Somewhat satisfied (2)
- Neither satisfied nor dissatisfied (3)
- Somewhat dissatisfied (4)
- Extremely dissatisfied (5)
Q26: Did you use any social media, website, or an app during or shortly after [hurricane]?
- Yes (1)
- No (2)
- Not sure (3)
Q27: Which of these social media platforms or apps did you use related to [hurricane]? Select all that apply:
- Facebook (1)
- Twitter (2)
- Snapchat (3)
- Instagram (4)
- Zello (5)
- Whatsapp (6)
- CrowdSource Rescue (7)
- None (8)
- Prefer not to say (9)
Q28: Did you use any hashtags regarding [hurricane]? Please list any you remember using:
Q29: About how long did it take to receive a response from CrowdSource Rescue?
- Fewer than 15 min (1)
- More than 15 min but less than one hour (2)
- One to six hours (3)
- More than six hours but less than 24 h (4)
- 24 to 48 h (5)
- Three to five days (6)
- More than five days (7)
- I am not sure (8)
Q30: Did you use Zello to correspond with the Cajun Navy?
- Yes (1)
- No (2)
- Not Sure (3)
- I don’t know what Cajun Navy is (4)
Q31: About how long did it take to receive a response from Cajun Navy?
- Fewer than 15 min (1)
- More than 15 min but less than one hour (2)
- One to six hours (3)
- More than six hours but less than 24 h (4)
- 24 to 48 h (5)
- Three to five days (6)
- More than five days (7)
- I am not sure (8)
Q32: Did you use social media to request emergency help (trapped, rescue, or injured) during [hurricane]?
- Yes (1)
- No (2)
- Not sure (3)
Q33: Did anyone respond to your social media request for emergency help?
- Yes (1)
- No (2)
- Not sure (3)
Q34: How long did it take after posting the request to receive emergency help via social media?
- Fewer than 15 min (1)
- 15 to 30 min (2)
- 30 min to one hour (3)
- Longer than one hour (4)
- I am not sure but I eventually received help (5)
- I never received the help I reQuested (6)
Q35: Were you satisfied by the time it took to receive emergency help via social media?
- Extremely satisfied (1)
- Somewhat satisfied (2)
- Neither satisfied nor dissatisfied (3)
- Somewhat dissatisfied (4)
- Extremely dissatisfied (5)
Q36: Did you use social media to request food, water, or supplies (including medical or fuel) that you lacked access to because of [hurricane]?
- Yes (1)
- No (2)
- Not sure (3)
Q37: Did anyone respond to your social media request for food, water, or supplies (like medical or fuel)?
- Yes (1)
- No (2)
- Not sure (3)
Q38: How long did it take after you posted the social media request to receive food, water, or supplies?
- Less than one hour (1)
- One to six hours (2)
- More than 6 h but less than 24 h (3)
- 24–48 h (4)
- Three to five days (5)
- Six to seven days (6)
- More than one week (7)
- I am not sure how long but I did eventually receive help (8)
- I never received the supplies I reQuested (9)
Q39: Were you satisfied by the amount of time it took to receive food, water, or supplies via social media?
- Extremely satisfied (1)
- Somewhat satisfied (2)
- Neither satisfied nor dissatisfied (3)
- Somewhat dissatisfied (4)
- Extremely dissatisfied (5)
Q40: Complete the following sentence. During [hurricane], my household used social media to: Select any which apply:
- To let people know we were safe (1)
- To share what was happening at my location (like road blocked or flood area) (2)
- To organize help or rescue for someone else (3)
- Look for supplies like food water or fuel (4)
- Get emergency help (5)
- Other (Please describe): (6)
Q41: Did you see anyone you know asking for help regarding [hurricane] on social media?
- Yes, I saw at least one post asking for help (1)
- Yes, I saw multiple posts asking for help (2)
- No, I don’t remember seeing that (3)
Q42: On which social media platforms did you see people asking for help regarding [hurricane]? Select all that apply:
- Facebook (1)
- Twitter (2)
- Whatsapp (3)
- Zello (4)
- Snapchat (5)
- Other (6)
Q43: Did you respond to seeing this post for help? Select all that apply:
- Yes, I went to help them (1)
- Yes, I shared or re-posted their message on my page (2)
- Yes, I responded with tagging or hashtagging to get attention of someone who could help (3)
- Yes, I called 9-1-1 (4)
- No, I did not interact with any social media posts asking for help (5)
- Other—Please elaborate on how you responded to seeing posts for help (6)
Q44: Are there any other ways you used social media during [hurricane] that are not described here?
Q45: Were you satisfied by the availability of food, water, or medical supplies after [hurricane]?
- Extremely satisfied (1)
- Somewhat satisfied (2)
- Neither satisfied nor dissatisfied (3)
- Somewhat dissatisfied (4)
- Extremely dissatisfied (5)
Demographics
Q46: What county do you live in?
Q47: What is your sex?
- Male (1)
- Female (2)
- Prefer not to say (3)
Q48: What is the highest level of school you have completed?
- Less than high school degree (1)
- High school degree (2)
- Some college but no degree (3)
- College degree (4)
- Graduate school degree (5)
- Prefer not to say (6)
Q49: Please indicate the answer that includes your entire household income, or, prefer not to say.
- Less than 10,000 USD (1)
- 10,000–19,999 USD (2)
- 20,000–39,999 USD (3)
- 40,000–59,999 USD (4)
- 60,000–79,999 USD (5)
- 80,000–99,999 USD (6)
- More than 100,000 USD (7)
- Prefer not to say (8)
Q50: How many people, including yourself, are living in your household?
- 1 (1)
- 2 (2)
- 3 (3)
- 4 (4)
- 5 (5)
- 6 (6)
- More than 6 (7)
- Prefer not to say (8)
Q51: What is your age?
- 18–24 (1)
- 25–34 (2)
- 35–44 (3)
- 45–54 (4)
- 55–64 (5)
- 65+ (6)
- Prefer not to say (7)
References
- Hajikhani, A. Impact of Entrepreneurial Ecosystem Discussions in Smart Cities: Comprehensive Assessment of Social Media Data. Smart Cities 2020, 3, 7. [Google Scholar] [CrossRef] [Green Version]
- Doran, D.; Gokhale, S.; Dagnino, A. Human sensing for smart cities. In Proceedings of the 2013 IEEE/ACM International Conference on Advances in Social Networks Analysis and Mining, ASONAM 2013, Niagara Falls, ON, Canada, 25–28 August 2013; Association for Computing Machinery: New York, NY, USA, 2013; pp. 1323–1330. [Google Scholar] [CrossRef]
- Liu, B.F.; Fraustino, J.D.; Jin, Y. Social Media Use During Disasters. Commun. Res. 2016, 43, 626–646. [Google Scholar] [CrossRef] [Green Version]
- Fraustino, J.; Daisy, B.; Liu, Y.J. Social Media Use during Disasters: A Review of the Knowledge Base and Gaps; Technical Report; US Department of Homeland Security: College Park, MD, USA, 2012.
- Guan, X.; Chen, C. Using social media data to understand and assess disasters. Nat. Hazards 2014, 74, 837–850. [Google Scholar] [CrossRef]
- Houston, J.B.; Hawthorne, J.; Perreault, M.F.; Park, E.H.; Goldstein Hode, M.; Halliwell, M.R.; Turner McGowen, S.E.; Davis, R.; Vaid, S.; McElderry, J.A.; et al. Social media and disasters: A functional framework for social media use in disaster planning, response, and research. Disasters 2015, 39, 1–22. [Google Scholar] [CrossRef]
- Department of Homeland Security (DHS). System Assessment and Validation for Emergency Responders (SAVER) Innovative Uses of Social Media in Emergency Management. 2013. Available online: http://xxx.lanl.gov/abs/https://www.dhs.gov/sites/default/files/publications/Social-Media-EM_0913-508_0.pdf (accessed on 19 February 2020).
- Varghese, R.; Yadukrishnan, T.A. Role of social media during Kerala floods 2018. Libr. Philos. Pract. e-J. 2019. Available online: https://digitalcommons.unl.edu/libphilprac/2754/ (accessed on 28 August 2020).
- Dong, H.; Halem, M.; Zhou, S. Social Media Data Analytics Applied to Hurricane Sandy. In Proceedings of the 2013 International Conference on Social Computing, Alexandria, VA, USA, 8–14 September 2013; pp. 963–966. [Google Scholar] [CrossRef]
- Kumar, D.; Ukkusuri, S.V. Enhancing demographic coverage of hurricane evacuation behavior modeling using social media. J. Comput. Sci. 2020, 45, 101184. [Google Scholar] [CrossRef]
- Martinez-Alvarez, F.; Morales-Esteban, A. Big data and natural disasters: New approaches for spatial and temporal massive data analysis. Comput. Geosci. 2019, 129, 38–39. [Google Scholar] [CrossRef]
- Wang, Z.; Ye, X. Social media analytics for natural disaster management. Int. J. Geogr. Inf. Sci. 2018, 32, 49–72. [Google Scholar] [CrossRef]
- Kuo, F.Y.; Young, M.L. Predicting knowledge sharing practices through intention: A test of competing models. Comput. Hum. Behav. 2008, 24, 2697–2722. [Google Scholar] [CrossRef]
- Buhmann, A.; Brønn, P.S. Applying Ajzen’s theory of planned behavior to predict practitioners’ intentions to measure and evaluate communication outcomes. Corp. Commun. Int. J. 2018, 23, 377–391. [Google Scholar] [CrossRef]
- Pelling, E.L.; White, K.M. The Theory of Planned Behavior Applied to Young People’s Use of Social Networking Web Sites. CyberPsychology Behav. 2009, 12, 755–759. [Google Scholar] [CrossRef] [Green Version]
- Kim, E.; Lee, J.A.; Sung, Y.; Choi, S.M. Predicting selfie-posting behavior on social networking sites: An extension of theory of planned behavior. Comput. Hum. Behav. 2016, 62, 116–123. [Google Scholar] [CrossRef]
- Lin, H.F. Understanding Behavioral Intention to Participate in Virtual Communities. CyberPsychology Behav. 2006, 9, 540–547. [Google Scholar] [CrossRef] [PubMed]
- Compeau, D.R.; Higgins, C.A. Computer Self-Efficacy: Development of a Measure and Initial Test. MIS Q. 1995, 19, 189. [Google Scholar] [CrossRef] [Green Version]
- Riad, J.K.; Norris, F.H. Hurricane Threat and Evacuation Intentions: An Analysis of Risk Perception, Preparedness, Social Influence, and Resources; Disaster Research Center, University of Delaware: Newark, DE, USA, 1998. [Google Scholar]
- Kellens, W.; Zaalberg, R.; De Maeyer, P. The Informed Society: An Analysis of the Public’s Information-Seeking Behavior Regarding Coastal Flood Risks. Risk Anal. 2012, 32, 1369–1381. [Google Scholar] [CrossRef] [Green Version]
- Najafi, M.; Ardalan, A.; Akbarisari, A.; Noorbala, A.A.; Elmi, H. The Theory of Planned Behavior and Disaster Preparedness. PLoS Curr. 2017, 9. [Google Scholar] [CrossRef]
- Kossin, J.P. A global slowdown of tropical-cyclone translation speed. Nature 2018, 558, 104–107. [Google Scholar] [CrossRef]
- National Academies of Sciences, Engineering, and Medicine. Integrating Social and Behavioral Sciences Within the Weather Enterprise; The National Academies Press: Washington, DC, USA, 2018. [Google Scholar] [CrossRef]
- von Richthofen, A.; Tomarchio, L.; Costa, A. Identifying Communities within the Smart-Cultural City of Singapore: A Network Analysis Approach. Smart Cities 2019, 2, 5. [Google Scholar] [CrossRef] [Green Version]
- Lim, C.; Kim, K.J.; Maglio, P. Smart cities with big data: Reference models, challenges, and considerations. Cities 2018, 82. [Google Scholar] [CrossRef]
- Ajzen, I. The theory of planned behavior: Frequently asked questions. Hum. Behav. Emerg. Technol. 2020. [Google Scholar] [CrossRef]
- Molinillo, S.; Anaya-Sánchez, R.; Morrison, A.M.; Coca-Stefaniak, J.A. Smart city communication via social media: Analysing residents’ and visitors’ engagement. Cities 2019, 94, 247–255. [Google Scholar] [CrossRef]
- Alkhatib, M.; El Barachi, M.; Shaalan, K. An Arabic social media based framework for incidents and events monitoring in smart cities. J. Clean. Prod. 2019, 220, 771–785. [Google Scholar] [CrossRef]
- Ning, H.; Li, Z.; Hodgson, M.E.; Wang, C.S. Prototyping a Social Media Flooding Photo Screening System Based on Deep Learning. ISPRS Int. J. Geo-Inf. 2020, 9, 104. [Google Scholar] [CrossRef] [Green Version]
- Berglund, E.Z.; Monroe, J.G.; Ahmed, I.; Noghabaei, M.; Do, J.; Pesantez, J.E.; Khaksar Fasaee, M.A.; Bardaka, E.; Han, K.; Proestos, G.T.; et al. Smart Infrastructure: A Vision for the Role of the Civil Engineering Profession in Smart Cities. J. Infrastruct. Syst. 2020, 26, 03120001. [Google Scholar] [CrossRef]
- Burger, J.; Gochfeld, M.; Jeitner, C.; Pittfield, T.; Donio, M. Trusted information sources used during and after superstorm sandy: TV and radio were used more often than social media. J. Toxicol. Environ. Health Part A Curr. Issues 2013, 76, 1138–1150. [Google Scholar] [CrossRef] [PubMed] [Green Version]
- American Red Cross. Social Media in Disasters and Emergencies; Technical Report; The American Red Cross: Washington, DC, USA, 2010. [Google Scholar]
- Ajzen, I. From Intentions to Actions: A Theory of Planned Behavior. In Action Control; Springer: Berlin/Heidelberg, Germany, 1985; pp. 11–39. [Google Scholar] [CrossRef]
- Ajzen, I. The theory of planned behavior. Organ. Behav. Hum. Decis. Process. 1991, 50, 179–211. [Google Scholar] [CrossRef]
- Venkatesh, V.; Morris, M.; Davis, G.; David, F. User acceptance of information technology: Toward a unified view. MIS Q. 2003, 27, 425–478. [Google Scholar] [CrossRef] [Green Version]
- Pearson, M.; Hamilton, K. Investigating driver willingness to drive through flooded waterways. Accid. Anal. Prev. 2014, 72, 382–390. [Google Scholar] [CrossRef] [Green Version]
- Du, E.; Cai, X.; Sun, Z.; Minsker, B. Exploring the Role of Social Media and Individual Behaviors in Flood Evacuation Processes: An Agent-Based Modeling Approach. Water Resour. Res. 2017, 53, 9164–9180. [Google Scholar] [CrossRef] [Green Version]
- Ajzen, I.; Driver, B.L. Application of the Theory of Planned Behavior to Leisure Choice. J. Leis. Res. 1992, 24, 207–224. [Google Scholar] [CrossRef]
- Salonen, A.O.; Åhlberg, M. Obstacles to sustainable living in the Helsinki Metropolitan Area. Sustain. Cities Soc. 2013, 8, 48–55. [Google Scholar] [CrossRef]
- Becker, J.S.; Taylor, H.L.; Doody, B.J.; Wright, K.C.; Gruntfest, E.; Webber, D.; Becker, J.S.; Taylor, H.L.; Doody, B.J.; Wright, K.C.; et al. A Review of People’s Behavior in and around Floodwater. Weather. Clim. Soc. 2015, 7, 321–332. [Google Scholar] [CrossRef]
- Sun, N.; Rau, P.P.L.; Ma, L. Understanding lurkers in online communities: A literature review. Comput. Hum. Behav. 2014, 38, 110–117. [Google Scholar] [CrossRef]
- Demographics of Social Media Users and Adoption in the United States Pew Research Center. Available online: https://www.pewresearch.org/internet/fact-sheet/social-media (accessed on 20 February 2020).
- “Counties” [basemap]. Hazard Exposure Map 09152018 and Hazard Exposure Map 10102018. Owner: FEMAMAC Esri ArcGIS Online. Available online: azardExposureMap10102018 (accessed on 20 October 2019).
- Taber, K.S. The Use of Cronbach’s Alpha When Developing and Reporting Research Instruments in Science Education. Res. Sci. Educ. 2018, 48, 1273–1296. [Google Scholar] [CrossRef]
- Alvarez, L.; Borsi, K.; Rodrigues, L. The role of social network analysis on participation and placemaking. Sustain. Cities Soc. 2017, 28, 118–126. [Google Scholar] [CrossRef]
- Dohoo, I.R.; Ducrot, C.; Fourichon, C.; Donald, A.; Hurnik, D. An overview of techniques for dealing with large numbers of independent variables in epidemiologic studies. Prev. Vet. Med. 1997, 29, 221–239. [Google Scholar] [CrossRef]
- Lin, F.J. Solving multicollinearity in the process of fitting regression model using the nested estimate procedure. Qual. Quant. 2008, 42, 417–426. [Google Scholar] [CrossRef]
- Straus, J.; Chang, H.; Hong, C.Y. An exploratory path analysis of attitudes, behaviors and summer water consumption in the Portland Metropolitan Area. Sustain. Cities Soc. 2016, 23, 68–77. [Google Scholar] [CrossRef]
- Jaccard, J.; Turrisi, R.; Wan, C.K. Interaction Effects in Multiple Regression; Sage Publications: Thousand Oaks, CA, USA, 1990; p. 95. [Google Scholar]
- Kontokosta, C.E.; Malik, A. The Resilience to Emergencies and Disasters Index: Applying big data to benchmark and validate neighborhood resilience capacity. Sustain. Cities Soc. 2018, 36, 272–285. [Google Scholar] [CrossRef]
- Fisher, R.J. Social Desirability Bias and the Validity of Indirect Questioning. J. Consum. Res. 1993, 20, 303–315. [Google Scholar] [CrossRef]
- Sheeran, P.; Gollwitzer, P.M.; Bargh, J.A. Nonconscious processes and health. Health Psychol. 2013, 32, 460–473. [Google Scholar] [CrossRef]
- Aldrich, D.P.; Meyer, M.A. Social Capital and Community Resilience. Am. Behav. Sci. 2015, 59, 254–269. [Google Scholar] [CrossRef]
Publisher’s Note: MDPI stays neutral with regard to jurisdictional claims in published maps and institutional affiliations. |
Figure 1.
Sample of tweets mined during Hurricane Florence.

Figure 2.
Conceptual models for (a) help-seeking behavior and (b) help-responding behavior.

Figure 3.
Distribution of survey responses in hazard regions of Florence and Michael. At left, survey responses by county in North Carolina (top) and Florida (bottom). Dark counties have higher response rates. At right, the Federal Emergency Management Agency product displaying highest community exposure to surge, wind, and riverine flooding in areas of the Carolinas during Hurricane Florence (layer produced 15 September 2018) and in Florida during Hurricane Michael (layer produced 10 October 2018) [43]

Figure 4.
Social media use and posting frequency by survey demographic. Vertical axes are: 0—never; 1—less than once per month; 2—every few weeks; 3—about once a week; 4—once a day; and 5—multiple times a day. Low income is reported as under 40,000 USD; middle income is reported as 40,000–80,000 USD; and high income is reported as more than 80,000 USD. Responses to social media use frequency are reported for (a) age, (b) income, (c) education, and (d) gender. Responses to posting frequency are reported by (e) age, (f) income, (g) education, (h) gender.

Figure 5.
Number of respondents who used social media during a hurricane, by platform. Respondents may select more than one platform.
Figure 5.
Number of respondents who used social media during a hurricane, by platform. Respondents may select more than one platform.

Figure 6.
Reported uses of social media during hurricane events. Responses are reported for Q40 “Complete the following sentence. During [hurricane], my household used social media to?”.
Figure 6.
Reported uses of social media during hurricane events. Responses are reported for Q40 “Complete the following sentence. During [hurricane], my household used social media to?”.

Figure 7.
Reported costs of hurricane damage by income range. Low income is reported as under 40,000 USD; middle income is reported as 40,000–80,000 USD; and high income is reported as more than 80,000 USD. (a) is for responses from Hurricane Florence and (b) is for responses from Hurricane Michael.

Figure 8.
Responses to Theory of Planned Behavior (TPB) categories, shown with distribution across age and income. Low income is reported as under 40,000 USD; middle income is reported as 40,000–80,000 USD; and high income is reported as more than 80,000 USD.
Figure 8.
Responses to Theory of Planned Behavior (TPB) categories, shown with distribution across age and income. Low income is reported as under 40,000 USD; middle income is reported as 40,000–80,000 USD; and high income is reported as more than 80,000 USD.

Figure 9.
Correlation matrix among the regression parameters included in the behavior models.

Figure 10.
Linear regression models predicting (a) help-seeking and (b) help-responding behaviors using social media during hurricanes for the combined sample of 434 respondents. Arrows are labeled with the unstandardized regression coefficient; * indicates significance at the p = 0.05 level and ** indicates significance at the p = 0.005 level.


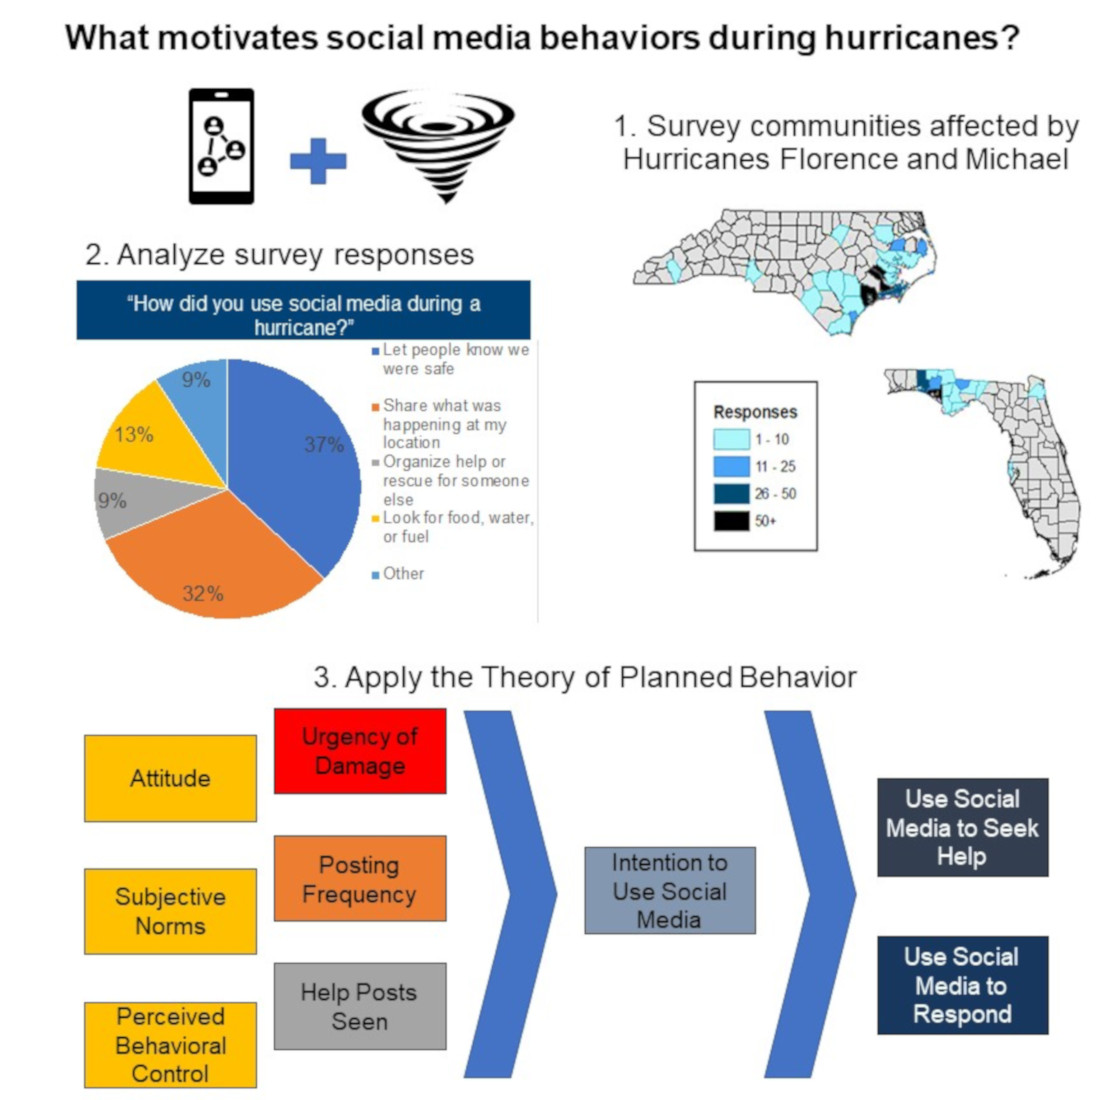
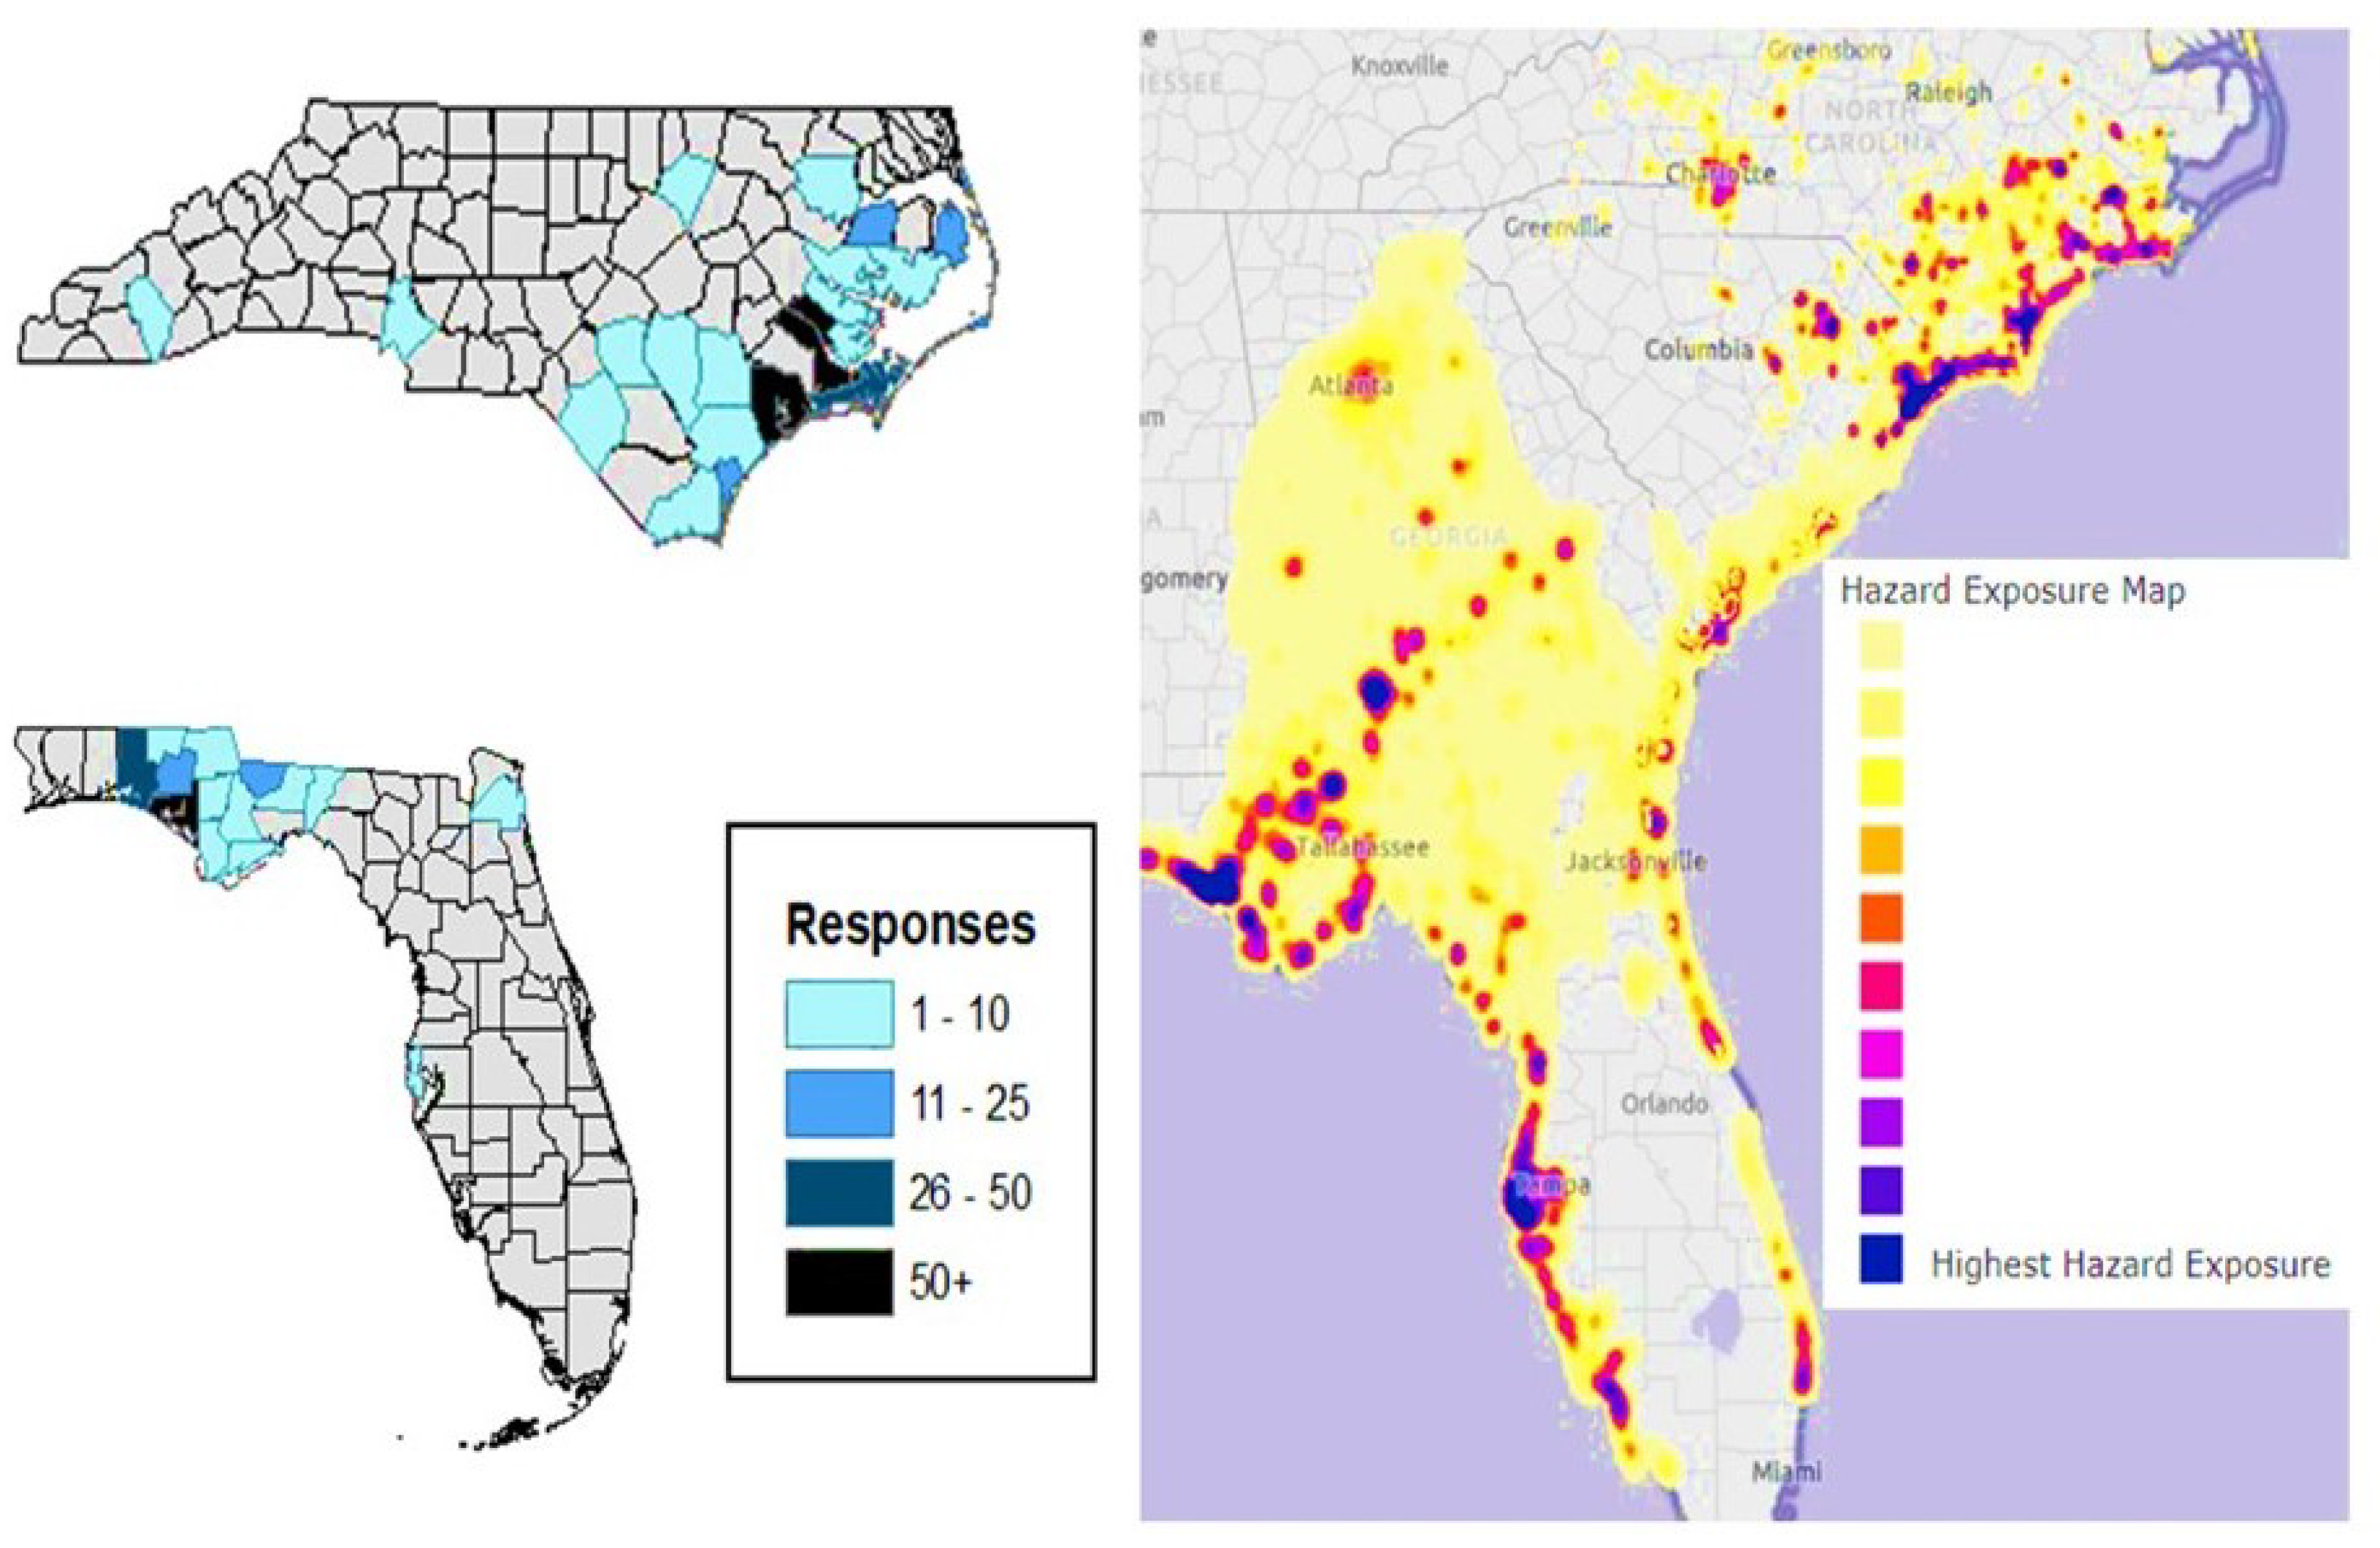
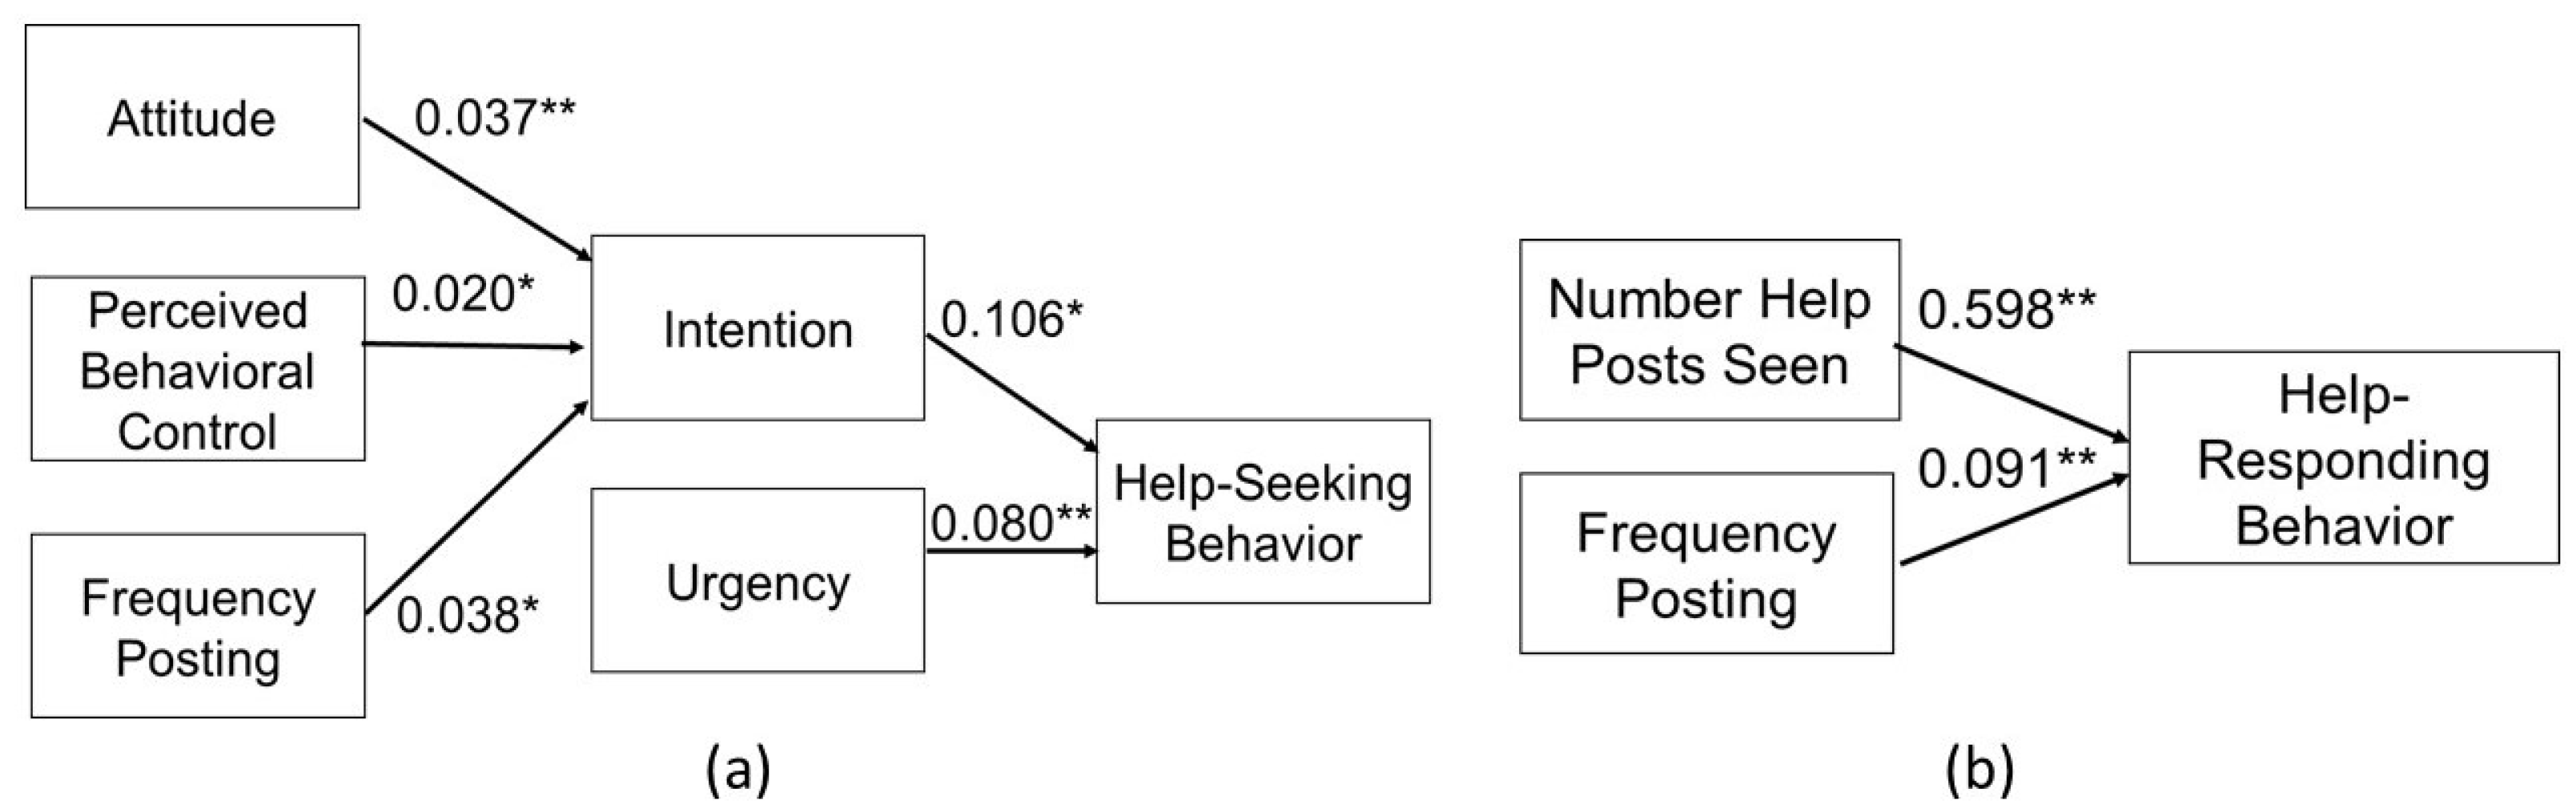
Table 1.
Respondent demographics.
| Gender | North Carolina (233) | Florida (201) | Combined Sample (434) | |
|---|---|---|---|---|
| Male | 30.90% | 27.86% | 29.49% | |
| Female | 69.10% | 72.14% | 70.51% | |
| Survey Age Group | ||||
| 18–24 | 11.59% | 6.97% | 9.45% | |
| 25–34 | 14.16% | 16.92% | 15.44% | |
| 35–44 | 16.74% | 16.42% | 16.59% | |
| 45–54 | 18.03% | 14.93% | 16.59% | |
| 55–64 | 20.60% | 23.38% | 21.89% | |
| 65+ | 18.88% | 20.90% | 19.82% | |
| Level of Education | ||||
| Less than high school degree | 0.86% | 3.98% | 2.3% | |
| High school degree | 17.17% | 22.39% | 19.59% | |
| Some college | 31.33% | 25.37% | 28.57% | |
| College degree | 36.48% | 29.85% | 33.41% | |
| Graduate School degree | 13.30% | 18.41% | 15.67% | |
| Income Group | ||||
| Under 10,000 USD | 8.15% | 4.98% | 6.68% | |
| 10,000–29,000 USD | 6.01% | 9.95% | 7.83% | |
| 20,000–39,000 USD | 21.03% | 26.37% | 23.50% | |
| 40,000–59,000 USD | 18.03% | 12.44% | 15.44% | |
| 60,000–79,000 USD | 12.45% | 12.94% | 12.67% | |
| 80,000–99,000 USD | 9.01% | 8.46% | 8.76% | |
| 100,000+ USD | 15.02% | 18.41% | 16.59% | |
| Prefer not to say | 10.30% | 6.47% | 8.53% | |
Table 2.
Urgency scores (U) associated with survey responses.
| Survey Question | Response | Points Assigned toward Urgency Score (U) |
|---|---|---|
| Please estimate the cost of property damages your household because of [hurricane]: | 1000 to under 10,000 USD | 1 |
| 10,000 to under 50,000 USD | 2 | |
| More than 50,000 USD | 3 | |
| Not sure | 0 | |
| Did your household experience any of the following emergency situations because of [hurricane]: | Water rescue | 2 |
| Trapped in car/ Car accident | 1 | |
| Flooding in the house | 1 | |
| No emergency | 0 | |
| Other | 1–3, Text analyzed and coded for severity (e.g., some water = 1; wind, roof damages = 2; injury and fires = 3) |
Table 3.
Variance inflation factor (VIF) for each parameter in regression analyses for the combined sample. No values of VIF exceed 10, which is the threshold that indicates multicollinearity [47].
Table 3.
Variance inflation factor (VIF) for each parameter in regression analyses for the combined sample. No values of VIF exceed 10, which is the threshold that indicates multicollinearity [47].
| Model | Regression Parameter | VIF |
|---|---|---|
| Intention Model | A | 1.916 |
| 1.416 | ||
| PBC | 1.991 | |
| SN | 1.354 | |
| Help-Seeking Model | U | 1.004 |
| I | 1.004 | |
| Help-Responding Model | 1.131 | |
| 1.182 | ||
| U | 1.007 | |
| I | 1.131 |
Table 4.
Regression results for intention for each state and the combined sample. All coefficients are unstandardized [49].
Table 4.
Regression results for intention for each state and the combined sample. All coefficients are unstandardized [49].
| Dataset | Independent Variables | Unstandardized Coefficient (B) | Standard Error | p-Value |
|---|---|---|---|---|
| Florida (N = 201, R2 = 0.10, F = 5.02) | A | 0.011 | 0.016 | 0.483 |
| 0.003 | 0.034 | 0.927 | ||
| 0.030 | 0.013 | 0.027 * | ||
| 0.028 | 0.023 | 0.231 | ||
| North Carolina (N = 233, R2 = 0.24, F = 16.57) | A | 0.056 | 0.014 | 0.000 ** |
| −0.056 | 0.028 | 0.045 * | ||
| 0.013 | 0.010 | 0.212 | ||
| 0.048 | 0.021 | 0.021 * | ||
| Combined Sample (N = 434, R2 = 0.17, F = 19.82) | A | 0.037 | 0.010 | 0.000 ** |
| −0.030 | 0.022 | 0.165 | ||
| 0.020 | 0.008 | 0.013 * | ||
| 0.038 | 0.015 | 0.014 * |
* indicates significance at the p = 0.05 level; ** indicates significance at the p = 0.005 level.
Table 5.
Regression results for help-seeking behavior for each state and the combined sample. All coefficients are unstandardized [49].
Table 5.
Regression results for help-seeking behavior for each state and the combined sample. All coefficients are unstandardized [49].
| Dataset | Independent Variables | Unstandardized Coefficient (B) | Standard Error | p-Value |
|---|---|---|---|---|
| Florida (N = 201, R2 = 0.10, F = 11.5) | I | 0.112 | 0.089 | 0.191 |
| U | 0.078 | 0.018 | 0.000 ** | |
| North Carolina (N = 233, R2 = 0.48, F = 34.9) | I | 0.103 | 0.054 | 0.058 |
| U | 0.120 | 0.015 | 0.000 ** | |
| Overall (N = 434, R2 = 0.12, F = 29.5) | I | 0.106 | 0.050 | 0.034 * |
| U | 0.080 | 0.011 | 0.000 ** |
* indicates significance at the p = 0.05 level; ** indicates significance at the p = 0.005 level.
Table 6.
Regression results for help-responding behavior for each state and the combined sample. All coefficients are unstandardized [49].
Table 6.
Regression results for help-responding behavior for each state and the combined sample. All coefficients are unstandardized [49].
| Dataset | Independent Variables | Unstandardized Coefficient (B) | Standard Error | p-Value |
|---|---|---|---|---|
| Florida (N = 201, R2 = 0.210, F = 12.057) | U | 0.081 | 0.019 | 0.000 ** |
| I | −0.047 | 0.097 | 0.627 | |
| 0.143 | 0.039 | 0.000 ** | ||
| 0.070 | 0.028 | 0.013 * | ||
| North Carolina (N = 233, R2 = 0.126, F = 8.68) | U | 0.070 | 0.014 | 0.000 ** |
| I | 0.037 | 0.070 | 0.599 | |
| 0.063 | 0.031 | 0.000 ** | ||
| 0.021 | 0.020 | 0.297 | ||
| Overall (N = 434, R2 = 0.367, F = 58.77) | U | 0.041 | 0.078 | 0.052 |
| I | −0.018 | 0.108 | 0.870 | |
| 0.598 | 0.045 | 0.000 ** | ||
| 0.091 | 0.030 | 0.003 ** |
* indicates significance at the p = 0.05 level; ** indicates significance at the p = 0.005 level.
Table 7.
Results from hypothesis and empirical testing.
| Result | NC Dataset | FL Dataset | Combined |
|---|---|---|---|
| H1. A is positively related to I. | Accepted | Rejected | Accepted |
| H2. is positively related to I. | Accepted | Rejected | Rejected |
| H3. is positively related to I. | Rejected | Accepted | Accepted |
| H4a. I is positively related to . | Rejected | Rejected | Accepted |
| H4b. I is positively related to . | Rejected | Rejected | Rejected |
| H5a. U positively related to . | Accepted | Accepted | Accepted |
| H5b. U is negatively related to . | Rejected * | Rejected * | Rejected ** |
| H6. is positively related to I. | Accepted | Rejected | Accepted |
| H7. is positively related to . | Accepted | Accepted | Accepted |
| † is positively related to . | False | True | True |
* indicates U is positively related to ; ** indicates U is not significantly related to ; † indicates this result was found via empirical testing of the dataset.
© 2020 by the authors. Licensee MDPI, Basel, Switzerland. This article is an open access article distributed under the terms and conditions of the Creative Commons Attribution (CC BY) license (http://creativecommons.org/licenses/by/4.0/).
Share and Cite
MDPI and ACS Style
DiCarlo, M.F.; Berglund, E.Z. Use of Social Media to Seek and Provide Help in Hurricanes Florence and Michael. Smart Cities 2020, 3, 1187-1218. https://doi.org/10.3390/smartcities3040059
AMA Style
DiCarlo MF, Berglund EZ. Use of Social Media to Seek and Provide Help in Hurricanes Florence and Michael. Smart Cities. 2020; 3(4):1187-1218. https://doi.org/10.3390/smartcities3040059
Chicago/Turabian StyleDiCarlo, Morgan Faye, and Emily Zechman Berglund. 2020. "Use of Social Media to Seek and Provide Help in Hurricanes Florence and Michael" Smart Cities 3, no. 4: 1187-1218. https://doi.org/10.3390/smartcities3040059