
Comparative Analysis of Smart Grid Solar Integration in Urban and Rural Networks


1
UNITEN R&D Sdn. Bhd, Universiti Tenaga Nasional, Jalan Ikram-Uniten, Kajang 43000, Malaysia
2
Institute of Sustainable Energy, Universiti Tenaga Nasional, Jalan Ikram-Uniten, Kajang 43000, Malaysia
3
Centre for Research in Data Science, Universiti Teknologi Petronas, Seri Iskandar 32610, Malaysia
*
Authors to whom correspondence should be addressed.
Smart Cities 2023, 6(5), 2593-2618; https://doi.org/10.3390/smartcities6050117
Submission received: 19 July 2023
/
Revised: 18 September 2023
/
Accepted: 28 September 2023
/
Published: 30 September 2023
(This article belongs to the Special Issue Smart Cities, Smart Homes and Sustainable Built Environment)
Abstract
:Solar photovoltaic (PV) power, a highly promising renewable energy source, encounters challenges when integrated into smart grids. These challenges encompass voltage fluctuations, issues with voltage balance, and concerns related to power quality. This study aims to comprehensively analyze the implications of solar PV penetration in Malaysian power distribution networks predominantly found in urban and rural areas. To achieve this, we employed the OpenDSS 2022 and MATLAB 2022b software tools to conduct static power flow analyses, enabling us to assess the effects of solar PV integration over a wide area under two worst-case scenarios: peak-load and no-load periods. Our investigation considered voltage violations, power losses, and fault analysis relative to the power demand of each scenario, facilitating a comprehensive evaluation of the impacts. The findings of our study revealed crucial insights. We determined that the maximum allowable power for both urban and rural networks during no-load and peak-load situations is approximately 0.5 MW and 0.125 MW, respectively. Moreover, as the percentage of PV penetration increases, notable reductions in power losses are observed, indicating the potential benefits of higher smart grid PV integration.
1. Introduction
Smart grids and solar PV penetration are two crucial trends in the global energy sector. Smart grids utilize digital technology to enhance the electricity grid’s efficiency, reliability, and sustainability [1,2]. A smart grid initiative acts as one of the foundations for the utilization of AI in smart cities; it facilitates spatial navigation in the form of interactive and automated systems [3]. PV penetration refers to the percentage of electricity generated by solar PV systems [4]. Integrating solar PV into smart grids offers numerous benefits, including increased renewable energy generation, improved grid efficiency, cost reduction, and enhanced resilience, as discussed in [2]. Smart grids optimize the utilization of solar PV by effectively managing the flow of electricity from PV systems to the grid. This can help to reduce peak demand and improve grid stability. Furthermore, smart grids facilitate the cost-effective utilization of solar PV and other renewable energy sources, thereby reducing electricity expenses. Additionally, smart grids enhance grid resilience by mitigating disruptions, such as power outages. According to [5], in 2021, the global energy generation share of solar and wind energy was reported to be above 10% for the first time with a global energy share of 10.1%, while solar PV had a global energy potential of about 3.4%. The global energy and economic forums have reached a consensus to rapidly decarbonize the global power sector, further driving the growth of renewable energy [6]. With approximately 1.8 × 10¹¹ MW of solar energy intercepted by the Earth, it surpasses the current global energy consumption rate by a significant margin [7]. Among the various ways to harness solar electricity, photovoltaic technology has proven to be one of the most effective. As nations worldwide explore the integration of solar PV into on-grid systems, the investigation of solar penetration has become a prominent area of research in the field. In the past, significant efforts have been made to enhance the sustainability and management optimization of electricity systems. These initiatives have included the integration of renewable energy sources, the implementation of demand response programs, and the deployment of advanced analytics and machine learning algorithms to optimize grid operations and reduce environmental impact [2].
Numerous studies have been conducted on solar grid connections; the following papers discuss the IEC 61727 standard for PV grid connection systems: [8,9]. The standard includes tests related to utility compatibility, personnel safety, and equipment protection for PV inverter performance. The utility compatibility tests cover voltage, current, frequency, operating ranges, flicker, power factor, etc. Based on the IEEE standard, the networks are categorized into three levels: low-voltage (LV), medium-voltage (MV), and high-voltage (HV) networks [10,11,12,13]. Globally, most PV systems are connected to low- and medium-voltage networks. In [14], researchers investigated analytical voltage stability using the IEEE 34 busbar radial distribution system. The study focused on voltage levels of 24.9 kV and 4.16 kV to determine the power properties related to stability, power loss, and the penetration coefficient of PV for voltage stability analysis. In [15] a comprehensive review was given regarding important topics, such as voltage fluctuations, voltage increases, voltage balancing, and the consequences of power loss on the system. A few studies in the literature have examined LV solar PV penetration. For example, the study [16] investigated the implications of LV distribution penetration on power quality potential. This study shows that there is an upper voltage violation in the network after a certain increasing PV penetration. This study investigated the network model using the OpenDSS program and the grid code under the European code. A study in Taiwan [17] aimed to find the best placement for solar PV penetration in a typical MV network. The load type was industrial, and the total PV penetration capacity was 14 MV. In another study [18], the penetration level of PV in an LV distribution system was investigated by installing a Battery Energy Storage System (BESS), and the study reported the economic profitability of the system. In [19], the researchers investigated the impact of PV penetration on rural areas in Southern California, USA, with different PV penetration capacities from 0 to 5 MW. This study aimed to find the best placement with minimum power losses, and they used MATLAB through PSS/E to model and test it under two IEEE standard systems, including 45 and 33 Busbar.
In [20], the authors investigated and analyzed the effect of the power flow reversion in distribution transformers in an MV fault and distributed generation of the secondary networks. The study also recommended a demand profile and PV penetration correlation investigation. In the study [21], a maximum integration capacity optimization model of PV power was proposed according to different power factors for the PV power. It analyzed large-scale PV grid access capacity, the PV access point, and multi-PV power plant output via a probability density distribution, sensitivity analysis, standard deviation analysis, and over-limit probability analysis. The majority of the aforementioned studies primarily focused on solar PV systems in single connections or specific scenarios. Moreover, there are not any studies that directly compare the effects of solar PV penetration on both urban and rural networks. Table 1 provides an overview of recent research publications in the area of solar PV penetration. It shows different case studies based on the type of load, such as residential, commercial, or industrial, and the network’s integrated PV capacity. Additionally, the table displays the objectives of the studies, the simulation software used, and the voltage grid code. Upon reviewing the literature, the question that emerges is as follows: How can the integration of solar PV into the smart grid in Malaysian urban and rural networks be effectively addressed to optimize system performance, taking into consideration voltage violations, power losses, and fault analysis, while determining the maximum allowable solar PV penetration level?
One significant gap in this research is the lack of adequate assessment techniques for dispersed PV systems over a wide area. Although much research has been conducted on assessing single-point PV systems, larger systems with multiple PV units spread over a large area have not been studied as extensively as systems with several PV units dispersed over a small space. Additionally, there has been limited research into integrating PV systems with high grid penetration, making it challenging to plan the distribution network when PV systems become widespread. While most studies focus on achieving very high PV penetration levels in distribution networks, they do not consider network losses as a limiting factor. This work proposes to investigate distribution losses as a significant limiting factor for PV penetration. Nevertheless, the test networks used in the aforementioned studies are not suitable for countries like Malaysia due to the unique fundamental architecture of their power system. Most of the studies mentioned in the literature utilized IEEE test cases or US distribution networks, which have a limited number of customers connected per distribution transformer. However, it is important to note that the distribution networks in Malaysia differ from these networks, as they typically have hundreds of customers connected to each distribution transformer.
Therefore, this study aimed to investigate the implications of PV penetration in the two typical Malaysian networks normally found in urban and rural areas. It determined the technical challenges with the goal of helping utilities enhance their management of PV integration into the smart grid and considered implications such as voltage violations, power losses, and fault analysis relative to the power demand profile of each scenario under investigation. The OpenDSS and MATLAB software were interfaced for the system design, simulation, and analysis. Static power flow analyses were employed to assess the effects of PV integration under the worst-case scenarios (peak-load and no-load periods). This study was designed to achieve the following objectives:
- To perform power flow analysis during peak-load and no-load conditions for both networks using OpenDSS.
- To examine both networks, the short-circuit currents, and the power losses associated with different levels of PV penetration during no-load and peak-load conditions.
- To compare the impact of PV penetration between urban and rural networks.
- To determine the maximum PV penetration capacity and identify sensitive nodes.
In the following sections, we will briefly overview the methodology employed in this study and discuss the obtained results. Section 2 will describe the system design and simulation setup using the OpenDSS and MATLAB software. In addition, we will present the static power flow analyses conducted to assess the effects of PV integration, focusing on worst-case scenarios, such as peak-load and no-load periods. Finally, in Section 3, we will discuss the implications and findings derived from the analyses, highlighting the technical challenges and potential solutions for utilities managing PV integration into the grid.
2. Materials and Methods
The methodology section of this study aimed to assess the impacts of integrating PV systems into Malaysian urban and rural networks. The section is divided into five parts: system design and grid characteristics, power flow analysis, evaluation strategy, load demand profiles, and solar PV modeling. The researchers used data from typical MV distribution networks that included load details and network data, which were collected from local power supply company. The system design, simulation, and analysis were carried out using OpenDSS and MATLAB software [28]. OpenDSS is a widely used software tool for modeling distribution networks due to its flexibility, integration capabilities, long-term assessment features, state-of-the-art modeling capabilities, automation tools, and strong community support. These factors make OpenDSS popular among power engineers and researchers for distribution network analysis and optimization. Evaluation strategies were used to assess the network under two worst-case scenarios. The power flow analysis in OpenDSS encompassed several key steps. Initially, the software accurately represented the distribution network, considering the network topology, equipment characteristics, and interconnections. Load modeling was performed, incorporating corresponding load data from a local company. Solver selection and convergence were carefully managed to ensure accurate and reliable results. The analysis allowed for determining voltage and power flows within the distribution network, enabling the assessment of its steady-state behavior. The effects of solar PV penetration on the networks were evaluated by conducting static analyses, and potential issues that may arise during installation and integration into the grid power system were identified.
2.1. System Design and Grid Characteristics
This study’s typical urban Malaysian network consists of two 30 MVA, 33 kV/11 kV distribution transformers that are parallel-connected to 13 feeders and 38 nodes. The typical rural Malaysian network consists of two 15 MVA, 132/11 kV transformers that are parallel-connected to 8 feeders and 110 nodes. The summary of the grid characteristics for both networks is shown in Table 2. Figure 1 shows the investigated networks’ single-line diagrams (SLD), representing each load with a corresponding node number. The urban network is depicted in Figure 1a, while the rural network is illustrated in Figure 1b.
2.2. Power Flow Analysis
To calculate power flow in OpenDSS, we first needed to create a power distribution network model using the scripting language of OpenDSS. Next, we needed to define the load flow parameters as discussed in [28]. In a more specific context, MATLAB controls OpenDSS by utilizing a Component Object Model (COM) interface. This interface enables us to modify parameters related to PV penetration levels and switches (both closed and open) and to evaluate power flow solutions, as can be seen in Figure 2. It uses the Newton–Raphson load flow algorithm to solve the power flow equations for the distribution system. Appendix A shows the step-by-step code for calculating the load flow, power losses, and fault analysis.
Analyzing power losses allows us to assess the impact of PV integration on system performance. The system’s power flow patterns and voltage profiles may change as PV penetration increases. By simulating power losses, we can evaluate how introducing PV systems affects the system’s overall performance, including factors such as voltage regulation, current distribution, and loading. This study used the OpenDSS syntax to calculate the power loss. This study, for fault analysis, specifically focused on 3-phase fault analysis, as indicated by the syntax provided in Appendix A [28]. The reason behind selecting these faults is their severity, which is considered the most severe type of fault in solar PV penetration. The short-circuit analysis was carried out at two locations, specifically buses 33 kV and 11 kV, shown in Figure 1a, to calculate the fault analysis on the rural area network. For the urban network, the short-circuit analysis was carried out at two buses, 132 kV and 11 kV, as can be seen in Figure 1b.
2.3. Evaluation Strategy
Three network cases were simulated using OpenDSS and MATLAB interfacing computation techniques. In case 1, both transformers in each distribution grid operated in parallel mode. Case 2 involved opening the bus section circuit breaker, which divided the network into two zones, with each zone supplied by a transformer only. Case 3 simulated a contingency situation in which only one transformer served the entire distribution grid. Figure 3 provides a summary of the three cases. Supplementary simulations were also carried out to analyze the maximum allowable PV power profile under no-load and peak-load conditions. In Figure 1, for cases 1 and 3, the 11 kV busbar is considered node 1, as the whole distribution grid is connected. However, during simulations of case 2 where the distribution grid was separated into two zones due to the open circuit breaker, the 11 kV busbar is labeled as ‘A1′ and ‘A2′ for the left and right zones, respectively. Figure 3 shows the evaluation strategy for this study, which includes four steps. The first step is modeling in OpenDSS. The second step involves defining test conditions to assess the network under two worst-case scenarios. The third step is integrating different levels of PV penetration. Finally, the fourth step is the evaluation and comparison of the results.
2.4. Load Demand Profiles
The load profiles of typical Malaysian urban MV distribution systems are shown in Figure 4a. The nodal load ratings accounting for the network’s reactive, apparent, and real power are reported for each power involved in the investigation. Additionally, the cable lengths in kilometers from the busbar for all the feeders are shown in Figure 4b for the urban power distribution networks. This figure also displays the voltage profile of the feeders before solar PV penetration. Appendix B provides the load distribution among different feeders. In the urban network, the total load connected to the 11 kV busbar is 31.227 MVA with 20.818 MW of active load and 10.409 MVAR of reactive load. However, in the rural network, the total active and reactive loads connected to the 11 kV bus bar are 13.394 MW and 6.612 MVAR, respectively, resulting in a total of 20.006 MVA. To minimize voltage drop, cables are typically designed with a specific gauge or thickness based on the cable length and expected current flow. The larger the cable, the less resistance it will have, and the less voltage drop there will be. Appendix C shows the type of cable used in this study. In descending order, the three longest cables from the 11 kV bus are connected to feeders 8 (Node 26) and 6 (Node 19, Node 18) with lengths of 7.6 km and 5.8 km, respectively. These nodes are considered critical with a higher risk of initial overvoltage occurrence in the system, as shown in Figure 4b. In OpenDSS, loads are represented by objects with various properties and parameters describing their characteristics and behavior [28].
The second network is related to the typical rural network in Malaysia. Figure 5a represents the real and reactive power load ratings graph for rural networks with 8 feeders and approximately 110 nodes. Figure 5b shows the voltage of busbars before solar PV penetration and cable length among feeders. It is observed that feeders 6, 8, and 7 have the longest cable lengths in descending order, while the nodes connected to feeders 4 and 5 are very short. In addition to cable length, other factors that can affect the performance of a solar PV system in a rural MV network include the cable type used, the cable’s temperature, and the frequency of the electrical signal being transmitted. It is important to consider all these factors when designing a solar PV system to ensure it operates effectively and efficiently.
2.5. Solar PV Modelling and Profile
The PV system comprises solar cell modules or panels that convert sunlight into DC power, which is then transformed into AC power synchronized with the grid with a DC-to-AC inverter. In OpenDSS (an in-built simulation model), most of these components are represented in a simplified way through the PV system device class, which is suitable for simulations with time steps greater than 1 s [28]. The PV system model assumes that the inverter can quickly find the maximum power point of the panel, simplifying the modeling process for PV panels and inverters, and is suitable for most interconnection impact studies. The PV system model is integrated with the circuit like other power conversion elements, such as generators, loads, or storage devices, and produces or consumes power based on specific functions. The PV system characteristics can be found in Appendix D.
For each scenario mentioned in Section 2.3, PV generation simulation was conducted from 0% to 100% with a 20% increment under ‘no-load’ and ‘peak load’ conditions, as illustrated in Figure 3. To determine the approximate power value for 100% solar PV penetration, 85% of the total load of the distribution network was divided by the total number of PV systems. In the urban network, the total load is 20.815 MW, and the total number of nodes integrated with the PV system is 38, resulting in 0.465 MW. Similarly, in the rural network, the total load is 13.391 MW, and the total number of nodes integrated with the PV system is 99, resulting in 0.115 MW. Therefore, 0.500 MW and 0.100 MW values were selected and rounded up to represent 100% PV penetration for urban and rural networks, respectively, as shown in Table 3. The simulations in this study predicted the maximum allowable power values for urban networks during no-load and peak-load situations to be between 2–4 MW, whereas for rural networks, they were found to be around 0.125–0.300 MW, but this, from voltage perspective, needs to investigate the power loss of the system.
3. Results and Discussion
3.1. Voltage Violation Potential of Each Scenario Investigated
Voltage violations occur when the voltage profile during the integration of PV into the power system exceeds 1.05 or falls below 0.95. In case 1 where both transformers in each distribution grid operate in parallel mode, this study’s analysis, depicted in Figure 6, reveals a maximum allowable power of 2 MW (400%) PV based on the simulated voltage profile graphs for a no-load situation (Figure 6a). Interestingly, no voltage violations are observed within the range of 0 to 100% PV penetration. However, the tendency for voltage violations increases as the power rating capacity of the network is raised. Additionally, the voltage profile pattern observed in the no-load simulation in Figure 6a aligns with the trend of the cable length increment of each node from bus 11 kV in each feeder, as shown in Figure 4b. These findings suggest that careful consideration must be given to the power rating capacity of the network to avoid voltage violations when integrating PV systems. This study also highlights the importance of considering cable lengths and distribution feeder configurations in maintaining voltage stability during PV integration.
Considering the peak-load simulation for the urban networks in Figure 6b, the distribution system’s total net voltage profile is lowered to about 0.98 due to the existing loads and PV systems. At 100% PV penetration, the trend shifts from being influenced by the load demand (Figure 4a) to following the trend of cable length factors (Figure 4b), starting from feeder 6, which is one of the critical nodes. The simulation results in Figure 6b indicate that the loads connected to the nodes in the system will lower the voltage profile. For the peak-load conditions of the urban network, the maximum allowable power predicted to prevent voltage violations is up to 4 MW PV (800% PV), as shown in the same figure. Although increasing PV penetration would require calculating the cable size and transformer rating, for this simulation, we increased the PV penetration to determine the maximum allowable level and amount of power losses.
This study found that the maximum allowable power for PV integration in the investigated network is 2 MW for no load and 4 MW for peak load. These values were used to plot the possible impacts of PV penetrations on the voltage profile for different scenarios in urban networks. This section investigates the maximum PV penetration level from a voltage perspective. However, in reality, increasing the PV penetration beyond a certain level necessitates the sizing of cables and other components of the network. In the next section, we will discuss why this percentage is not applicable and how PV penetration, after reaching a certain level, increases power losses in the network. Therefore, with this study’s objective in mind and considering the power loss limit, we can determine the maximum PV penetration in the network.
In case 1 for the rural networks, PV penetration is predicted to be safe for the network as long as it remains below 125% during no-load conditions. Voltage violations are observed only in feeders 1, 6, and 8 when the power capacity of the network exceeds the maximum allowable power of 0.125 MW, as depicted in Figure 7a. During peak-load conditions, Figure 7b indicates that feeder 8 experiences lower limit voltage violations. It is noted that a minimum PV penetration of 80% is required to mitigate the lower voltage violation in this feeder. However, increasing the PV penetration up to 300% during peak-load conditions aligns with the voltage profile specified within the grid code. This section primarily focuses on the voltage perspective, but it is essential to consider other factors as well, which will be discussed in subsequent sections. In this particular network, feeders 1, 6, and 8 are identified as sensitive feeders with a high risk of failure, emphasizing the need for careful management and monitoring in order to ensure network stability and reliability.
In case 2 for the urban network where the circuit breaker is open and the network is divided into two zones, each supplied by a single transformer, Figure 8 illustrates the occurrence of voltage violations under both no-load and peak-load conditions. In Figure 8a, feeder 6 shows a higher tendency for voltage violations with a maximum allowable power rating of approximately 2 MW PV penetration during the no-load situation. Node 1 may experience a lower threshold voltage with a 4 MW PV penetration. Additionally, Figure 8b demonstrates that nodes 1, 15, and 30 are susceptible to voltage violations when the PV penetration reaches 4 MW PV during peak-load conditions. In summary, the findings from this case study indicate that as long as the safe power threshold of the network is not exceeded, there will be no voltage violations for PV penetration levels ranging from 0% to 100%. It is important to manage the power ratings within the safe range to ensure voltage stability in the urban network configuration.
In case 2, the rural network exhibits a high tendency for voltage violations at feeders 1, 6, and 8 during the no-load simulation scenario specifically when the network power exceeds the threshold of 0.125 MW PV, as depicted in Figure 9a. It is worth noting that the peak-load simulation of the rural network behaves differently. Even at 0% PV penetration, voltage violations are observed, especially at nodes 92–104 along feeder 8. Additionally, Figure 9b shows that feeder 8 during peak-load conditions experiences voltage violations at the regular power rating of the current network for PV penetrations ranging from 0% to 60%. Therefore, to mitigate voltage violations in this scenario, it is necessary to have a PV penetration exceeding 60%.
In the context of voltage violation evaluation, case 3 represents a scenario where a single transformer serves the entire distribution grid. In Figure 10a,b, which pertains to urban networks, it is observed that the allowable power capacity prediction for this case works effectively up to a 2 MW PV penetration level. However, when the simulation is conducted with 4 MW PV penetration, voltage violations are observed across all nodes during both no-load and peak-load conditions in the urban networks. Even at 0% PV penetration, a slight voltage violation is observed at feeder 9 for a peak load of 0.500 MW in this network, as depicted in Figure 10b. A similar study conducted on solar PV penetration at the LV network utilized OpenDSS and found the maximum allowable power capacity [29].
In case 3, the rural network experiences voltage violation that occurs in feeders, 1, 6, and 8 in the no-load simulation scenario when the power capacity exceeds 0.3 MW PV, as shown in Figure 11a. The reason for the violations in this network can be attributed to multiple factors. Firstly, feeders 6 and 8 serve as the primary lounge feeders in the network and are responsible for supplying electricity to various nodes. The high demand and load associated with these feeders can lead to potential violations. Indeed, in Figure 11b, it can be observed that voltage violations occur at all PV penetration levels when the current power rating is set to 0.1 MW during peak-load simulations. As a result, this particular configuration is recommended for achieving PV penetration without voltage violations in rural networks. However, to ensure voltage stability during peak-load situations, it is necessary to increase the power capacity to at least 0.125 or 0.3 MW. This is evident from the allowable power plot where the 0.125 MW PV configuration falls within the safe threshold, indicating its suitability for preventing voltage violations.
3.2. PV Penetration Power Loss Evaluation
This study evaluates the possible power losses in each case study regarding the PV penetration percentage and the maximum allowable operating power of the studied urban and rural networks. After modeling and solving the load flow through the OpenDSS solver using the power loss syntax to calculate each scenario [28], the power losses were calculated for different case studies and the solar PV penetration for both networks. The outcomes of the power loss simulation are presented and detailed in Table 4. For all cases in the urban network, power losses were found to reduce with the increase in % PV penetration until 100%. As the PV penetration level increases, real power losses decrease because the solar PV system directly feeds the local load and does not contribute to any current injection in the network lines. Cases 1–3 of the urban network at 0% penetration exhibit power losses of 0.131, 0.132, and 0.151 (MW), respectively, which were discovered to reduce to 0.038, 0.038.5, and 0.0429 (MW) during 100% PV penetration. Similarly, in the rural network, the power losses in cases 1, 2, and 3 at 0% penetration were 0.215, 0.216, and 0.224, respectively, and were discovered to reduce to 0.061, 0.061, and 0.063 (MW).
By increasing solar PV penetration beyond 100%, the network will experience high power losses. This means that increasing PV penetration beyond a certain level will result in high losses in the network due to the reverse power flow into the grid. Therefore, we needed to calculate voltage profiles and power losses to determine the maximum solar PV penetration level, which is the main aim of this study. The table also evaluated power loss for 2 MW and 4 MW as the allowable power threshold for the urban network, but the power losses of cases 1 and 2 at 4 MW were found to be about four times that of what is obtainable at 2 MW; case 3’s power increase at 4 MW was found to be up to six times. The higher power loss associated with case 3 in the urban network than its counterpart is found for all levels of PV penetration and the power rating investigated. Whereas for rural networks, the case response to power loss seems to depend on the case under investigation and the penetration percentage. This is elucidated in the table, as 60% and 80% PV penetration in case 3 was found to have a lower power loss than what was obtainable in cases 1 and 2. So, further optimization is recommended to minimize losses in future investigations.
3.3. Fault Analysis in PV Penetration
The power distribution network protection and load balancing are key factors that need to be considered when analyzing the impact of PV penetration. As PV penetration increases, the fault current on a busbar also increases, which can have an impact on the protection relays and devices. Therefore, comparing the current profile variation between PV-integrated networks is important. In this study, the fault analysis was limited to a three-phase fault because it is a worst-case scenario and the most severe type of fault. OpenDSS was utilized to conduct a fault study for an urban network on 33 kV and 11 kV busbars, as shown in Figure 1a, and for a rural network on 132 kV and 11 kV busbars, as shown in Figure 1b. This study simulated fault estimates for all three cases in the urban and rural networks.
Figure 12 shows the short circuit fault analyses for cases 1–2 in the urban network with similar behavior between the PV penetration percentage and the current increment for the 33 kV busbars. The current increment is the amount of increase in the fault current when the PV system is connected compared to the fault current when the PV system is not connected to the network with different percentages of PV penetrations. Indeed, the results also demonstrate the variation in current increment across different PV penetration levels. The current increment at 100% PV penetration was found to be in ranges from 52–324 A in the no-load configuration for the 33 kV busbar, while the peak-load configuration current varies from 55–337 A. The similarities in the fault incremental current magnitude in cases 1 and 2 indicate that the parallel mode transformers in each distribution grid and the scenario with the circuit breaker in the opened mode for networks zoning into two have no difference in the resultant fault configurations. However, case 3 was found to possess the highest current surge potential among the investigated cases. The maximum current increment recorded for case 3 was 389 A during the peak-load condition. Figure 12a,b, which depicts the no-load and peak-load conditions, respectively, show that there is little discernible difference within the 33 kV system. When comparing the performance of the power distribution system under different load conditions, there are no significant differences that are unique to the 33 kV system. Therefore, it can be concluded that the system’s behavior remains relatively consistent regardless of the load conditions.
Figure 13 shows the short circuit fault analyses for cases 1–2 in the urban network, revealing a linear correlation between PV penetration percentage and the current increment for the 11 kV busbars. It is clear that as solar PV penetration increases, the increment also increases. The current increment among the different penetration levels is shown by different colors. It also shows that the current increment at 100% PV penetration ranges from about 34.5–258 A in the no-load configuration for the 11 kV busbar, while the peak-load configuration current varies from 34–263 A. The similarities of the fault incremental current magnitude in cases 1 and 2 indicate that the parallel mode transformers in each distribution grid and the scenario with the circuit breaker in the opened mode for networks zoning into two have no difference in the resultant fault configurations. However, case 3 was found to possess the highest current surge potential among the investigated cases. The maximum current increment observed for case 3 was 572 A during the no-load condition and 592 A during the peak-load condition. The comparison between the no-load and peak-load conditions depicted in Figure 13a,b also demonstrates that there are no notable distinctions within the 11 kV system. The presence of PV systems can lead to current surges, and appropriate measures should be taken to address this tendency and ensure the effective and reliable operation of the protection system.
As depicted in Figure 14, the fault current results exhibit similar behavior for both the no-load and peak-load conditions. However, during the peak-load condition, there is a slightly higher increment in the amount of current. The maximum fault current increment at 100% PV penetration for the 132 kV busbar was found to be around 42–54 A between case 1 and case 3. On the other hand, Figure 15 shows that the 11 kV busbar exhibited fault at different levels of PV penetration. The current increment at 100% PV penetration ranges from 87.1 A to 261 A across all the cases with case 3 having a fault current increment about two and a half times that of case 2 in zone B (the next highest fault currents increment rating for the rural distribution networks). As shown in Figure 14, the network exhibits similar behavior in both conditions with a small increase in current during the peak load. These results suggest that PV penetration can lead to a higher fault current increment in the distribution network. Therefore, it is important to consider when designing and installing PV systems in the distribution network to select appropriate protection devices and relays to ensure the safe and reliable operation of the system.
3.4. Discussion and Validation
In summary, this analysis reveals that exceeding the maximum allowable power for solar PV penetration leads to an increase in power loss within the network. Furthermore, it was observed that voltage violations were absent in the urban network until reaching 4 MW of solar PV penetration, while the rural network allowed up to 0.3 MW. However, it is crucial to note that beyond a certain threshold of PV penetration (100%), the power losses in the network experience a significant and undesirable surge. These findings align with similar results obtained using DIgSILEN 2018 software, as highlighted in [30], reinforcing the validity of our findings. To validate our results, we compared the power loss calculations obtained with OpenDSS to similar studies conducted with Digsilent Power Factory [30]. The comparison demonstrated the accuracy and reliability of our findings. In conjunction with our research, other studies have also utilized DigSilent software to investigate the impacts of solar PV penetration on MV grid networks [30,31,32]. Additionally, another study [17] employed OpenDSS to explore the maximum allowable PV penetration, increasing it up to 350% of the rated capacity. Furthermore, in [33], it was determined that the maximum allowable solar PV penetration in the LV network reached up to 110%. By comparing our methodologies and findings with these studies, we gain valuable insights into the challenges and opportunities associated with high PV penetration and can identify potential mitigation strategies. This analysis emphasizes the critical importance of carefully selecting suitable protection devices and relays during the design and installation of PV systems. This step is essential to ensure the safe and reliable operation of the overall system. It is vital to consider the potential consequences of an increased fault current increment resulting from PV penetration in the distribution network. By addressing these considerations and implementing appropriate protection measures, we can effectively manage the impacts of high PV penetration and maintain the stability and safety of the system.
4. Conclusions
This work investigated voltage violations, power losses, and fault analysis relative to the power demand profile of typical Malaysian power distribution networks of urban and rural settlements. Three distinctive scenarios were studied as case studies, and the insights gained from this study may be of assistance to guide toward sustainable PV installation and penetrations. The main contribution of this study was to investigate the impact of solar PV penetration in a typical Malaysia distribution network over a wide area in comparison to urban and rural areas. Additionally, we investigate the maximum solar PV penetration allowable to the grid with respect to the power losses as a limiting factor and fault analysis. Therefore, the most significant findings to emerge from this study are summarized as follows:
- The result shows that the maximum power in the investigated urban and rural distribution networks is predicted to be 0.5 MW and 0.125 MW, respectively, from the voltage perspective. Furthermore, this study revealed that the power grid in rural areas is more susceptible to voltage violation when compared to urban areas. This means the rural network is more likely to experience high voltage violations when PV penetration is high due to the length of the feeders.
- The findings show that power loss decreases up to 100% PV penetration; beyond 100% PV penetration, power losses increase due to revised power flow from the PV system into the grid.
- These findings indicate that PV penetration in the distribution network can result in an increased fault current increment. As a result, it is crucial to carefully consider the selection of suitable protection devices and relays during the design and installation of PV systems. This step is necessary to ensure the safe and reliable operation of the overall system.
Our strategy for integrating solar PV penetration in a typical network in Malaysia holds significant potential for application in other parts of the world. The principles and methodologies we have employed can serve as valuable guidelines for similar distribution networks globally, providing insights into the technical, operational, and regulatory aspects of integrating solar PV systems. With appropriate adjustments to account for regional variations, our strategy can be readily applied and customized to suit different geographical locations, facilitating the widespread adoption of solar PV penetration and contributing to the global transition towards sustainable energy systems. Policymakers and stakeholders should collaborate to develop comprehensive guidelines and standards for PV integration in distribution networks, covering technical requirements, grid code regulations, and best practices. Additionally, incentives and support mechanisms should be established to promote solar adoption, especially in rural areas with a high potential for energy access and sustainability. Government officials and policymakers must provide strong support for the integration of solar generation, starting from individual installations to integrated systems within the smart grid, in both urban and rural areas. This support will foster sustainable energy practices, reduce dependence on fossil fuels, and drive the transition towards a cleaner and more resilient energy infrastructure. For further research, the power loss estimated in this study is limited to line and transformer power loss only. Therefore, load loss may be investigated in future studies. Additionally, this analysis is based on static simulation of PV penetration, whereas the transient nature of power utilization is an intriguing issue that could be explored in further research to capture the real-time implications of PV penetration.
Author Contributions
Software, M.R.M.; methodology, M.R.M., C.M.L. and J.P.; conceptualization M.R.M., C.M.L. and J.P.; formal analysis, M.R.M.; writing—review and editing, M.R.M. and J.P.; validation, M.R.M. and J.P.; visualization, M.R.M. and C.M.L.; investigation, M.R.M. and C.M.L.; resources, J.P.; data curation, J.P.; writing—original draft preparation, M.R.M.; supervision, J.P.; project administration, J.P.; funding acquisition, J.P. All authors have read and agreed to the published version of the manuscript.
Funding
This research publication was funded through the J510050002–IC-6 BOLDREFRESH2025-CENTER OF EXCELLENCE from the iRMC of Universiti Tenaga Nasional.
Data Availability Statement
Not applicable.
Acknowledgments
The authors would like to thank the Tenaga Nasional Berhad (TNB), Malaysia, for supporting this research under a TNB R&D Seeding Fund U-TD-RD-21-14 and UNITEN R&D Sdn. Bhd. The authors wish to acknowledge financial support for publication received through the J510050002—IC-6 BOLDREFREASH 2025 CENTER OF EXCELLENCE from iRMC of Universiti Tenaga Nasional.
Conflicts of Interest
The authors declare no conflict of interest.
Abbreviations
| List of Abbreviations | |
| DG | Distributed generation |
| PV | Photovoltaic |
| PV DG | Photovoltaic distributed generation |
| MV | Medium voltage |
| LV | Low voltage |
| PPU | Main distribution substation |
| PMU | Main intake substation |
| QD | Quasi dynamic simulation |
| PU | Per unit |
| NL | No load |
| Nomenclature | |
| Vpu | Voltage per unit |
| Vmin | Minimum voltage |
| Vmax | Maximum voltage |
| Vactual | Actual voltage |
| V base | Voltage base |
| P | Real power |
| Q | Reactive power |
Appendix A
Step-by-Step Coding in OpenDSS and MATLAB
OpenDSS:
- %Define the line properties using following code:
- New Line.MyLineName Phases=3 Bus1=Bus1Name Bus2=Bus2Name Length=lineLengthOhms R1=lineResistancePerUnitLength X1=lineReactancePerUnitLength C1=lineCapacitancePerUnitLength Units=km
- % Add more transformer properties as needed
- %Define the load properties using following code:
- New Load.MyLoadName Bus=BusName Phases=3 kV=LoadVoltage kW=LoadActivePower kvar=LoadReactivePower Model=LoadModel
- % Add more transformer properties as needed
- %Define the PV properties using following code:
- New PVSystem.MyPVSystemName Bus1=BusName Phases=3 kV=PVSystemVoltage kW=PVSystemCapacity Irradiance=PVSystemIrradiance Temp=PVSystemTemperature.
- % Add more transformer properties as needed
- %Define the transformer properties using following code:
- New Transformer.MyTransformer Buses=[Bus1, Bus2] kVA=TransformerkVA kVLL=TransformerkVLL Primary=TransformerPrimary Secondary=TransformerSecondary XHL=TransformerXHL
- % Add more transformer properties as needed
- %After defining the variables, such as the solar PV penetration, load, busbars, transformer, etc., in OpenDSS, the next step is to perform a load flow analysis to calculate the power flow and voltage profile in the grid. Here is an example of how to proceed:
- Set the simulation parameters:
- Set MaxIterations=10
- Set ConvergenceTolerance=0.0001
- %Specify the system configuration and components:
- Redirect PVsystem.dss
- Redirect Loads.dss
- Redirect Transformers.dss
- %Solve the load flow (snapshot mode load flow analysis):
- Solve Mode=Snap
- %Access and analyze the simulation results:
- Export Voltages pu
- Export PDElements
- %To calculate the power loss:
- Losses
Three-phase Fault Calculations: (To perform fault calculations, use the Fault command. Here is an example code snippet to calculate fault conditions.)
- % Specify the fault parameters
- New Fault.Fault1 Bus1=Bus1 Phases=3
- New Circuit.Feeders BasekV=33 pu=1.0 Angle=0 Phases=3 Bus1=Tmn_Duma BaseFreq=50 ISC3=22500
- Set Fault.Fault1=3
- Solve Mode=Fault StudyCase=Fault1
- Show Fault
- Now, use MATLAB to control the parameters and network.
- %Connecting MATLAB to OpenDSS:
- DSSObj = actxserver(‘OpenDSSEngine.DSS’);
- DSSObj.Start(0);
- % Access the Active Circuit, Text, and Solution interfaces
- DSSCircuit = DSSObj.ActiveCircuit;
- DSSText = DSSObj.Text;
- DSSSolution = DSSCircuit.Solution;
- DSSText.command = ‘Compile ‘‘C:\path\to\your\file.dss’’’;
- %Define and control PV penetration size for OpenDSS:
- pvSizes = [20, 40, 60, 80, 100];
- % Loop through each PV system size
- for i = 1:length(pvSizes)
- pvSize = pvSizes(i);
- % Update PV system size in the DSS script
- DSSText.command = [‘Edit PVSystem.PV1 kVA=‘ num2str(pvSize)];
- %Adjust the new PV size with OpenDSS, and return the result:
- % Solve the circuit
- DSSSolution.Solve();
- % Retrieve bus voltages and total power losses
- voltages = DSSCircuit.AllBusVmagPu;
- losses = DSSSolution.Losses;
- faultCurrents = DSSCircuit.ActiveCktElement.CurrentsMagAng(1:2:end);
- faultPower = sum(faultCurrents .^ 2);
- %Display for each PV size:
- filename = [‘Simulation_Results_PV_Size_’ num2str(pvSize) ‘.txt’];
- fid = fopen(filename, ‘w’);
- fprintf(fid, ‘Simulation Results for PV System Size: %.2f%%\n’, pvSize);
- fprintf(fid, ‘Bus Voltages:\n’);
- fprintf(fid, ‘%f\n’, voltages);
- fprintf(fid, ‘Total Power Losses (kW): %.4f\n’, losses);
- fprintf(fid, ‘Fault Analysis Results:\n’);
- fprintf(fid, ‘Fault Currents:\n’);
- fprintf(fid, ‘%f\n’, faultCurrents);
- fprintf(fid, ‘Fault Power (kVA): %.4f\n’, faultPower);
- fclose(fid);
disp([‘Simulation results and fault analysis for PV system size ‘ num2str(pvSize * 100) ‘% saved to file: ‘ filename]);
end
% Close the OpenDSS COM object
DSSObj.Quit;
Appendix B

Table A1.
Urban network load specification among feeders.
| Feeder | P (MW) | Q (MVAR) | Nodes |
|---|---|---|---|
| 1 | 0.085 | 0.043 | 1 |
| 2 | 2.929 | 1.465 | 2, 3, 4, 5 |
| 3 | 1.158 | 0.579 | 6, 7, 8,9 |
| 4 | 0.902 | 0.451 | 10, 11 |
| 5 | 3.249 | 1.624 | 12, 13, 14 |
| 6 | 2.169 | 1.085 | 15, 16, 17, 18, 19 |
| 7 | 0.485 | 0.243 | 20, 21 |
| 8 | 2.026 | 1.013 | 22, 23, 24, 25, 26, |
| 9 | 2.502 | 1.251 | 27, 28, 29 |
| 10 | 1.939 | 0.969 | 30, 31, 32 |
| 11 | 0.148 | 0.074 | 33 |
| 12 | 1.740 | 0.870 | 34, 35, 36 |
| 13 | 0.716 | 0.358 | 37, 38 |
| Total | 20.818 | 10.409 |
Table A2.
Rural network load specification among feeders.
| Feeder | Active | Reactive | Bus No |
|---|---|---|---|
| 1 | 1.048 | 0.525 | 1 2 3 4 5 6 7 8 9 10 11 12 13 14 |
| 2 | 1.896 | 0.933 | 15 16 17 18 19 20 21 22 23 24 25 26 27 28 29 30 31 |
| 3 | 2.174 | 1.088 | 32 33 34 35 36 37 38 39 40 41 42 43 44 |
| 4 | 2.072 | 1.037 | 45 46 47 48 49 50 51 52 53 |
| 5 | 1.324 | 0.675 | 54 55 56 57 58 59 60 61 |
| 6 | 0.783 | 0.395 | 62 63 64 65 66 67 68 69 70 71 72 73 74 75 76 77 78 79 |
| 7 | 1.352 | 0.677 | 80 81 82 83 84 85 86 87 88 89 |
| 8 | 2.745 | 1.282 | 90 9192 93 94 95 96 97 98 99 100 101 102 103 104 105 106 107 108 109 110 |
| Total | 13.394 | 6.612 |
Appendix C
Table A3.
Cable type and specifications.
| Type | Pos Seq R (ohms/km) | Pos Seq X (ohms/km) | Zero Seq R (ohms/km) | Zero Seq X (ohms/km) | Pos Seq Charging Admittance | Rating |
|---|---|---|---|---|---|---|
| A11UG240X | 0.1609 | 0.1524 | 0.1814 | 0.0312 | 147.3598 | 350 |
| A11UG500X | 0.08 | 0.09 | 1.04 | 0.03 | 199.89 | 570 |
| A11UG185 | 0.20 | 0.08 | 2.39 | 0.04 | 218.05 | 250 |
| A11UG150X | 0.26 | 0.16 | 0.30 | 0.04 | 119.46 | 280 |
| A11UG070 | 0.524 | 0.0938 | 3.936 | 0.0422 | 148 | 160 |
Appendix D
Table A4.
Solar Module Specifications.
| Specification | Value |
|---|---|
| Maximum Power (Pmax) | 300 W |
| Open Circuit Voltage (Voc) | 38.5 V |
| Short Circuit Current (Isc) | 9.10 A |
| Voltage at Maximum Power (Vmpp) | 31.1 V |
| Current at Maximum Power (Impp) | 9.65 A |
| Module Efficiency | 18.3% |
| Glass Type | Tempered glass |
| Frame Material | Anodized aluminum alloy |
| Junction Box Protection | IP67 |
| PV Module Dimensions | 156.75 mm × 156.75 mm |
References
- Parnianifard, A.; Mumtaz, S.; Chaudhary, S.; Imran, M.A.; Wuttisittikulkij, L. A data driven approach in less expensive robust transmitting coverage and power optimization. Sci. Rep. 2022, 12, 17725. [Google Scholar] [CrossRef]
- Hou, W.; Li, R.Y.M.; Sittihai, T. Management optimization of electricity system with sustainability enhancement. Sustainability 2022, 14, 6650. [Google Scholar] [CrossRef]
- Yigitcanlar, T.; Kankanamge, N.; Regona, M.; Ruiz Maldonado, A.; Rowan, B.; Ryu, A.; Desouza, K.C.; Corchado, J.M.; Mehmood, R.; Li, R.Y.M. Artificial intelligence technologies and related urban planning and development concepts: How are they perceived and utilized in Australia? J. Open Innov. Technol. Mark. Complex. 2020, 6, 187. [Google Scholar] [CrossRef]
- Fayek, H.H.; Abdalla, O.H. Operation of the Egyptian Power Grid with Maximum Penetration Level of Renewable Energies Using Corona Virus Optimization Algorithm. Smart Cities 2022, 5, 34–53. [Google Scholar] [CrossRef]
- Zhu, Z.; Lu, L.; Yao, X.; Zhang, W.; Liu, W. Global Energy Review. 2021. Available online: https://www.iea.org/reports/global-energy-review-2021/renewables (accessed on 18 July 2023).
- Kassem, Y.; Abdalla, M.H.A. Modeling predictive suitability to identify the potential of wind and solar energy as a driver of sustainable development in the Red Sea State, Sudan. Environ. Sci. Pollut. Res. 2022, 29, 44233–44254. [Google Scholar] [CrossRef]
- Ramachandran, T.; Mourad, A.-H.I.; Hamed, F. A Review on Solar Energy Utilization and Projects: Development in and around the UAE. Energies 2022, 15, 3754. [Google Scholar] [CrossRef]
- Al-Shetwi, A.Q.; Hannan, M.A.; Jern, K.P.; Alkahtani, A.A.; Abas, A.E.P. Power quality assessment of grid-connected PV system in compliance with the recent integration requirements. Electronics 2020, 9, 366. [Google Scholar] [CrossRef]
- Wu, Y.-K.; Lin, J.-H.; Lin, H.-J. Standards and guidelines for grid-connected photovoltaic generation systems: A review and comparison. IEEE Trans. Ind. Appl. 2017, 53, 3205–3216. [Google Scholar] [CrossRef]
- Tan, C.; Teng, X.; Ding, Q.; Xiao, X.; Lan, Q.; Cao, R.; Chang, L. Synergistic balancing control for low-inertia power systems with high PV penetration: Tibet as a case study. Energy Rep. 2022, 8, 2924–2935. [Google Scholar] [CrossRef]
- e Silva, L.E.S.; Vieira, J.P.A. Combined PV-PEV Hosting Capacity Analysis in Low-Voltage Distribution Networks. Electr. Power Syst. Res. 2022, 206, 107829. [Google Scholar] [CrossRef]
- Almeida, D.; Pasupuleti, J.; Raveendran, S.K.; Khan, M.R.B. Monte Carlo analysis for solar PV impact assessment in MV distribution networks. Indones. J. Electr. Eng. Comput. Sci. 2021, 23, 23–31. [Google Scholar] [CrossRef]
- Korada, N. Impact of High PV Penetration in a Real Large Feeder Network Using Edge Based Advanced Control and Novel Soft-Switching DC-DC Topologies. Ph.D. Thesis, Arizona State University, Tempe, AZ, USA, 2022. [Google Scholar]
- Ghaffarianfar, M.; Hajizadeh, A.J.E. Voltage stability of low-voltage distribution grid with high penetration of photovoltaic power units. Energies 2018, 11, 1960. [Google Scholar] [CrossRef]
- Karimi, M.; Mokhlis, H.; Naidu, K.; Uddin, S.; Bakar, A. Photovoltaic penetration issues and impacts in distribution network—A review. Renew. Sustain. Energy Rev. 2016, 53, 594–605. [Google Scholar] [CrossRef]
- Chathurangi, D.; Jayatunga, U.; Rathnayake, M.; Wickramasinghe, A.; Agalgaonkar, A.; Perera, S. Potential power quality impacts on LV distribution networks with high penetration levels of solar PV. In Proceedings of the 2018 18th International Conference on Harmonics and Quality of Power (ICHQP), Ljubljana, Slovenia, 13–16 May 2018. [Google Scholar]
- Liu, Y.J.; Tai, Y.H.; Huang, C.Y.; Su, H.J.; Lan, P.H.; Hsieh, M.K. Assessment of the PV hosting capacity for the medium-voltage 11.4 kV distribution feeder. In Proceedings of the 2018 IEEE International Conference on Applied System Invention (ICASI), Chiba, Japan, 13–17 April 2018. [Google Scholar]
- Khaboot, N.; Chatthaworn, R.; Siritaratiwat, A.; Surawanitkun, C.; Khunkitti, P. Increasing PV penetration level in low voltage distribution system using optimal installation and operation of battery energy storage. Cogent Eng. 2019, 6, 1641911. [Google Scholar] [CrossRef]
- Tang, Y.; Burgos, R.; Li, C.; Boroyevich, D. Impact of PV inverter penetration on voltage profile and power loss in medium voltage distribution systems. In Proceedings of the 2016 IEEE 17th Workshop on Control and Modeling for Power Electronics (COMPEL), Trondheim, Norway, 27–30 June 2016. [Google Scholar]
- Neiva, L.J.R.; Coelho, F.C.R.; Peres, W.; Flávio, S.A.; Dias, L.R. Analysis of Power Flow Reversion in Distribution Transformers Due to Medium-Voltage Fault and Distributed Generation in Secondary Networks. J. Control. Autom. Electr. Syst. 2021, 32, 1718–1727. [Google Scholar] [CrossRef]
- Alsafasfeh, Q.; Saraereh, O.A.; Khan, I.; Kim, S. Solar PV Grid Power Flow Analysis. Sustainability 2019, 11, 1744. [Google Scholar] [CrossRef]
- Nousdilis, A.I.; Chrysochos, A.I.; Papagiannis, G.K.; Christoforidis, G.C. The impact of Photovoltaic Self-Consumption Rate on voltage levels in LV distribution grids. In Proceedings of the 2017 11th IEEE International Conference on Compatibility, Power Electronics and Power Engineering (CPE-POWERENG), Cadiz, Spain, 4–6 April 2017. [Google Scholar]
- Hasheminamin, M.; Agelidis, V.G.; Heidari, A. Impact study of high PV penetration in low and medium-voltage networks when considering residential and industrial load profile. In Proceedings of the 2013 International Conference on Renewable Energy Research and Applications (ICRERA), Madrid, Spain, 20–23 October 2013. [Google Scholar]
- Kroposki, B.; Mather, B.; Hasper-Tuttle, J.; Neal, R.; Katiraei, F.; Yazdani, A.; Aguero, R.; Hoff, T.E.; Norris, B.L.; Parkins, A.; et al. Integrating high penetrations of PV into Southern California. In Proceedings of the 26th European Photovoltaic Solar Energy Conference and Exhibition (26th EU PVSEC), Hamburg, Germany, 5–6 September 2011; pp. 4197–4200. [Google Scholar]
- Singh, R.; Tripathi, P.; Yatendra, K. Impact of solar photovoltaic penetration in distribution network. In Proceedings of the 2019 3rd International Conference on Recent Developments in Control, Automation & Power Engineering (RDCAPE), Noida, India, 10–11 October 2019. [Google Scholar]
- Almeida, D.; Pasupuleti, J.; Raveendran, S.K.; Khan, M.R.B. Performance evaluation of solar PV inverter controls for overvoltage mitigation in MV distribution networks. Electronics 2021, 10, 1456. [Google Scholar] [CrossRef]
- Kenneth, A.P.; Folly, K. Voltage rise issue with high penetration of grid connected PV. IFAC Proc. Vol. 2014, 47, 4959–4966. [Google Scholar] [CrossRef]
- Reno, M.J.; Coogan, K. Grid Integrated Distributed PV (GridPV), Version 2; Sandia National Lab.(SNL-NM): Albuquerque, NM, USA, 2014. [Google Scholar]
- Almeida, D.; Pasupuleti, J.; Ekanayake, J. Performance evaluation of PV penetration at different locations in a LV distribution network connected with an off-load tap changing transformer. Indones. J. Electr. Eng. Comput. Sci. 2021, 21, 987–993. [Google Scholar] [CrossRef]
- Maghami, M.R.; Pasupuleti, J.; Ling, C.M. A static and dynamic analysis of photovoltaic penetration into MV distribution network. Processes 2023, 11, 1172. [Google Scholar] [CrossRef]
- Namin, M.H.; Agelidis, V.G. Voltage sensitivity study of LV/MV networks under high penetration of photovoltaic generation considering residential and industrial load profiles. In Proceedings of the 2013 IEEE 39th Photovoltaic Specialists Conference (PVSC), Tampa, FL, USA, 16–21 June 2013. [Google Scholar]
- Maghami, M.R.; Pasupuleti, J.; Ling, C.M. Impact of Photovoltaic Penetration on Medium Voltage Distribution Network. Sustainability 2023, 15, 5613. [Google Scholar] [CrossRef]
- Aziz, T.; Ketjoy, N. PV penetration limits in low voltage networks and voltage variations. IEEE Access 2017, 5, 16784–16792. [Google Scholar] [CrossRef]
Figure 1.
SLD of the typical Malaysian urban and rural networks.
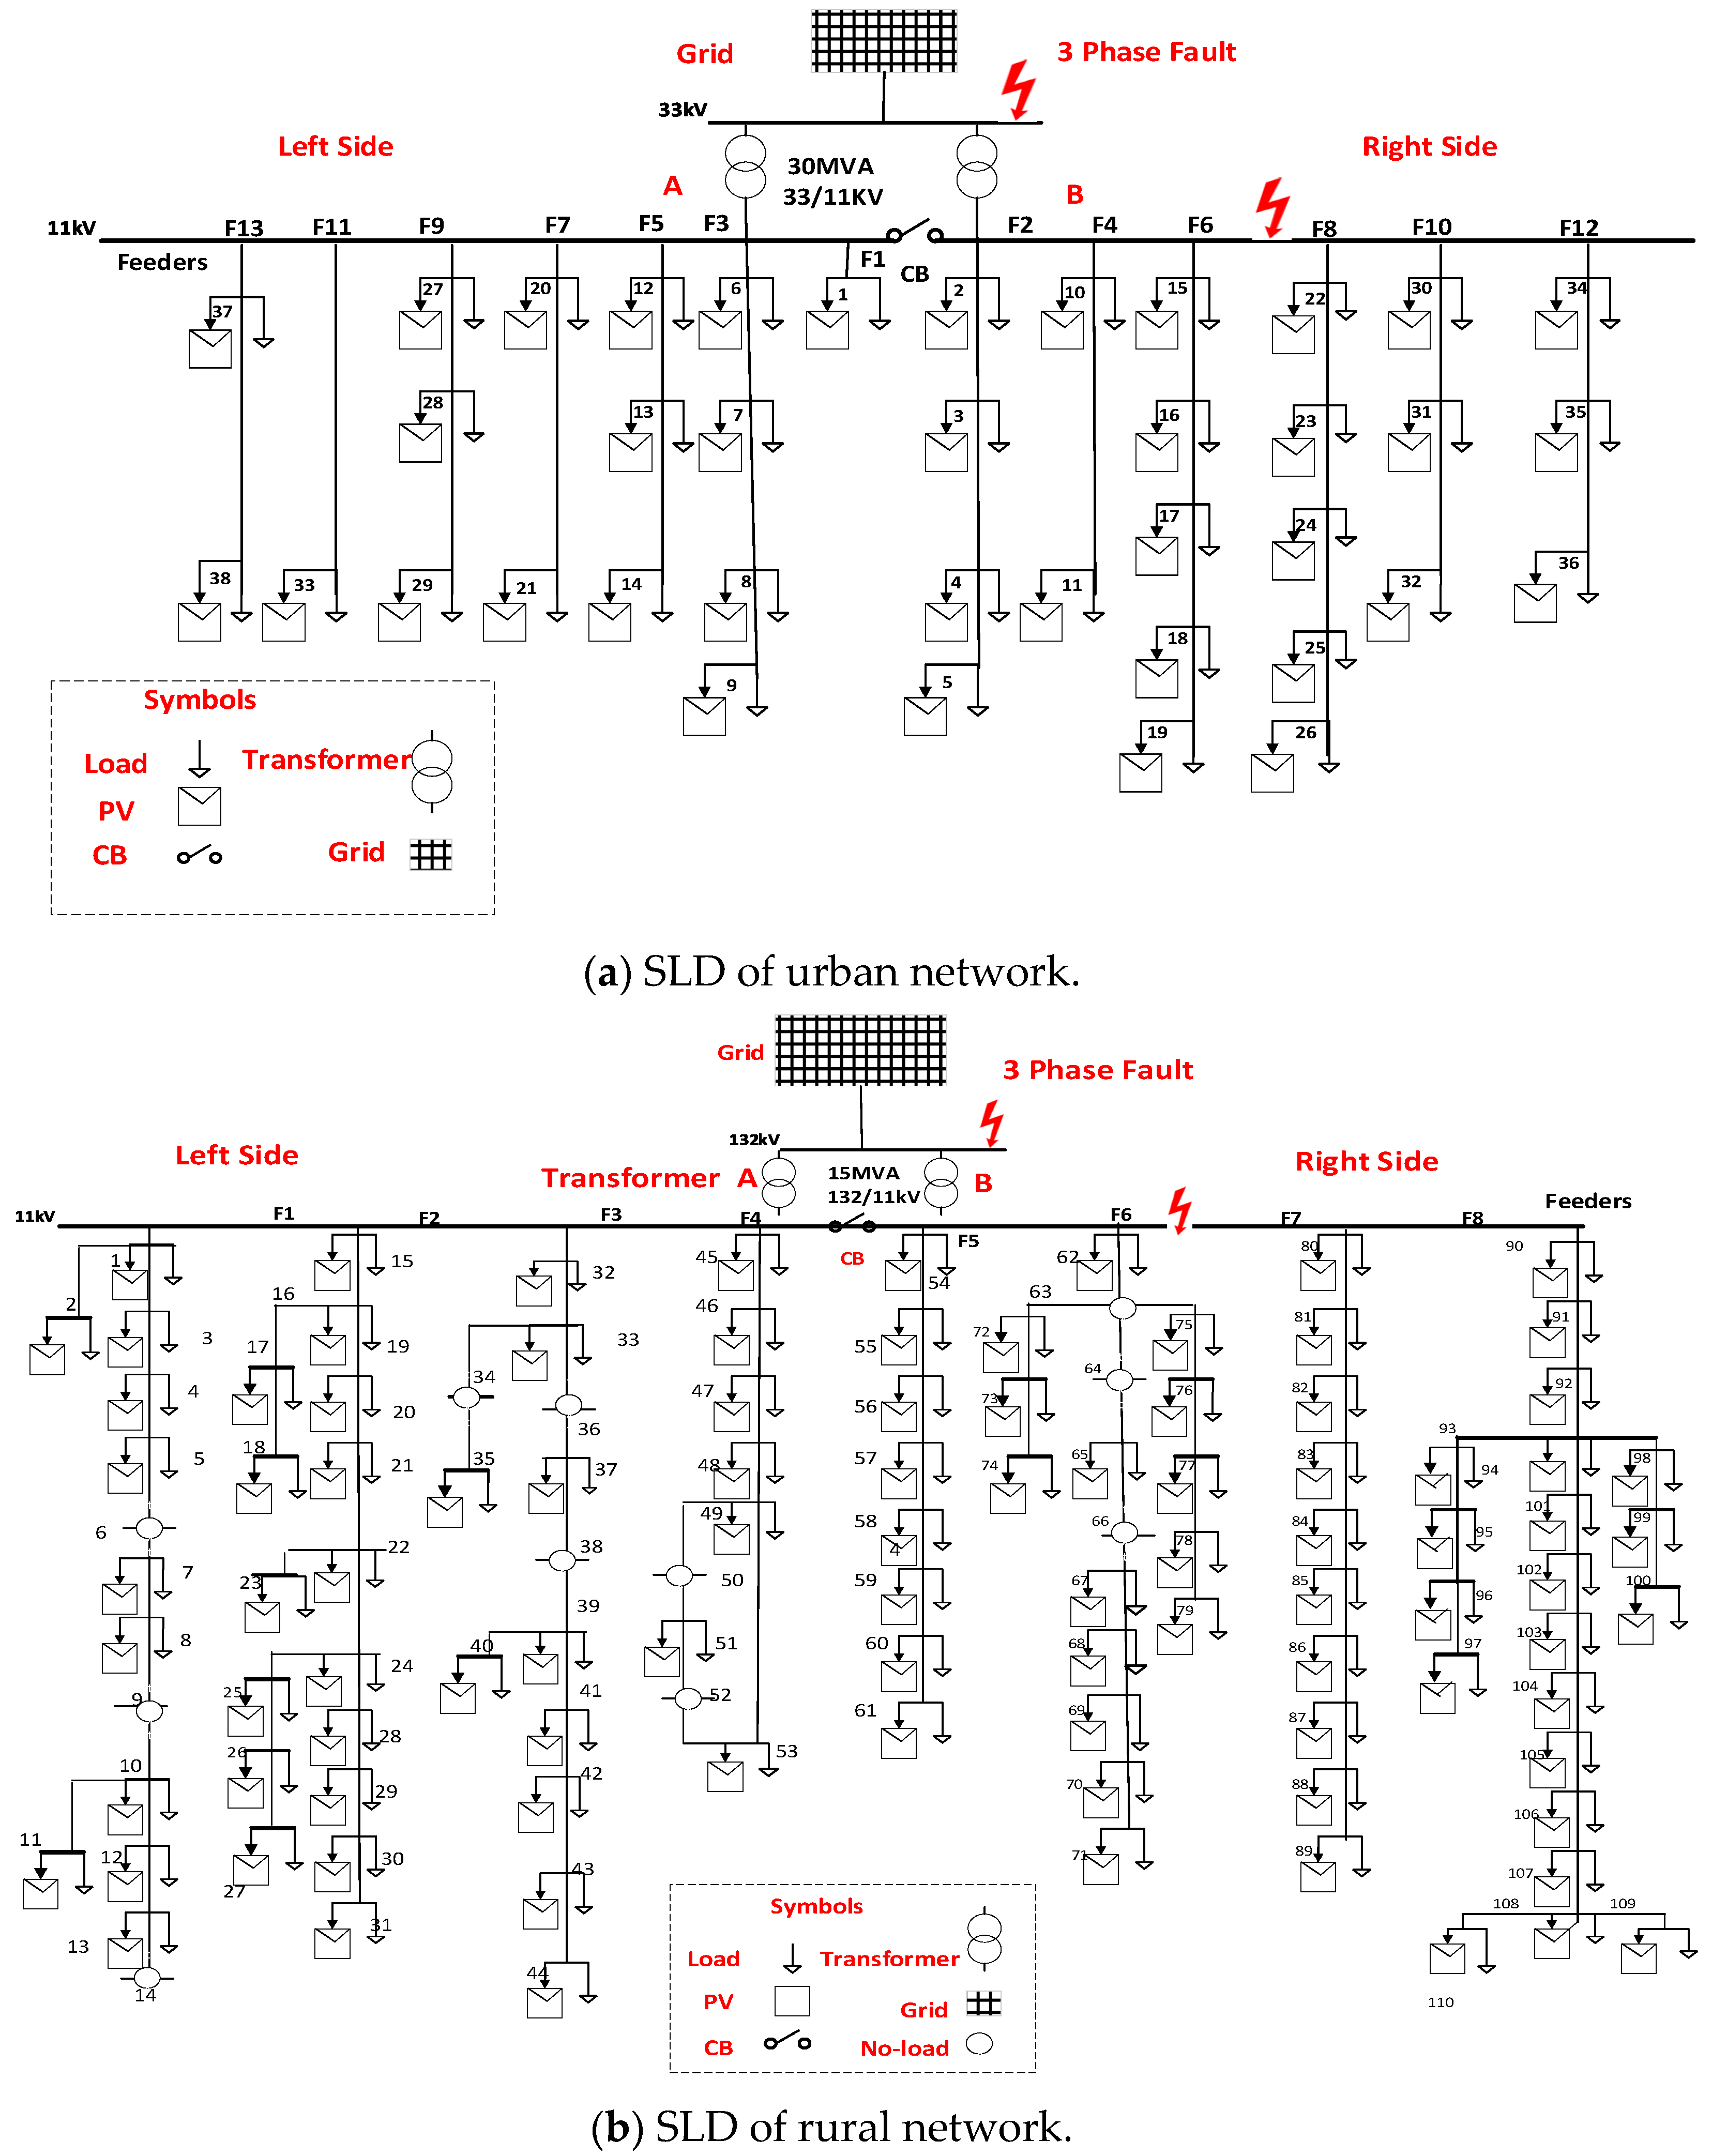
Figure 2.
The fundamental principle of cosimulation between OpenDSS and MATLAB.
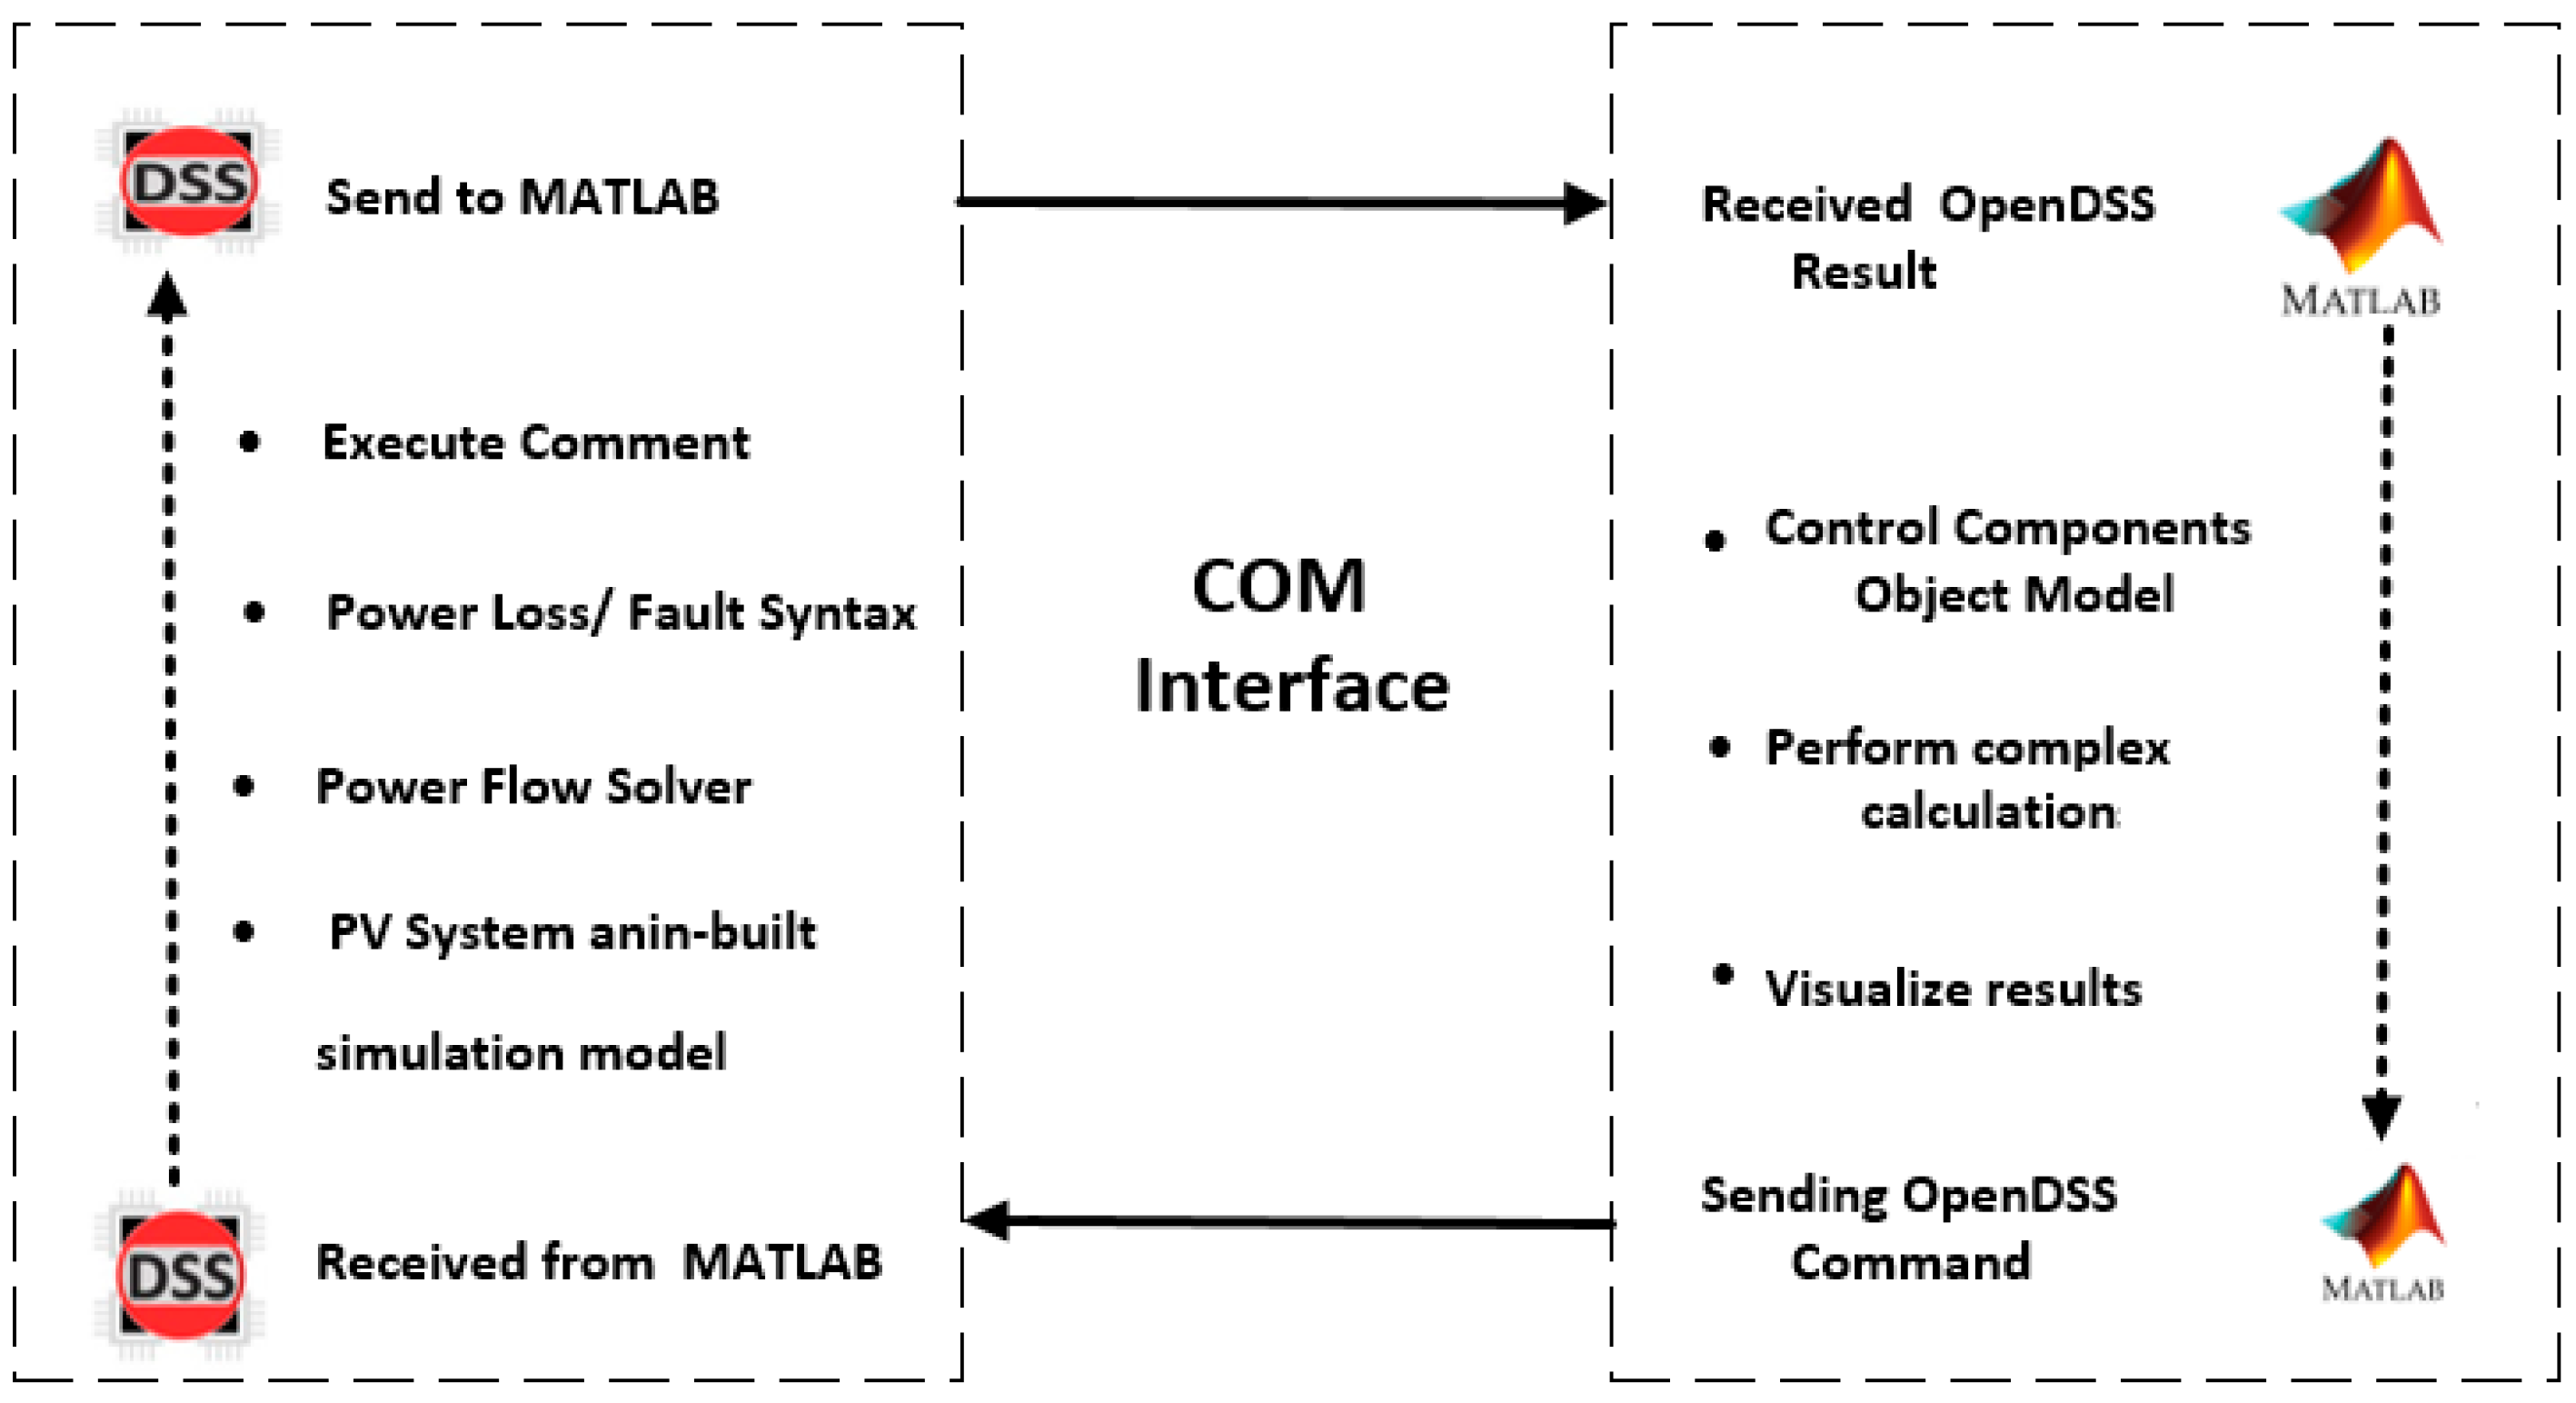
Figure 3.
Overall simulation scenarios.

Figure 4.
Load rating of each node (a) and cable length from bus 11kV to each node (b) for urban network.
Figure 4.
Load rating of each node (a) and cable length from bus 11kV to each node (b) for urban network.
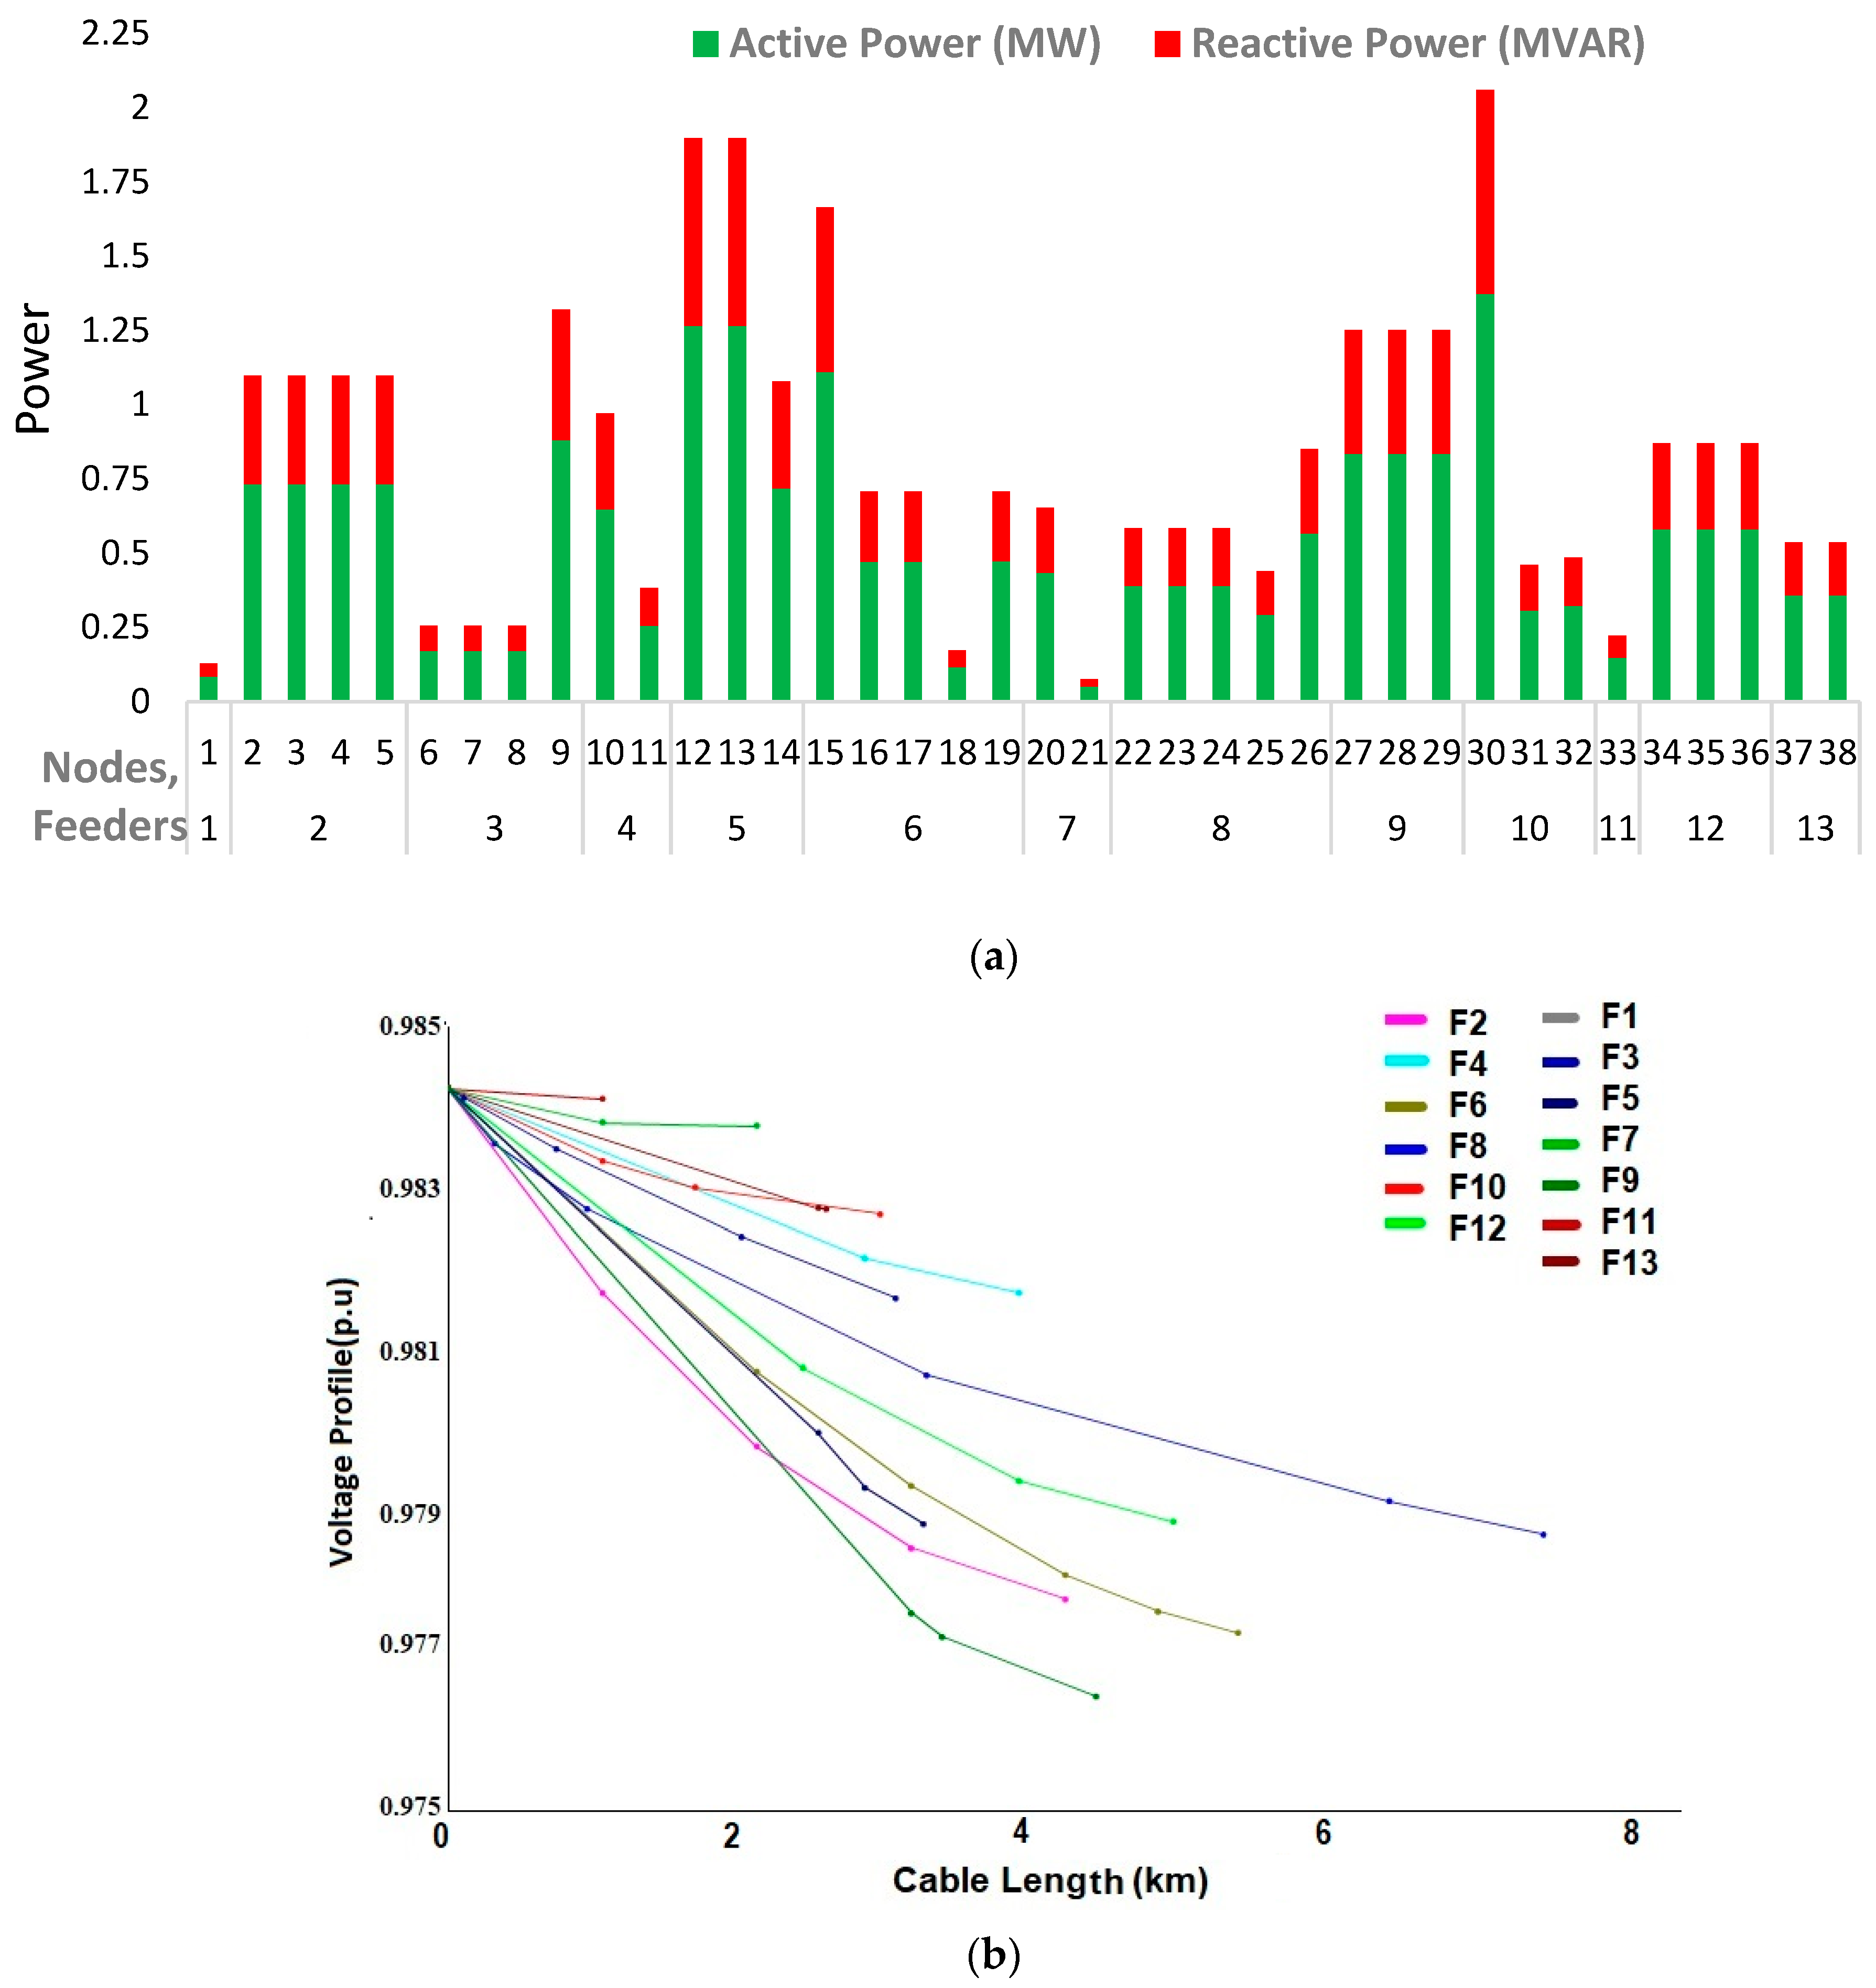
Figure 5.
Load rating of each node (a) and cable length from bus 11 kV to each node (b) for the rural network.
Figure 5.
Load rating of each node (a) and cable length from bus 11 kV to each node (b) for the rural network.
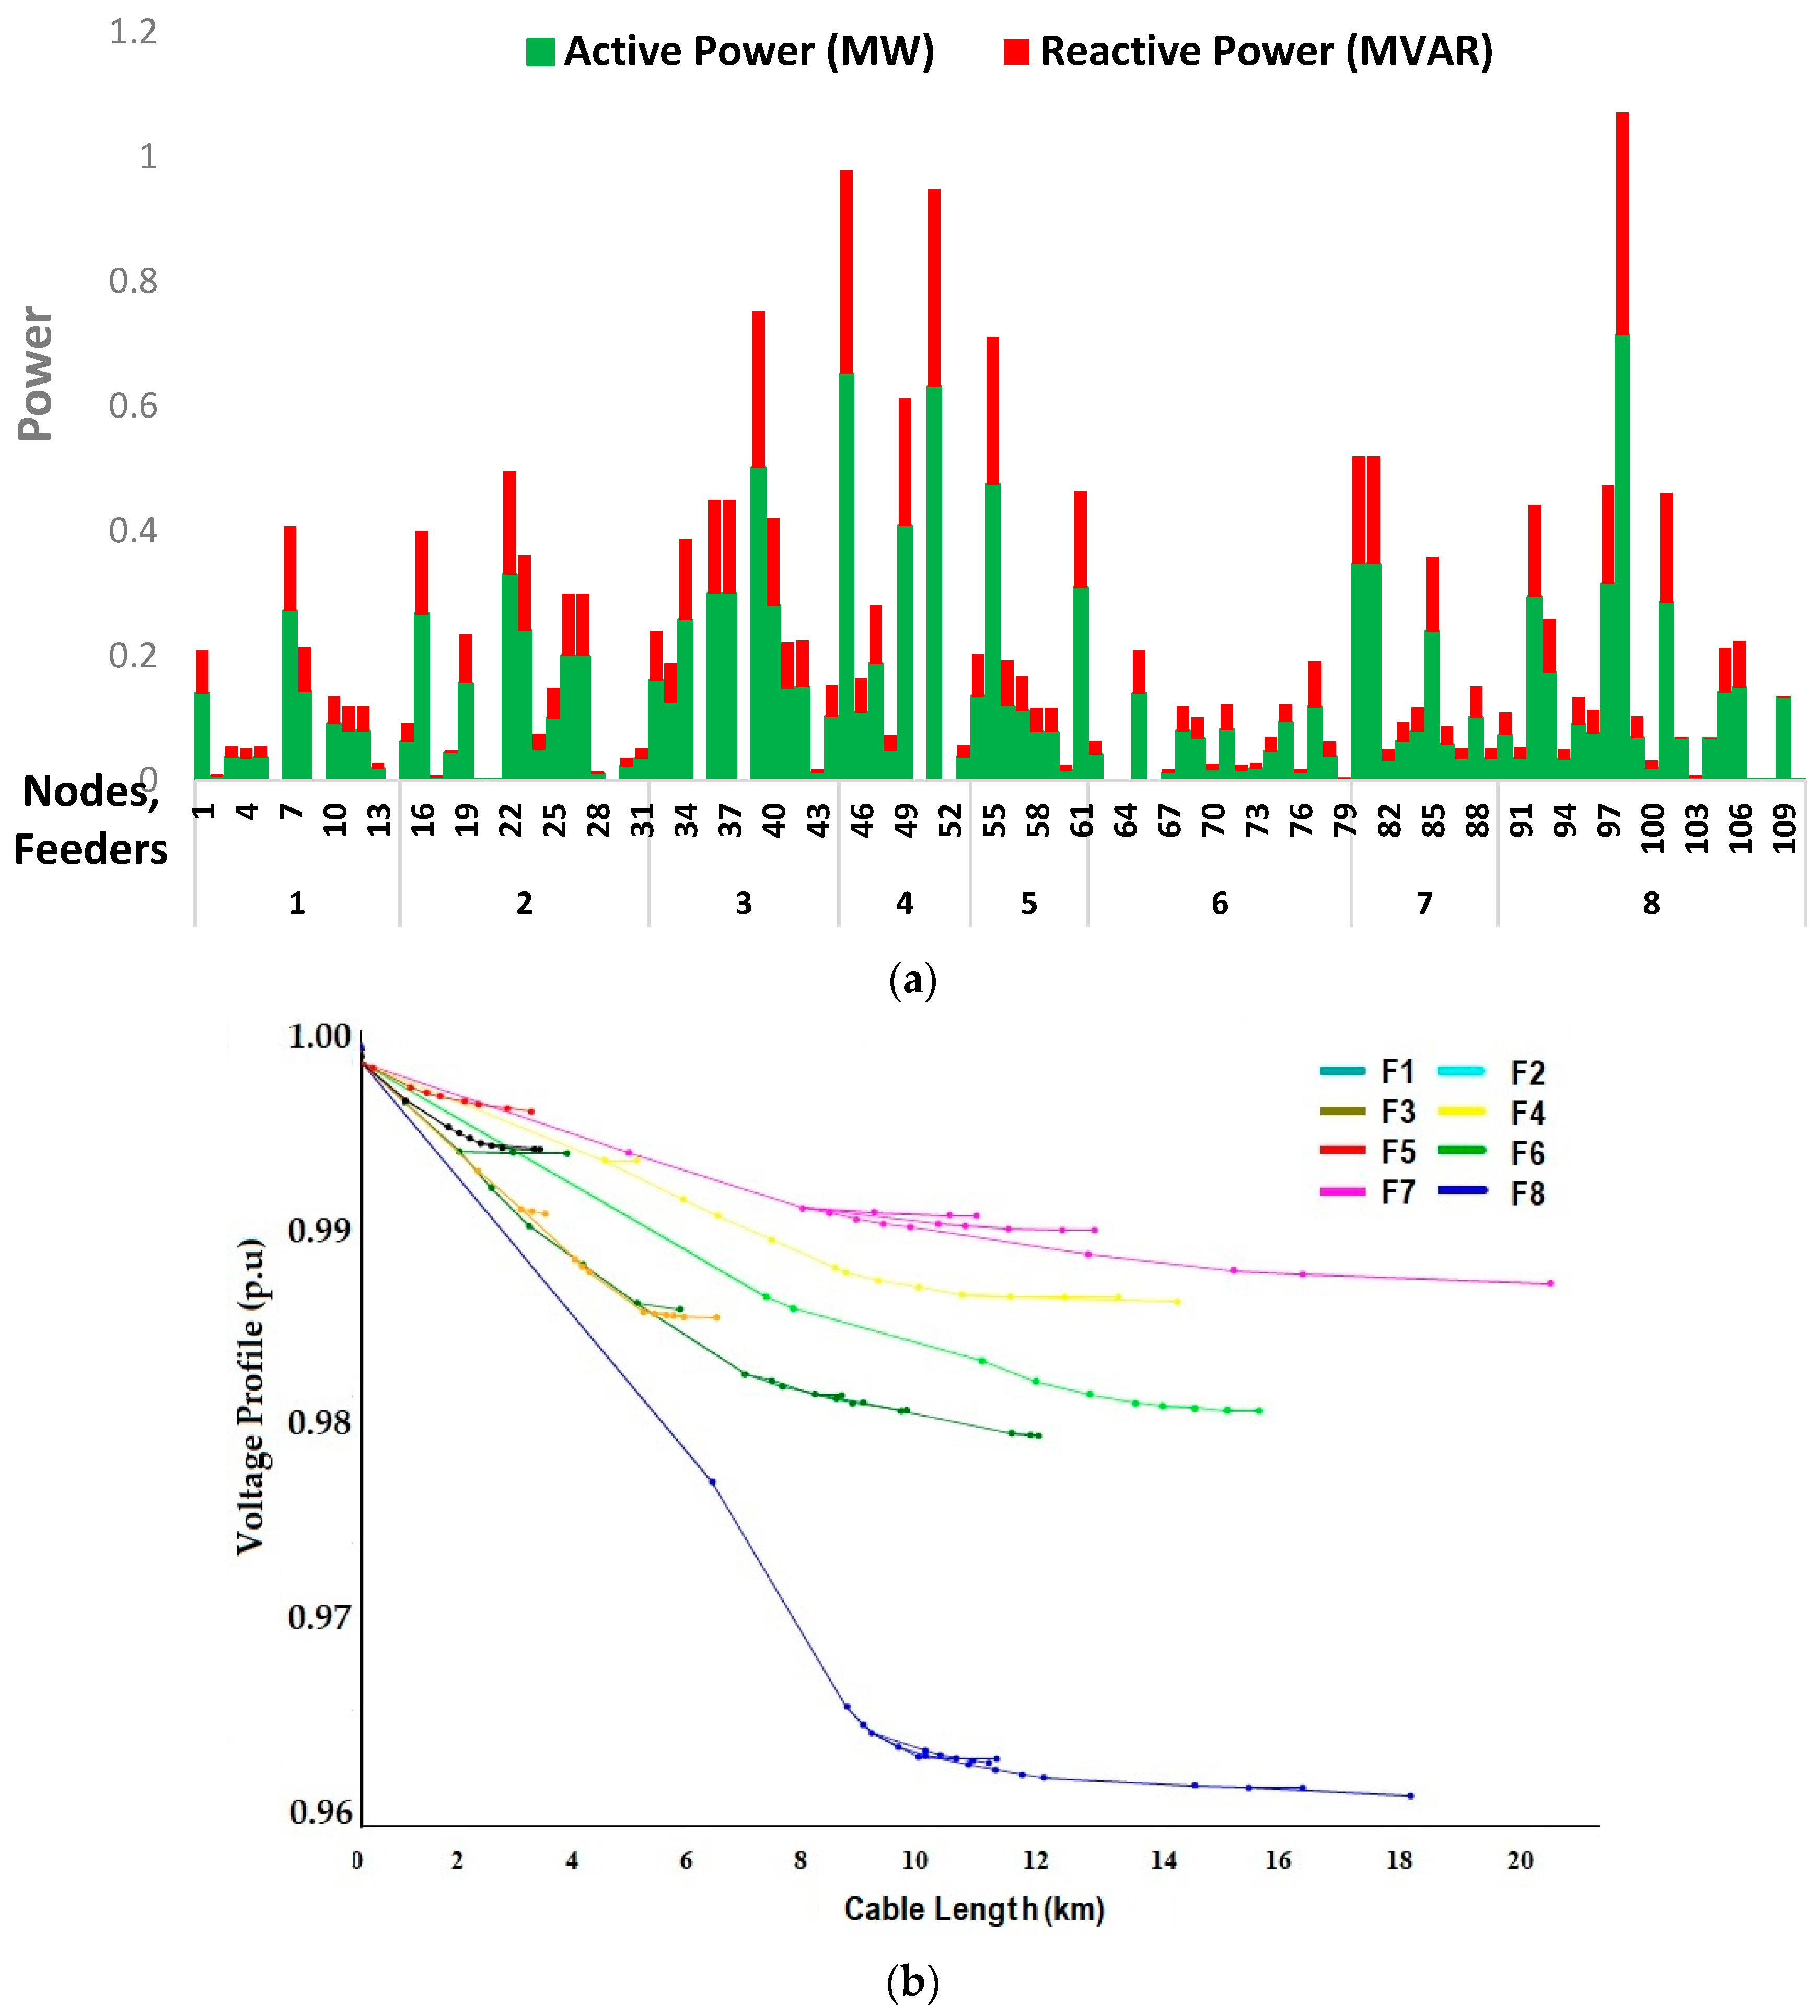
Figure 6.
The simulation results of the urban network under no load (a) and peak load (b) for case 1.
Figure 6.
The simulation results of the urban network under no load (a) and peak load (b) for case 1.
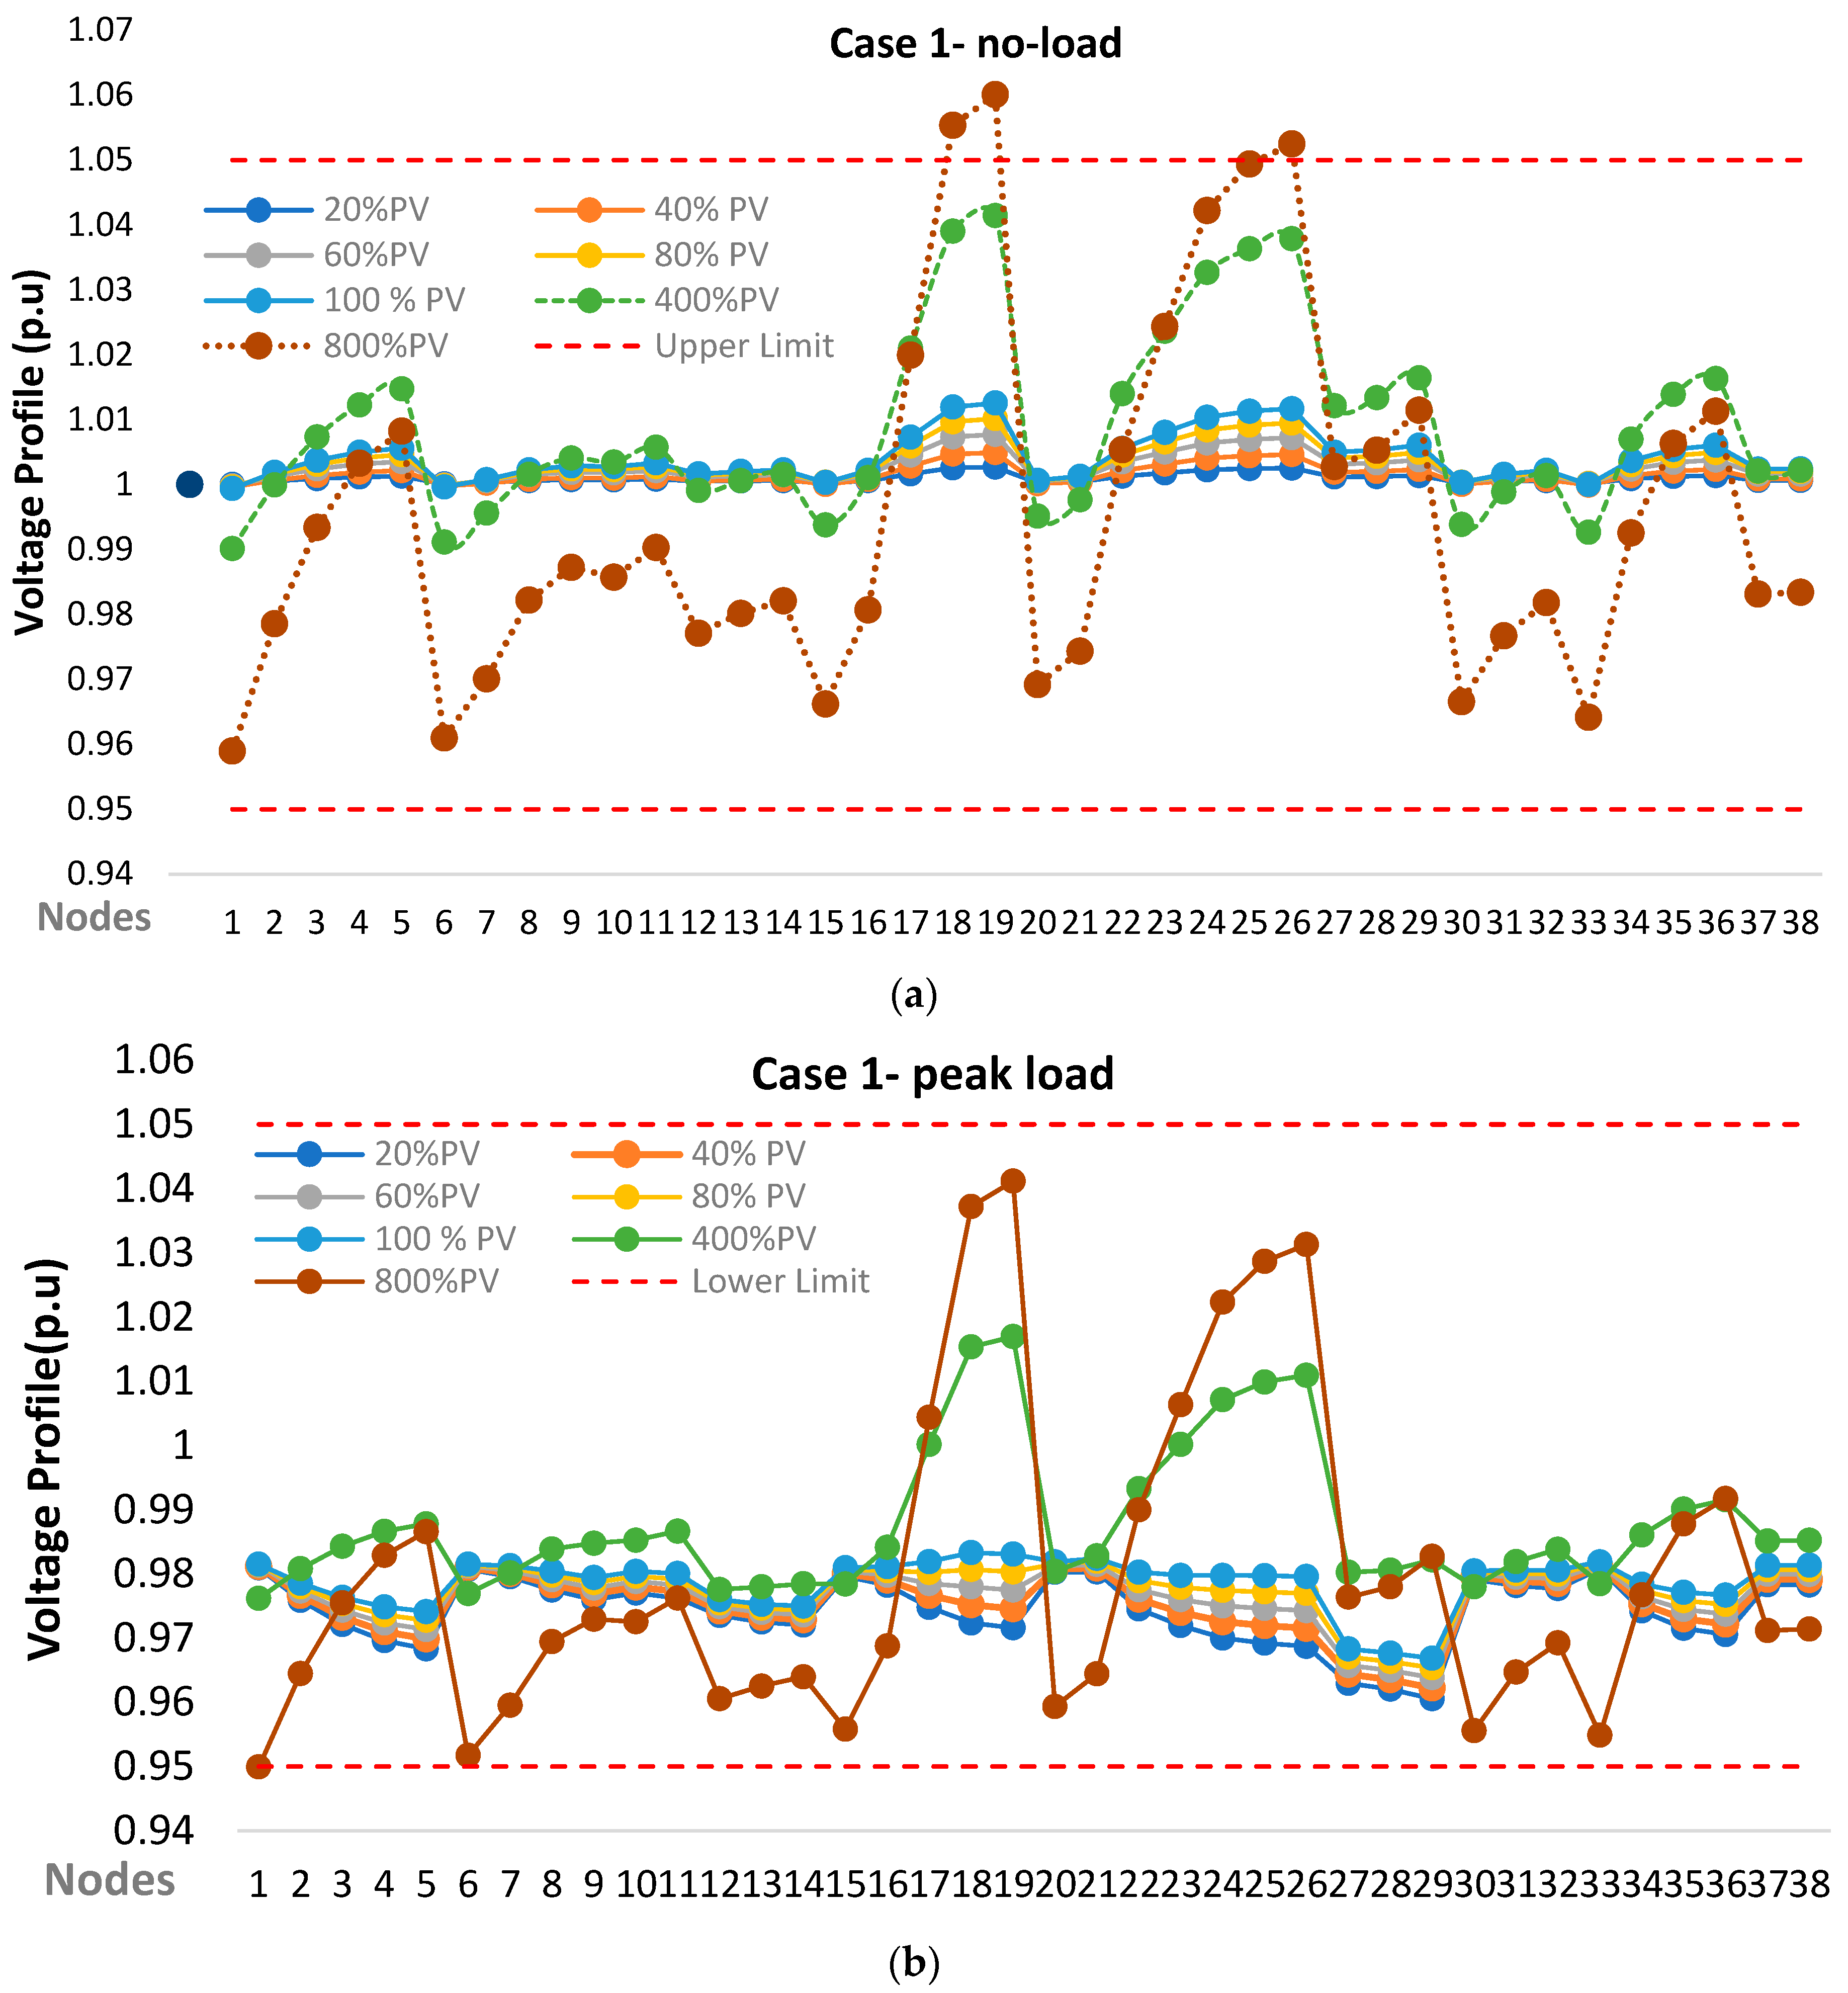
Figure 7.
The simulation results of the rural network under no load (a) and peak load (b) for case 1.
Figure 7.
The simulation results of the rural network under no load (a) and peak load (b) for case 1.
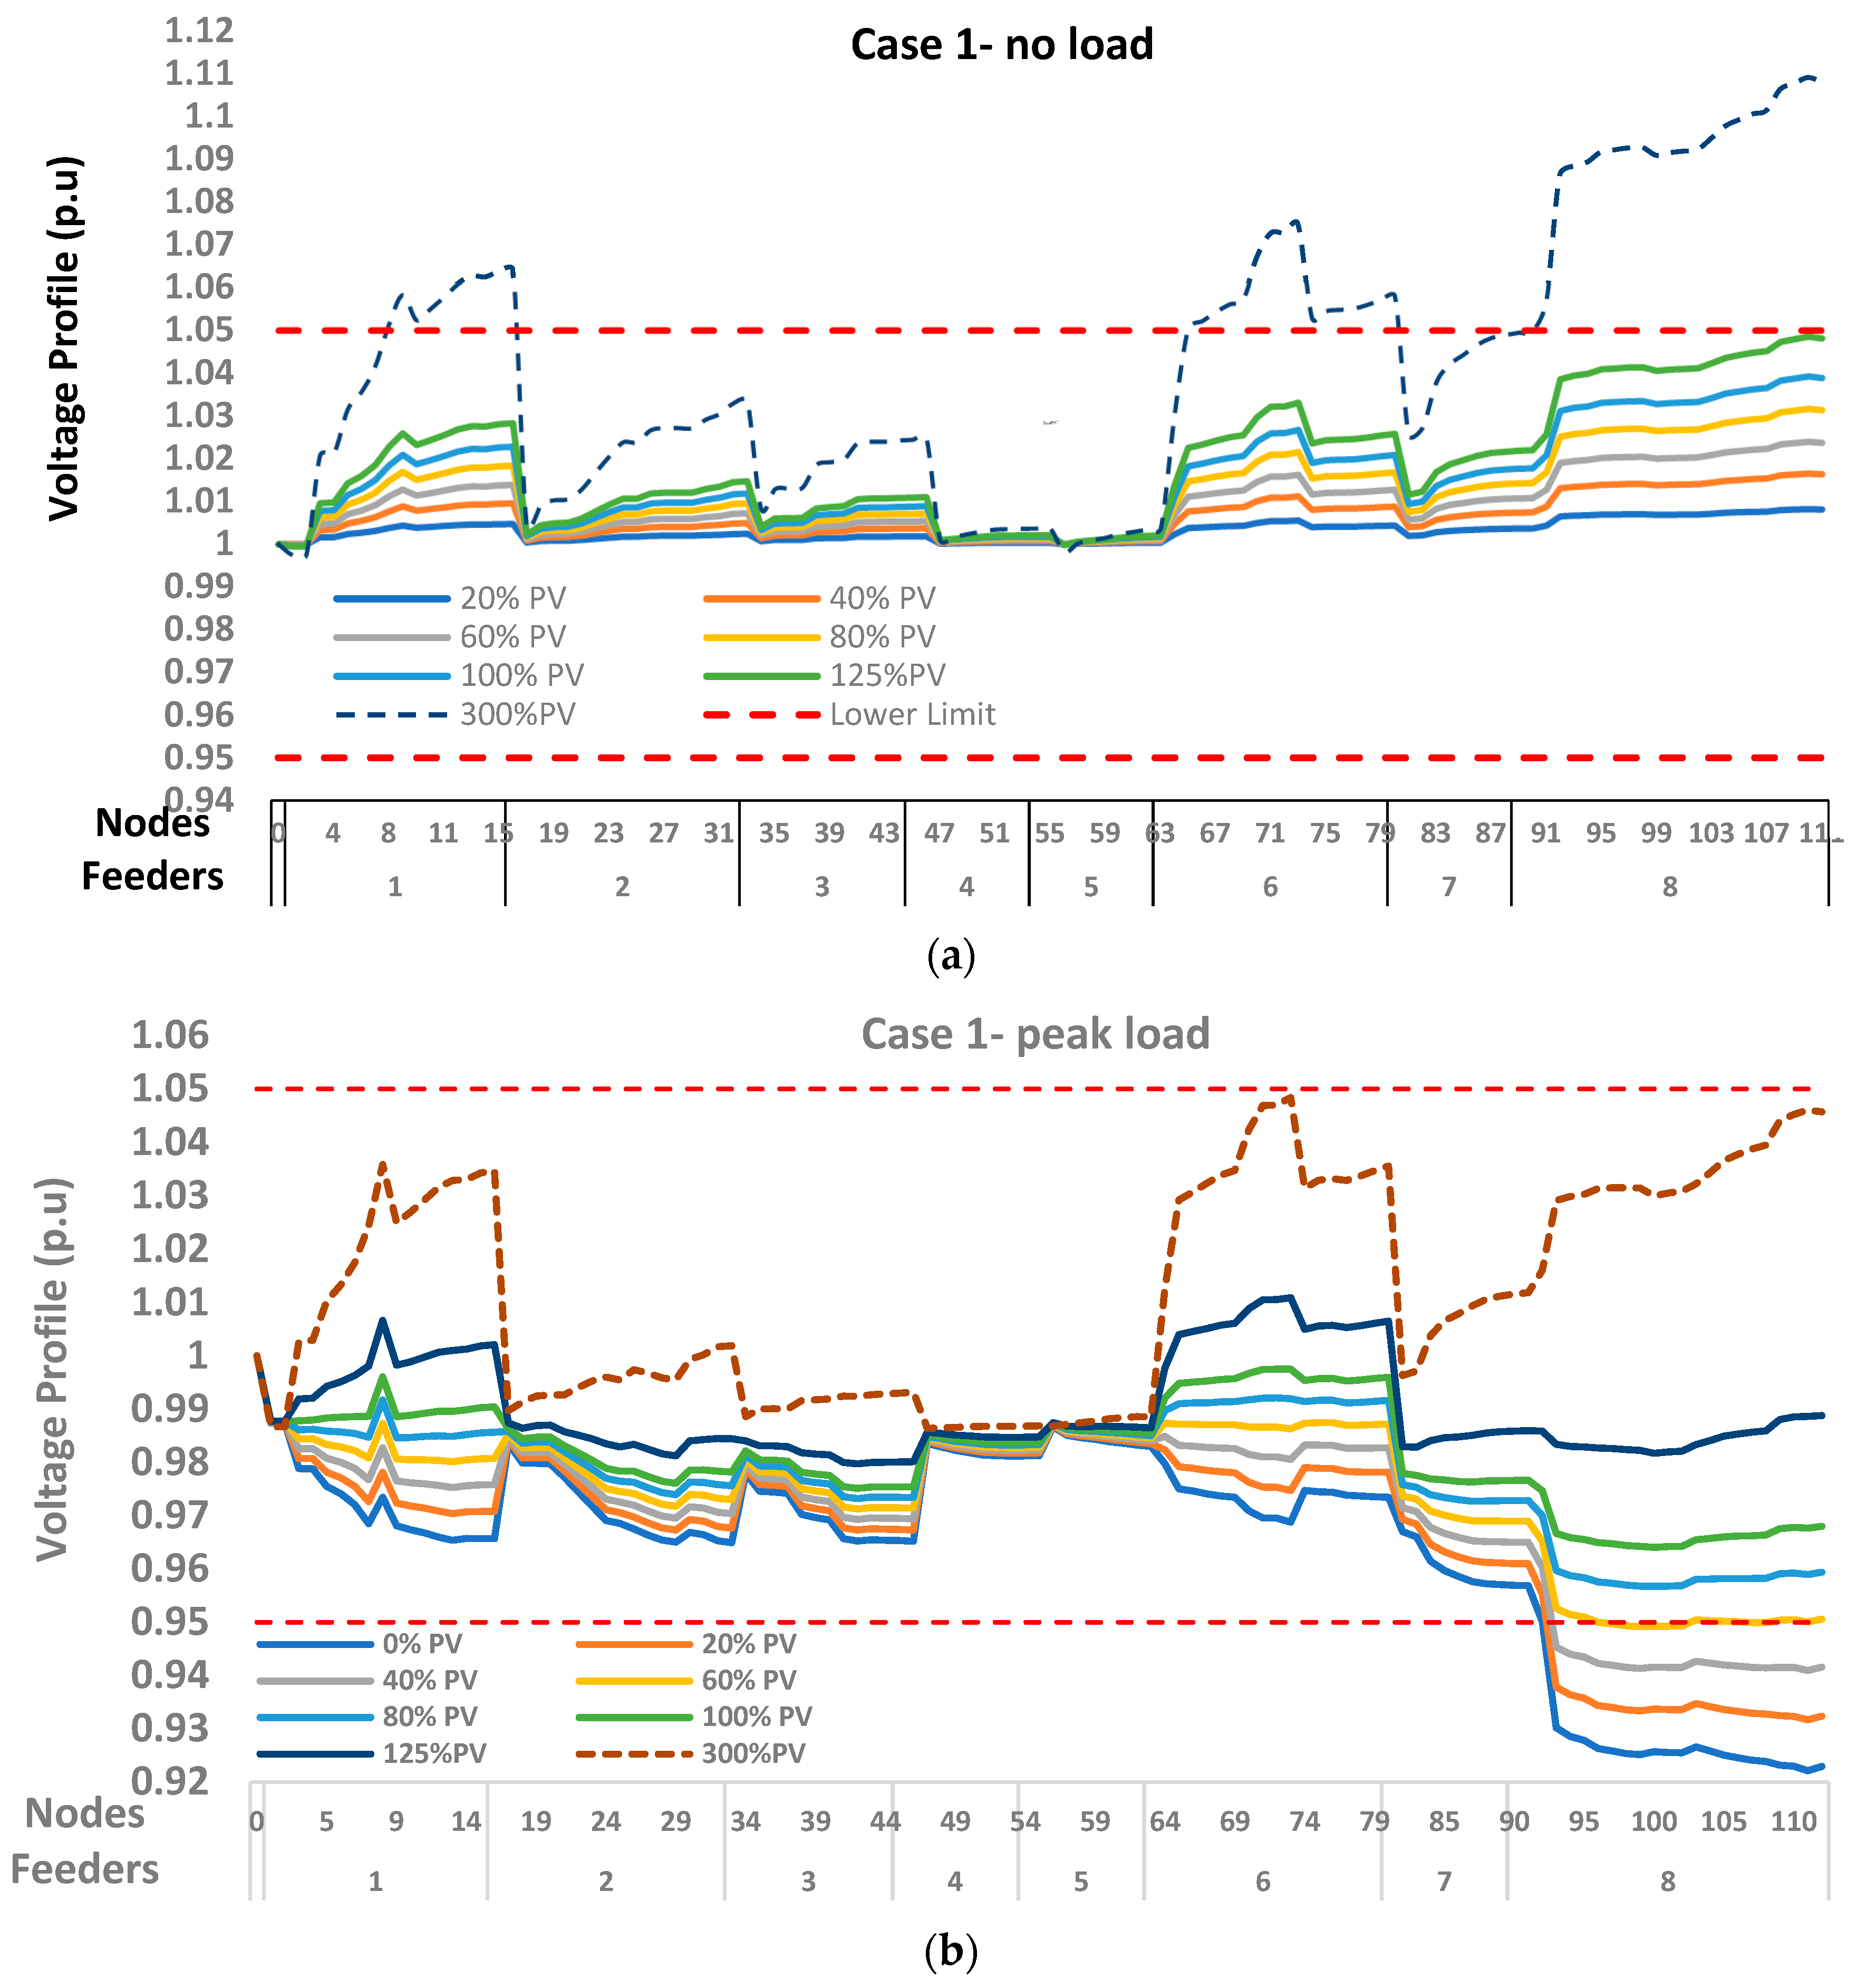
Figure 8.
The simulation results for urban network under no load (a) and peak load (b) for case 2.
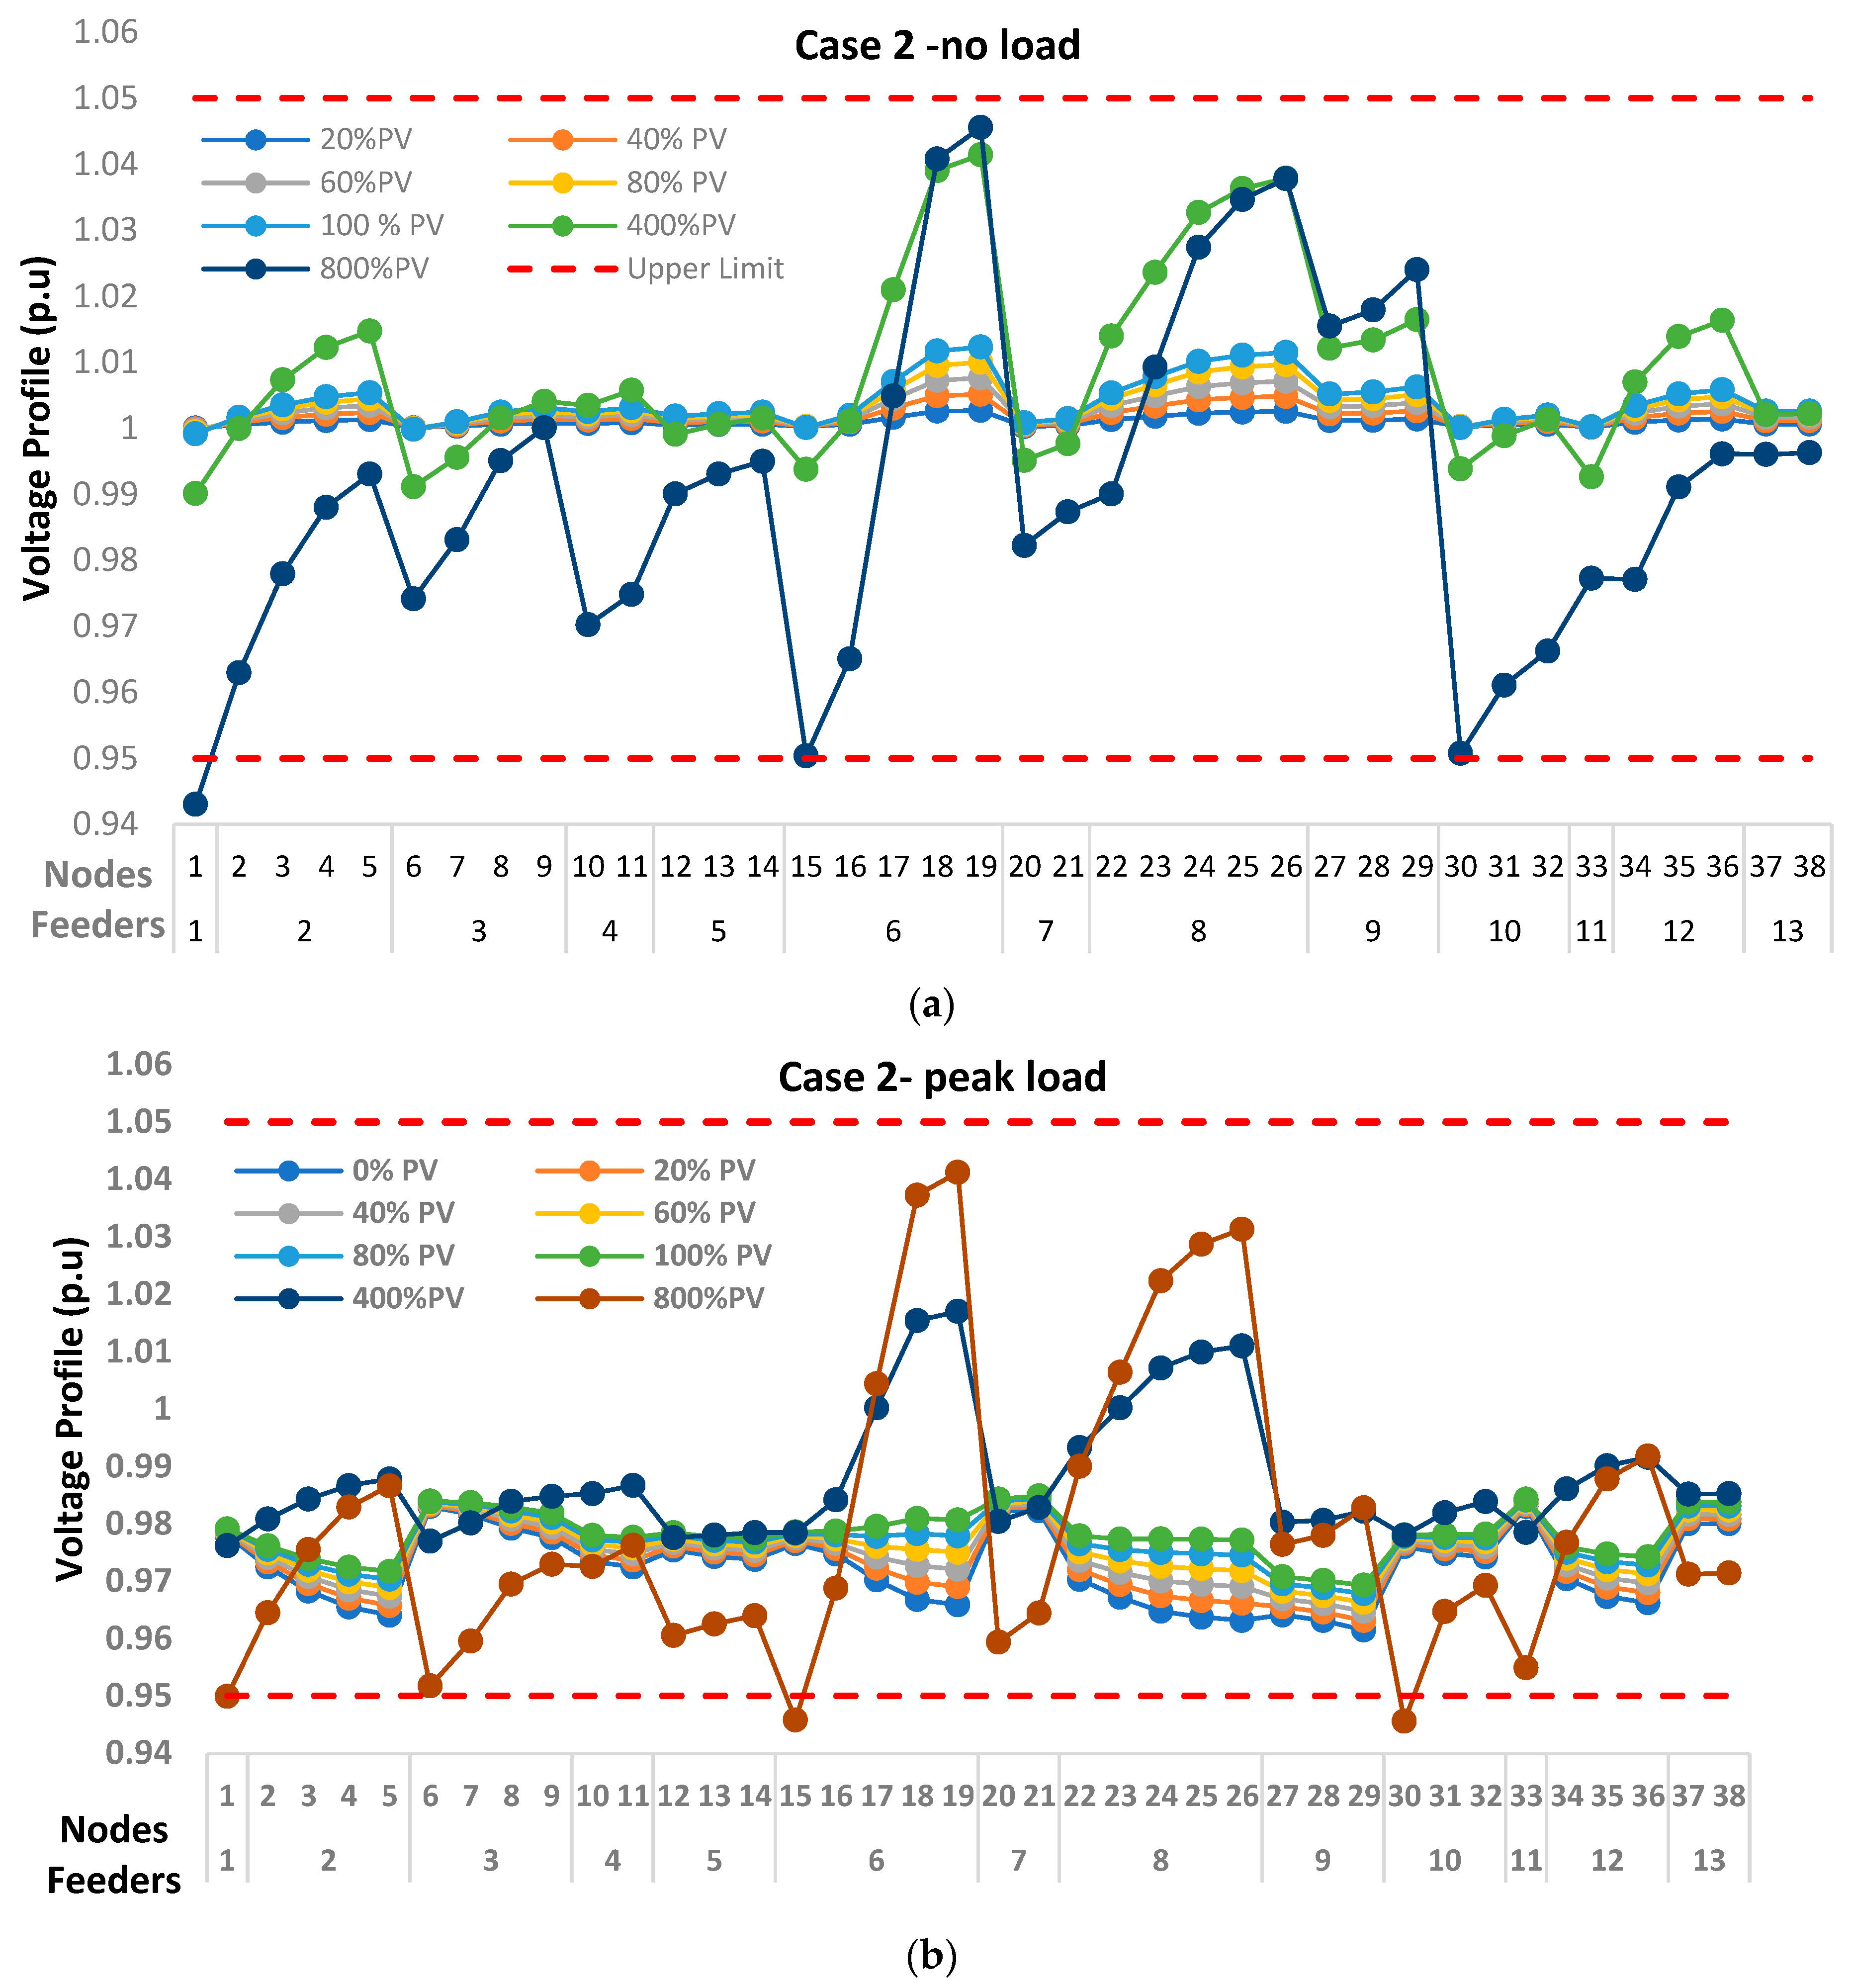
Figure 9.
The simulation results for the rural network under no load (a) and peak load (b) for case 2.
Figure 9.
The simulation results for the rural network under no load (a) and peak load (b) for case 2.

Figure 10.
The simulation results for the urban network under no load (a) and peak load (b) for case 3.
Figure 10.
The simulation results for the urban network under no load (a) and peak load (b) for case 3.

Figure 11.
The simulation results for rural network under no load (a) and peak load (b) for case 3.

Figure 12.
The fault analysis for 33 kV busbars in the urban network under the no-load (a) and the peak-load (b) fault analysis.
Figure 12.
The fault analysis for 33 kV busbars in the urban network under the no-load (a) and the peak-load (b) fault analysis.
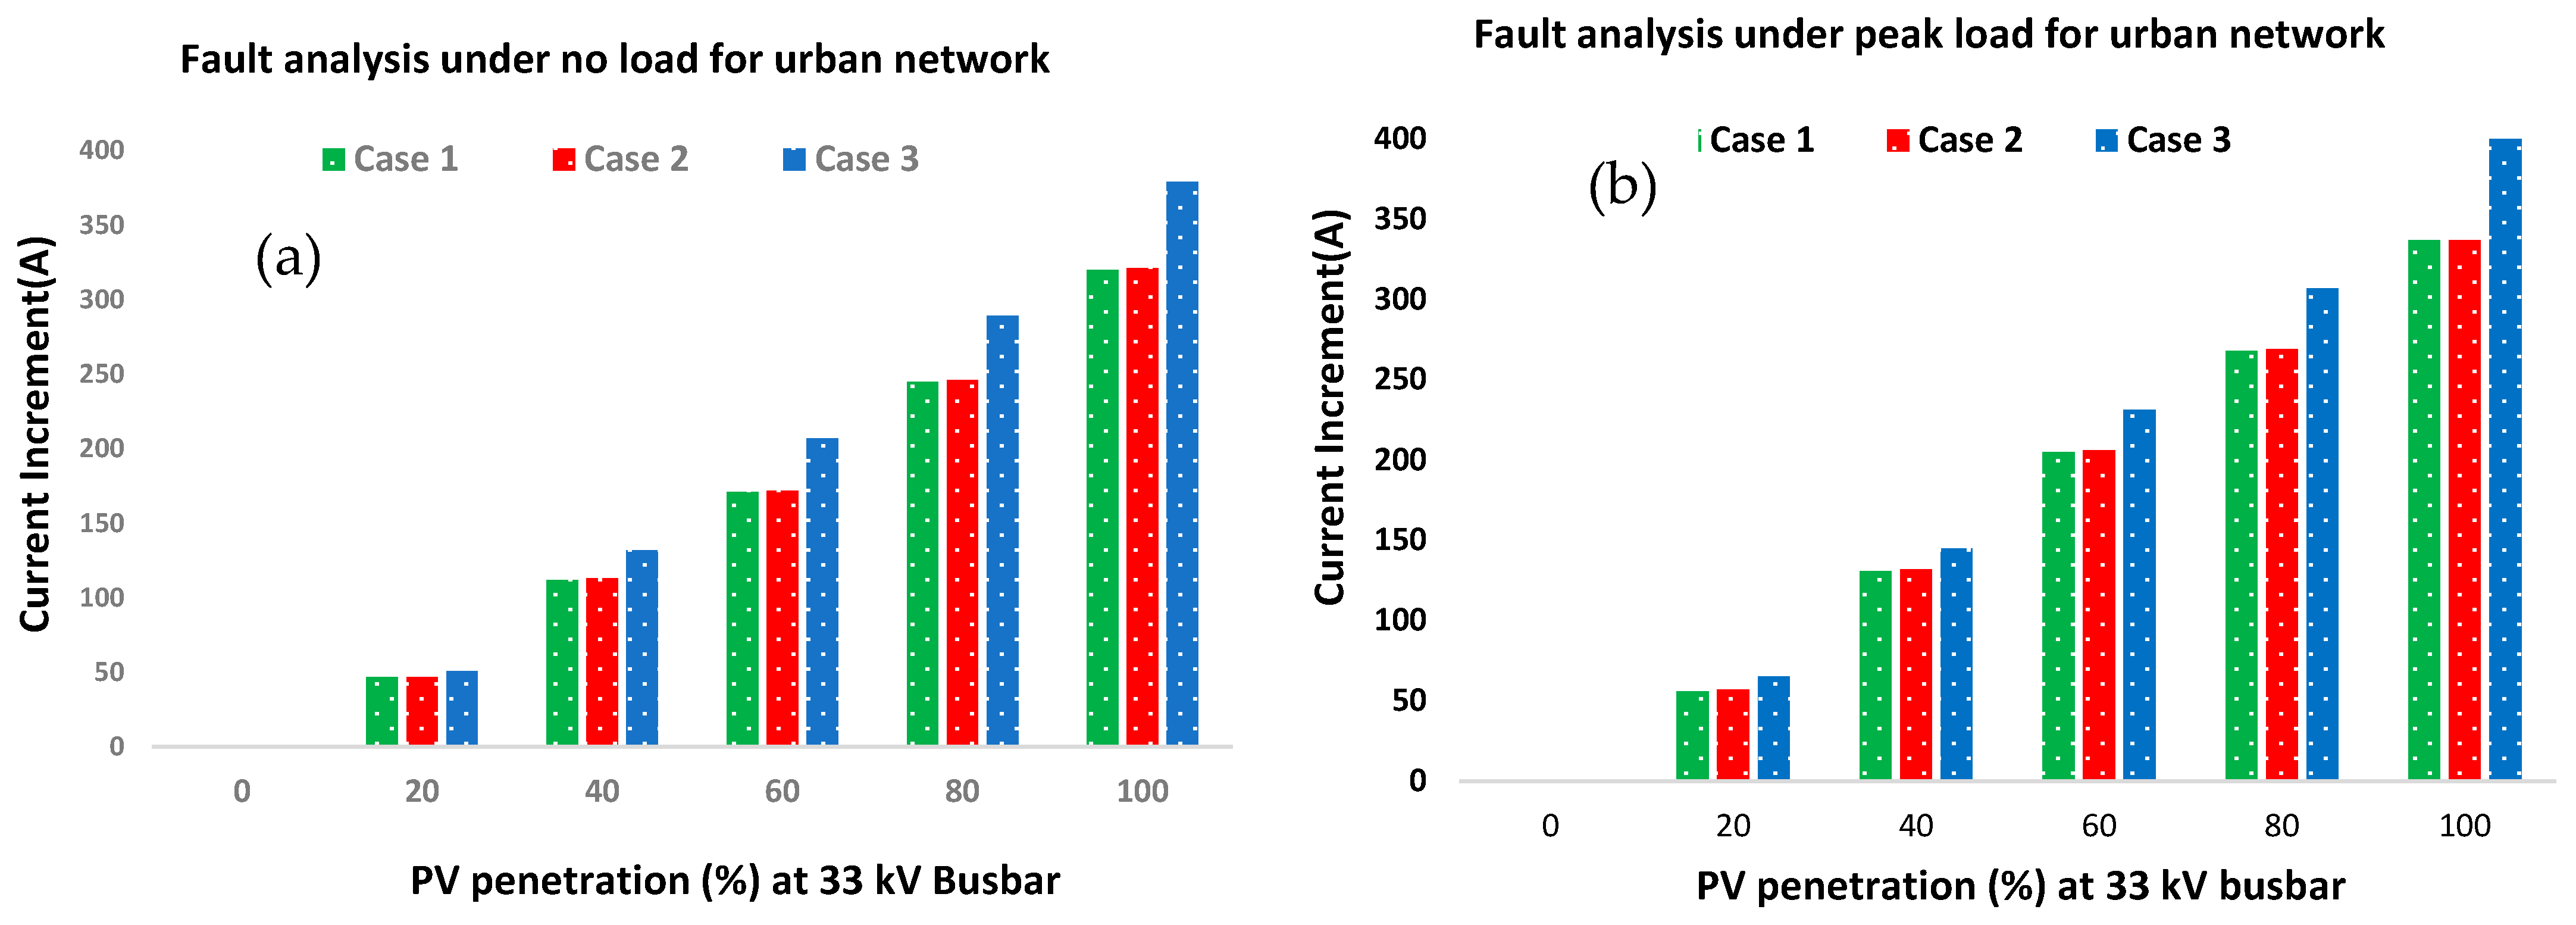
Figure 13.
The fault analysis for 11 kV busbars in the urban network under the no-load (a) and the peak-load (b) fault analysis.
Figure 13.
The fault analysis for 11 kV busbars in the urban network under the no-load (a) and the peak-load (b) fault analysis.
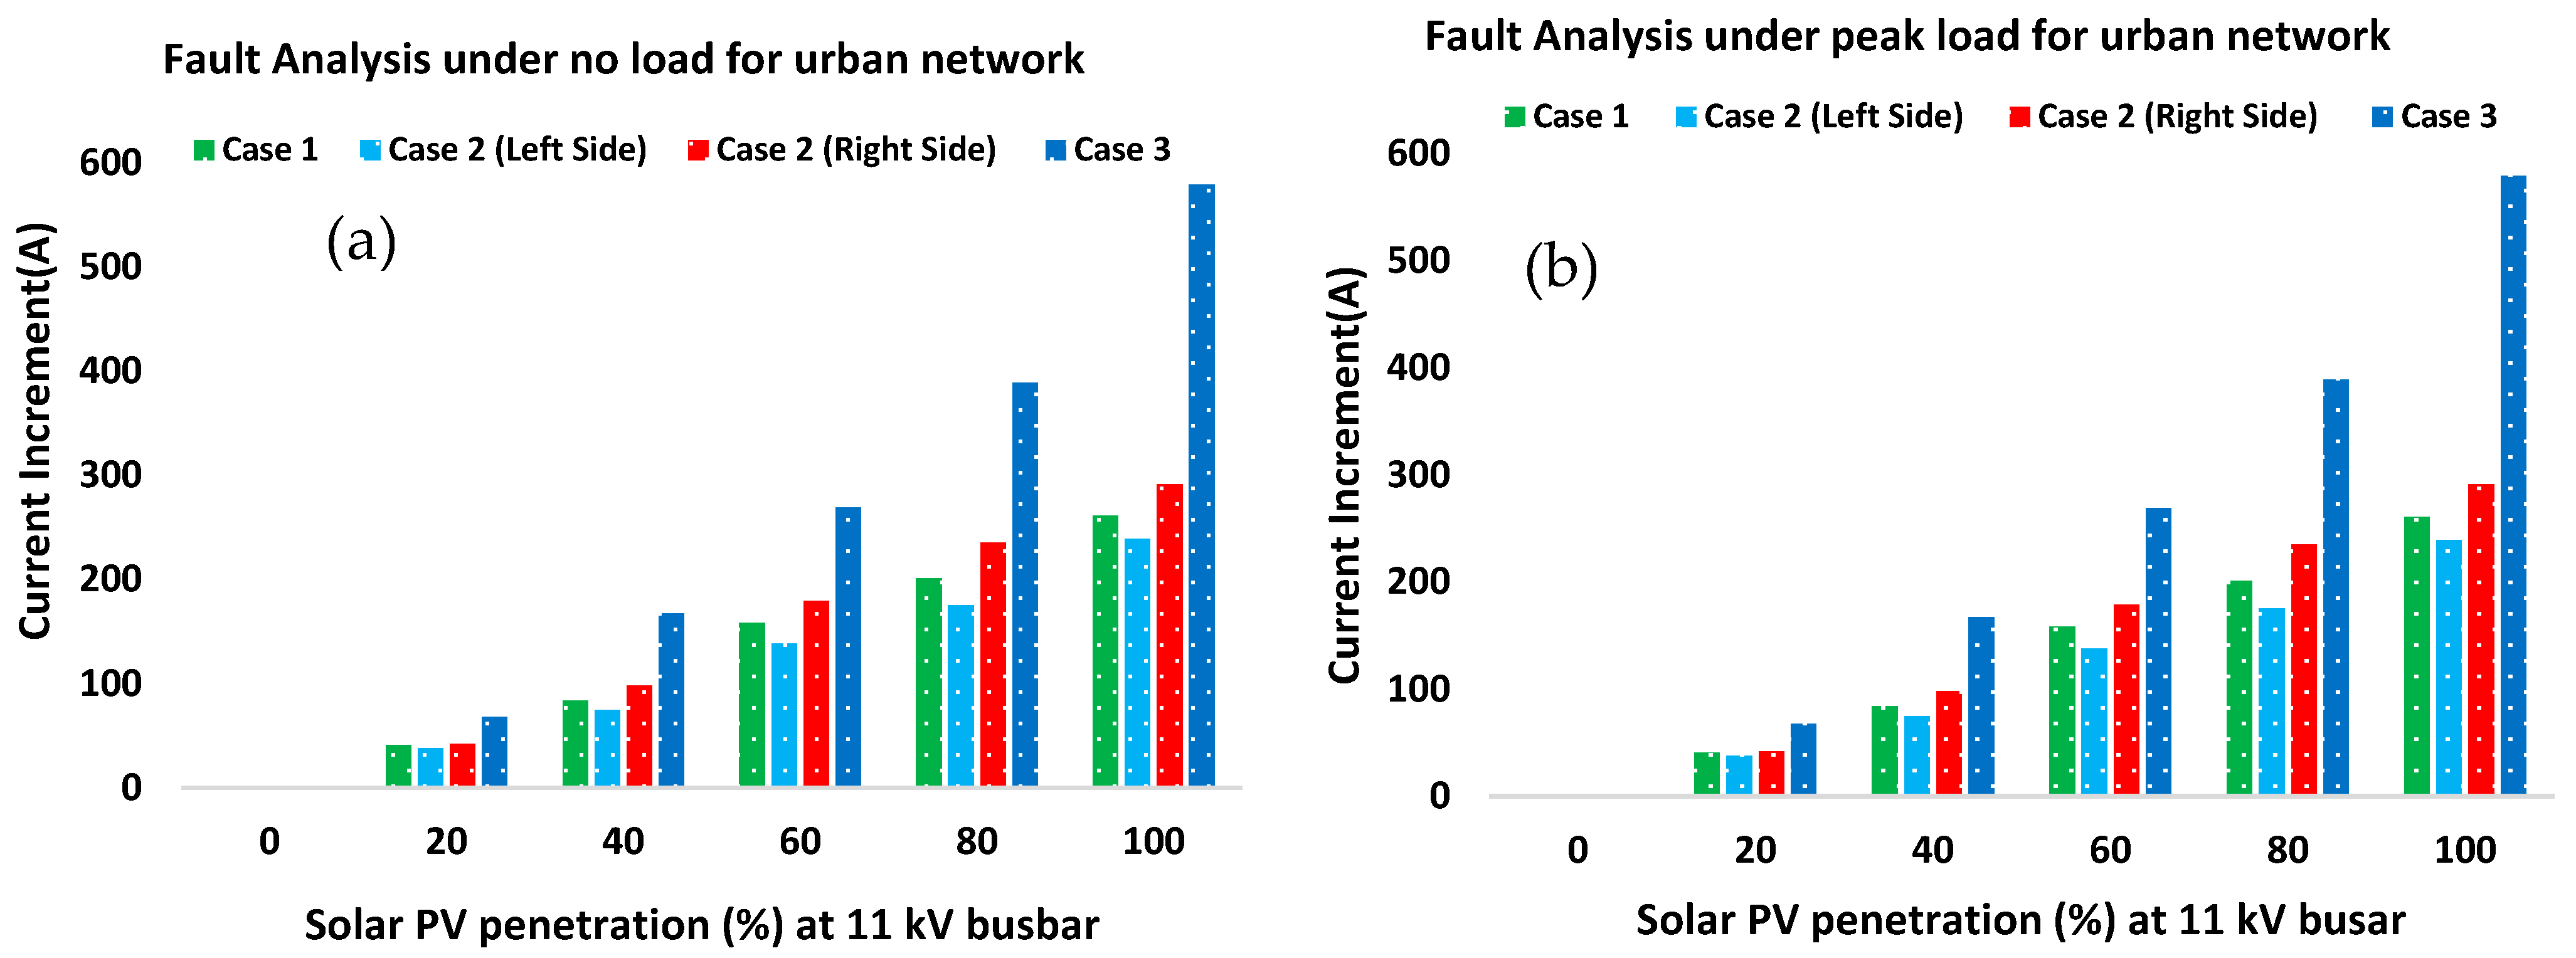
Figure 14.
The fault analysis for 132 kV busbars in the rural network for the no-load (a) and peak-load (b) fault analysis.
Figure 14.
The fault analysis for 132 kV busbars in the rural network for the no-load (a) and peak-load (b) fault analysis.
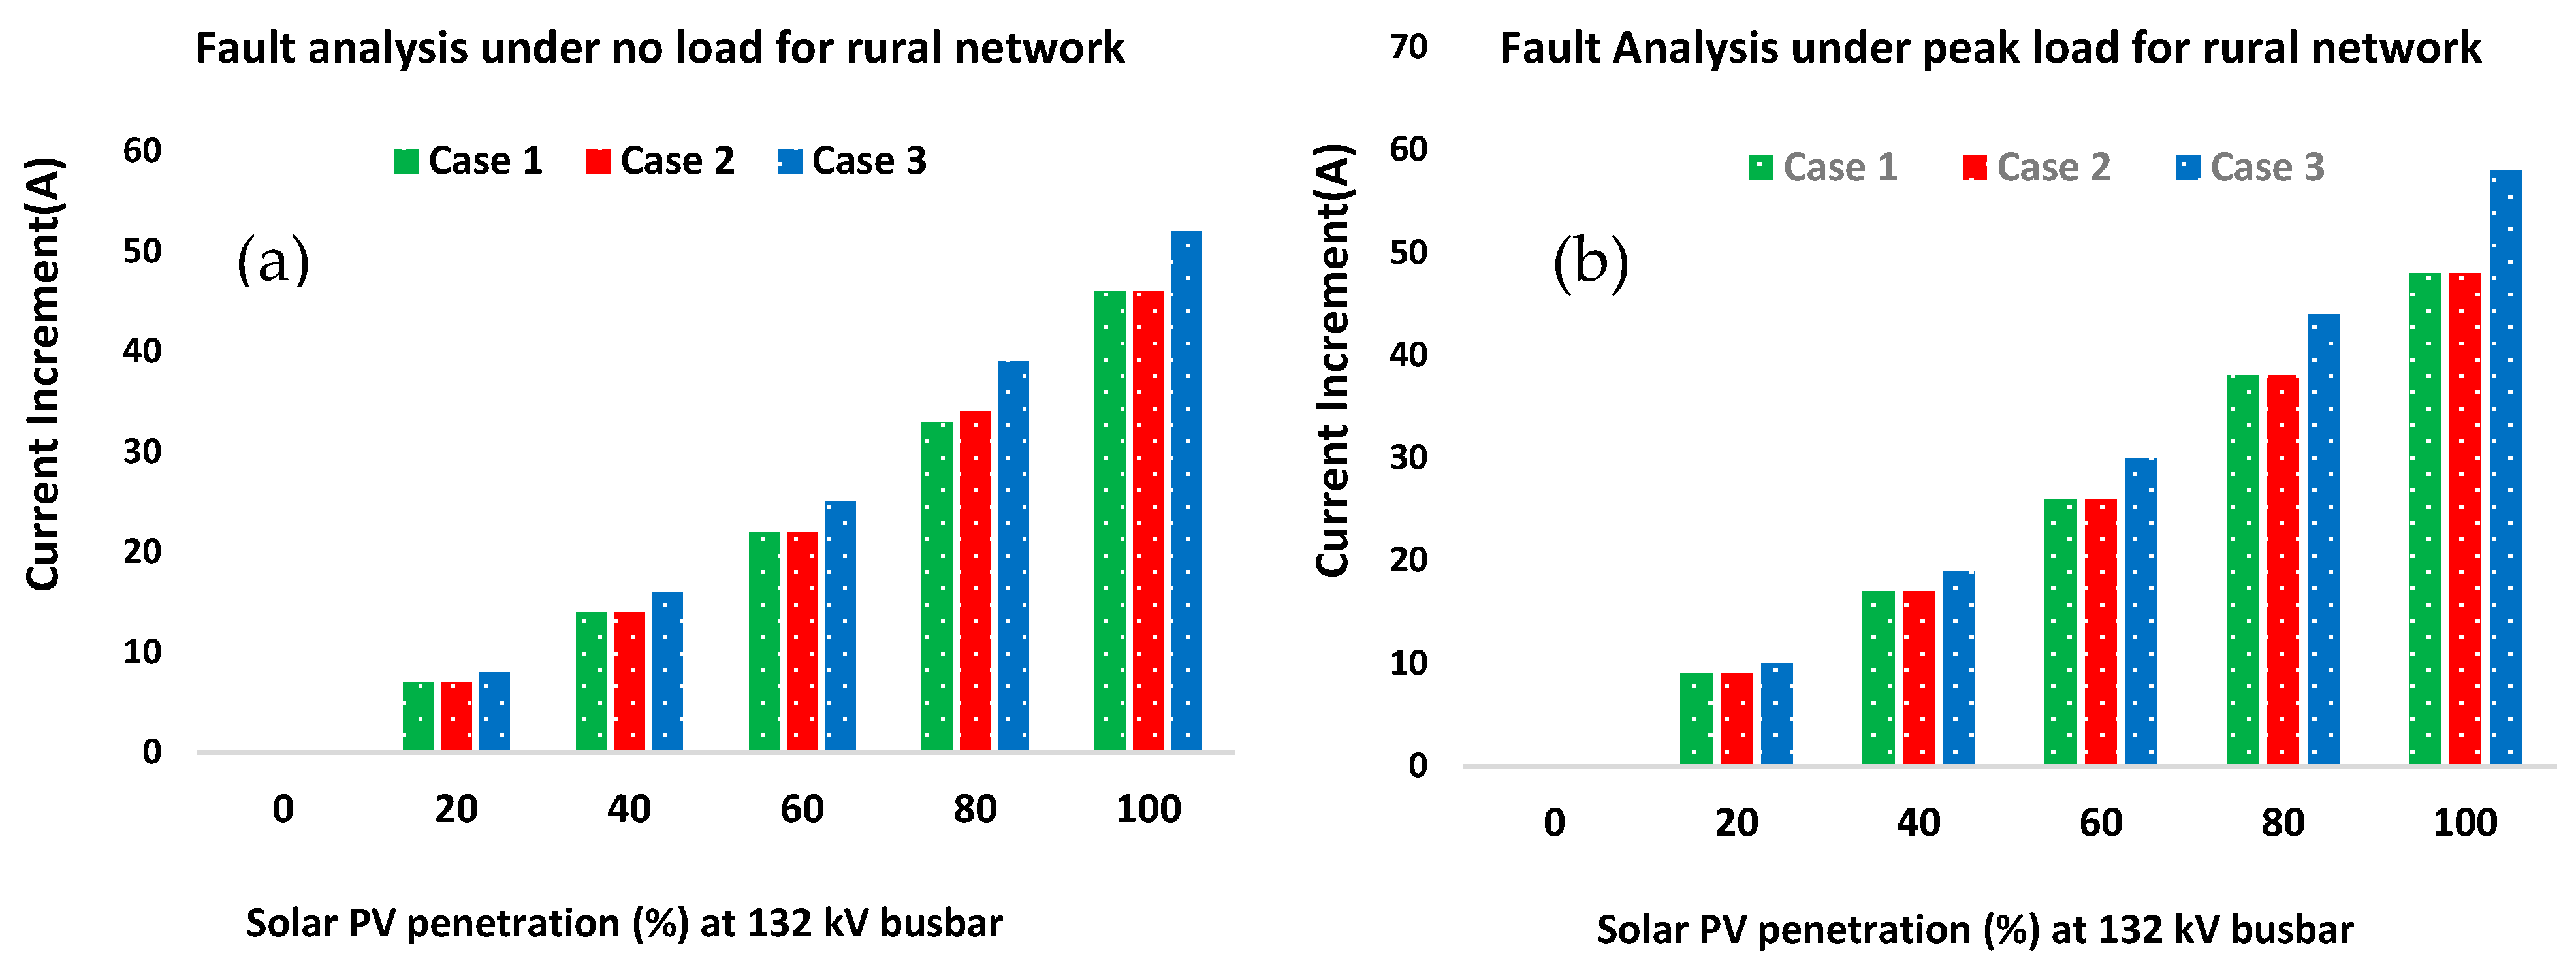
Figure 15.
The fault analysis for 11 kV busbars in the rural network, the no-load (a), and the peak-load (b) fault analysis.
Figure 15.
The fault analysis for 11 kV busbars in the rural network, the no-load (a), and the peak-load (b) fault analysis.

Table 1.
Overview of solar PV penetration into the grid.
| Ref | Load Type | Network std/Level | Objective | Software | Voltage Limit |
|---|---|---|---|---|---|
| [22] | Residential 5 kWp | IEEE European LV network | This paper aims to examine the impact of prosumers’ self-consumption rate (SCR) in an LV feeder on voltage quality. | OpenDSS, MATLAB | 0.95–1.05 |
| [17] | 14 MW Industrial | MV network in Taiwan | To find the best location and size of solar PV penetration, control by volt, var | OpenDSS, MATLAB | Peak at 1.03 (EUT) |
| [23] | Residential, industrial | IEEE 13 Busbar/ MV and LV network | To find maximum solar PV penetration without any violation | DigSilent | 0.85–1.1 pu |
| [24] | Industrial PV from 0.5–5 MW National Library USA | 1EEE 34 Busbar, MV/LV network | Impact of PV penetration and allowable level in an urban and rural area | Real-Time Digital Simulator | Upper limit 1.05 |
| [19] | Rural area load, PV from 0 to 5 MW | IEEE 33 bus and IEEE 45 bus | Investigate power losses, voltage violation maximum PV penetration, and mitigation | MATLAB/PSS/E | Upper limit 1.05 |
| [25] | 1 MW and 2 MW level penetration | IEEE 13 Busbar | To find the feeders with high potential for violation and mitigation by OLTC | OpenDSS, MATLAB | Upper limit 1.05 |
| [26] | Residential, commercial, industrial load | Typical MV network | Impact of PV penetration and mitigation with volt/var | OpenDSS /MATLAB | 0.95–1.05 |
| [27] | 270 kW PV | 16 Busbar, LV network | Focus on the issues of sudden voltage rise and reverse power flow and mitigate these problems that arise due to increased PV integration in LV grids | MATLAB | 0.95–1.05 |
| [20] | Residential load | 390 Busbar and 81 Busbar | Considering fault side MV and PV located LV side On different loading levels (0.5, 1, and 1.5), two faults were applied on the MV side: 3-phase grounded and phase-to-phase grounded | OpenDSS/MATLAB | Operating voltage 220 V |
Table 2.
Grid characteristics of the networks.
| Network Topology | Urban Network | Rural Network |
|---|---|---|
| Transformer rating | 30 MVA, 33/11 kV | 15 MVA, 132/11 kV |
| Number of feeders | 13 | 8 |
| Number of nodes | 38 | 110 |
| Number of PV | 38 | 99 |
| Number of nodes without PV | 0 | 11 |
| Names of nodes without PV | 0 | 6, 9, 14, 34, 36, 38, 50, 52, 63, 64, 66 |
Table 3.
PV penetration percentages and their equivalent power in MW.
| PV Penetration (%) | Urban Network (MW) | Rural Network (MW) |
|---|---|---|
| 0 | 0.00 | 0.00 |
| 20 | 0.10 | 0.02 |
| 40 | 0.20 | 0.04 |
| 60 | 0.30 | 0.06 |
| 80 | 0.40 | 0.08 |
| 100 | 0.50 | 0.10 |
| Max allowable PV for no load | 2 MW (at 200%) | 0.125 MW at 125%, |
| Max allowable voltage for peak load | 4 MW (at 800%) | 0.300 MW at 300% |
Table 4.
Power losses at peak load in each case for rural and urban networks.
| Urban Network | Rural Network | ||||||||
|---|---|---|---|---|---|---|---|---|---|
| PV Penetration | Power Losses (MW) | PV Penetration | Power Losses (MW) | ||||||
| % | MW | Case 1 | Case 2 | Case 3 | % | MW | Case 1 | Case 2 | Case 3 |
| 0 | 0.0 | 0.131 | 0.131 | 0.151 | 0 | 0.000 | 0.215 | 0.216 | 0.224 |
| 20 | 0.1 | 0.093 | 0.094 | 0.106 | 20 | 0.020 | 0.157 | 0.157 | 0.161 |
| 40 | 0.2 | 0.065 | 0.066 | 0.073 | 40 | 0.040 | 0.113 | 0.113 | 0.114 |
| 60 | 0.3 | 0.064 | 0.047 | 0.051 | 60 | 0.060 | 0.082 | 0.283 | 0.082 |
| 80 | 0.4 | 0.038 | 0.038 | 0.041 | 80 | 0.080 | 0.065 | 0.066 | 0.065 |
| 100 | 0.5 | 0.038 | 0.038 | 0.042 | 100 | 0.100 | 0.061 | 0.061 | 0.063 |
| 400 | 2.0 | 1.110 | 1.117 | 1.467 | 125 | 0.125 | 0.073 | 0.074 | 0.080 |
| 800 | 4.0 | 5.576 | 5.898 | 8.242 | 300 | 0.300 | 0.672 | 0.673 | 0.802 |
Disclaimer/Publisher’s Note: The statements, opinions and data contained in all publications are solely those of the individual author(s) and contributor(s) and not of MDPI and/or the editor(s). MDPI and/or the editor(s) disclaim responsibility for any injury to people or property resulting from any ideas, methods, instructions or products referred to in the content. |
© 2023 by the authors. Licensee MDPI, Basel, Switzerland. This article is an open access article distributed under the terms and conditions of the Creative Commons Attribution (CC BY) license (https://creativecommons.org/licenses/by/4.0/).
Share and Cite
MDPI and ACS Style
Maghami, M.R.; Pasupuleti, J.; Ling, C.M. Comparative Analysis of Smart Grid Solar Integration in Urban and Rural Networks. Smart Cities 2023, 6, 2593-2618. https://doi.org/10.3390/smartcities6050117
AMA Style
Maghami MR, Pasupuleti J, Ling CM. Comparative Analysis of Smart Grid Solar Integration in Urban and Rural Networks. Smart Cities. 2023; 6(5):2593-2618. https://doi.org/10.3390/smartcities6050117
Chicago/Turabian StyleMaghami, Mohammad Reza, Jagadeesh Pasupuleti, and Chee Mei Ling. 2023. "Comparative Analysis of Smart Grid Solar Integration in Urban and Rural Networks" Smart Cities 6, no. 5: 2593-2618. https://doi.org/10.3390/smartcities6050117