
Energy Harvesting on Airport Pavements Traffic Dependent: A321 (Narrow-Body) Aircraft Case Study


1
Research Center for Territory, Transports and Environment, Department of Civil Engineering, University of Coimbra, 3030-788 Coimbra, Portugal
2
SDI Engineering Inc., Kirkland, WA 98033, USA
*
Author to whom correspondence should be addressed.
Smart Cities 2023, 6(5), 2783-2806; https://doi.org/10.3390/smartcities6050125
Submission received: 25 July 2023
/
Revised: 2 October 2023
/
Accepted: 6 October 2023
/
Published: 11 October 2023
(This article belongs to the Section Smart Transportation)
Abstract
:Research into novel methods for reducing greenhouse gas emissions is being carried out with the use of energy-harvesting systems. On road pavements, energy-harvesting technology has been successful in finding solutions and applications. This study discusses a solution for airport pavements that aims to produce electric energy from aircraft traffic. The new system is simulated in Simulink/MATLAB with all the components for producing technical data being provided by the manufacturers. The system is internally subdivided by simulating the aircraft in 3DOF and the energy harvesting in 1DOF. The energy-harvesting simulations achieved an energy density of up to 6.80 Wh/(m.vehicle) and a 24% conversion rate. This paper contributes to the exploration of solutions to enable energy-harvesting systems to be placed in airport pavements. These solutions are traffic dependent and require an innovative system to control the operation due to the specifications of airport pavements.
1. Introduction
The increase in greenhouse gases has created an opportunity for the introduction of new energy generators like energy-harvesting solutions for pavements. Energy-harvesting solutions for pavement technologies are catalogued into two categories, ambient-dependent and traffic-dependent [1,2]. The developments for road and railway pavements have also been analyzed to see if they can be implemented on airport pavements [1].
Correia and Ferreira [3] simulated the implementation of photovoltaic panels (PVs) on the airport pavement, occupying an area not usually used by aircrafts. The authors found a levelized cost of energy of 143 EUR/MWh in the case study, a value in line with other similar sources of sustainable electrical energy [3]. Thus, the authors described an energy-harvesting solution that is environmentally dependent on airport pavements.
This article intends to address a traffic-dependent energy-harvesting solution that interacts with passing aircrafts using the energy-harvesting mode.
The aeronautical pavement infrastructure is strictly regulated [4], and for this article, it is also worth highlighting the existence of pavement degradation limits. Since commercial aircraft are heavy vehicles that do not tolerate pavement defects well [4,5], the energy-harvesting traffic-dependent device will have to withstand the interaction with the aircraft and its composite forces, namely potential and kinetic forces. Additionally, the device cannot submit the aircraft to situations which could harm its structural safety. As verified by Correia and Ferreira [1], the proposed device will need additional features because aircrafts move in both directions, so the proposed device will have to activate when the aircraft intends to decelerate and deactivate when it accelerates.
The landing gear is the structural component of the aircraft that interacts with the pavement, so it will also interact directly with the energy-harvesting device. The aircraft landing gear is a complex mechanical system designed to absorb the potential and kinetic energy of the aircraft generated when it lands, takes off, moves along the pavement (taxiing) and parks (apron) [6]. Since the aircraft is a vehicle made primarily for flying, the size of the landing gear must be as small and light as possible to optimize aircraft performance [7,8]. While smaller aircrafts have simple landing gear systems, commercial aircraft landing gear has oleo-pneumatic based systems. The oleo-pneumatic system consists of a hydraulic cylinder, orifices and gas, allowing it to absorb the potential energy of landing and movement on the airfield pavement [6].
The landing gear ensures the safety and comfort of the aircraft passengers and cargo on ground operations. In addition to the oleo-pneumatics, the wheels have tires, which must be robust enough to support the aircraft’s heavy weight at high operation speeds and overcome the imperfections of the airport pavement [9,10]. The final component of the landing gear is the brakes, which, together with the aerodynamic drag and reverse thrust, are the kinetic energy consumption components.
In the initial phase of this article, the addressable regulatory framework that was considered suitable for a possible implementation of the device is described. Then, the developed model is presented, concluding with the production capacity of the aircraft that served for this analysis. This study finishes with the potential production value and the similarities and differences between similar devices applied to means of transportation since no significant results were found for airport pavement implementations.
2. Reglementary Framework
As stated above, airport pavements are regulated. This section describes airport pavement regulations that were taken into consideration for this article and how they affect the energy-harvesting traffic-dependent (EH–TD) device.
The EH–TD device should be able to withstand the aircraft’s vertical and horizontal forces without causing more wear and tear than would typically occur on the airport pavement. Although the ICAO provides optimum pavement conditions during construction, it understands that the pavement will degrade with natural uneven ground settlement. Although the placement of the EH–TD device is a forced disturbance of the pavement, it is considered to be appropriate to use this value as the maximum height of the device. It is assumed that this value will not produce a hazardous situation for the aircraft, its passengers, or its cargo. It should also be noted that the device, unlike existing ones [11,12,13,14,15,16,17], can deactivate itself and will not disrupt the aircraft in off-mode. Thus, the system will be off when the aircraft is about to accelerate, weather conditions are more severe or other unforeseen conditions occur.
The maximum value of pavement imperfection that will serve as the maximum height value of the EH–TD device is the Boeing Bump Index (BBI), which is formulated by Equation (1):
where
- = Bump height (cm);
- = Platform length (m).
Based on this equation, Table 1 summarizes the heights considered dependent on the length of the energy-harvesting device.
Energy capture must only exist when an aircraft intends to reduce its speed. With that limitation, only the step and the ramp could address this limitation. The ramp was flipped and duplicated due to the movement of the aircraft. In addition to the shape, the two profiles also have different ways of operating since the step profile transmits the kinematic force to the EH–TD harvester, while the ramp profile, which is articulated, shares the kinematic force produced by the aircraft with the pavement (through the articulation). Figure 1 visually represents this information.
In this research, only the step profile is analyzed. In addition to this consideration based on sensitivity analysis, it should be noted that the values presented are within the limits allowed by the supervisory authority of aeronautical structures for not putting the aircraft at risk [4,5]. Given the considerations stated above, the bulk of the work will describe the step profile (Figure 1a,b).
Figure 2 shows the interaction of the aircraft tire with the energy-harvesting system, with the kinematics represented. Figure 2a shows the aircraft tire and the EH–TD with a vertical force created by the recovery subsystem. Figure 2b shows the start of the interaction between the tire and the EH–TD. In this situation, the EH–TD will oppose the movement of the aircraft (reducing the aircraft kinetic energy), while starting to capture its potential energy. In Figure 2c, the aircraft interacts only with the potential energy of the EH–TD. Finally, Figure 2d shows the end of the interaction, when the EH–TD recovers (if the controller wants to activate the next interaction), with a smaller vertical force produced by the recover subsystem.
The ramp profile is similar to the step. However, the kinetic and potential forces occur during all the interaction. The aircraft’s forces are shared between the EH–TD and the pavement. Additionally, the length of the platform is doubled, which creates a lower energy density production. Due to this and the fact that less energy was produced with the ramp, the article will only proceed with the description of the step profile.
3. Energy-Harvesting Traffic-Dependent Model
Supported by computer simulation, this research used Simulink version 10.5 /MATLAB version 9.12 [18,19] to build a model of the aircraft landing gear and simulate its path on the airport pavement. Given the complexity of the input data and its validation, SDI Engineering Inc. provided a license for the proprietary software GearSim version 2.9. The creation of the simulation model allowed us to change parameters on the energy harvesting for pavement systems intensively. Figure 3 provides the framework for the work done and how it is organized. The simulation parameters field allows the user to load several aircraft data. In the EH–TD data field, the user can insert a set of parameters for the energy-harvesting system that they want to simulate. With a bidirectional interface, the simulation outcome is stored in the results.
The interface module, visually represented in Figure A1 in Appendix B, reads the simulation parameters, loads them into the model, runs the model, obtains the results and returns them to the simulation parameters to store them, respectively.
Figure A3 in Appendix C shows how the model comprises two modules, the Aircraft body 3DOF and the EH–TD system. The EH–TD system undergoes the necessary modifications according to the type of platform or its operating mode. However, to simplify the reading of this article, only the step platform variations will be considered, as this is the one that had the better production.
3.1. Aircraft Body 3DOF Model
The model developed was based on a tricycle configuration, with the suspension following the two mass-spring-damper models for each landing device, i.e., oleo pneumatic assembly and tire. The airframe was considered rigid, and the tire only had one contact point.
MATLAB software [18] was crucial in solving the equations of motion to determine body position, velocity, attitude and corresponding values.
The amount of kinetic energy that is removed from the aircraft by the energy-harvesting device is quantified as [20]:
In Equation (3), is the aircraft velocity before interaction and is the velocity after interaction. Since the harvesting format platform is a step, is reached by the following formulation [21]:
Assuming the energy conservation:
Assuming that
Moreover, the following conditions exist:
Resulting in
where:
- = Kinetic energy (J);
- = Mass (kg);
- = Velocity (m/s);
- = Mechanical energy (J);
- = Rotational energy (J);
- = Potential energy (J);
- = Moment of inertia (kg.m2);
- = Angular velocity (rad/s);
- = Gravitational acceleration (m/s2);
- = Height (m);
- = Tire radius (m).
The kinetic energy, Equation (2), is then reframed to be used in the next block, 3DOF, according to Figure A2. Jazar [21] states that the wheel’s radius needs to be greater than the height of the step, which is always present. Based on the assumption from Equation (10), in the worst case m, the m/s. The kinetic energy value can also be obtained by the potential energy variation since the energy conservation exists, Equation (4). The model selects the higher value of kinetic energy value, which is more unfavorable for the efficiency results.
This model neglects other kinetic energy influences like brakes, drag or reverse thrust since it assumes that the aircraft is free rolling. Based on the previous assumption, the system has a null momentum, with a horizontal and vertical inertia value shown in Appendix C. The vertical inertia is described in the 3DOF module formulation.
The potential energy formulation was based on the two-mass-spring-damper model (Equation (13)).
where
- = Sprung mass (kg);
- = Unsprung mass (kg);
- = Position of the sprung mass (m);
- = Position of the unsprung mass (m);
- = Sprung damper coefficient (N/(m/s));
- = Spring force (N/m);
- = Friction coefficient (N);
- = Unsprung springer force (N/m);
- = Unsprung damper coefficient (N/(m/s));
- = Position of the reference (pavement) (m).
Since this is not in the scope of this study and given the lack of public data, the simulation data for the oleo-pneumatic shock absorber and tires were obtained from GearSim software [22] and manufacturers [23,24]. GearSim includes a built-in parametric model for the oleo pneumatic and can help calculate the parameters of the oleo pneumatic based on public data. For the tire, provided by tire manufacturers, public data are used. The simulation parameters are listed in Appendix B.
Richards and Erickson [25] present a method of calculating the values of the oleo pneumatics. Figure A1a presents the stiffness from the NLG and the MLG separately. Figure A1b presents the damping coefficients of the oleo-pneumatic. Because the value is provided as the pow of velocity, the value expressed in Equation (13) is obtained by multiplying the aforementioned by the velocity . When , it is considered the value of from the compression; if , the value is the recoil [22,25].
The resulting curves from the equations provide the input data in the development model as lookup tables. The values of the lookup table that were calculated by the above formulation using GearSim can also be obtained by experimental testing or ideally from data provided by the oleo manufacturer.
The information provided by the manufacturers [23,24] was used for the tires, despite the fact that there are differences between the data obtained in the laboratory and the theoretical formulation [26]. However, it was not possible to obtain data. By checking the information provided by the aircraft manufacturer [27] or supplier [23,24,28], it was possible to find the tires used on the model A321. The NLG uses 30 × 8.8 (imperial) with or without an R15 rim. The MLG uses 1270 × 455R22 (metric), 49 × 18.0-22 (imperial) [23,24], and can be formulated as [29,30]
where
- = Unsprung springer force (N/m);
- = Tire max loading (kg);
- = Gravitational acceleration (m/s2);
- = Tire outside diameter (m);
- = Tire shoulder diameter (m);
- = Unsprung damper coefficient (N/(m/s));
- = Tire damping rate (−).
The constant values used for the NLG and MLG are described in Table A1 in Appendix B. The constant values were then converted into lookup tables so manufacturer data or experimental tests could support the model.
To determine the body position, velocity and attitude, the 3 DOF module was used [18]. The formulation that is implemented in the module is
where
- = Body position along the body reference x-axis (m);
- = Applied force along the body reference x-axis (N);
- = Mass (kg);
- = Gravitational acceleration (m/s2);
- = Relative velocity (m/s);
- = Pitch altitude (rad);
- = Pitch angular rate (rad/s);
- = Body position along the body reference z-axis (m);
- = Applied force along z-axis (N);
- = Body position along the flat Earth reference x-axis (m);
- = Body position along the flat Earth reference z-axis (m);
- = Vertical inertia (kgm2);
- = Inertia when aircraft is full (kgm2);
- = Inertia when aircraft is empty (kgm2).
3.2. Energy Harvesting for Pavement System Model
A Simulink model was created of the energy-harvesting system. The simulation allows us to do a comprehensive check of values in the system [20,36]. Using simulation allowed parts to be added exhaustively, such as T-connections, elbows and losses in the pipes due to their length. The detailed assembly and use of certified components would ensure it was easier to obtain a system certification [10]. It was also possible to reconfigure and optimize the system without purchasing components. Commercial parts were surveyed to create the system. We opted for individual commercialized parts due to the information provided, bringing the simulation closer to reality.
Figure 4 presents the energy harvesting for pavement system, which is composed of four sections: the harvester, unit storage, intermedial converter and electric converter. The individual components names used, which are shown and suppressed, are intended to simplify image comprehension. In the intermedial converter, valve V2 enables deactivation of the energy capture system and activating V1 enables the production control capability.
The controller dynamically changes the preset pressure of the accumulator and the electric power generation of the generator. This feature is possible because the airport entity has the aircraft’s schedule and model, which can be converted to the weight. Knowing the weight of the aircraft, we can set the accumulator pressure so that the energy capture reaches the maximum value. The previous interaction configures the preset pressure, i.e., the pressure established for the subsequent aircraft comes from the drop-off pressure (which generates electrical energy) from the interaction with the previous aircraft.
The energy stored in the accumulator is converted and made available to the electric grid constantly, avoiding peaks in the electric current. This capability is possible because the airport structure has data that allow us to know the aircraft type and the space-time of use of the pavement, so the energy-harvesting system can be configured beforehand. Deactivating is also possible, which is essential depending on the type of traffic. It is also important to note that until now this has not been possible, nor has it been the goal of other research studies and commercial products, making this research innovative.
The harvester section interacts with the aircraft tire imposing a kinetic and potential energy change between the aircraft and the energy-harvesting system. The cylinder component, the main component of the harvester section, was inspired by a general-purpose device, the single-acting Enerpac RC series [37]. This system consists of several cylinders shared between two separated platforms to interact with the port and starboard of the aircraft, with a combined capacity of >1000 kN or, approximately, >102 Tonnes. The component is individually described by Equations (A1)–(A6). The system was idealized for the main landing gear since it bears most of the weight of the aircraft [27].
Also in the harvesting section are the losses of the elbow, T-junction, check valve and pipes. Assuming that the mass is conserved throughout the component, the elbow follows Equations (A7)–(A9), the T-junction follows Equations (A10)–(A13), the check valve follows Equations (A14)–(A20) and the pipe follows Equations (A21)–(A24), assuming a null momentum balance.
The elbow, T-junction and pipes are used for connection purposes. The check valve configuration works as a selector between the harvested energy that the aircraft transfers and is stored in the accumulator, and the pressure that resets the cylinders into active position. The two-way valve V2 activates the harvesting unit, which makes this system innovative. The reservoir is set to a pressure which is able to push the platform up. If a shorter recovery time is needed, the reservoir can be set to a higher pressure.
Next to the harvester is the storage unit, which consists mainly of the accumulator. The accumulator is physically located near the harvester to reduce pipe loss. Future applications with several harvesters would reconfigure that device to collect the energy from one or several harvesters, depending on cost-efficiency. The selected accumulator simulation values were inspired by Parker EHV 12 series [38] and formulated according to Equations (A25)–(A31). The EH–TD was based on the hydraulic accumulator, which is gas-based because it results in a better configuration, set-up and efficiency [39].
The intermedial converter is a section consisting of components that can control, adjust and convert the fluid and rotational energy. The first adjustment is achieved by the pressure-reducing valve, formulated in Equations (A32)–(A39), and is controlled by the 2-way directional valve (V1), formulated in Equations (A28)–(A29). This set of devices will adjust the pressure reaching the hydraulic motor and start the conversion of the accumulated energy into electrical energy.
The hydraulic motor was inspired by the Rexroth A6VM series [40], which provided the simulation values in Appendix C. The hydraulic motor is formulated according to Equations (A40)–(A50), followed by a conversion gearbox, formulated in Equations (A51)–(A55), and the last section, the electric converter, consists of a brushless, single phase electric generator, with a permanent magnet, formulated in Equations (A56)–(A58) [41,42]. The Rl is an ideal electrical consumer unit. A grid inverter would be a real application of this, for example.
Each section shown in Figure 4 is organized to present a comparable value, the quantification of the energy and the efficiency of the section. For energy quantification, a set of , , , , that refers, respectively, to the energy of the harvester, unit storage, intermedial converter and electric converter. The efficiency follows the same sequence of the energy. Energy quantification and efficiency are formulated in Equations (A59)–(A66) in Appendix A. From the previous set of equations, it is important to mention that aircraft kinetic energy is calculated by Equation (3) during the interaction.
Overall efficiency and density of energy and platform-length dependent are presented by Equations (A67) and (A68) in the same sequence. The equivalent energy, platform-length dependent, is intended to make it easy to multiply the system by the available pavement length for a rough result.
4. Results
Limited by the regulations of pavement imperfections, as previously mentioned, the energy-harvesting device is small in comparison to the diameter of the aircraft tire. Considering the aircraft analyzed in this article, the platform’s height is less than 2% compared with the aircraft tire diameter, so the energy extracted by the system will always be conditioned by this. It is understood that the BBI index, which limits the height of the energy-harvesting device, serves the entire pavement and safeguards the complex structure of the aircraft without causing damage, regardless of speed.
Although an airport pavement is not substantially different from a road pavement, the vehicles and their structure and travel conditions on the pavement are different [5]. In general, aircrafts use the pavement at higher speeds than other vehicles and cannot do so at lower speeds because they need to create lift on takeoff and keep enough speed not to stall on landing, which means they typically travel at 260 to 280 km/h [43]. In the specific case of the aircraft under study, the takeoff speed is 269 km/h (145 knots) and it lands at 261 km/h (141 knots) [27]. The aircraft interaction with the energy-harvesting device would be different if it was placed where the vehicle travels along the pavement at the highest speed, the runway, rather than on the taxiway, where the aircraft is already at speeds of 111 to 28 km/h (60 to 15 knots), rapid-exit taxiway to taxiway, respectively. The previous speed values presented correspond to 30.8 m/s (60 knots) and 7.7 m/s (15 knots). This research simulated the values from 10 to 25 m/s, as described in Appendix C. Only the taxiway was analyzed by sensitive analysis.
Although the energy-harvesting device meets the imperfection requirements on the entire airport pavement, we only analyze the speeds to which the device will be subjected when placed on the taxiway. The taxiway, along with the apron, is the aircraft circulation area that presents the least risk to the aircraft due to the lower speed and because the aircraft is more stable. Furthermore, it may be the area that the various entities of civil aviation accept most readily for implementing this innovative system. The rapid-exit taxiway was considered a good choice because the aircraft needs to reduce its kinetic energy due to speed variation. It should also be noted that the device can be deactivated to avoid any action or additional energy loss for the aircraft.
Considering the implementation area of the device and its internal characteristics, the simulation was carried out with variation in the initial pressure value of the accumulator ( [Pa]) to optimize the density of energy that is produced. The above-mentioned pressure optimization makes the aircraft-platform interaction occur throughout the full length of the platform. In optimal cases, the end of the interaction presents null values of and . In practical terms, this ensures that the platform does not hit hard stops and prevents the production of unnecessary noise, which would rule out the results obtained if not implemented in the model.
Given the number of values involved, depending on the speed [m/s] and length of the platform [m], the values [Pa] were condensed using Equation (24), which was based on the trend line of the values obtained by the simulations.
With a value of , the gearbox ratio value was then calculated in the range described in Appendix C to reach the highest , resulting in a ratio of 1/3.5.
The resulting simulation was then completed to determine all the values. The resulting [J] values were transcribed into Equation (25).
A sample of simulated results for Equation (25) can be seen in Table 2, which shows the kinetic energy (), the harvested energy from the platform (), accumulated energy stored at the unit storage (), intermedial converter energy (), electric energy produced by the electric generator () and energy production density (). Equation (A68) adjusts the values simulated into the density of electric production that can be produced by the EH–TD when it interacts with the aircraft.
The value with the highest energy production density (6.8 Wh/(m.vehicle)) was obtained with m, m/s, MPa.
The results in Table 2 were converted to energy efficiency with the same previous sequence of harvesting (), accumulator (), intermedial converter (), electric (), system () and energy harvesting for pavement () efficiencies. The energy efficiency results are shown in Table 3.
In Table 3, the column shows values greater than 100% due to the energy quantification approach. With that platform and operation, the EH–TD system converts only the potential energy of the aircraft. The beginning of the aircraft interaction with the EH–TD system produces a kinetic energy that the aircraft would not be subjected to if the system did not exist or if it was deactivated.
Considering the above, energy quantification followed the principle that the system would consider the additional energy extracted from the aircraft motion, which is the captured kinetic energy. The platform of this system does not use kinetic energy to convert it into electrical energy. The energy harvested comes from the potential energy of the aircraft when it is over the platform, suspension perturbance dependent. For this reason, the EH–TD system, by inducing the presented in Table 2, can capture . refers to the aircraft’s vertical force under the suspension’s influence from Equation (3) during the time spent transposing the platform. In the absence of the EH–TD system, the force from Equation (3) is expended on the airport pavement in typical situations at a sum of zero forces. Due to that, the value () is related to the energy lost from aircraft and captured by the energy-harvesting system.
Table 2 and Table 3 show a sample of EH–TD production and efficiency. Based on this system configuration, it is possible to achieve the maximum electrical energy () of 4448 J with a 31% conversion efficiency. The maximum production density (), achieved was 6.80 Wh/(m.veh) with a 24% and 20% system and conversion efficiencies, respectively. Both maximums were reached at the lower velocity ( 10 m/s), but opposite platform length. Equations (24) and (25) present two variations of the system and both follow the previous relationship. Because this research considers the energy harvester as a modular system, further considerations will be made only regarding production density and correspondent efficiency, despite not being the highest electrical energy production and conversion efficiency.
The simulation results were also used to check range limits for the output quantities. For example, the pressure limit on the line between the harvester and unit storage reached 51.9 MPa, which needs to be taken into consideration for pipe acquisition or the system reconfiguration if this is not assured.
The simulation used a constant power load 50 W, adjusted according to the period between successive aircraft in real operations. Given the above mentioned , the system can supply this for 49 s, which should be the space between aircraft, calculated by . The adjustment in electrical power, represented by , the EH–TD system would produce a constant electrical power supply over time. A controller unit can adjust the grid inverter’s power load, avoiding the device’s synchronization time. The hydraulic motor should also be adjustable for the same reasons.
The system can be adjusted by the airport management to optimize energy harvesting because the type of aircraft that will land and the schedule are known. Additionally, the speed in each airport zone is stabilized to follow airport traffic good practices.
Despite the desire to quantify the energy-harvesting system–traffic-dependent production capacity, it was only possible to make a rough sketch of its production for values of about 1.14 GWh/year for world’s busiest airport and 0.9 GWh/year for the busiest European airport. The values were crudely calculated by use of 200 m and 700 m segments, rapid-exit taxiway and taxiway, respectively, from half of the airport movements registered in 2017. For the European airport, the values used were 275 m and 900 m, following the same reasoning as for the previous movements. It was not possible to determine the cost of the solution.
Aircraft Behavior
The following graphs shows the behavior of the aircraft when iterating with the device to verify its impact on the aircraft. For the sake of simplicity, only a selection of the data is shown to explain some of the model’s capabilities.
Given the differences between the speeds analyzed in this work, the distance to the EH–TD device was changed so that the interaction with the device occurs at 6 s. The placement of the device followed the equation . The result was divided into two figures where the value of is maintained to facilitate the perception of the behavior. Figure 5 presents the device’s behavior and Figure 6 presents the aircraft’s behavior.
Figure 5 shows the behavior of the EH–TD device through referring to the device height. In the interaction between the device and the aircraft, which starts at 6 s, the equality of the values of (pavement height) and (device height) can be seen.
After the interaction, the EH–TD device recovers proportionally with the existing pressure in the reservoir. The pressure in the reservoir can be increased if a faster recovery is required. In this case, the control system had active energy capture (V2 active), otherwise would remain at elevation 0.
Figure 6 broke down the aircraft behavior into the unsprung and sprung heights, and , respectively. To facilitate comparison, offsets were applied. For the component, the offsets of 0.65 m for the tire radius and 0.038 m for the tire stabilization under the effect of the aircraft mass were applied. For the component, 1.88 m for the height of the aircraft’s base and 0.15 m for the stabilization of the tire under the effect of the aircraft’s mass were applied. Stabilization happens in the first few seconds before 6 s.
5. Conclusions
This article presents an energy-harvesting–traffic-dependent (EH–TD) system that is innovative in its capacity to be deactivated and in its application to the pavement. It is described in detail and presents the model created to simulate the energy production by the system with 1DOF. For the EH–TD system, existing components were selected to ensure that the input data are as accurate as possible and that a possible validation by a prototype will be possible with the acquisition of the existing equipment. The extensive formulation used by this system is also presented.
This article presents the model used to simulate the aircraft behavior, based on 3DOF, and the suspension behavior, with the dual-sprung-damper model, the tire model and the data used in the various components. The EH–TD system also presents the kinematic energy formulation induced to the aircraft.
The operation of the model and the setting values for configuring the constituent equipment of the EH–TD system are presented. The production values are summarized, the results are presented quantitatively and the behavior of the aircraft under the energy-harvesting system is also verified. The EH–TD system achieved a conversion efficiency of up to 24% and a production density of 6.8 Wh/(m.vehicle). A rough sketch of its production for values of about 1.14 GWh/year for the world’s busiest airport, Atlanta Airport, and 0.9 GWh/year for the busiest European airport, Amsterdam Airport, was taken as reference with 2017 landing movement data.
Despite the high production values compared to the state-of-the-art, the framework of the technology is limited by the height of an imperfection that can be produced on airport pavements. Since the speed of the aircraft in the selected zones is lower, higher imperfection could be considered, without disturbing the aircraft performance.
Author Contributions
Conceptualization, D.C. and A.F.; methodology, D.C. and A.F.; validation, D.C., P.R. and A.F.; investigation, D.C.; writing—original draft preparation, D.C.; writing—review and editing, P.R. and A.F.; supervision, A.F.; project administration, A.F.; funding acquisition, A.F. All authors have read and agreed to the published version of the manuscript.
Funding
This project was financed by the Fundação para a Ciência e a Tecnologia through the Research Center for Territory, Transports and Environment—CITTA (UIDP/04427/2020).
Data Availability Statement
All data used in this study have been declared in the paper’s main text and Appendix A, Appendix B and Appendix C.
Acknowledgments
The authors Diogo Correia and Adelino Ferreira are grateful to the Research Center for Territory, Transports and Environment CITTA (UIDP/04427/2020) for the financial support and also for the excellent conditions to make research. The author Diogo Correia is also grateful to the Fundação para a Ciência e a Tecnologia for the financial support through the grant PD/BD/142908/2018.
Conflicts of Interest
The authors declare no conflict of interest.
Nomenclature
| Area of the shock strut cylinder (m2) | |
| Acceleration (m/s2) | |
| Horizontal distance from CG to front axle (m) | |
| Area of the orifice (m2) | |
| Flow area (m2) | |
| Piston area (m2) | |
| Valve leakage area (m2) | |
| Main branch area (A−B) (m2) | |
| Valve maximum open area (m2) | |
| Area of the orifice (m2) | |
| Area of the orifice when in compression (m2) | |
| Area of the orifice when in recoil (m2) | |
| Valve instantaneous open area (m2) | |
| Cross-sectional area at ports A and B (m2) | |
| Side branch area (A–C, B–C) (m2) | |
| Valve instantaneous open area (m2) | |
| Horizontal distance from CG to front axle (m) | |
| Damping coefficient (oleo-pneumatic) (N/(m2/s2)); | |
| Discharge coefficient (−) | |
| Longitudinal drag pitch moment (Nm) | |
| Sprung damper coefficient (N/(m/s)) | |
| Unsprung damper coefficient (N/(m/s)) | |
| Tire damping rate (−) | |
| Displacement (cm3/rev) | |
| Tire outside diameter (m) | |
| Elbow internal diameter (m) | |
| Pipe hydraulic diameter (m) | |
| Tire shoulder diameter (m) | |
| Energy harvested (J) | |
| Kinetic energy (J) | |
| Potential energy (J) | |
| Rotational energy (J) | |
| Adjusted energy produced by the energy-harvesting system (Wh/(m.veh)) | |
| Electrical converter energy (J) | |
| Intermedial converter energy (J) | |
| Energy stored at the unit storage (accumulator) (J) | |
| Force (N) | |
| Friction force (N) | |
| Friction force of the sprung mass (N) | |
| Hard-stop force (N) | |
| Damping force of the sprung mass (N) | |
| Damping force of the unsprung mass (N) | |
| Spring force of the sprung mass (N) | |
| Spring force of the unsprung mass (N) | |
| Force of the liquid (N) | |
| Friction factor (−) | |
| Force from the aircraft to the pavement (N) | |
| Applied force along the body reference x-axis (N) | |
| Applied force along z-axis (N) | |
| Gravitational acceleration (m/s2) | |
| Bump height (cm) | |
| Height (m) | |
| Moment of inertia (kg.m2) | |
| Current along the circuit (A) | |
| Rotational inertial (kgm2) | |
| Fluid inertia from the ports A, B and C (kgm2) | |
| Inertia when aircraft is empty (kgm2) | |
| Inertia when aircraft is full (kgm2) | |
| Vertical inertia (kgm2) | |
| Spindle inertia (kgm2) | |
| Constant of proporcionality (−) | |
| Friction torque vs. pressure gain coefficient at nominal displacement (−) | |
| Boltzman constant (J/K) | |
| Hagen–Poiseuille coefficient for analytical loss (−) | |
| Orifice damping coefficient (−) | |
| Spring force (N/m); | |
| Penetration coefficient (−) | |
| Sprung springer force (N/m) | |
| Adiabatic index (−) | |
| Hard-stop stiffness coefficient (Pa/m3) | |
| Unsprung springer force (N/m) | |
| Loss coefficient (−) | |
| Platform length (m) | |
| Armature inductance (H) | |
| Length of the shock strut (m) | |
| Aircraft length (m) | |
| Pipe length (m) | |
| Mass (kg) | |
| Fluid mass (kg) | |
| Body mass when aircraft is empty (kg) | |
| Body mass when aircraft is full (kg) | |
| Tire max. loading (kg) | |
| Leakage mass (kg) | |
| Sprung mass (kg); | |
| Unsprung mass (kg) | |
| Mass (kg) | |
| Applied pitching moment (Nm) | |
| Gear ratio (-) | |
| Number of struts on front axle (-) | |
| System lifetime (years) | |
| Number of structs on rear axle (-) | |
| Number of cells | |
| Number of tires on each front strut (-) | |
| Number of tires on each rear strut (-) | |
| Cylinder pressure (Pa) | |
| Normalized pressure (Pa) | |
| Density of air (kg/m3) | |
| Initial pressure (MPa) | |
| Gas pressure in the gas chamber (Pa) | |
| Hard-stop contact pressure (Pa) | |
| Liquid pressure in the liquid chamber (Pa) | |
| Control pressure (Pa) | |
| Cracking pressure (Pa) | |
| Dynamic control pressure (Pa) | |
| Internal pressure (Pa) | |
| Maximum opening pressure (Pa) | |
| Power on the output shaft (W) | |
| Initial gas chamber pressure (Pa) | |
| Pressure loss (Pa) | |
| Power on the input shaft (W) | |
| Set pressure (Pa) | |
| Flow through the pipe junction A, B and C (m3/s) | |
| Cylinder flow rate (m3/s) | |
| Pitch angular rate (rad/s) | |
| Tire radius (m) | |
| Armature resistance (Ω) | |
| Critical Reynolds number (-) | |
| Tire radius of gyration (-) | |
| Spool position (m) | |
| Pipe cross-sectional area (m2) | |
| Piston stroke (m) | |
| Spindle torque (Nm) | |
| Temperature (°C) | |
| Torque on the output shaft (Nm) | |
| Nominal shaft angular velocity (Nm) | |
| Body position along the body reference x-axis (m) | |
| Voltage at the load resistance (V) | |
| Voltage across the electrical port (V) | |
| Initial volume (m3) | |
| Accumulator volume (m3) | |
| Volume of the gas in the accumulator (m3) | |
| Volume of the liquid in the accumulator (m3) | |
| Total volume of the accumulator (m3) | |
| Gas chamber dead volume (m3) | |
| Output voltage (V) | |
| Velocity (m/s) | |
| Body position along the body reference z-axis (m) | |
| Load power (W) | |
| Body position along the flat Earth reference x-axis (m) | |
| Piston position (m) | |
| Cylinder piston initial distance (m) | |
| Body position along the flat Earth reference z-axis (m) | |
| Cylinder piston fully extended distance (m) | |
| Cylinder piston fully retracted distance (m) | |
| Position of the reference (pavement) (m) | |
| Position of the sprung mass (m) | |
| Position of the unsprung mass (m) | |
| Greek Letters | |
| Adiabatic gas constant of the nitrogen (-) | |
| Harvester efficiency (-) | |
| Energy harvesting for pavement system efficiency (-) | |
| Electrical converter efficiency (-) | |
| Intermedial converter efficiency (-) | |
| Unit storage efficiency (-) | |
| Volumetric efficiency at nominal conditions (-) | |
| Pitch altitude (rad) | |
| Laminar friction constant for Darcy friction factor (-) | |
| Friction coefficient (-) | |
| Fluid kinematic viscosity (St) | |
| Discharge coefficient of orifice (-) | |
| Density of the hydraulic fluid (kg/m3) | |
| Average fluid density (kg/m3) | |
| Opening time constant (s) | |
| No-load torque (Nm) | |
| Friction torque (Nm) | |
| Angular velocity (rad/s) | |
| Nominal shaft angular velocity (rad/s) | |
| Output shaft angular velocity (rad/s) | |
| Input shaft angular velocity (rad/s) | |
| Pressure difference (Pa) | |
| Critical pressure difference (Pa) | |
| Nominal pressure drop at port A, B (Pa) | |
| Nominal pressure drop (Pa) | |
| Pipe elevation (m) |
Appendix A. Energy Harvesting for Pavement System Formulation
Appendix A.1. Cylinder
Appendix A.2. Hydraulic Elbow
Appendix A.3. Hydraulic t-Junction
Appendix A.4. Check Valve
Appendix A.5. Pipe
Appendix A.6. Accumulator
Appendix A.7. Pressure-Reducing Valve
Appendix A.8. 2-Way Directional Valve
Appendix A.9. Hyraulic Motor
Appendix A.10. Gearbox
Appendix A.11. Electric Generator
Appendix A.12. Energy and Efficiency of the Harvester Section
Appendix A.13. Energy and Efficiency of the Unit Storage [38]
Appendix A.14. Energy and Efficiency of the Intermedial Converter
Appendix A.15. Energy and Efficiency of the Electric Converter
Appendix A.16. Efficiency and Equivalent Energy of the EH–TD System Overall
Appendix B. Aircraft Simulation Parameters and Values
Figure A1.
Oleo pneumatic values of (a) stiffness and (b) damping [24].
Figure A1.
Oleo pneumatic values of (a) stiffness and (b) damping [24].


Table A1.
Tires parameter values.
| Parameter | NLG Value | MLG Value |
| [N/m] [24] | 1.69 × 10⁶ | 6.6 × 10⁶ |
| [N × s/m] | 3.79 × 10³ | 1.36 × 10⁴ |
| [29] | 0.03 | 0.03 |
Table A2.
Aircraft and simulation values.
| Parameter | Value |
| [kg] [24] | 73.5 × 10³ |
| [m] [24,26] | 16.23 |
| [m] [24,26] | 1.2 |
| NF [−]: | 1 |
| NTF [−]: | 2 |
| NR [−]: | 2 |
| NTR [−]: | 2 |
| Front total mass vs sprung mass ratio | 0.95 |
| Rear total mass vs sprung mass ratio | 0.97 |
| [kg × m2] [24] | 9.8 × 10⁶ |
| [−] [24] | 20.8 |
| [Kg/m3] [24] | 101,325 |
| [°C] | 25 |
| [m/s2] | 9.807 |
Appendix C. Energy-Harvesting Simulation Process, Organization, Parameters and Values
Figure A2.
Energy-harvesting simulation process.

Figure A3.
Energy-harvesting model organization.

Table A3.
Energy-harvesting parameters and values.
| Parameter | Value |
| General | |
| Hydraulic fluid [-] | SAE 5W-30 |
| Hydraulic pipe diameter [in] | 1 |
| Harvester | |
| Energy-harvesting system width (L) [m] | 0.1:0.05:0.5 |
| Surface mass [kg] | |
| Piston area [cm2] [36] | [14.5, 30.5] |
| Energy-harvesting system height [m] | (Equation (1)) × 10−2 |
| Between harvesters connection length [m] | 10 |
| Harvester to intermedial converter connection length [m] | 30 |
| Unit storage | |
| Total accumulator volume (capacity) [l] [37] | [11.4, 30.5] |
| Precharge pressure (ppreload) [Pa] | 70:1:180 × 105 |
| Intermedial converter | |
| Displacement (D) [cm3/rev] [39] | 18 |
| Nominal shaft angular velocity (w_nominal) [rpm] [39] | 5550 |
| Nominal pressure drop (pr_nominal) [bar] [39] | 1 |
| Hydraulic motor rotor inertia [kg.m2] [39] | 0.0014 |
| Gear Box ratio (in/out) [-] | (1/4):(1/0.1):(1/3) |
| Electric generator | |
| Constant of proportionality K [V/rpm] [42] | 0.25 |
| Armature resistance (Ra) [Ohm] [42] | 1.1 |
| Armature inductance (La) [H] [42] | 0.0048 |
| Rotor inertia [kg.m2] [42] | 0.05 |
| Load power (Pload) [W] | 50 |
References
- Correia, D.; Ferreira, A. Energy Harvesting on Airport Pavements: State-of-the-Art. Sustainability 2021, 13, 5893. [Google Scholar] [CrossRef]
- Yildiz, F. Potential Ambient Energy-Harvesting Sources and Techniques. J. Technol. Stud. 2009, 35, 40–48. [Google Scholar] [CrossRef]
- Correia, D.; Ferreira, A. Energy Harvesting on Airport Pavements Ambient Dependent: Ponta Delgada Airport Case Study. Sustainability 2023, 15, 1733. [Google Scholar] [CrossRef]
- ICAO. 14—Volume 1: Aerodromes–Aerodrome Design and Operations; International Civil Aviation Organization: Montreal, QC, Canada, 2013. [Google Scholar]
- AAA. Airport Practice Note 12—Airfield Pavement Essentials; Australian Airports Association: Barton, ACT, Australia, 2017. [Google Scholar]
- Wright, J.R.; Cooper, J.E. Introduction to Aircraft Aeroelasticity and Loads; John Wiley & Sons: Hoboken, NJ, USA, 2008; Volume 20. [Google Scholar]
- Lomax, T.L. Structural Loads Analysis for Commercial Transport Aircraft: Theory and Practice; American Institute of Aeronautics and Astronautics: Reston, VA, USA, 1996. [Google Scholar]
- Howe, D.; Rorie, G. Aircraft Conceptual Design Synthesis; Professional Engineering Publishing: London, UK, 2000. [Google Scholar]
- Krüger, W.R.; Morandini, M. Recent developments at the numerical simulation of landing gear dynamics. CEAS Aeronaut. J. 2011, 1, 55–68. [Google Scholar] [CrossRef]
- Krüger, W.R.; Cumnuantip, S. A hybrid approach for the analysis of aircraft ground loads. In Proceedings of the International Forum on Aeroelasticity and Structural Dynamics 2019, IFASD 2019, Savannah, GA, USA, 10–13 June 2019. [Google Scholar]
- Abramovich, H.; Harash, E.; Milgrom, C.; Amit, U. Energy Harvesting From Airport Runway. U.S. Patent US20090195124A1, 6 August 2009. [Google Scholar]
- Innowattech. Innowattech. Available online: http://innowattech.co.il/ (accessed on 2 October 2023).
- Hill, D.; Agarwal, A.; Tong, N. Assessment of Piezoelectric Materials for Roadway Energy Harvesting. California Energy Commission; Publication Number: CEC-500-2013-007; DNV KEMA Energy & Sustainability: Oakland, CA, USA, 2014. [Google Scholar]
- Horionopoulos, S. Alternative Energy from Traffic Motion; Kinergy Power: Welland, SN, Canada, 2018. [Google Scholar]
- Duarte, F.; Ferreira, A.; Fael, P. Integration of a mechanical energy storage system in a road pavement energy harvesting device. Proc. Inst. Civ. Eng.—Energy 2017, 171, 70–81. [Google Scholar] [CrossRef]
- Underground Power. Lybra. Available online: http://www.upgen.it (accessed on 1 September 2020).
- PAVNEXT. PAVNEXT. Available online: https://www.pavnext.com/ (accessed on 1 June 2019).
- MathWorks. MATLAB, version 9.12.0 (R2022a); The MathWorks Inc.: Portola Valley, CA, USA, 2022. [Google Scholar]
- MathWorks. Simulink, version 10.5 (R2022a); The MathWorks Inc.: Portola Valley, CA, USA, 2022. [Google Scholar]
- Correia, D.; Ferreira, A. Aircrafts On-Ground Dynamics Models and Simulation Software: State-of-the-Art. Sustainability 2021, 13, 9147. [Google Scholar] [CrossRef]
- Jazar, R.N. Advanced Vehicle Dynamics; Springer: Berlin/Heidelberg, Germany, 2019. [Google Scholar]
- SDI Engineering Inc. GearSim, version 2.9.4a; SDI Engineering Inc.: Bellevue, WA, USA, 2021. [Google Scholar]
- Michelin Aircraft Tire. Aircraft Tire Engineering Data; Michelin Aircraft Tire: Clermont-Ferrand, France, 2019. [Google Scholar]
- The Goodyear Tire & Rubber Company. Goodyear Aviation Data Book; The Goodyear Tire & Rubber Company: Akron, OH, USA, 2021. [Google Scholar]
- Richards, P.W.; Erickson, A. Dynamic Ground Loads Analysis Using Detailed Modeling of Landing Gear and Aircraft Aeroservoelastics. In Proceedings of the AIAA Scitech 2019 Forum, San Diego, CA, USA, 7–11 January 2019; p. 0759. [Google Scholar]
- Wesołowski, M.; Blacha, K.; Pietruszewski, P.; Iwanowski, P. Analysis of the actual contact surface of selected aircraft tires with the airport pavement as a function of pressure and vertical load. Coatings 2020, 10, 591. [Google Scholar] [CrossRef]
- Airbus. Aircraft Characteristics, Airport and Maintenance Planning; Airbus: Leiden, The Netherlands, 2022. [Google Scholar]
- Michelin Aircraft. Tire Selector. Available online: https://aircraft.michelin.com/tire-selector (accessed on 1 March 2023).
- Thompson, A. The effect of tyre damping on the performance of vibration absorbers in an active suspension. J. Sound Vib. 1989, 133, 457–465. [Google Scholar] [CrossRef]
- Smiley, R.F.; Horne, W.B. Mechanical Properties of Pneumatic Tires with Special Reference to Modern Aircraft Tires; National Aeronautics and Space Administration: Washington, DC, USA, 1960; Volume 64. [Google Scholar]
- Lanham, C. Inertia Calculation Procedure for Preliminary Design; Aeronautical Systems Division Wright-Patterson AFB: Dayton, OH, USA, 1979. [Google Scholar]
- Raymer, D. Aircraft Design: A Conceptual Approach; American Institute of Aeronautics and Astronautics, Inc.: Reston, VA, USA, 2012. [Google Scholar]
- Pegram, J.P.; Anemaat, W.A. Preliminary Estimation of Airplane Moments of Inertia Using CAD Solid Modeling; 0148-7191; SAE Technical Paper; SAE International: Warrendale, PA, USA, 2000. [Google Scholar]
- Morelli, E.A. Determining aircraft moments of inertia from flight test data. J. Guid. Control. Dyn. 2022, 45, 4–14. [Google Scholar] [CrossRef]
- Simmons, B.M.; Gresham, J.L.; Woolsey, C.A. Nonlinear Dynamic Modeling for Aircraft with Unknown Mass Properties Using Flight Data. J. Aircr. 2023, 60, 968–980. [Google Scholar] [CrossRef]
- McDonald, M.; Richards, P.W.; Walker, M.; Erickson, A.J. Carrier Landing Simulation using Detailed Aircraft and Landing. In Proceedings of the AIAA Scitech 2020 Forum, Orlando, FL, USA, 6–10 January 2020; p. 1138. [Google Scholar]
- ENERPAC. E328a, Industrial Tools; ENERPAC: Menomonee Falls, WI, USA, 2017. [Google Scholar]
- Parker Hannifin Corporation. Accumulator, Accessories and Spares Catalogue; Parker Hannifin Corporation: Cleveland, OH, USA, 2018. [Google Scholar]
- Leon-Quiroga, J.; Newell, B.; Krishnamurthy, M.; Gonzalez-Mancera, A.; Garcia-Bravo, J. Energy efficiency comparison of hydraulic accumulators and ultracapacitors. Energies 2020, 13, 1632. [Google Scholar] [CrossRef]
- Rexroth. Axial Piston Variable Motor A6VM Data Sheet; A6VM Series 63; Rexroth: Lohr am Main, Germany, 2012. [Google Scholar]
- Bolton, W. Mechatronics: Electronic Control Systems in Mechanical and Electrical Engineering; Pearson Education: London, UK, 2003. [Google Scholar]
- J Chapman, S. Electric Machinery Fundamentals; McGraw-Hill: New York, NY, USA, 2004. [Google Scholar]
- Dole, C.E.; Lewis, J.E.; Badick, J.R.; Johnson, B.A. Flight Theory and Aerodynamics: A Practical Guide for Operational Safety; John Wiley & Sons: Hoboken, NJ, USA, 2016. [Google Scholar]
Figure 1.
EH–TD platforms format and function.

Figure 2.
Tire—EH–TD (a) before, (b) starting, (c) during, and (d) after interaction.

Figure 3.
Modules of the EH–TD model.
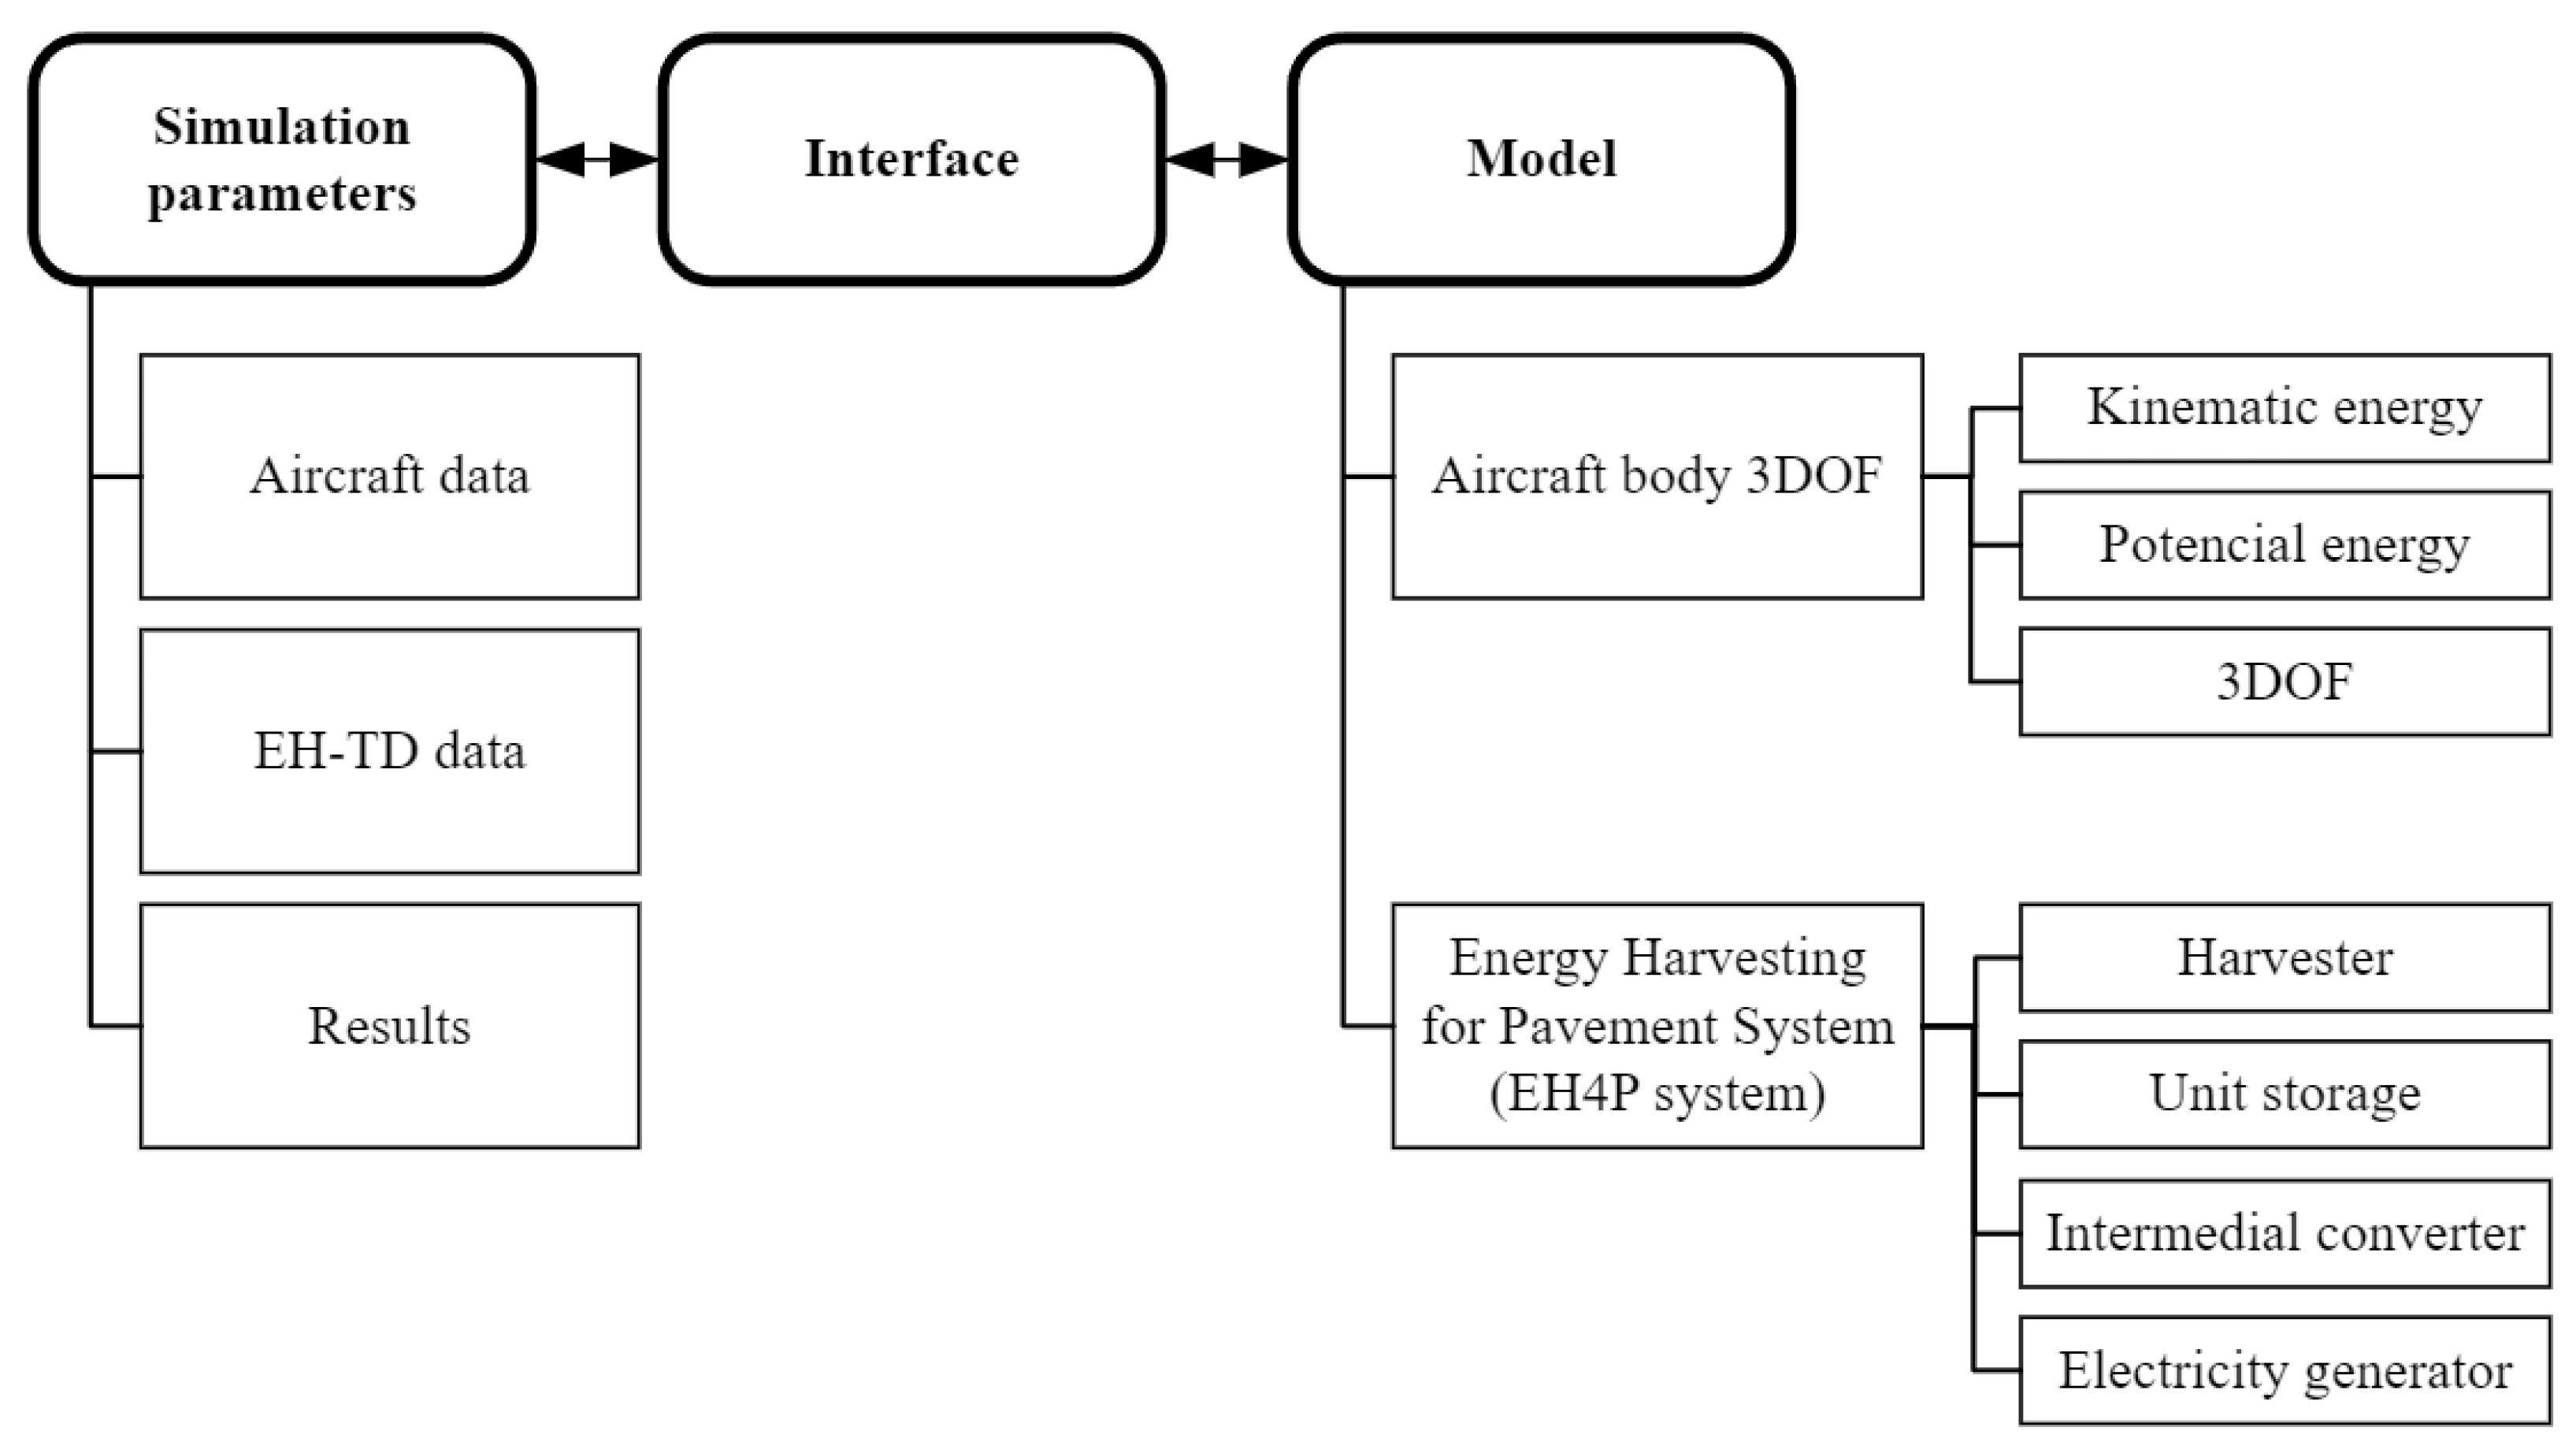
Figure 4.
Energy harvesting for pavement traffic-dependent system overall divided by harvester, unit storage, intermedial converter, and electric converter.
Figure 4.
Energy harvesting for pavement traffic-dependent system overall divided by harvester, unit storage, intermedial converter, and electric converter.

Figure 5.
Interaction between aircraft and pavement at different velocities.

Figure 6.
Aircraft behavior with the EH–TD system interaction.

Table 1.
BBI considered values.
| (m) | (cm) |
|---|---|
| 0.10 | 1.793 |
| 0.15 | 1.833 |
| 0.20 | 1.872 |
| 0.25 | 1.911 |
| 0.30 | 1.951 |
| 0.35 | 1.990 |
| 0.40 | 2.029 |
| 0.45 | 2.067 |
| 0.50 | 2.106 |
Table 2.
Sample of simulated values and results.
| (m/s) | (m) | (J) | (J) | (J) | (J) | (J) | (Wh/(m.veh)) |
|---|---|---|---|---|---|---|---|
| 10 | 0.10 | 12,277.7 | 10,184.8 | 9776.7 | 4050.0 | 2449.4 | 6.80 |
| 0.30 | 13,357.5 | 24,860.6 | 12,779.8 | 6732.2 | 4076.7 | 3.77 | |
| 0.50 | 14,420.5 | 37,502.1 | 14,517.3 | 7347.9 | 4448.4 | 2.47 | |
| 15 | 0.10 | 12,277.7 | 7282.0 | 6750.7 | 3074.5 | 1860.2 | 5.17 |
| 0.30 | 13,357.5 | 17,001.9 | 8769.5 | 4808.7 | 3247.0 | 3.01 | |
| 0.50 | 14,420.5 | 27,176.9 | 14,128.9 | 7232.1 | 4378.6 | 2.43 | |
| 20 | 0.10 | - | - | - | - | - | - |
| 0.30 | 13,357.5 | 13,719.3 | 7195.6 | 3217.6 | 2644.1 | 2.45 | |
| 0.50 | 14,420.5 | 20,949.6 | 11,788.0 | 6929.3 | 4353.0 | 2.42 | |
| 25 | 0.10 | - | - | - | - | - | - |
| 0.30 | 13,357.5 | 11,102.0 | 5231.8 | 2073.3 | 1921.8 | 1.78 | |
| 0.50 | 14,420.5 | 16,963.5 | 9047.4 | 4678.9 | 3336.2 | 1.85 |
Table 3.
Summary of the best values achieved.
| (m/s) | (m) | (%) | (%) | (%) | (%) | (%) | (%) |
|---|---|---|---|---|---|---|---|
| 10 | 0.10 | 82.95 | 53.25 | 95.99 | 60.48 | 24.05 | 19.95 |
| 0.30 | 186.12 | 73.33 | 51.41 | 60.56 | 16.40 | 30.52 | |
| 0.50 | 260.06 | 77.07 | 38.71 | 60.54 | 11.86 | 30.85 | |
| 15 | 0.10 | 59.31 | 43.23 | 92.70 | 60.51 | 25.55 | 15.15 |
| 0.30 | 127.28 | 62.85 | 51.58 | 67.52 | 19.10 | 24.31 | |
| 0.50 | 188.46 | 72.97 | 51.99 | 60.54 | 16.11 | 30.36 | |
| 20 | 0.10 | - | - | - | - | - | - |
| 0.30 | 102.71 | 58.06 | 52.45 | 82.18 | 19.27 | 19.79 | |
| 0.50 | 145.28 | 66.42 | 56.27 | 62.82 | 20.78 | 30.19 | |
| 25 | 0.10 | - | - | - | - | - | - |
| 0.30 | 83.11 | 51.46 | 47.13 | 92.69 | 17.31 | 14.39 | |
| 0.50 | 117.63 | 60.33 | 53.33 | 71.30 | 19.67 | 23.14 |
Disclaimer/Publisher’s Note: The statements, opinions and data contained in all publications are solely those of the individual author(s) and contributor(s) and not of MDPI and/or the editor(s). MDPI and/or the editor(s) disclaim responsibility for any injury to people or property resulting from any ideas, methods, instructions or products referred to in the content. |
© 2023 by the authors. Licensee MDPI, Basel, Switzerland. This article is an open access article distributed under the terms and conditions of the Creative Commons Attribution (CC BY) license (https://creativecommons.org/licenses/by/4.0/).
Share and Cite
MDPI and ACS Style
Correia, D.; Richards, P.; Ferreira, A. Energy Harvesting on Airport Pavements Traffic Dependent: A321 (Narrow-Body) Aircraft Case Study. Smart Cities 2023, 6, 2783-2806. https://doi.org/10.3390/smartcities6050125
AMA Style
Correia D, Richards P, Ferreira A. Energy Harvesting on Airport Pavements Traffic Dependent: A321 (Narrow-Body) Aircraft Case Study. Smart Cities. 2023; 6(5):2783-2806. https://doi.org/10.3390/smartcities6050125
Chicago/Turabian StyleCorreia, Diogo, Phillip Richards, and Adelino Ferreira. 2023. "Energy Harvesting on Airport Pavements Traffic Dependent: A321 (Narrow-Body) Aircraft Case Study" Smart Cities 6, no. 5: 2783-2806. https://doi.org/10.3390/smartcities6050125