Article

Grid Impact of Wastewater Resource Recovery Facilities-Based Community Microgrids

Smart Grid Interdependencies Laboratory, Department of Electrical Engineering, City College of the City University of New York, New York, NY 10031, USA
*
Author to whom correspondence should be addressed.
Smart Cities 2023, 6(6), 3427-3453; https://doi.org/10.3390/smartcities6060152
Submission received: 20 October 2023 / Revised: 22 November 2023 / Accepted: 30 November 2023 / Published: 11 December 2023
(This article belongs to the Section Smart Urban Infrastructures)

Abstract

:
The overarching goal of this paper is to explore innovative ways to adapt existing urban infrastructure to achieve a greener and more resilient city, specifically on synergies between the power grid, the wastewater treatment system, and community development in low-lying coastal areas. This study addresses the technical feasibility, benefits, and barriers of using wastewater resource recovery facilities (WRRFs) as community-scale microgrids. These microgrids will act as central resilience and community development hubs, enabling the adoption of renewable energy and the provision of ongoing services under emergency conditions. Load flow modeling and analysis were carried out using real network data for a case study in New York City (NYC). The results validate the hypothesis that distributed energy resources (DERs) at WRRFs can play a role in improving grid operation and resiliency.

1. Introduction

1.1. Background and Objectives

This paper addresses infrastructure and urban design for community resilience in the face of climate change, natural disasters, manmade threats, and population growth [1]. As an example, the focus of this paper will be on the case of New York City (NYC) wastewater treatment plants (WTTPs), re-branded by the NYC Department of Environmental Protection (DEP) as wastewater resource recovery facilities (WRRFs). These WRRFs comprise major infrastructure, located in low-lying coastal neighborhoods, which requires team-based interdisciplinary socio-technical studies. The study will investigate opportunities for transformational change at WRRFs in terms of energy resources, coastal landscape, neighborhood resilience, and community development [1]. In [2], we studied the feasibility of creating microgrids at WRRFs, including renewable biogas, cogeneration, PV arrays, and energy storage. These microgrids will act as central resilience and community development hubs for the communities around WRRFs, enabling the adoption of renewable energy and the provision of ongoing services under emergency conditions. Furthermore, we focus on analyzing the impact and value of DERs located in WRRF microgrids on the distribution grid.
The main contributions of this paper are as follows:
(1)
Discuss the energy and power requirements of WRRFs;
(2)
Develop approaches to assess the siting and sizing of distributed energy resources within WRRF community microgrids (CMGs);
(3)
Assess the benefits of WRRF community microgrids to communities and the electric grid;
(4)
Propose a practical way to achieve city resilience, catalyzing collaboration between critical infrastructure (CI) managers, which can ultimately result in a better understanding of CI interdependencies.

1.2. Sustainability and Resiliency Goals in New York

The study presented in this paper is especially important to urban regions. The main case study is centered around NYC. In NYC, both resiliency and GHG emission reduction are imperative. (1) NYC suffered devastating societal and economic impacts in the past due to natural disasters. For instance, during super-storm Sandy in 2012, ten out of NYC’s fourteen WRRFs were damaged or lost power releasing more than 560 million gallons of wastewater into local waterways, for which they were fined. (2) Both NYC and New York State (NYS) have set up aggressive GHG emission reduction targets. In 2019, the Climate Leadership and Community Protection Act (CLCPA) was passed targeting 85% reduction in GHG emissions by 2050, 100% carbon-free electricity by 2040, 70% renewable energy by 2030, 9000 MW of offshore wind by 2035, 3000 MW of energy storage by 2030, 6000 MW of solar by 2025, and 22 million tons of carbon reduction through energy efficiency and electrification.
Based on a 2016 study, the city identified 55 MW of rooftop solar potential based on buildings with 10,000 gross square feet and above, not including unconventional types of installation, such as parking lots. As of 2018, the city implemented only 10.7 MW of solar PV installation, which was merely 10% of the goal, one of which was at the 1264.25 kW Port Richmond WWTP. In 2019, the city passed local laws LL92 and LL94 mandating buildings retrofitting their roof to have a sustainable roofing zone either by adding solar PV or green roof. By 2022, the numbers improved, but NYC has still fallen behind. It only installed about 333 megawatts of solar, much less than the solar capacity it aims to achieve by 2025 [3].
NYC’s 14 WRRFs serve 8.5 million residents. Even though WRRFs have a significant footprint, apart from the existing 1.26 MW PV system at Port Richmond, only 0.4 MW potential solar PV is available across all DEP facilities. This is primarily due to the limited rooftops readily available for PV deployment based on the 2016 Solar 100 report. With more innovative PV installations (e.g., canopies or parking lot PV), the potential PV deployment may substantially increase.
In NYC, electricity represents 46.4% of the total energy usage, compared to 46.3% gas and 7.3% steam. Electricity utilizes 77.2% of the total NYC heat, light, and power budget compared to 16.6% gas and 6.2% steam. WRRFs are large consumers of electricity. Electricity use accounts for between 10 and 40% of the operating budgets for wastewater utilities. In NYC, WRRFs in total consumed ~930,000 MWh of electricity in 2013 up 3.7% over 2003 usage rates. The total NYC electricity consumption in 2015 was 2,548,290,656 kWh. WWTPs accounted for about 36% of that amount [4].
WRRFs account for a small portion of the total GHGs emitted in NYC. Waste (i.e., landfills, biological treatment, and wastewater treatment) accounts for 3.5% of city-wide greenhouse gas emissions in 2015. Of that, 12% is attributed to wastewater treatment plants. The emissions source breakdown is 70% CH4 and 30% NO2 [5].
WRRFs represent the highest energy consumption density when compared to the rest of the 4000+ city-owned facilities. While representing a significant load on the electricity distribution network, they provide an opportunity for sustainable and resilient development. Improving the energy efficiency of WWTPs can yield substantial GHG emission reduction. The wastewater treatment process produces biogases that can, with proper preparation, potentially be used to produce energy. All 14 WRRFs utilize large real estate, which translates into potential canopy solar PV and large energy storage systems (ESSs). Given that WWTPs are open to water streams, some may have the potential for tidal or microturbine power generation.
There is no doubt that energy storage systems will play a key role in achieving NYC’s goals. In fact, NYC has developed the Innovative Demonstrations for Energy Adaptability (IDEA) program to allow for innovative demonstrations for energy efficiency solutions, which include energy storage and renewable energy, alongside building control and HVAC optimization. Presently, ESSs still face some regulatory barriers, mainly from a fire safety perspective. Nonetheless, these barriers are likely to vanish given the aggressive New York State’s goal of deploying 3000 MW of energy storage by 2030 [6].
A group of distributed energy resources (DERs), including local generators and energy storage systems that are collectively treated as a single controllable entity with respect to the main grid, form a microgrid. Microgrids will help NYC achieve both GHG emission reduction as well as resiliency goals.
The rest of the paper is organized as follows: In Section 2, the literature review is presented. In Section 3, community microgrids are discussed, along with assessment tools for the siting and sizing of DERs. In Section 4, an overview of WRRFs in NYC is presented. In Section 5, the results of a case study are presented and discussed. Finally, Section 6 summarizes some of the conclusions that can be deduced from this paper.

2. Literature Review

To concurrently achieve resilience and greenhouse gas (GHG) emission reduction, electricity end-users must be equipped with generation and storage elements to utilize highly variable renewable energy sources and to supply their loads locally during blackouts. The power system will likely evolve to be divided into many local energy networks, often called microgrids. Interconnected through the main power network during normal operating conditions, electricity end-users can island themselves to operate independently when a fault occurs. To realize the full benefits of microgrid deployment, microgrids must be renewable-energy-based [7,8]. Since microgrids can operate in isolation, they can provide a source of power during blackouts, supporting community-scale communications and other services during high-impact low-frequency events. Microgrids can overcome regulatory hurdles through new forms of development and ownership by local institutions, then referred to as community microgrids [9,10].

2.1. Microgrids

Microgrids are foundational building blocks of the next-generation power grid. They can largely contribute to achieving two short-term imperatives, sustainability and resiliency. A microgrid is a set of controllable and uncontrollable loads, renewable energy resources, and energy storage systems within clearly defined electrical boundaries, which can act as a single controllable entity. A microgrid is controlled through a local Microgrid Central Controller (MGCC), which enables the microgrid to operate while connected to the main grid, in a so-called grid-connected mode, or in isolation from the main grid in an islanded mode [11].
Microgrids are unlike conventional grid-tie solar photovoltaic installations, which fail to operate during power interruptions. The technology to develop inverters that can work independently from the grid by creating a local reference for the voltage and frequency (i.e., black-start inverters) exists [12]. However, even with black-start inverters, conventional solar installations cannot operate in an islanded mode, since during blackouts, the generation/load balance cannot be maintained. On the other hand, solar installations within microgrids stay operational during blackouts since batteries can replace the main grid and offer the required balance [13].
Microgrids are substantially more resilient than conventional battery installations. Conventional battery installations cannot recharge during wide-scale blackouts. They provide backup power until the energy stored in them prior to the blackout is fully depleted, which typically lasts for a few hours. In microgrids, since the solar energy produced every day can recharge the batteries, microgrids can be sized and optimized to provide days of resiliency [14].
Microgrids are unlike conventional backup diesel generators. Diesel generators are primarily intended to provide short-term backup for critical loads, typically those mandated by the national codes (e.g., emergency lights or serve critical facilities, such as hospitals, prisons, or critical infrastructures) [15]. They are inefficient, especially when operated far below their rated power and, hence, are a major source of pollution. Diesel generators are less resilient than microgrids since they rely on the physical transport of fuel. During normal operating conditions, diesel generators are idle. If not carefully maintained, diesel generators often fail to function during blackouts [16,17].
Microgrids, on the other hand, are intended to continuously operate whether the main grid is available or not. Microgrids must support operation in a grid-connected mode, since this results in harnessing more renewable energy, to offset the energy that would otherwise be produced by fossil-fuel-based power plants. Moreover, due to the relatively high capital cost of microgrids, planning them exclusively for resilience is cost-prohibitive. Microgrids’ cost is more justifiable when other applications are considered, such as peak demand reduction or energy arbitrage, leading to a stack of benefits resulting from a single installation [18,19].

2.2. Community Microgrids

Community microgrids (CMGs), as shown in Figure 1, emerged to overcome several of the financial and regulatory barriers that microgrids currently face. In a community microgrid, a group of DERs deployed at multiple neighboring facilitates is virtually aggregated, e.g., to perform load management, market participation, and/or load shifting. A community microgrid typically includes critical facilities among the portfolio of loads that it encompasses, such as a hospital or a water pumping station. Expanding from an individual microgrid to a community microgrid results in several advantages, including:
(1)
At high penetration levels of renewable energy sources, the power grid will be negatively impacted. For instance, a high capacity of photovoltaic leads to overgeneration (i.e., local generation exceeding demand) during the noon period. This overgeneration, if not handled with energy storage, can lead to overvoltage and eventually, the produced energy must be curtailed. In addition, noon overgeneration changes the shape of the load curve (leading to a so-called duck curve) where the demand decreases during the morning–afternoon hours and sharply increases by late afternoon through sunset. The duck curve makes it more challenging to plan unit commitment and generator dispatch and to operate the distribution grid [20,21,22]. At even higher penetration levels of bulk renewable energy deployment, synchronous generators are likely to be phased out. With fewer rotating masses in the system, the inertia needed to instantaneously stabilize frequency variations is reduced. This deteriorates the angle stability and voltage security of the transmission system. ESSs can buffer the impact of renewable energy on the grid by providing ramp control. Community microgrids can play a key role in mitigating the aforementioned negative impacts since they enable community-scale coordination of DERs.
(2)
Some entities may be interested in deploying microgrids (e.g., data centers and other critical facilities with high power failure costs, or cities with sustainability and resiliency goals) [15]; however, the space available to place DERs is limited. Community microgrids can contribute to making more space collectively available for DER deployment. Having large space potentially available, WRRFs can play a key role as central community resiliency hubs.
(3)
The cost of deploying single microgrids may not be easily justifiable [23]. Virtual aggregation of DERs within a community microgrid results in new revenue streams (e.g., potential participation in various energy markets) [24], which can lead to financial feasibility.
(4)
Community microgrids can be built to develop a community-level mesh telecommunications network. This network gives an opportunity to individuals/households that are normally isolated to connect to other members of the community or potentially to the internet. Since community microgrids guarantee a sustainable power supply during blackouts, this local network can play a vital role during natural disasters [25,26].
(5)
Deployment of community microgrids creates new public–private partnerships and catalyzes community engagement centered around shared energy resources [27,28,29]. In NYC, since some WRRFs are located in low-income regions, WRRF-based community microgrids can contribute to increased social justice.
New York State took several leaps toward the implementation of community microgrids, including demonstrations that included WTTPs, such as the Ithaca WWTP microgrid [30].
Depending on their scale, community microgrids can be divided into (see Figure 1) (1) partial feeder microgrids, in which loads connected to a portion of a primary feeder are aggregated [26]. A circuit breaker must be available to isolate all loads during islanding; (2) feeder microgrids are where loads connected to a whole feeder form community microgrids. In this case, the circuit breaker already available at the area substation can be utilized. Caution must be given while re-energizing the feeder following an islanding scenario to guarantee the safety of workers, and (3) area microgrids are where loads connected to multiple feeders form a community microgrid. This scale can extend to possibly cover the whole area, forming a substation community microgrid. The point at which a microgrid interfaces with the main grid is referred to as the point of common coupling (PCC). Feeder and area community microgrids may have multiple PCCs. These PCCs must be well coordinated and synchronized, especially during back-and-forth transitions between the grid-connected and islanding modes.
Deployment of community microgrids poses several challenges, including the need for new business models beyond the relatively conventional DER or single-microgrid investments, coordination of multiple PCCs, interconnection challenges, tariffs and rates associated with DERs, impacts of information and communication technologies (ICTs) degradation on microgrid control, and cyber security challenges [31,32,33].
Several studies have been conducted to evaluate the feasibility of community microgrids for different communities (see Table 1 for a summary of these studies). The focus of most of the research is to solve the optimization problem of CMGs for remote areas. Intricacies of WWRF-based CMGs in the context of dense urban areas have rarely been studied. Moreover, the impact of CMGs interconnection on the grid has not been taken into account. We study the feasibility of the CMG at one of the WWRFs located in NYC. Further, the impact of CMGs on the distribution system of NYC has also been analyzed in depth. This study will inform the concerned authorities of NYC to make pragmatic strategies in realizing the “net-zero carbon” goals set by the government. The following table illustrates the key contributions of this work, highlighting the gaps filled in the existing literature.

3. The Role of Community Microgrids in Future Power Grids

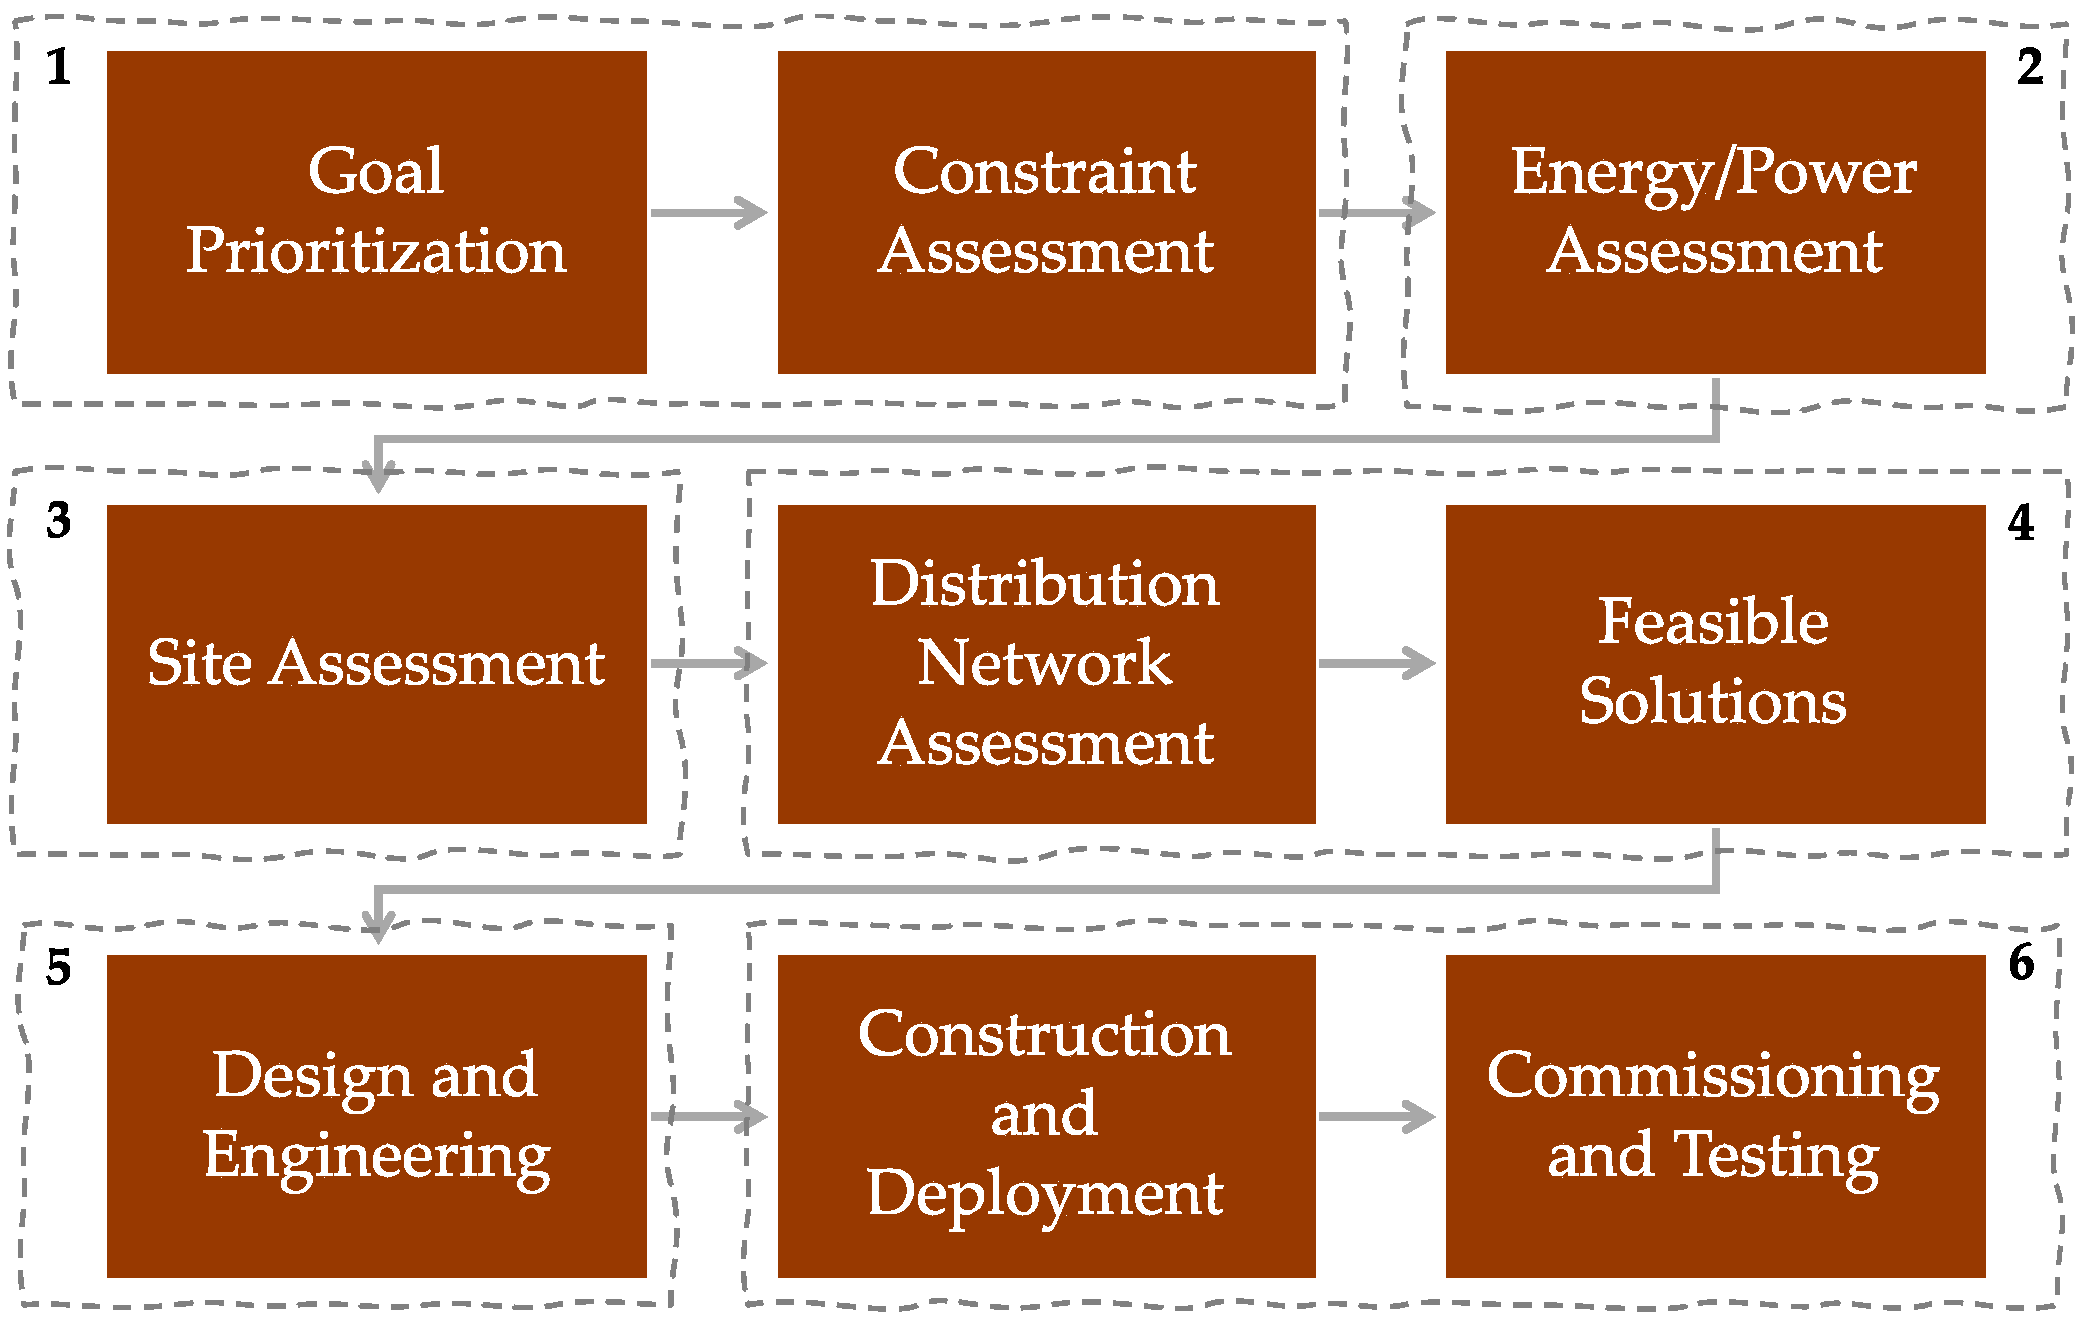
3.1. Proposed Assessment Procedure

Assessing the technical and financial feasibility of WRRF-based community microgrid deployment must follow a sequence of steps as follows [26] (see Figure 2).
Goal prioritization: deployment of community microgrids yields several benefits. Customers save on their electricity bills. Power utility companies can use community microgrids as part of their Non-Wires Solutions (NWSs) portfolio for primary-feeder or area-substation load relief, deferring infrastructure upgrades at energy-congested network locations. With community microgrids, cities can approach their sustainability and resiliency goals. Consequently, the set of goals associated with a community microgrid deployment may vary. For instance, the goal may be to maximize the overall capacity of DERs (e.g., fit as much solar and combined heat and power (CHP) generation as possible), to build a community microgrid that maximizes resiliency, or a community microgrid that is sized just enough to achieve a demand reduction target or participate in a pre-specified demand response program. Prioritizing these goals should be performed by decision makers and stakeholders, including, for instance, city agencies that operate WRRFs and buildings and customers to be included in the community microgrid. The goal is identifying use cases (e.g., demand response vs. peak demand reduction) that the community microgrid will address/maximize and rank them in the level of importance. Since stakeholders involve agencies that do not typically coordinate at a decision-making level, academic/research institutions can play a key role in facilitating the needed discussions.
Constraint assessment: after determining the goal/s of community microgrid deployment, it is crucial to quantify the constraints. Constraints may include a certain limited budget to meet, the readiness level of technologies, the space available for DER deployment, and/or missing interconnection criteria, upgrades, and tariffs.
Energy/power assessment: in this step, the loads included in the community microgrid are analyzed to help in sizing the DERs within a community microgrid. This analysis must focus on both power and energy. Analyzing power refers to (1) categorizing loads as critical and non-critical and dispatchable and non-dispatchable; and (2) developing a strong understanding of the instantaneous power requirements of all types of loads (including starting and in-rush currents). This step leads to the proper selection of the kW/MW capacity of DERs and is essential to guarantee successful operation during islanding. Analyzing energy refers to developing an understanding of how power consumption varies over time. It can be performed using interval metering (billing) data or Advanced Metering Infrastructure (AMI). Analyzing energy leads to the proper selection of the required kWh/MWh of energy storage systems and to a better understanding of the community microgrid potential to perform demand response, energy arbitrage, or market participation.
Site assessment: in this step, the WRRF and its neighboring facilities are assessed for potential solar, ESS, and CHP deployment. This step also includes a thorough assessment of the WRRF processes and potential utilization of the energy embedded in biogases and biosolids.
Distribution network assessment: this step involves analyzing the hosting capacity of the distribution network and running load flow models. The goals of this step are to determine network bottlenecks where community microgrid deployment should be prioritized and to find suitable locations for DERs, such that they do not overstrain the network and contribute to alleviating power congestions.
Feasible solutions: following the previous steps, a set of feasible solutions can be found (e.g., a scenario deploying all ESSs at the WRRF itself versus deploying some at the WRRF and some at neighboring facilities are both feasible). This step feeds back to decision makers with a set of solutions to choose from.
Design and engineering, construction and deployment, and commissioning and testing: these pertain to designing, implementing, and testing the system. This step also involves maintenance and end-of-life/recycling, which can substantially impact project finances. Since microgrids involve multiple types of resources and controllers, once agreed on vendors, it is recommended at this step to form a team with representation of stakeholders and vendors. Early coordination of how the microgrid controller will interface and interact with each of the solar systems, ESSs, CHPs, dispatchable loads, and the existing supervisory control and data acquisition (SCADA) systems is crucial.

3.2. Case Study: New York City

To clarify the assessment procedure presented earlier, a case study based in NYC is considered. A WRRF will be evaluated for potential community microgrid deployment. NYC’s 14 WRRFs are operated by the Department of Environmental Protection (DEP). These urban infrastructures emulate the remediation processes that naturally occur in water bodies in an industrialized manner, removing pollutants from the wastewater generated by the 8.6 million residents and additional daily commuters of NYC. The need for an industrialized waste filtration process sprang from the dense development of cities and their heavily concentrated waste streams.
The water and wastewater systems are two parts of an inter-related system; they are the supply/distribution and collection/treatment of water. Mitigating the damage from this partially closed loop will help to ensure the water cycle of cities will align with recognized resiliency metrics. Utilizing the microgrid, we will demonstrate that this resilience capability can be synergistically propagated along with energy and financial cost savings.
NYC treats about 1.3 billion gallons of wastewater daily, the sanitary sewage system consists of four types of sewage management: combined (60% of NYC), municipal, private, or direct-drainage/land overflow—meaning no sewage system at all. In a combined sewer system, both wastewater and stormwater are routed to the WRRF through a single pipe.
During times of wet weather, this system can become overwhelmed and overflow into waterways to alleviate the heavy amount of precipitation to prevent street flooding. This discharge is known as combined sewer overflow (CSO). Separate storm sewer systems carry wastewater and stormwater in separate pipes where wastewater is treated at a WWTP, and stormwater is discharged into a waterbody. One example of these systems is municipal separate storm sewer systems (MS4), which are owned by NYC. There are 96 pumping stations located in low-lying areas to lift wastewater and stormwater to a higher elevation to help continue the flow and get the wastewater to a treatment facility.
The process in which wastewater is processed contributes to the emissions of GHGs. In recent years, efforts to improve performance and ensure the sustainability of WRRFs in terms of their economic feasibility and environmental impact have become restricted by two key factors: GHG emissions and energy consumption. The gas reference for the global warming potential of GHGs is carbon dioxide (CO2); however, even though WRRFs emit this gas, it is determined to be climate neutral since it is predominantly biogenic.
Direct emissions of GHGs in wastewater treatment include nitrous oxide (N2O) and methane (CH4), which are produced in the biological wastewater treatment processes. A total of 90 percent of N2O production occurs in the activated sludge units, and the remaining 10 percent comes from the grit and sludge storage tanks. The highest amount of CH4 was detected in equipment related to sludge line units where anaerobic digestion is performed. Possible operational actions have been proposed to reduce GHG emissions. With respect to energy consumption reduction, the modification of WRRF configuration using microalgae or partial nitritation anammox processes to remove ammonia from wastewater can reduce emissions as well as the energy consumed.

4. An Overview of WRRFs in NYC

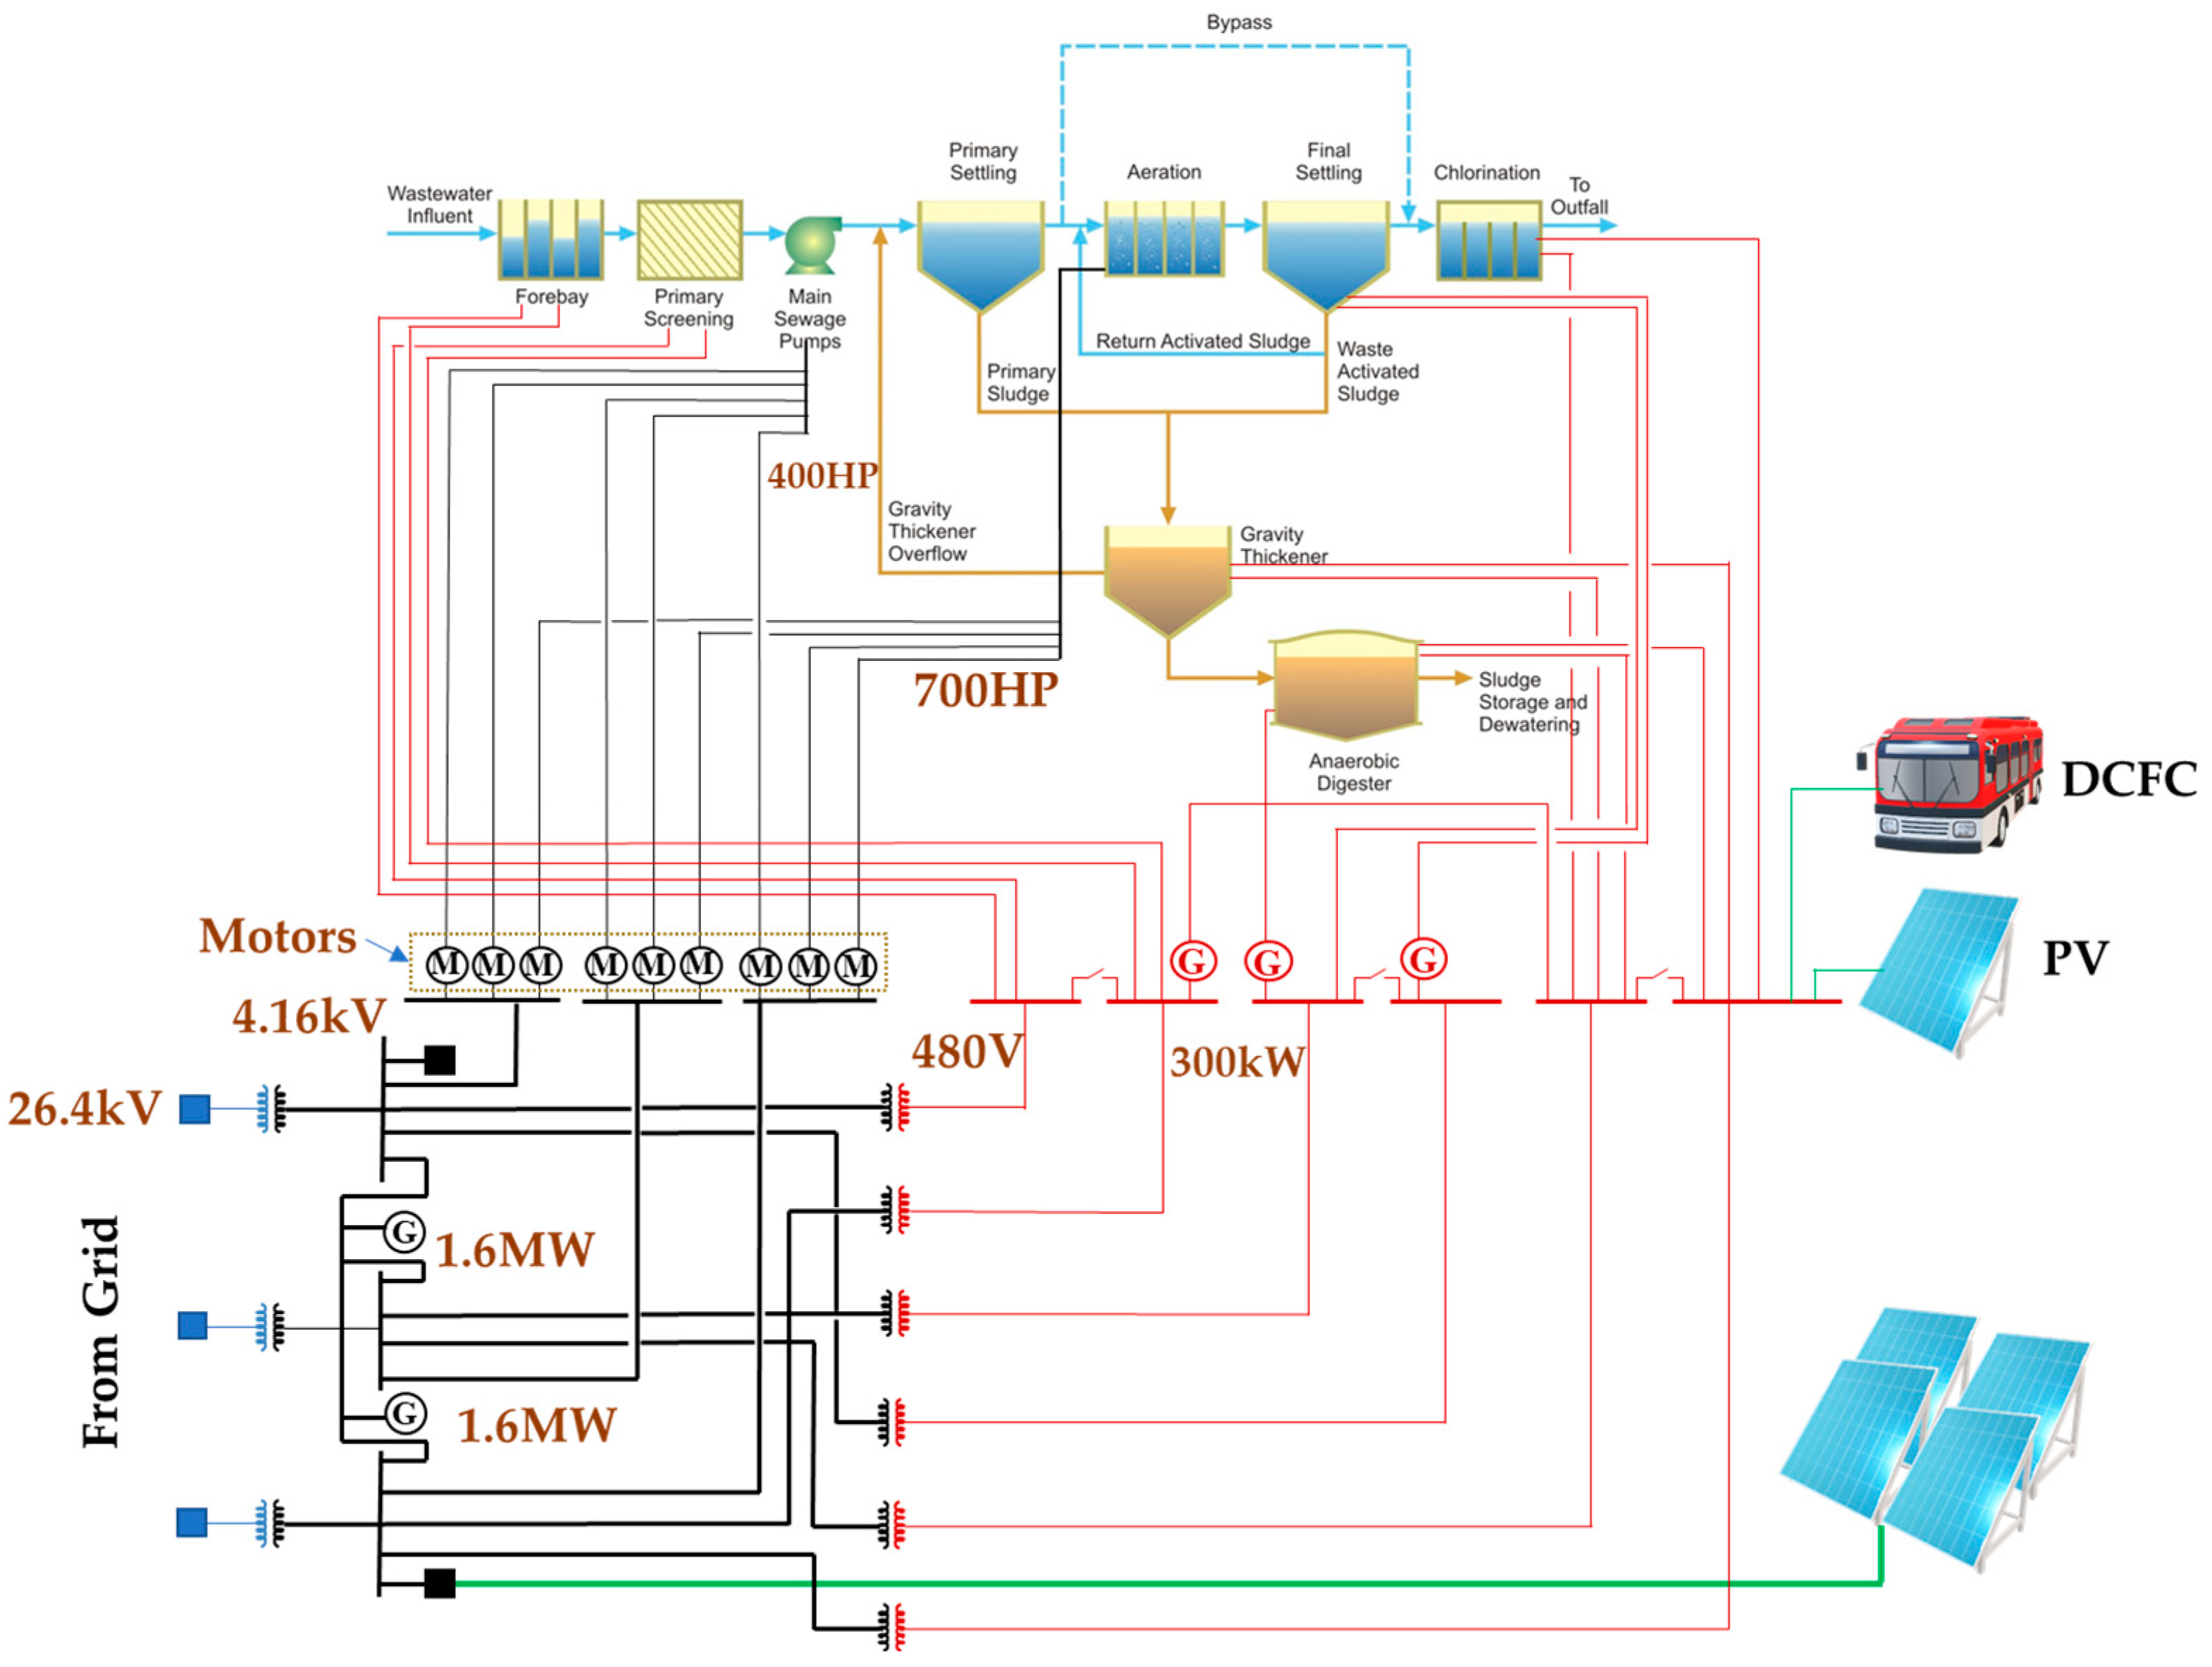
4.1. The Treatment Process

Depending on the treatment facility, wastewater undergoes five stages of processing: preliminary treatment, primary treatment, secondary treatment, disinfection, and sludge treatment. Wastewater is collected from incoming pipes at a waste well at each WRRF and then pumped up via main sewage pumps (MSPs) to start the treatment process. Plant influent flow fluctuates throughout the day (see Figure 3); high in the morning (from 9 a.m. to 12 p.m.) and lowest at night (from 12 a.m. to 6 p.m.). Hence, MSPs are operated accordingly. Preliminary processing screens floating debris such as cans, bottles, and other objects that might clog pipes, pumps, and other downstream processes.
Primary treatment removes coarse solids by flowing into a grit chamber where sand, grit, and gravel settle at the bottom. Sedimentation allows the removal of dissolved organic and inorganic constituents, which amass to a form of solid called primary sludge. Secondary treatment uses a biological process to remove up to 90 percent of organic matter using one of two common methods, suspended growth and attached growth processes.
In the attached growth process, microbial growth occurs on the surface of stone or plastic media and is effective in removing biodegradable organic material through trickling filters, biotowers and rotating biological contactors. Similarly, suspended growth removes organic and nitrogen-containing material by converting ammonia nitrogen to nitrate—which can include further treatment depending on the facility. Units that perform these processes are oxidation ditches, aeration tanks, and activated sludge that mix the wastewater with air and microorganisms. The accumulated microorganisms are removed and become activated sludge that can be used again by returning it into the aeration tank for mixing.
The activated sludge process is the most common option in secondary treatment. Aeration in an activated sludge process is based on pumping air into a tank, which promotes microbial growth in the wastewater. The microbes feed on the organic material, forming flocks that can easily settle out. After settling in a separate settling tank, bacteria forming the “activated sludge” flocks are continually recirculated back to the aeration basin to increase the rate of decomposition.
Aeration provides oxygen to bacteria for treating and stabilizing the wastewater. Oxygen is needed by the bacteria to allow biodegradation to occur. The supplied oxygen is utilized by bacteria in the wastewater to break down the organic matter containing carbon to form carbon dioxide and water. Without the presence of sufficient oxygen, bacteria are not able to biodegrade the incoming organic matter in a reasonable time.
Aeration is the most critical component of a treatment system using the activated sludge process. A well-designed aeration system has a direct impact on the level of wastewater treatment it achieves. An ample and evenly distributed oxygen supply in an aeration system is the key to rapid, economically viable, and effective wastewater treatment. In WWTPs, most energy consumption is noticeable in the aeration process, approximately 50–70% of total energy consumption. This unit supplies oxygen to the activity of microorganisms, which proceed with their life by feeding themselves with nutrients in raw wastewater. A common operational mistake is to set the blower at a constant speed for dissolved oxygen (DO). Over-aeration wastes energy and can negatively affect process performance.
The process air blowers are the source of air supply to the Air Diffuser System. The purpose of the Air Diffuser System is to aerate the wastewater by introducing air into the wastewater with submerged porous diffusers. The porous ceramic diffuser elements and in-basin piping are designed to transfer oxygen from the air to an activated sludge mixed liquor in an aeration tank and to create adequate mixing to keep the mixed liquor solids in suspension.
There are typically multiple (four at some WRRFs) blowers with a power of about 700 HP. Under normal operating conditions, the blowers are used for supplying air to the aeration tanks through fine-bubble porous ceramic diffusers. The diffusers are designed to transfer oxygen from the air to the activated sludge mixed liquor in the aeration tanks and to create adequate mixing to keep the liquor solids in suspension. Each blower is provided with air inlet guide vanes for control of airflow to maintain a constant dissolved oxygen level in the aeration tanks. During normal operation of the system, outside air is drawn through the pre-filters, the electrostatic dry plate, agglomerator filters (main filters), final filters, and outlet dampers. The air filters are designed to remove 97% of the particulates from city air and provide filtered air to the blowers containing less than 0.05 milligrams of dirt/1000 cu. ft. of air. Filtering of the incoming blower air is performed to prevent clogging of the diffusers, thus extending their service life.
There are a few factors that need to be monitored for efficient operation of the aeration process and to save energy:
(1)
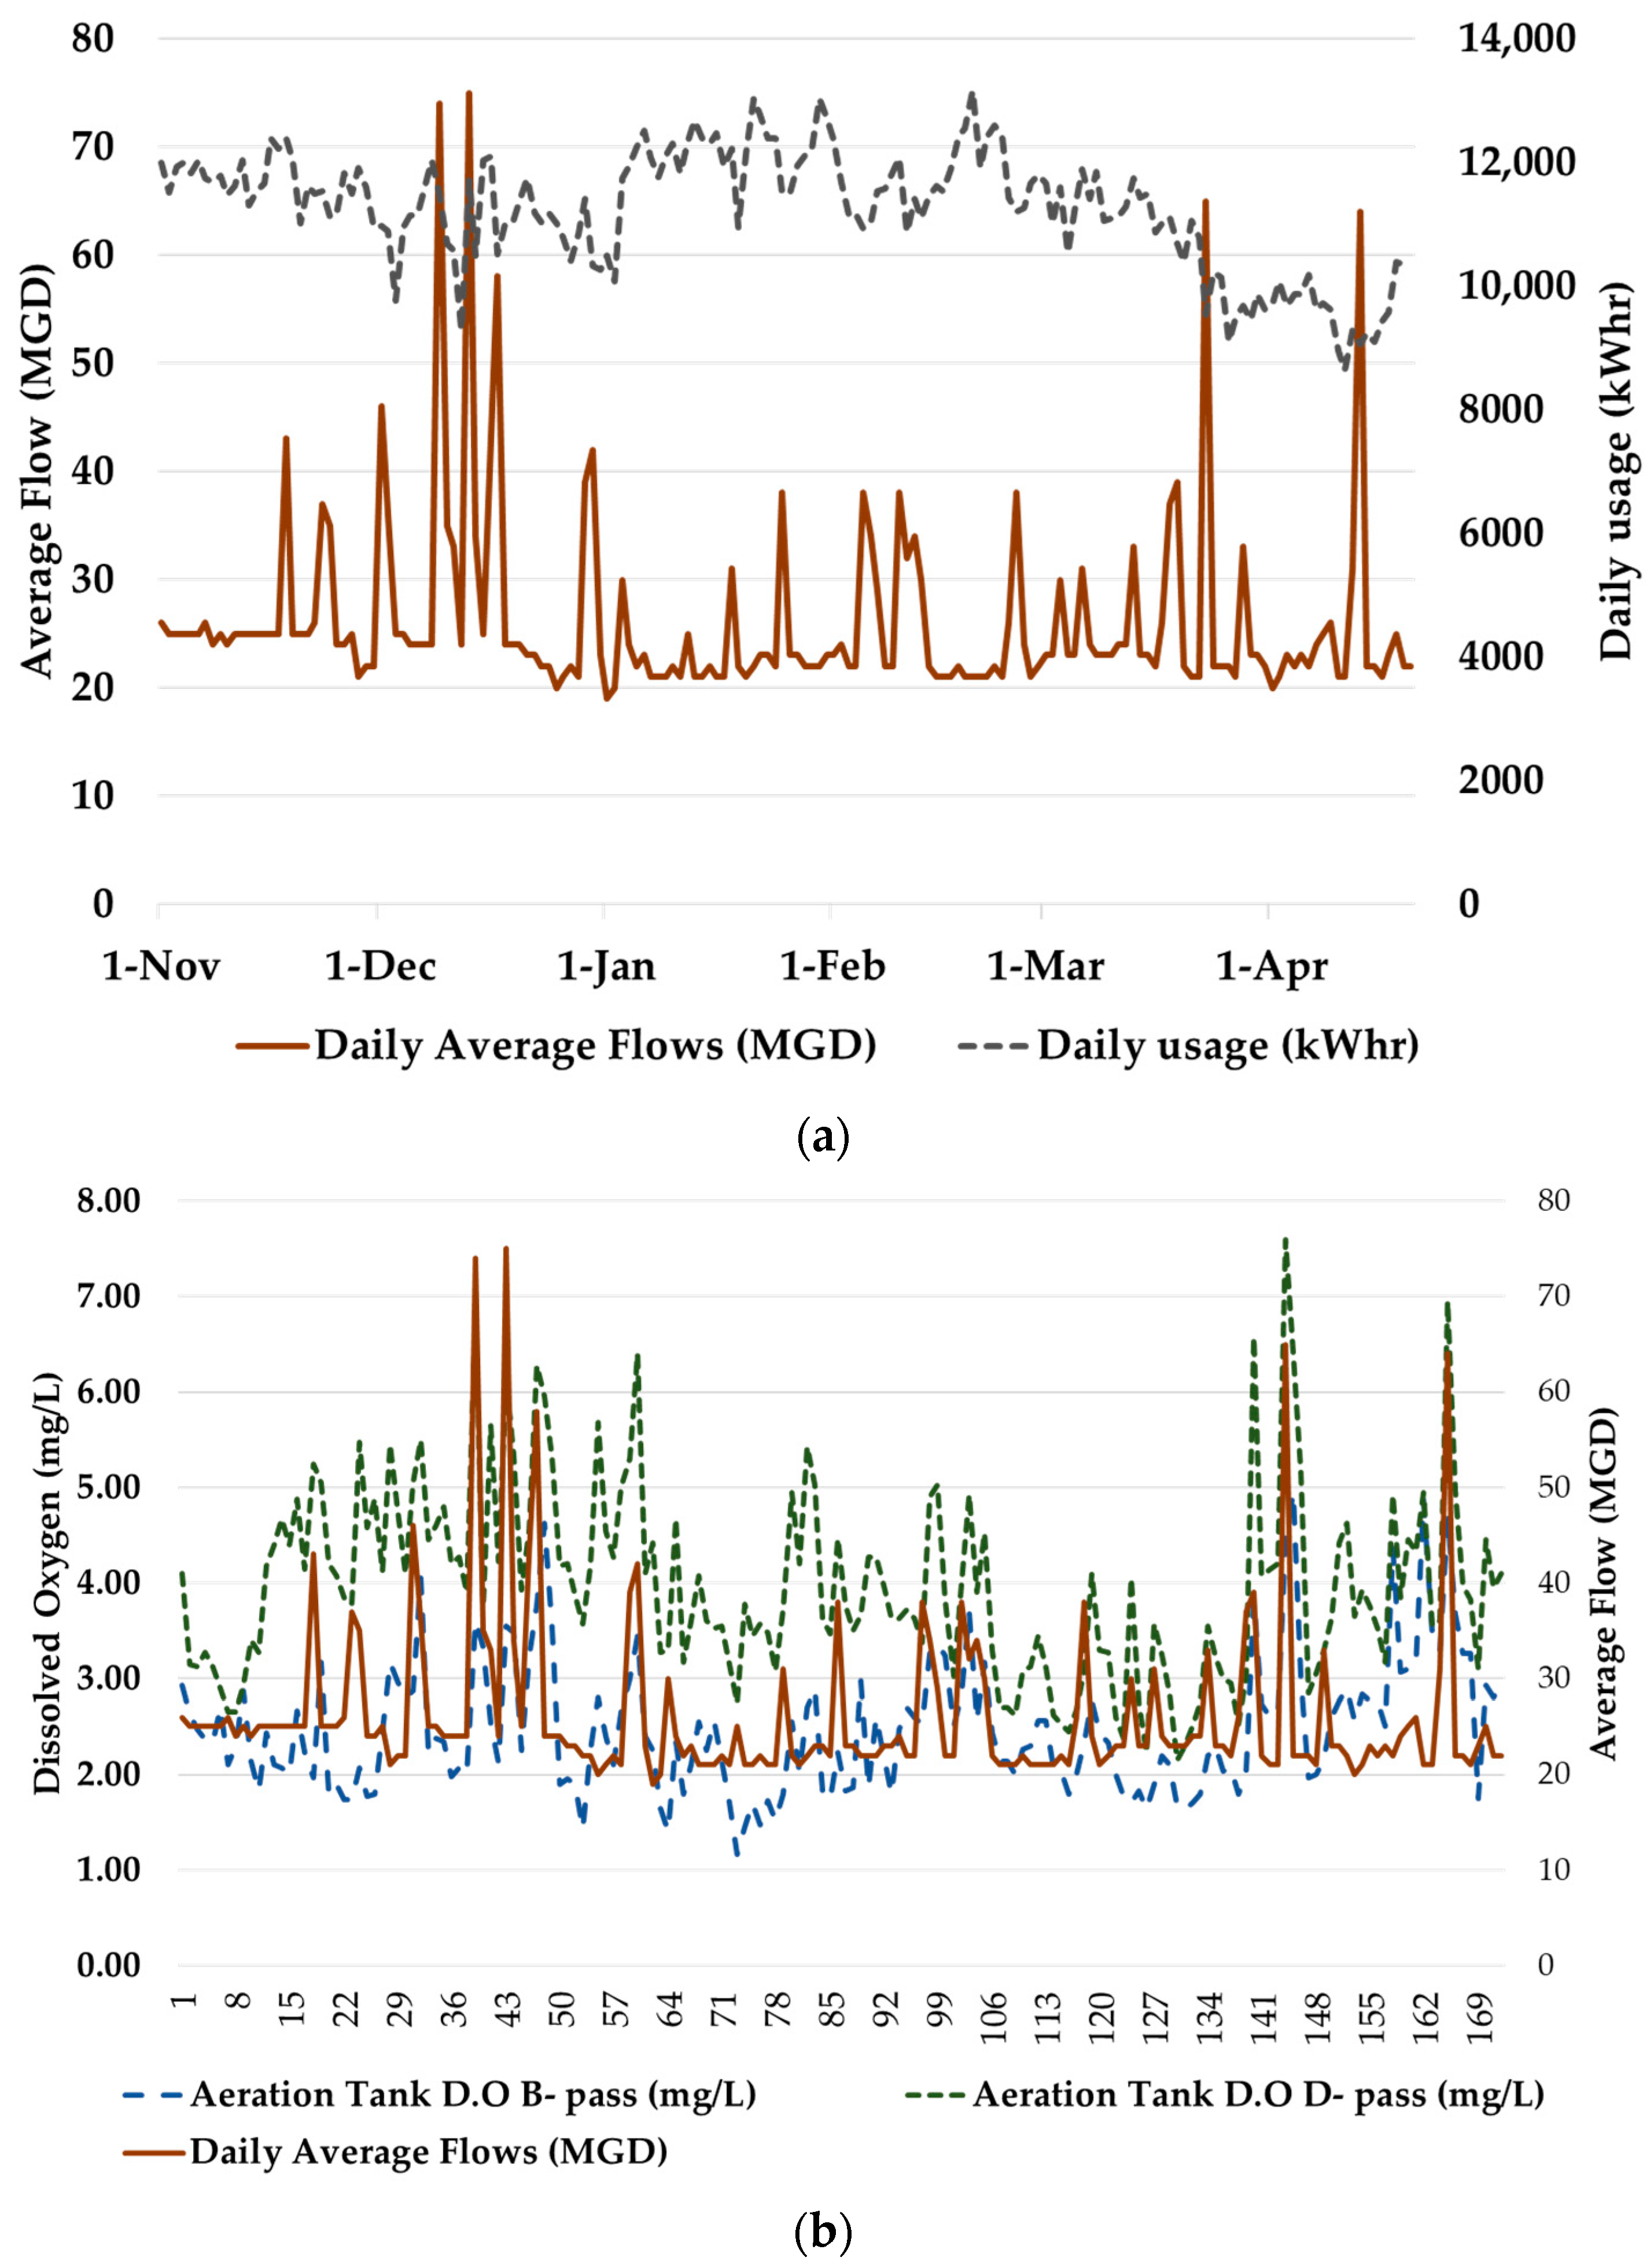
Monitor DO level: The DO level depends on the time of day, organic loading, temperature, and the type of diffusers. Without proper automation, it may take half an hour or more for the DO to be reduced to zero. To make process improvements and save money, fine-tuning aeration (maintaining proper DO levels) is necessary. In automatic systems, DO in each aeration tank is measured using sensors installed at each pass (aeration tanks are divided into four passes) periodically at, for instance, 15 min intervals. The data from the DO sensors are delivered to modulating valves, by which the amount of air that is blown into the aeration basin is controlled. A DO setpoint is programmed into the DO sensors, and once the DO levels rise above or drop below the setpoint, the amount of air injected into the basin is adjusted. In some WRRFs, the DO sensors are not connected to modulating valves and operators must manually control the blower output based on DO readings. Having an automatic system increases the accuracy of this control and the overall efficiency of the WRRF;
(2)
Adding a denitrification step: Adding a denitrification step may save energy and chemicals and benefit the environment. The nitrification process consumes a lot of energy through aeration and consumes alkalinity. On the other hand, denitrification occurs under anoxic conditions. By decreasing the DO, nitrate is further reduced to nitrogen gas;
(3)
Trained operators: There are some important considerations in the operation stage in terms of the successful implementation of energy efficiency measures;
(4)
Manual control system: WWTPs with manual controlling systems consume more energy. On the other hand, energy-efficient motors and variable frequency drives (VFDs) used by online DO analyzers and installation and maintenance equipment save cost;
(5)
Materials and methods: When designing an aeration tank, the key points may be listed as follows: to provide low DO in aeration tanks, to provide less mixing intensity, or to use fine- or micro-bubble aeration diffusers. The usage of fine-/micro-bubble diffusers or enhancing tank depth will increase the solubility of gases.
Energy consumption in WWTPs is directly related to wastewater and pollution loads (i.e., how polluted the water is). Highly polluted water, namely high chemical oxygen demand value, which is a pollution control parameter, may consume high amounts of energy in order to catch up with water discharge standards/permit. Some factors help improve the energy efficiency of WRRFs.
Equipment and process control measures: The process and the selection of appropriate equipment play a major role in energy efficiency in WRRFs. Equipment and process control measures can also be divided into subcategories: bubble aeration instead of surface aeration, on–off air online monitoring, sludge age reduction (by decreasing the sludge age of the system, the sludge stabilization will be reduced in the aeration tankless; the amount of excess sludge will also be decreased), and short-circuit nitrification. (This is based on partial oxidation of ammonia to nitrite only, which in turn can be reduced to N2. Additionally, operating an aeration tank at low DO conditions for partial nitrification for energy saving also eliminates the extra oxygen requirement for nitrite oxidation. Thus, a substantial amount of energy consumption will be prevented.)
Regular control and maintenance: The installation of proper control devices on the blowers and/or efficient blowers could decrease the energy demand. Routine diffuser cleaning can reduce average power costs by 18%, and various equalization alternatives can reduce power costs by 6–16%.
Oxygen transfer efficiency (OTE): The oxygen transfer efficiency of aerators is expressed as pounds of oxygen per horsepower-hour. The mass of oxygen transferred per unit of power input is the most important efficiency parameter when considering an aerator. It expresses the amount of energy required to treat the wastewater. This energy is usually 60% or more of the total energy cost to treat water. So, it is imperative to use an aerator that minimizes energy costs. The transfer efficiency normally is calculated from empirical data obtained in a lab or field setting. Various factors such as contaminants in the water can affect the actual transfer efficiency. For this reason, the test to determine efficiency is normally conducted in a lab setting in clean water.
Disinfection is the final stage of treatment. As wastewater contains microorganisms and pathogens that can cause human diseases, it must undergo a process to kill or deactivate these harmful organisms through a disinfection process. Chlorine (a chemical that can destroy cellular material), ozone (decomposes viruses and bacteria to oxygen via exposure to high voltages), and ultraviolet radiation (decreases the ability of survival of the microorganism by damaging its genetic material) are commonly used to disinfect. After 60 percent of the pollutants are removed from the secondary treatment and the water is disinfected, the remaining sludge is treated, producing biosolids, which are then disposed of or utilized for compost or fertilizer.

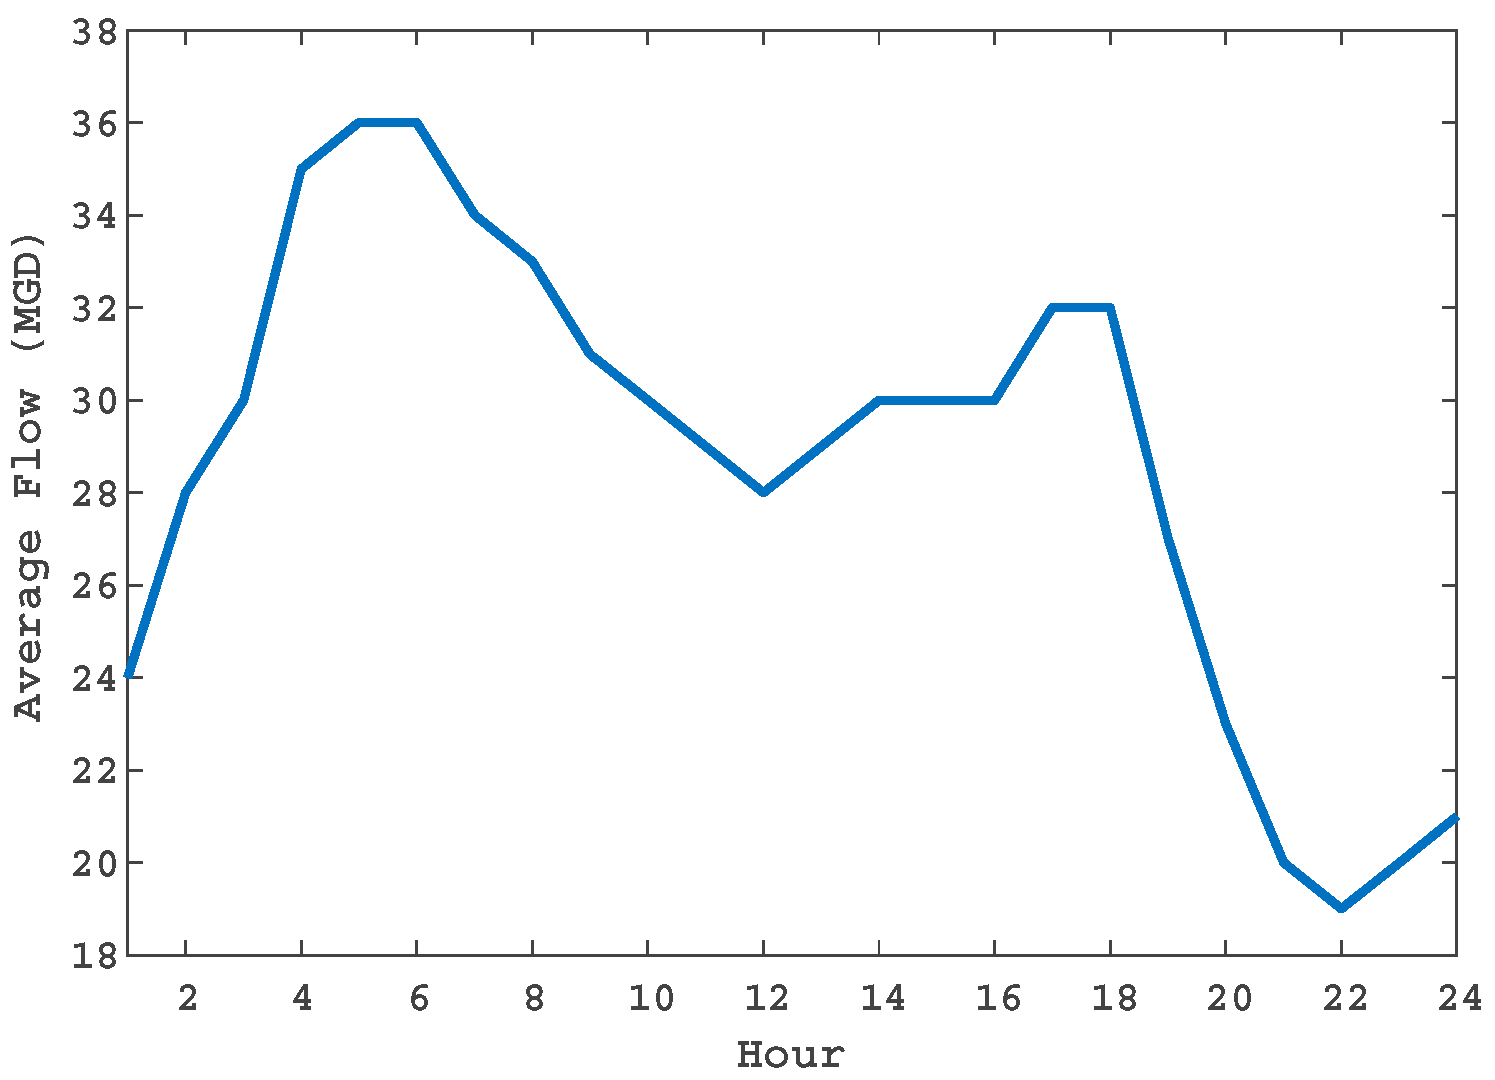
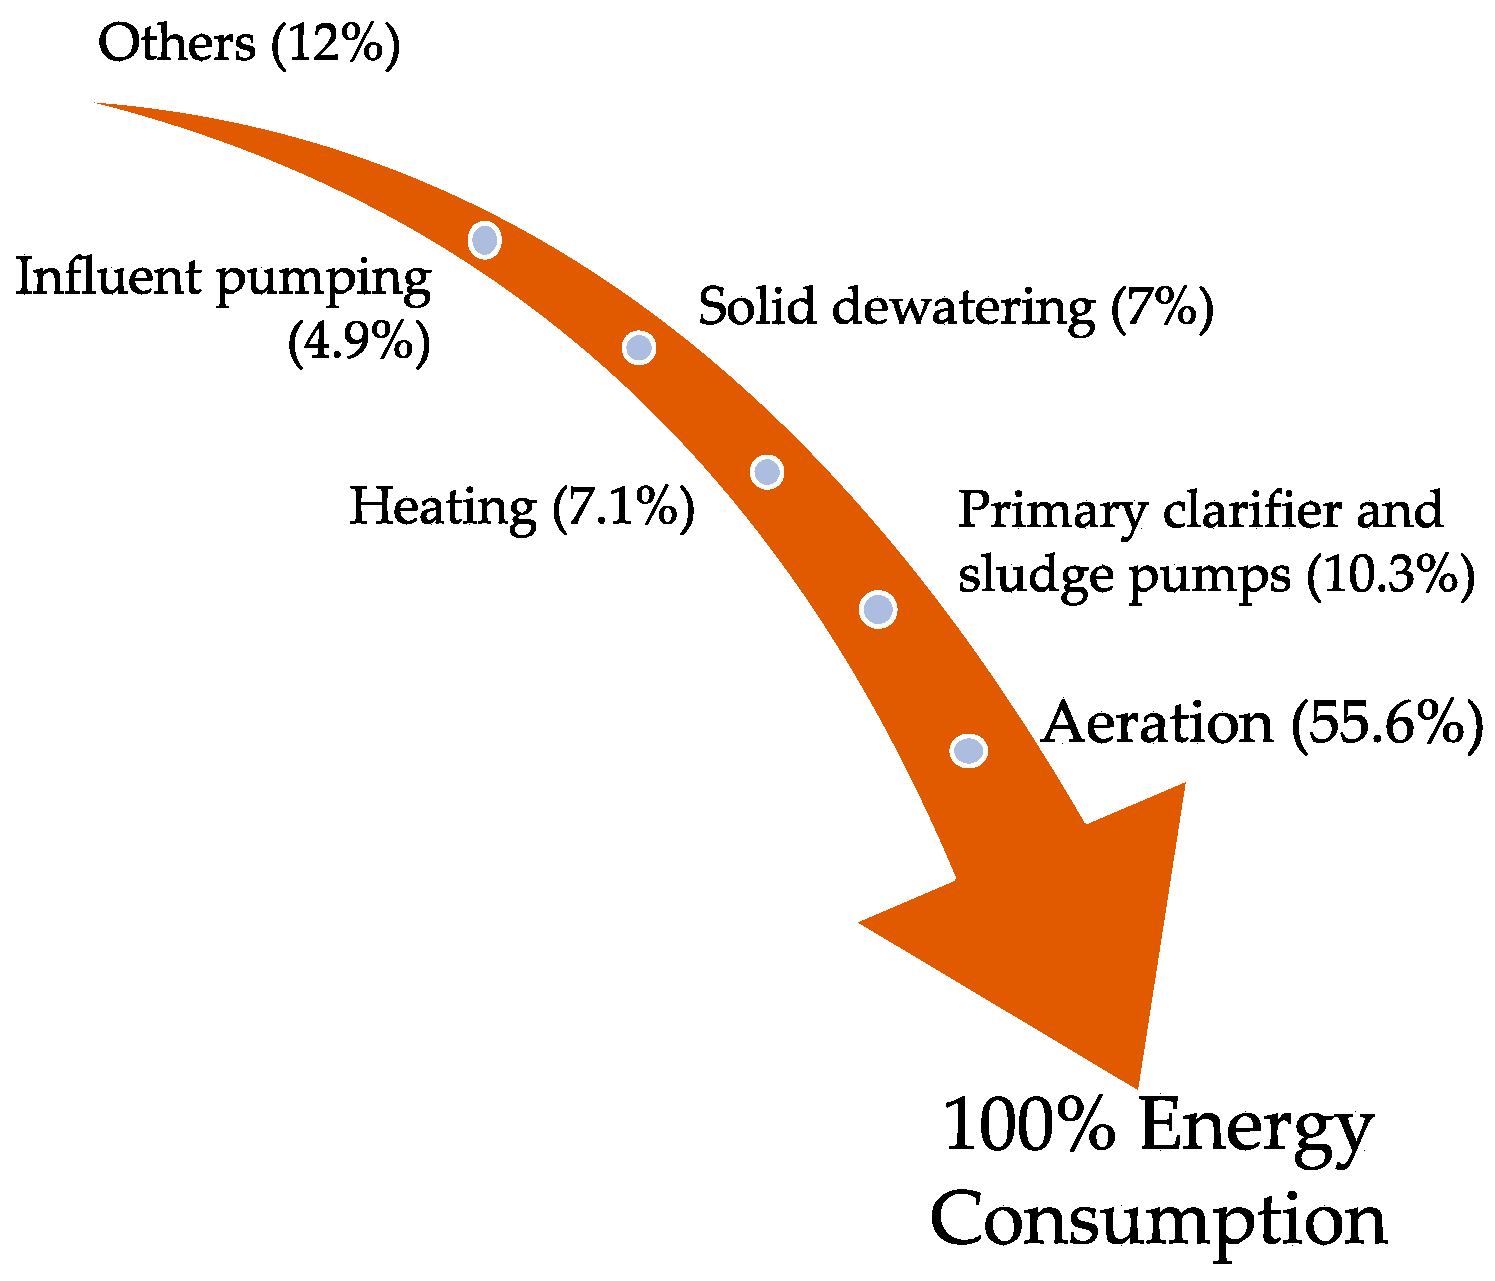
4.2. Power/Energy Assessment

After wastewater is collected at the waste well, it is pumped using main sewage pumps (MSPs) to start the treatment process. In the example WRRF under study, there are five MSPs (each of 400 HP). The design capacity (dry weather rating) of the WRRF is 60 million gallons per day (MGD), and the wet weather capacity (maximum capacity) is 120 MGD. During dry weather conditions, the daily average flow is about 28 MGD, and only one MSP is required (as each MSP can pump up to 30 MGD). During wet weather, at a peak flow of 120 MGD, four MSPs are used and one MSP is on standby.
As can be seen in Figure 4, the power is received through multiple independent fully rated feeders. For reliability, each of these feeders is capable of supplying the entire plant. The black and red lines refer to the 4.16 kV and 480 V levels, respectively. The green color is for the solar power and the blue color is for the incoming medium voltage infeed. Service transformers (5 MVA in this case) reduce the incoming service voltage to a 4.16 kV level for utilization at the plant. The three 4.16 kV buses are interconnected by means of a sync-transfer bus. Emergency generators switchgear (two gas turbine units at 1600 kW) are also connected to the same sync-transfer switch. The gas turbine (fuel-oil-fired) constitutes an emergency source of power for the plant should all three feeders become de-energized. Utility feeders must be de-energized by opening all three main, 26.4 kV circuit breakers before the emergency generator circuit breakers are allowed to close.
Large loads including MSPs (400 HP) and main process air blowers (four 700 HP units) are connected to the 4.16 kV buses. The main pumps are equipped with slip recovery systems for speed control and adjustment. Rotor circuit resistors are provided for the main pump motors to limit the starting in-rush current. Air-magnetic type circuit breakers protect the 4.16 kV power cable feeders, connecting the high-voltage switchgear lineups to the plant unit substations. There are three double-ended unit substations at the plant. Each substation consists of two 5 kV disconnect switches, two fully rated transformers, and a lineup of 480 V air circuit breakers.
Dry-type substation transformers reduce the 4.16 kV distribution voltage to 480 V for use in the plant’s motor control centers and distribution panels. Each unit substation transformer is fully rated and is capable of powering all equipment connected to the entire substation. The 480 V section of each unit substation consists of air-type circuit breakers that protect the 480 V power cable feeders connecting 480 V motor control centers, distribution panels, and the 480 V generator switchgear with the unit sub01stations. Even though the overall power capacity of MSPs and that of aerators are comparable, most of the energy (~50−70%) is consumed by aerators in the aeration tanks (see Figure 5 and Table 2). Small-scale DERs can be integrated into the 480 V buses; whereas, larger units can be integrated into the 4.16 kV ones.
Energy consumption at WRRFs is largely related to the incoming flow of wastewater (influent). The influent is fairly consistent except during wet weather (i.e., rainy and snowy days), as can be seen in Figure 6. This means that guaranteeing a certain level of demand reduction at WRRF community microgrids is possible since its load is fairly predictable, except during wet weather. Including an input from weather forecast can play a role in optimizing DER dispatch.
Anaerobic digesters break down organic materials in sludge without the presence of oxygen. During this process, anaerobic bacteria consume the organic matter and convert them into water and a biogas consisting of methane and carbon dioxide. This biogas can be used directly by power gas engines to produce electricity, which makes anaerobic digestion a widely used source of renewable energy to generate electricity and heat. Anaerobic digestion has the ability to reuse waste and produce electric power. If the WRRF is capable of storing the biogas, it is possible to use the electricity generated by power gas engines with biogas as a power source within the community microgrid. This feature is currently underutilized in NYC (see Figure 7).
Since aeration tanks are the largest consumers of energy, it is important to further understand their consumption behavior. Figure 8a shows that the energy consumption of aerators slightly decreases during wet weather (observed with spikes in the influent). However, the energy consumed by other components overweighs this reduction and the overall energy consumption of the WRRF increases during wet weather. The digesters of the wastewater treatment facility under study have multiple passes (to control the waste amounts), with the B-pass and D-pass being utilized under normal operating conditions. The reduction in kWh consumption of aerators during wet weather is attributed to the higher dissolved oxygen level naturally embodied in rainwater (see Figure 8b).

5. Case Study Results and Discussion

5.1. Distribution Network Assessment

The proposed network assessment follows the block diagram of Figure 9. Facilities and buildings identified by their geographic coordinates must be mapped to their respective nodes (i.e., buses) in the distribution network. The load flow runs recursively with different load/generation scenarios, considering in each run the impacts on local feeders as well as the rest of the network. Feasible solutions are registered feeders within distribution networks may be extended radially. Analyzing radial feeders is relatively easy since varying loads downstream affect the feeders in a directly proportional manner. Analyzing networked/mesh is more challenging since the impact of load variations on feeder loading cannot be intuitively evaluated.
In this section, we present the concept of distribution network assessment using a mesh IEEE 30-bus standard test system and a real area in NYC.

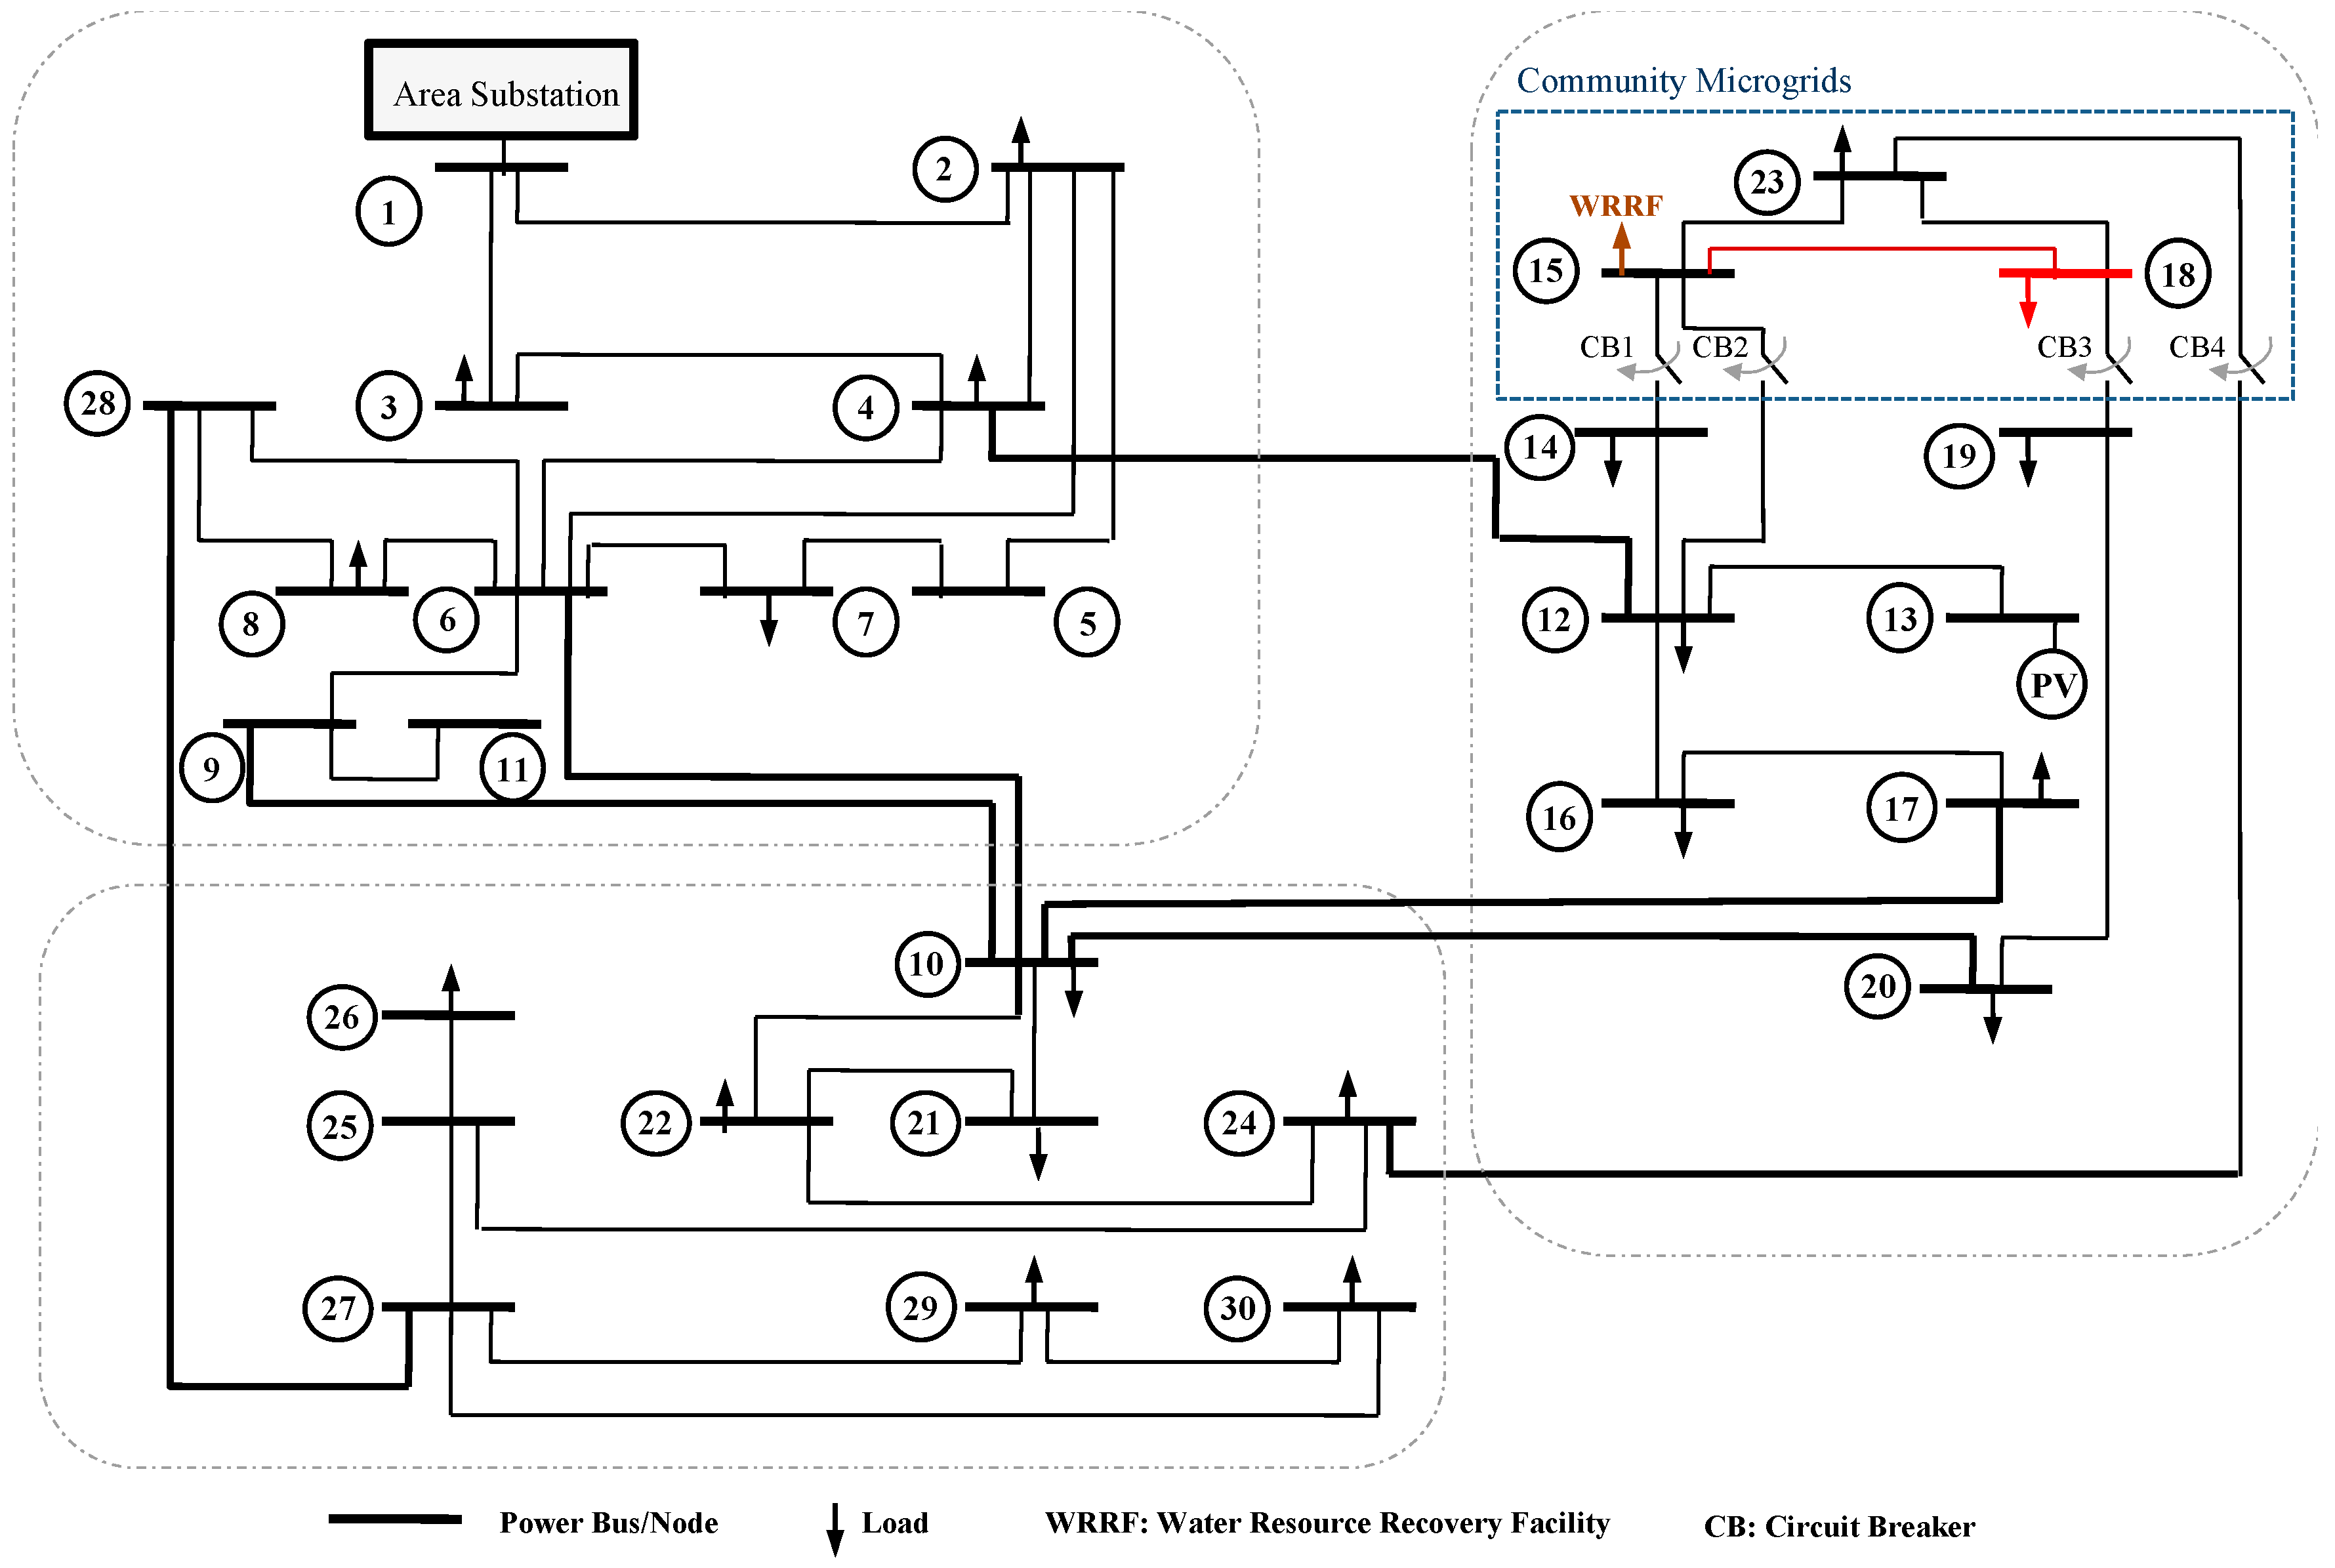
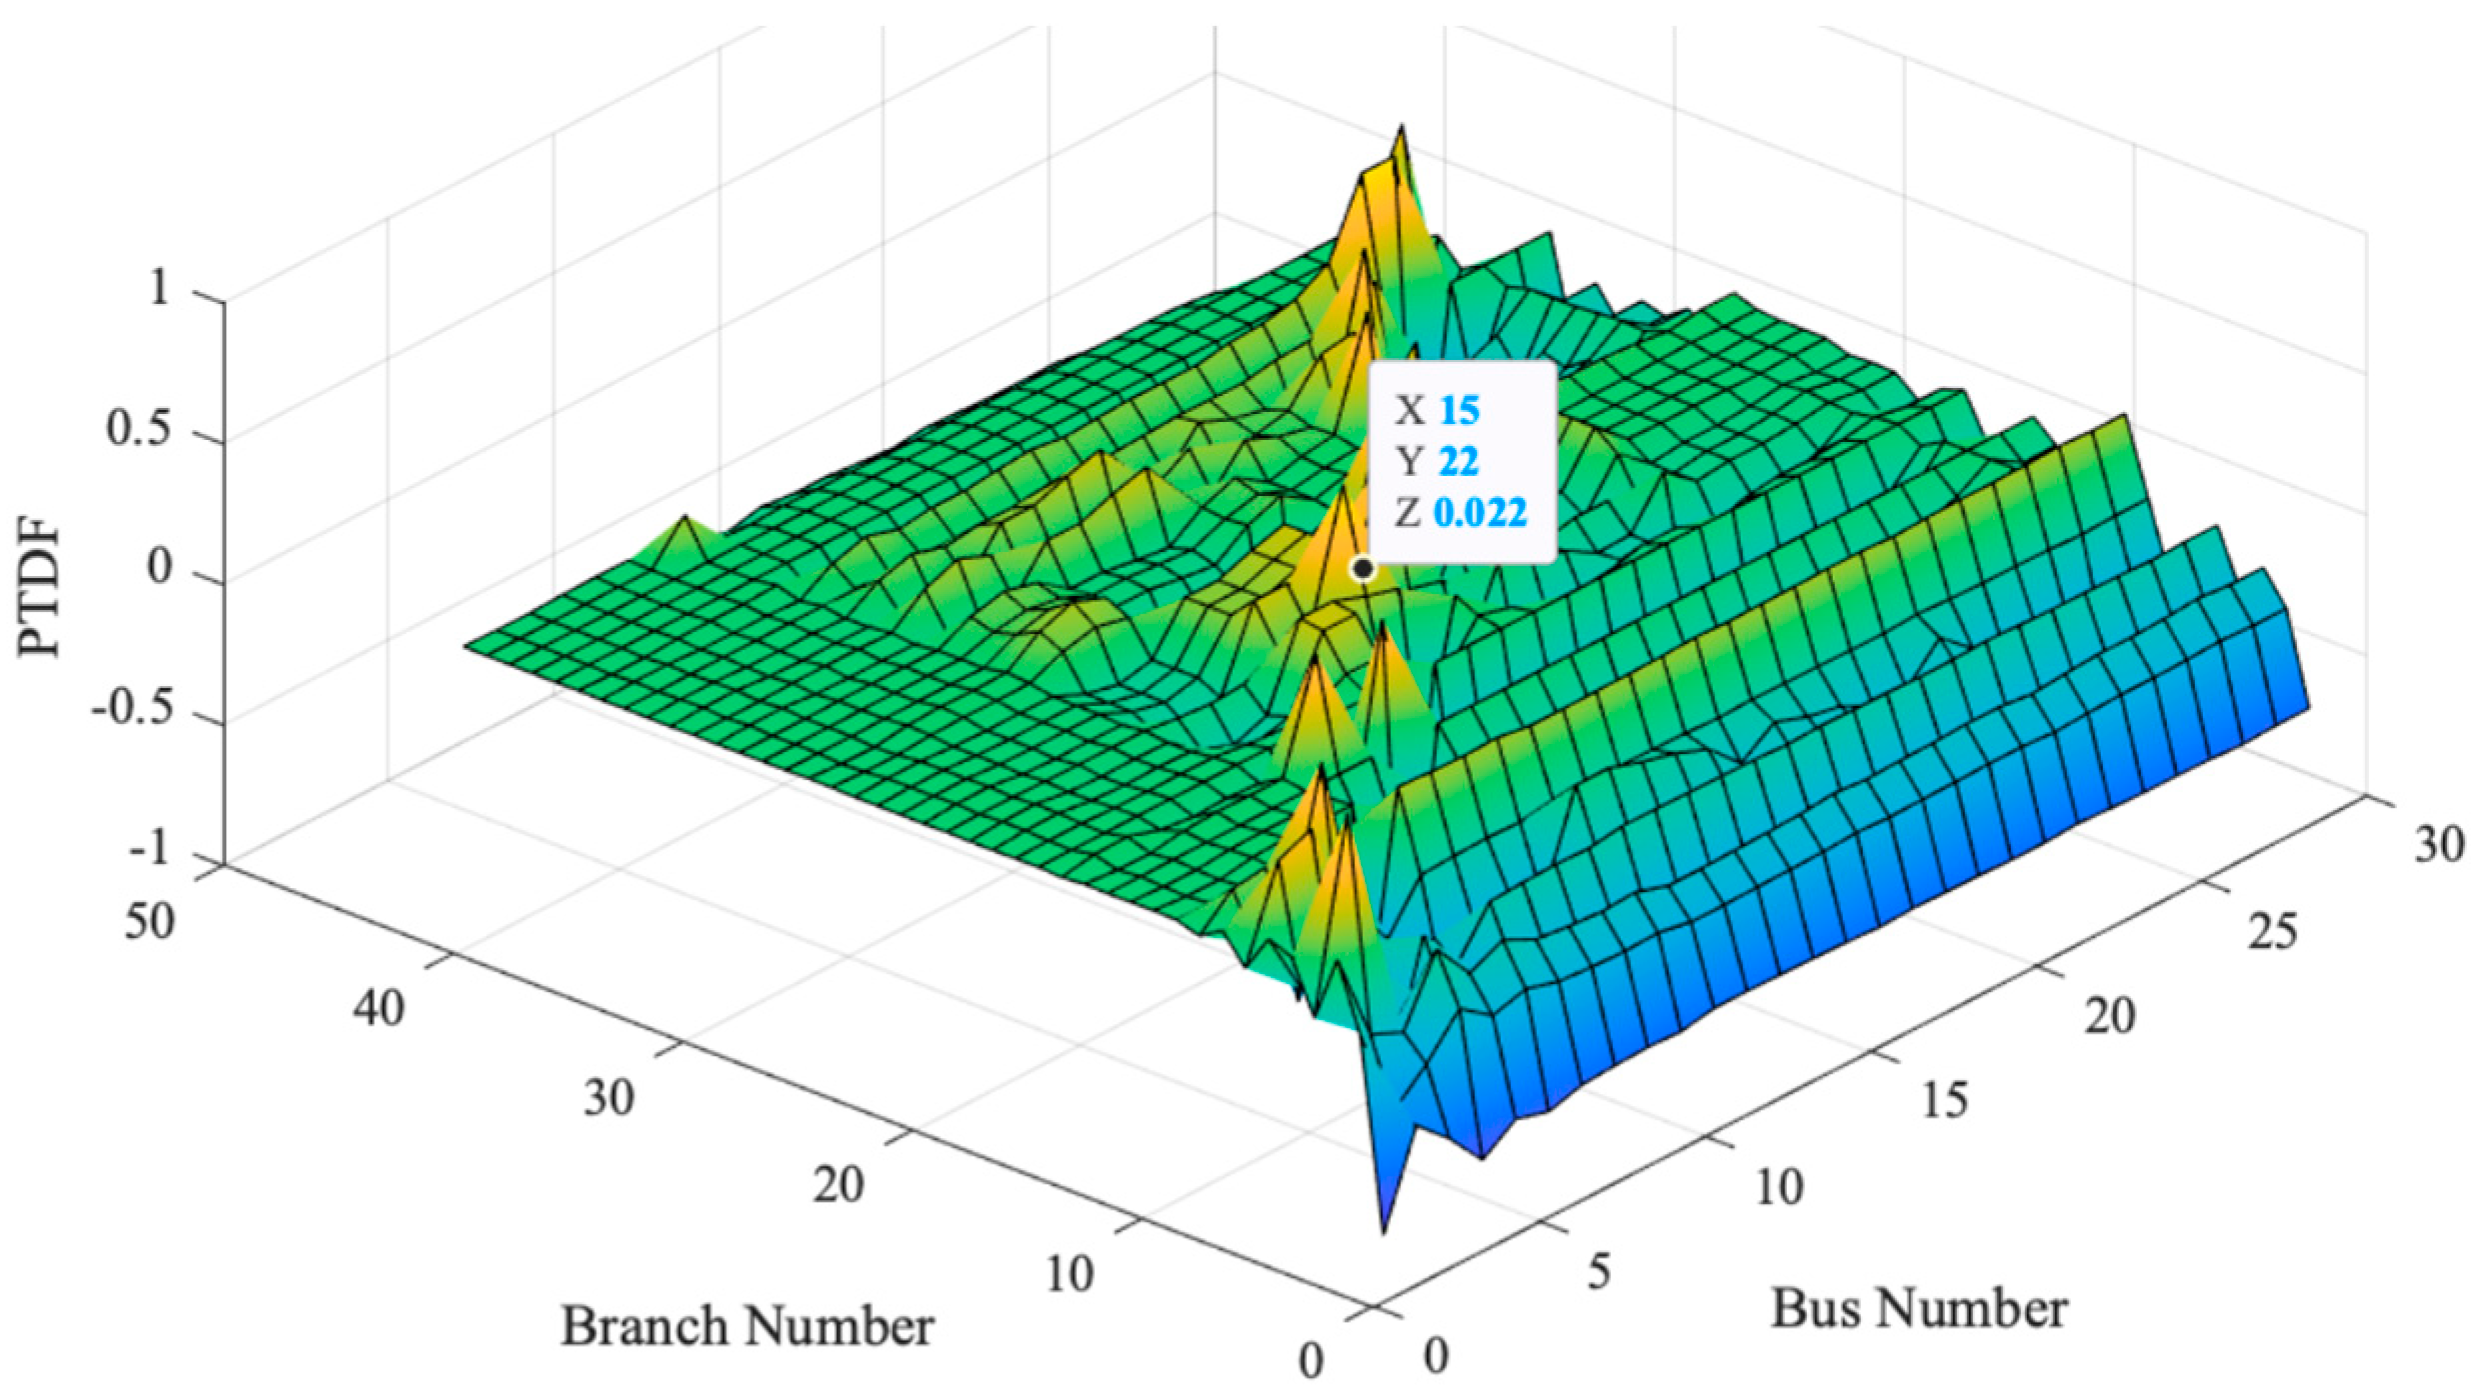
5.1.1. IEEE Standard Test Feeder

In this case study, the WRRF is connected at bus 15 (see Figure 10). Details about the load flow and loads of this distribution network are presented in Appendix A. The loads at buses 15, 18, and 23 are 6 MW/1 MVAr, 4.8 MW/2.4 MVAr, and 3.2 MW/1.6 MVAr, respectively. In this case, the maximum line loading is about 72%. When the load at bus 18 (highlighted with the red color) doubles to 9.6 MW/4.8 MVAr, the loading of branch 22, between buses 15 and 18, reaches a critical loading level exceeding 91% (see Figure 11).
If a community microgrid involving buses 15, 18, and 23 is formed (assuming here that the community microgrid will be self-sufficient), infrastructure upgrade can be deferred and the maximum loading goes down to about 75% at branch 30, between buses 15 and 23. This community microgrid includes four PCCs, interfacing with the network through four circuit breakers (CBs).
Since in meshed networks, the load flow needs to be run to determine the flow of power following a load change, calculating power transfer distribution factors (PTDFs) can give an initial rough estimate. The PTDF is based on DC flow and hence it ignores reactive power. For instance, inspecting Figure 12, it can be seen that variations in bus 15 lead largely to impact branch 22. PTDFs can be used to know which buses should be targeted to reduce the demand at overloaded feeders.

5.1.2. The NYC Power Grid

Electricity delivery follows a hierarchical process that starts with generation at power plants, followed by transmission of the bulk power over long distances using transmission lines at high voltages (e.g., 345 kV, etc.). Near the customer end, within cities, substations receive the input power from high-voltage transmission lines and convert it to lower voltage levels (e.g., 13.8 kV, etc.) appropriate for distribution (typically referred to as the medium-voltage level). Each substation covers an “area” that may be further divided into underground “networks” or overhead “Loops”, which is fed by the same area substation to facilitate planning and operation. Multiple medium-voltage primary feeders extend from the area substation to geographically cover the service area. Large consumers of electricity (e.g., a subway supply system) may tap directly into the medium-voltage level as high-tension service customers. Small consumers receive the electricity through nearby transformers at their premises or from the larger distribution network/loop via a service takeoff, which further reduces the medium voltage to a low voltage appropriate for residential use. In urban areas, like the case in NYC, the feeders at the medium-voltage side (secondary feeders) are connected into a secondary mesh network for increased reliability.
Further details on the flow of electricity from generation to distribution in NYC are as follows:
  • Power is generated at power plants at 13.8 kV;
  • Using step-up transformers, the voltage is stepped up to transmission voltages of 345 kV, 500 kV, or 765 kV;
  • Electricity is then transferred over long distances to transmission substations or switching stations. At this point, the voltage is stepped down to sub-transmission voltages of 230 kV, 138 kV, or 69 kV;
  • It is then fed into area substations, which further step the voltage down to the distribution level. Depending on the area, the voltage can vary between 13.8 kV, 27 kV, and 33 kV;
  • At this point, electricity will flow through the distribution feeders emanating from the area substations. Depending on the area, these feeders can supply power to an underground network/mesh load or an overhead radial load;
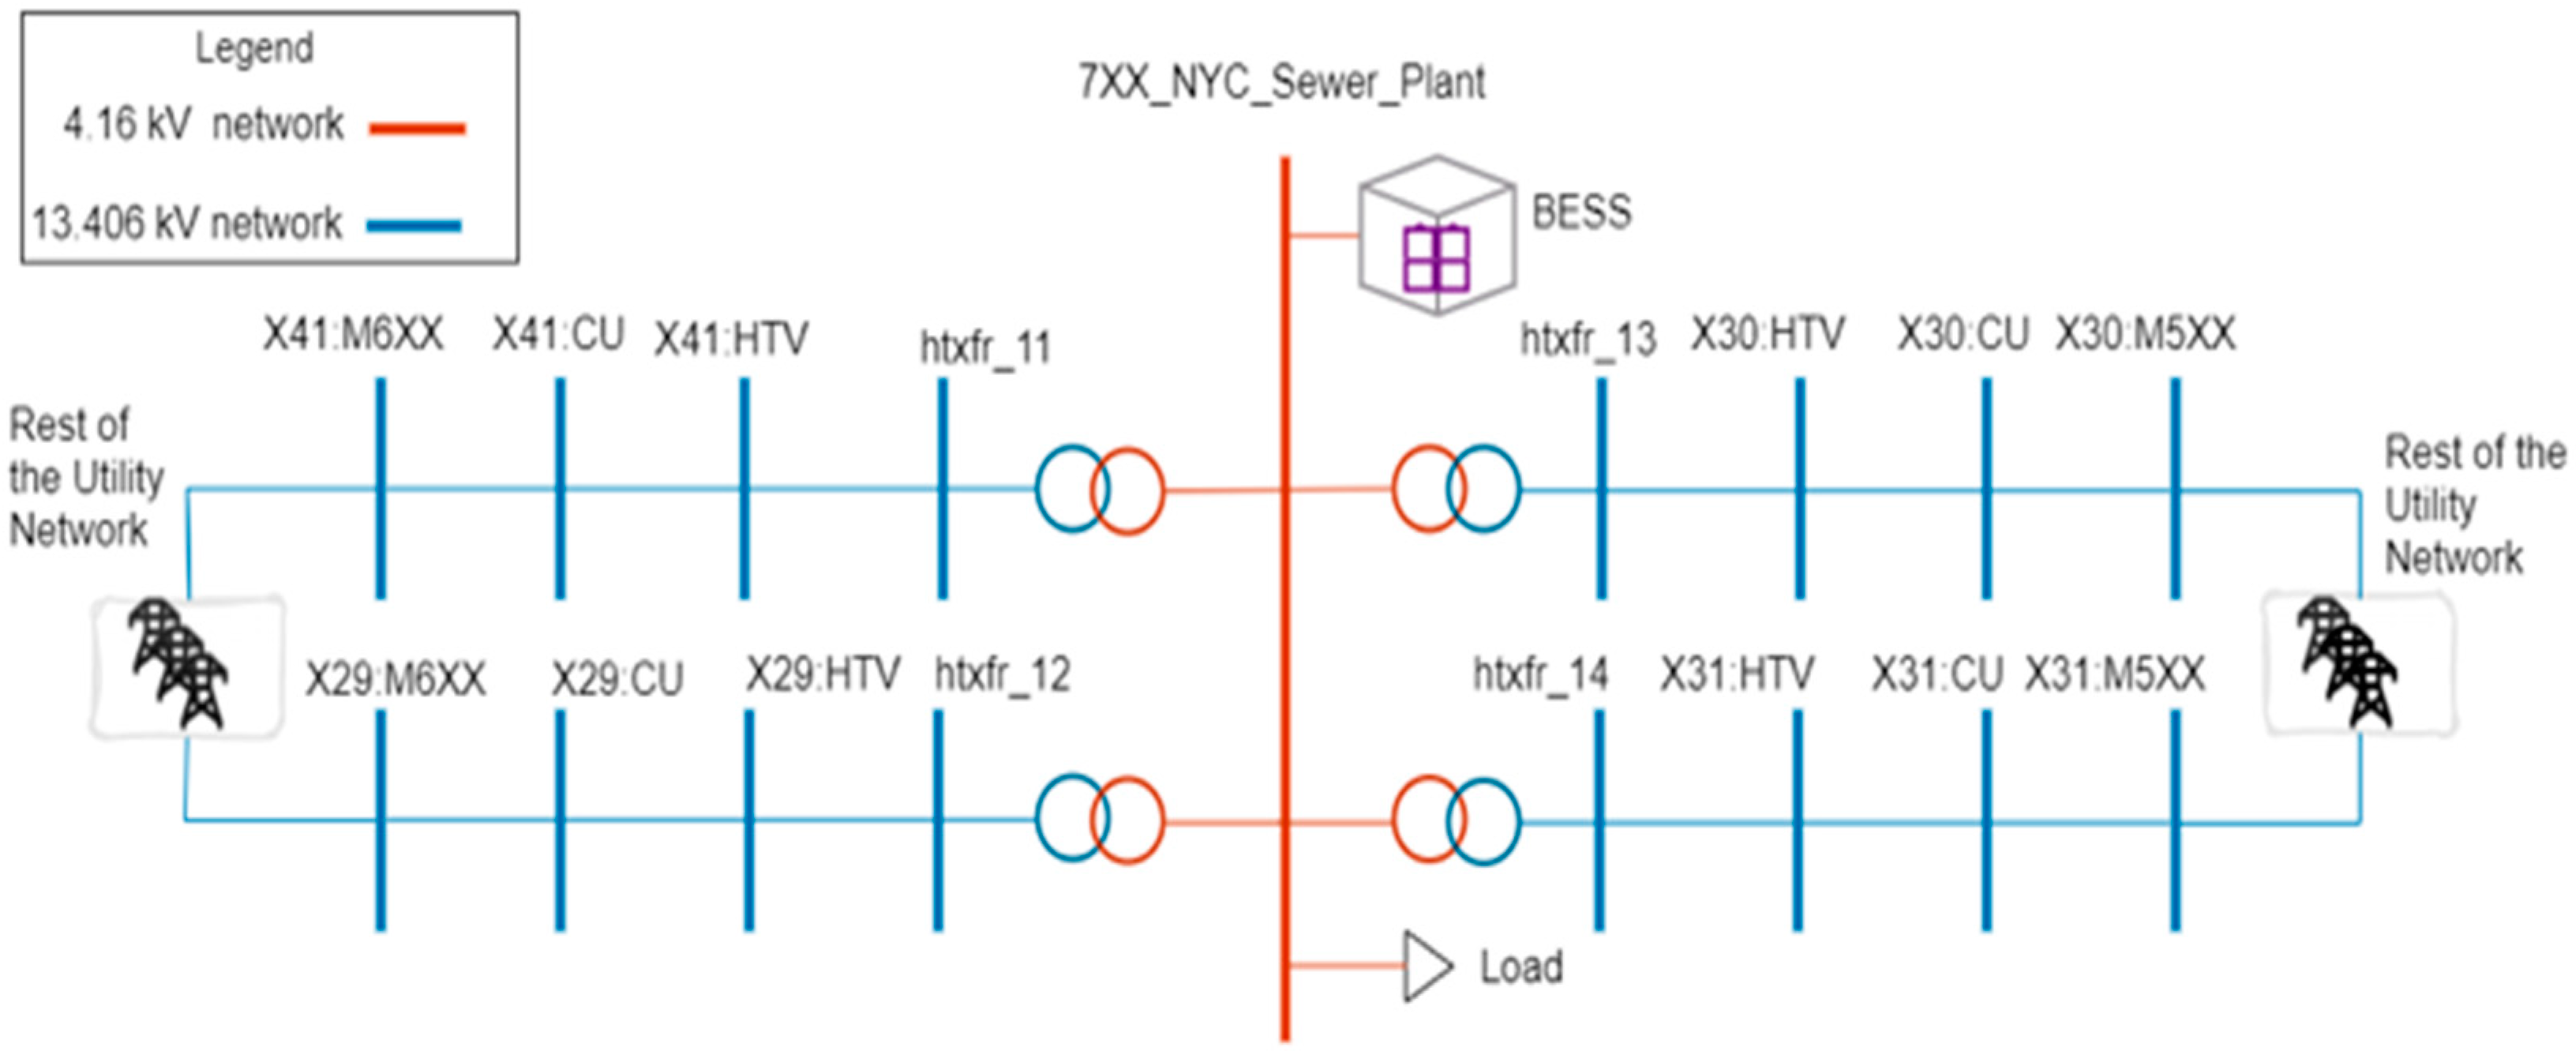
    In the underground mesh network, the feeders supply power to network transformers, which step the primary distribution voltage down to 120/208 V or, in the case of high-tension customers, 265/480 V.
In the overhead radial loop, the feeders generally supply power to 4 kV unit substations, which step down the voltage to 4 kV and then connect to overhead poles feeding 4 kV loops. As these loops get closer to customer loads, they are stepped down via pole-top transformers to 120/208 V.

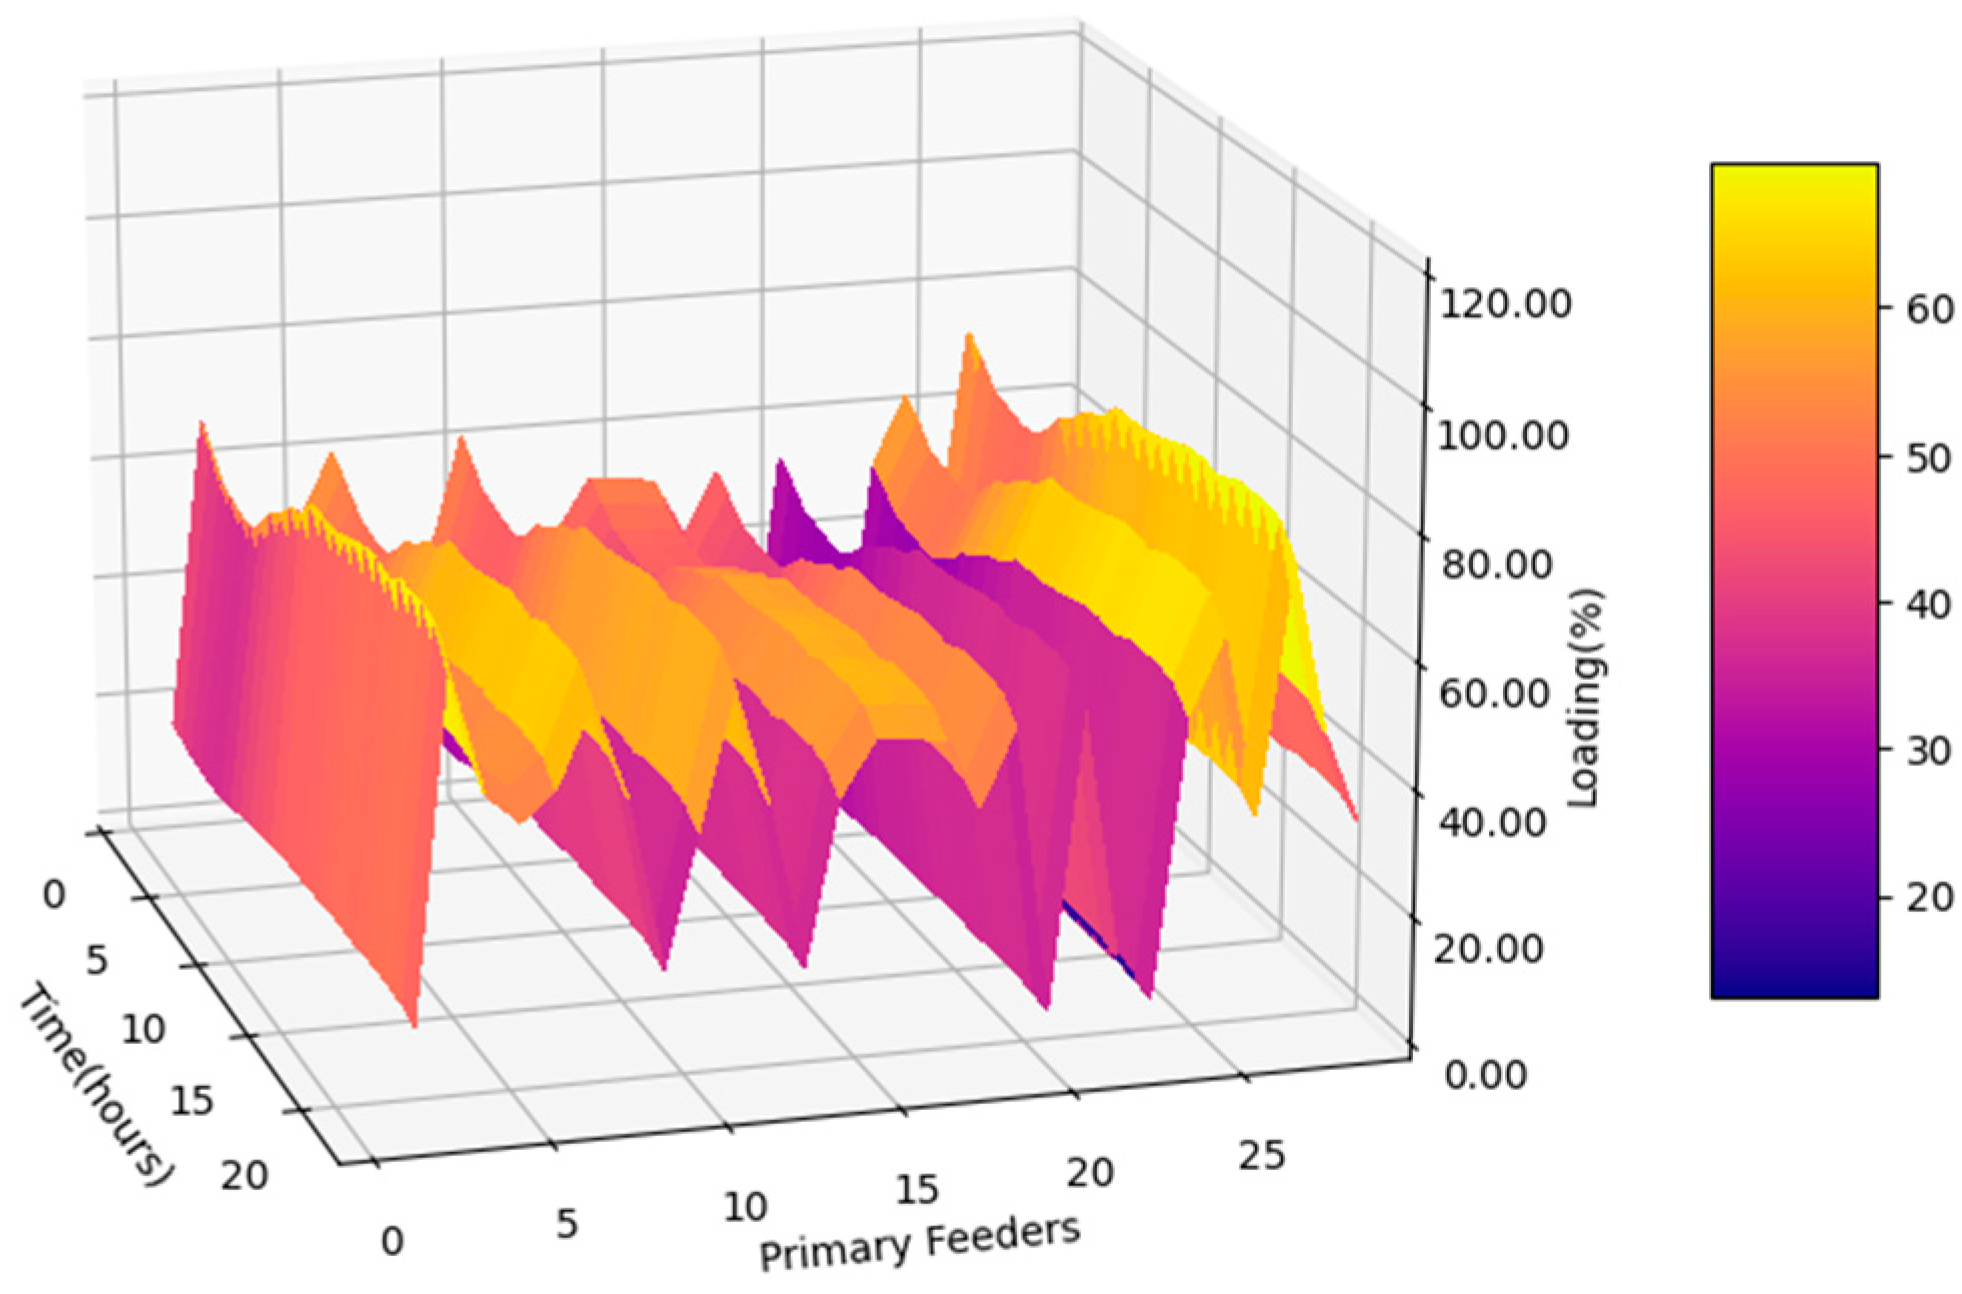
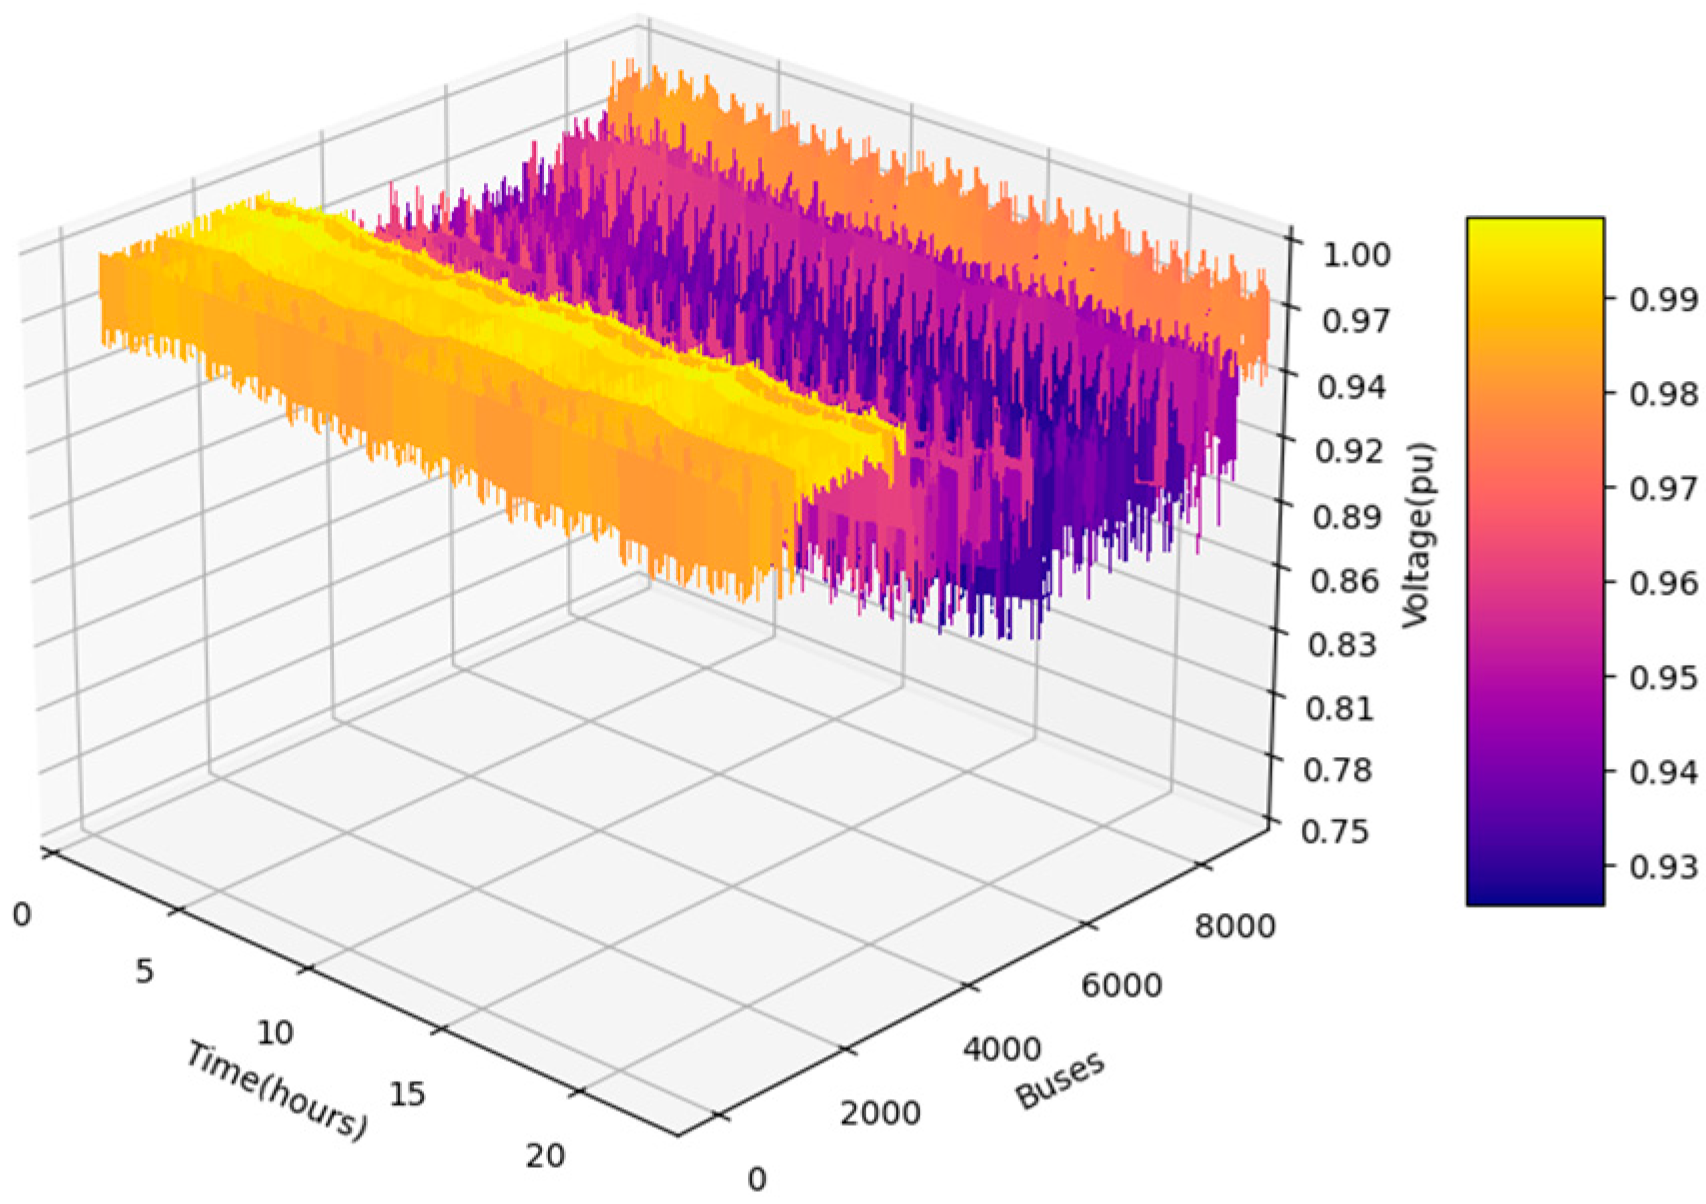
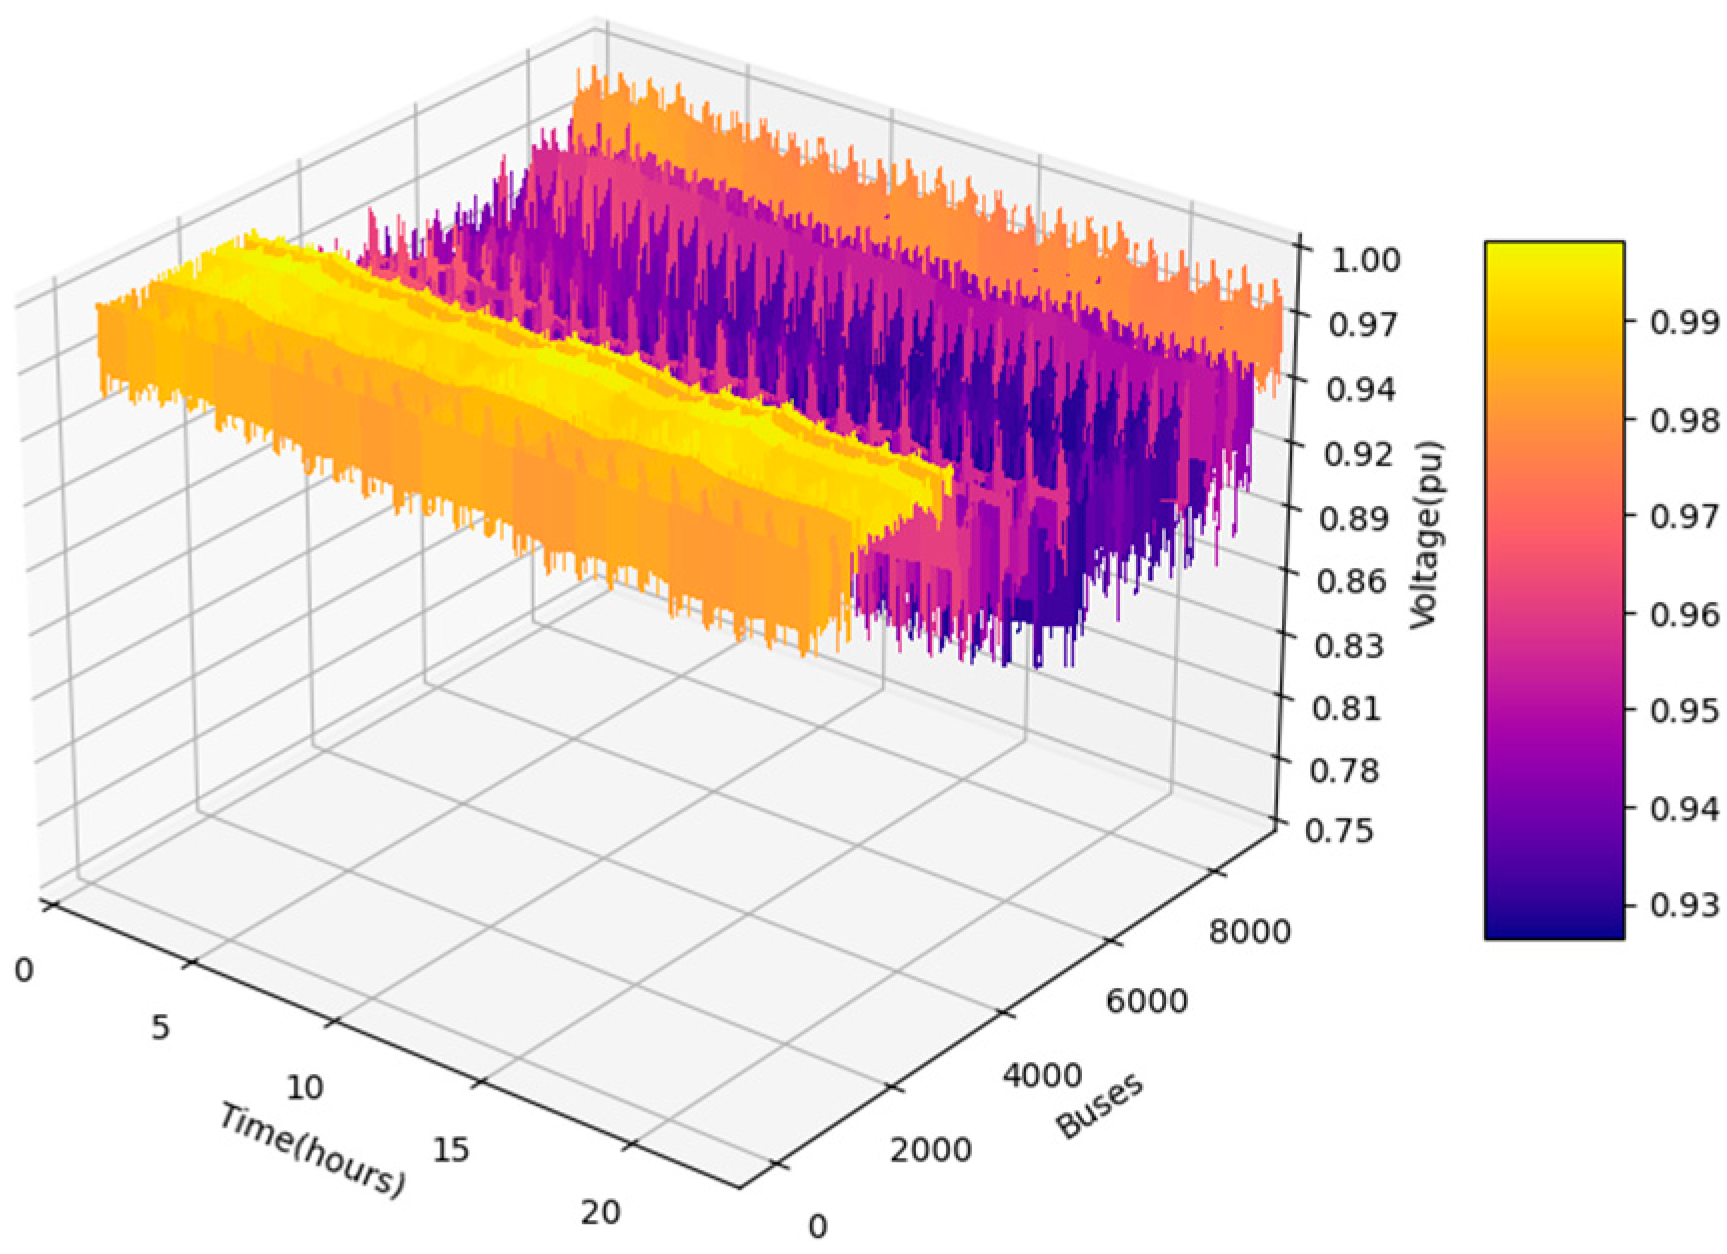
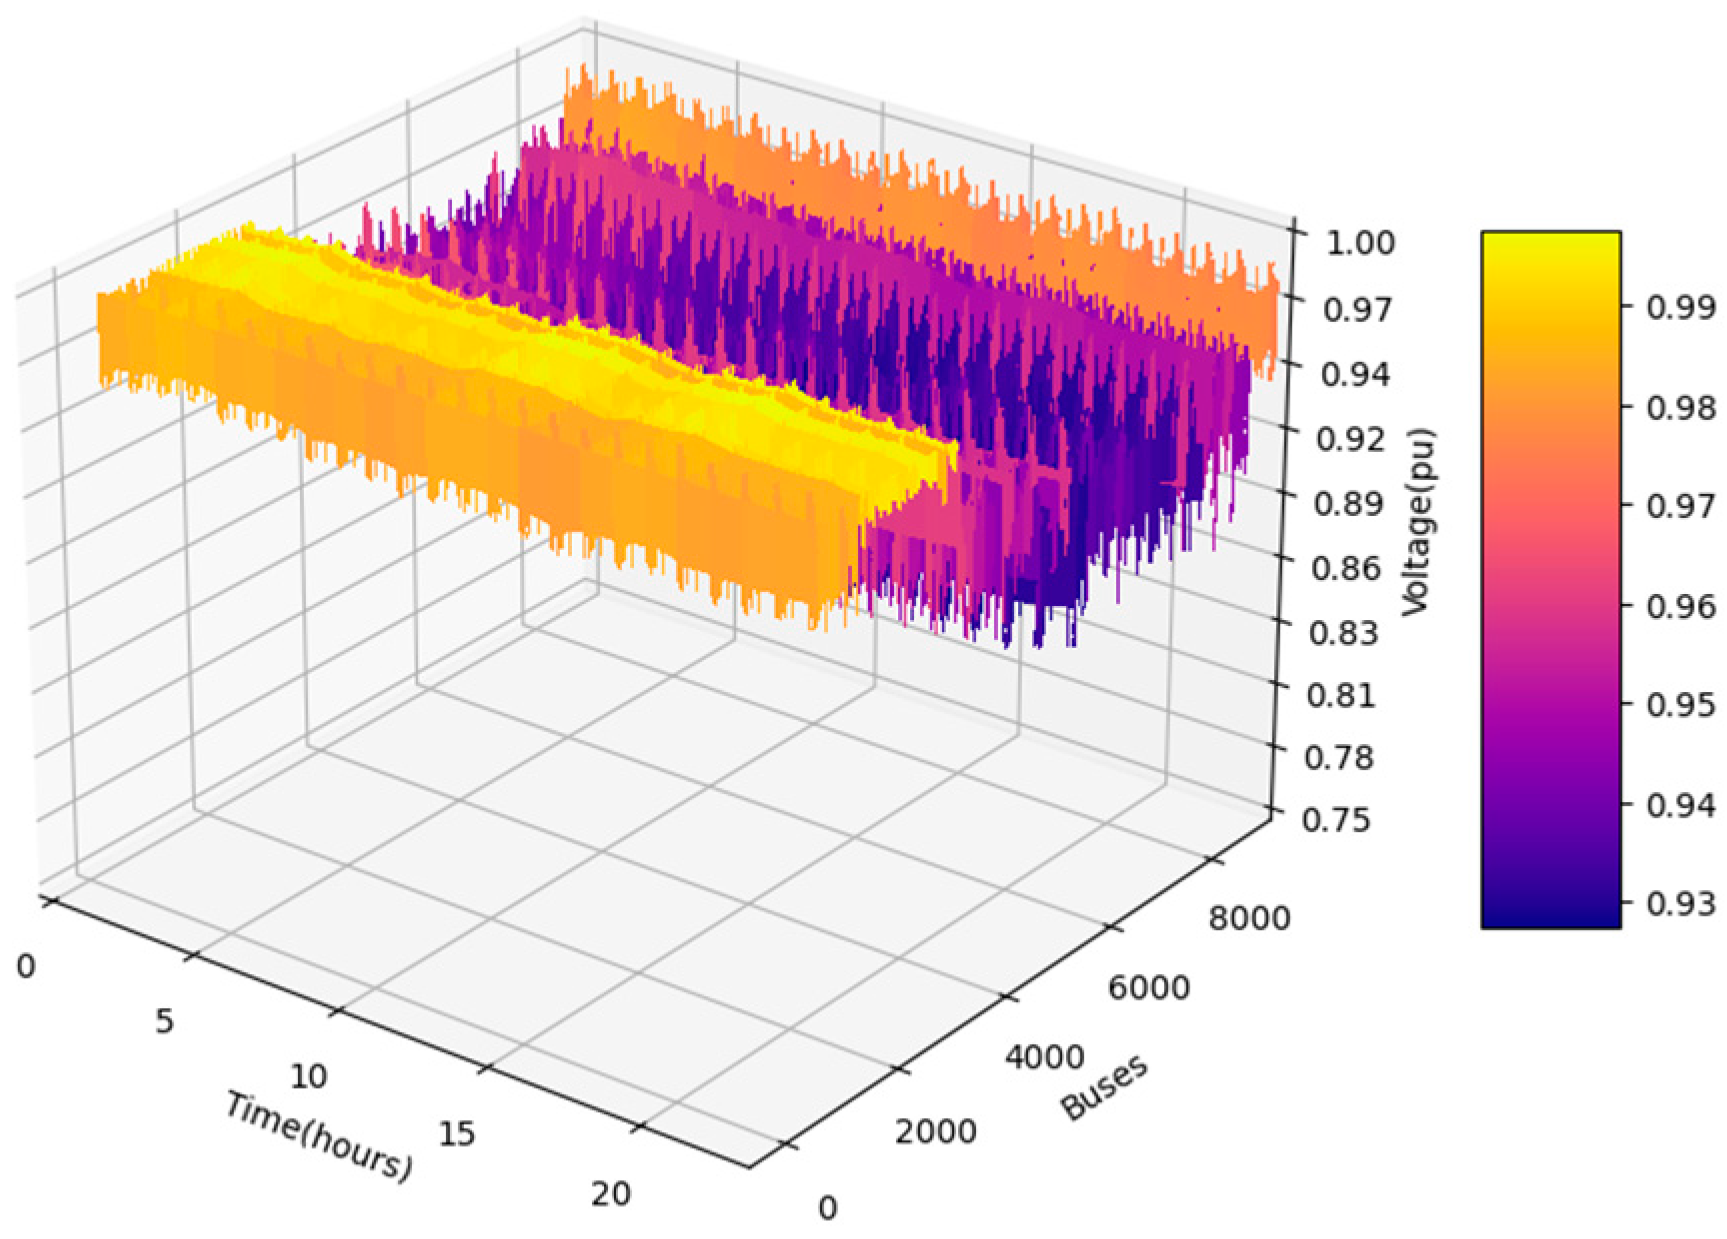
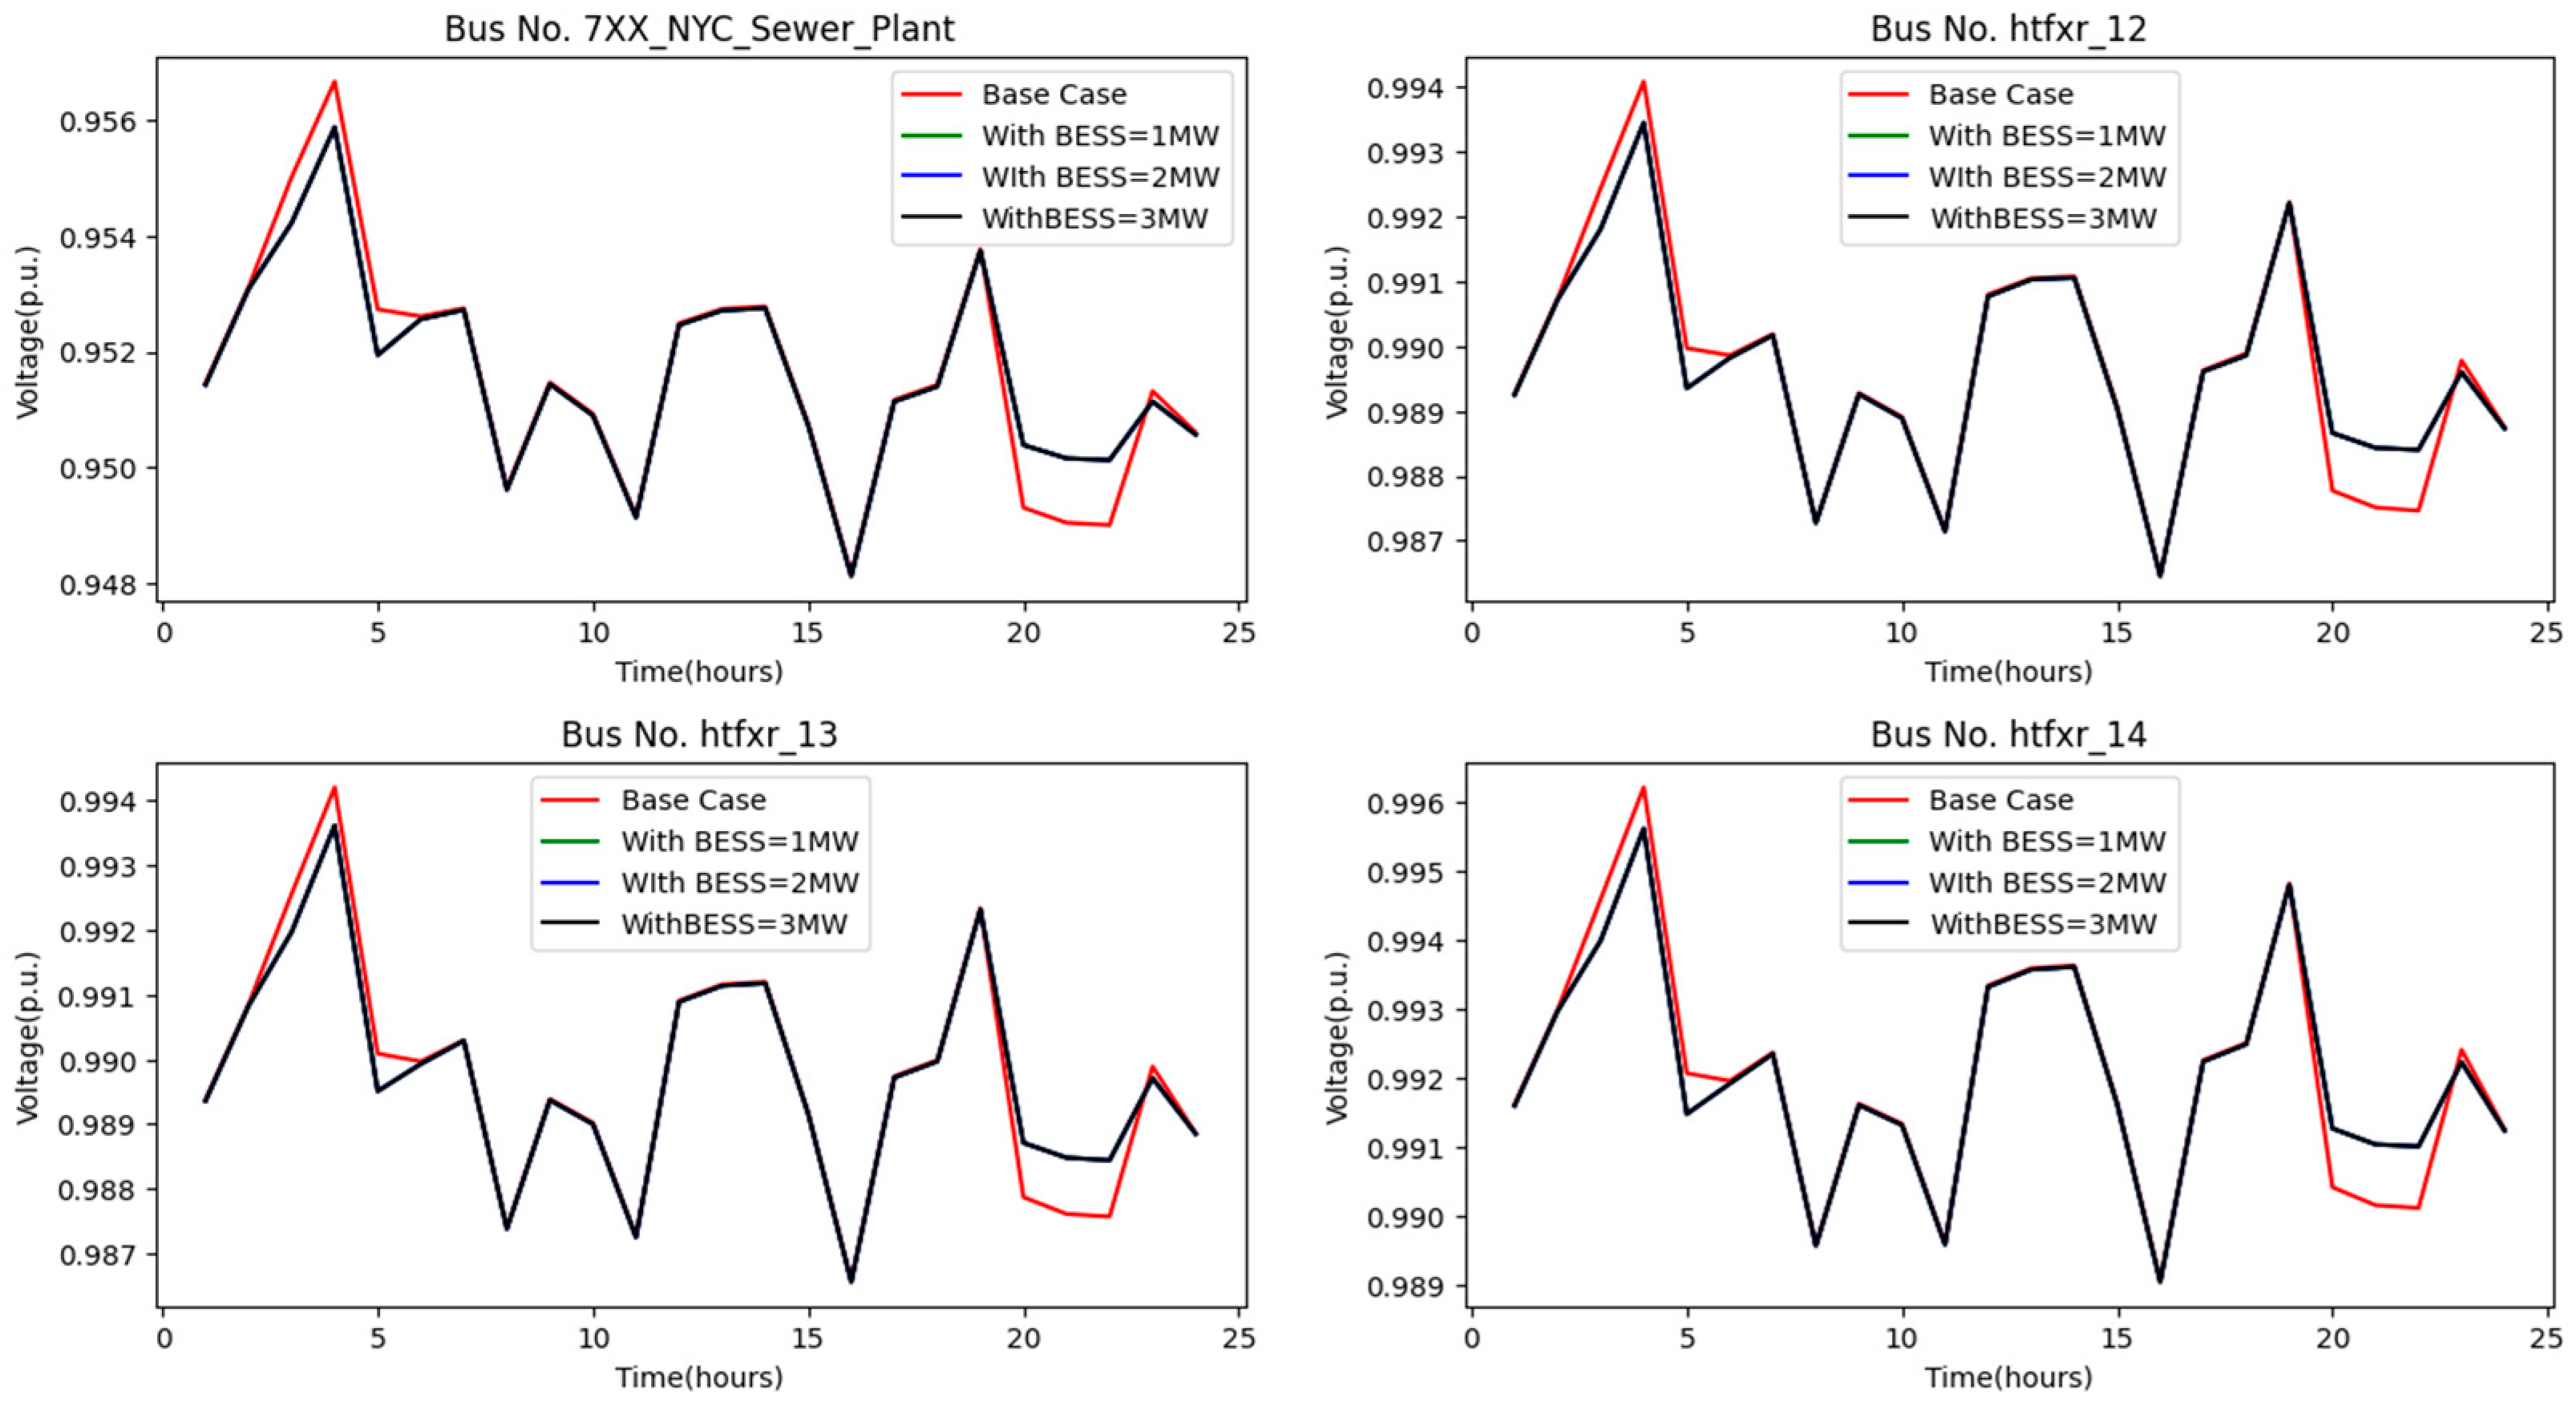
5.1.3. Real NYC System

Analysis was performed for a case study based in West Harlem, NYC. Load flow analysis was performed, and the bus voltage magnitude and percentage loading of the feeders were observed. For the purpose of analysis and comparison, four scenarios have been simulated in OpenDSS. The first case corresponds to the base case, which represents the current system. Three additional cases with microgrids of 1 MW, 2 MW, and 3 MW were considered.
The maximum peak daily load curve for the area of West Harlem is shown in Figure 13. The load demand attains its maximum value around 8 p.m. and remains highest until 11 p.m. After that, it starts decreasing until it becomes the lowest at 3 a.m., it remains low for few hours followed by a rise at around 7 a.m. in the morning. It is evident from the analysis of the consumption pattern of load demand that the battery system within the WRRF microgrid can be discharged to reduce the peak demand during peak hours. A suitable time for charging would be after midnight when load demand is the lowest. This support from the battery system can provide myriad benefits to the utility network.
Consequently, load flow has been simulated with the assumption that the battery will be charged after midnight from 3 a.m. to 7 a.m. However, the discharge would take place during peak hours (from 7 p.m. to 11 p.m.). In this analysis, the battery is assumed to remain idle during the rest of the hours of the day. In practice, it could be utilized to provide other benefits as discussed earlier.
A snapshot of the West Harlem network around the load bus of the WRRF is depicted in Figure 14. The battery system is planned to be installed at the 4.16 kV bus 7XX_NYC_Sewer_Plant. It is worth mentioning that there are 28 primary feeders supplying power to the area of West Harlem, four of which feed the WRRF. Even though bus voltages and loading of primary feeders have been observed for the whole network, the results presented and discussed here are particularly for feeders that are connected directly to the plant bus (7XX_NYC_Sewer_Plant).
Figure 15 shows results of the load flow analysis for the base case. Percentage loading of the primary feeders can be seen against 24 h. Loading is below 80%. Figure 16, Figure 17 and Figure 18 depict the percentage line loading corresponding to the cases with capacities of 1 MW, 2 MW, and 3 MW, respectively.
The maximum percentage loading of primary feeders for the four cases is plotted in Figure 19. The feeders experiencing a reduction in maximum loading are the ones that feed the network near the WRRF, i.e., feeders 14, 15, 16, and 26.
Further, the loading of the primary feeders supplying the network near/around the plant have been plotted in Figure 20. The results show that the percentage loading becomes high during charging and low during peak hours. This shows the potential relief that WRRF microgrids can provide to the distribution network.
The bus voltages pertaining to the various cases have been depicted in Figure 21, Figure 22, Figure 23 and Figure 24. It is evident from the results that some buses in the network go through a dip in voltage during hours of high demand in the base case. The WRRF microgrid does not seem to have any impact on the system voltages in all three scenarios. The microscopic impact of BESS on the voltage needs to be observed on and around its installation bus. Figure 25 shows the bus voltages at/near the WRRF. During the discharge of the battery in peak hours, the voltage profile is improved. The higher the value of battery capacity, the better the improvement. The voltage expectedly drops during charging at night.

6. Conclusions

In this paper, the possibility of building community microgrids centered around wastewater resource recovery facilities has been discussed, with a focus on grid impact. The impact of distributed energy resources within those community microgrids was analyzed using load flow analysis. Results of the load flow analysis show that the DERs within WRRF community microgrids can potentially result in valuable grid services, such as the provision of primary-feeder loading relief and voltage support. In addition, a generic methodology was proposed to assess the feasibility of community microgrids at WRRFs.

Author Contributions

Conceptualization, A.A.A.M. methodology, A.A.A.M. and D.V.; software, K.Z., L.S. and O.K.; validation, A.A.A.M., Y.E. and M.K.; formal analysis, A.A.A.M., K.Z., Y.E., O.K. and M.K.; investigation, A.A.A.M., K.Z., L.S., Y.E. and M.K.; resources, A.A.A.M.; data curation, A.A.A.M., D.V. and M.K.; writing—original draft preparation, A.A.A.M., D.V., K.Z., L.S., O.K., Y.E. and M.K.; writing—review and editing, A.A.A.M.; visualization, K.Z., O.K. and L.S.; supervision, A.A.A.M.; project administration, A.A.A.M.; funding acquisition, A.A.A.M. All authors have read and agreed to the published version of the manuscript.

Funding

This research was funded by the US National Science Foundation grant number 1846940.

Data Availability Statement

The data presented in this study are available within the article. The utility infrastructure data were provided to the corresponding author through a non-disclosure agreement and are not available to the public.

Conflicts of Interest

The authors declare no conflict of interest.

Appendix A

Table A1. Load data for the IEEE 30-Bus system.
BusPDQDBusPDQDBusPDQD
10011002161
232.5519.051216.811.252230.5
33.61.813002300
411.42.4149.32.42413.0510.05
50015002500
600165.252.7265.253.45
734.216.351713.58.72700
8201518002800
9001914.255.1293.61.35
105.82203.31.053015.92.85
Table A2. Branch parameters of the IEEE 30-Bus system.
BranchFrom BusTo BusrxbCapacity
1120.020.060.03130
2130.050.190.02130
3240.060.170.0265
4340.010.040130
5250.050.20.02130
6260.060.180.0265
7460.010.04090
8570.050.120.0170
9670.030.080.01130
10680.010.04032
116900.21065
1261000.56032
1391100.21065
1491000.11065
1541200.26065
16121300.14065
1712140.120.26032
1812150.070.13032
1912160.090.2032
2014150.220.2016
2116170.080.19016
2215180.110.22016
2318190.060.13016
2419200.030.07032
2510200.090.21032
2610170.030.08032
2710210.030.07032
2810220.070.15032
2921220.010.02032
3015230.10.2016
3122240.120.18016
3223240.130.27016
3324250.190.33016
3425260.250.38016
3525270.110.21016
36282700.4065
3727290.220.42016
3827300.320.6016
3929300.240.45016
408280.060.20.0232
416280.020.060.0132

References

  1. Mohamed, A. A Synthetic Case Study for Analysis of the Rising Interdependency between the Power Grid and E-Mobility. IEEE Access 2019, 7, 58802–58809. [Google Scholar] [CrossRef]
  2. Mohamed, A.; Kanwhen, O.; Bobker, M. Distributed Energy Resources for Water Resource Recovery Facilities: A Metropolitan City Case Study. Appl. Energy 2022, 327, 120059. [Google Scholar] [CrossRef]
  3. NYC Wants More Rooftop Solar. Its Fire Code Is Getting in the Way. Available online: https://grist.org/cities/nyc-wants-more-rooftop-solar-its-fire-code-is-getting-in-the-way/ (accessed on 21 June 2023).
  4. Energy Core Report. Available online: https://www1.nyc.gov/assets/dcas/downloads/pdf/energy/archive/EnergyCoreReport_2016.pdf (accessed on 21 June 2023).
  5. Mayor’s Office of Sustainability, Inventory of NYC GHG Emissions 2015. Available online: https://www.dec.ny.gov/docs/administration_pdf/nycghg.pdf (accessed on 21 June 2023).
  6. Mohamed, A.A.A.; Kamaludeen, M.K.; Barros, F.; Imperial, Z. Dissecting the Levelized Cost of Storage—“Adders” for New York City. Sustainability 2020, 14, 3768. [Google Scholar] [CrossRef]
  7. Saude, B.; LaSart, N.; Blair, J.; Beik, O. Microgrid-Based Wind and Solar Power Generation on Moon and Mars. IEEE Trans. Smart Grid 2023, 14, 1329–1332. [Google Scholar] [CrossRef]
  8. Liang, Z.; Dong, Z.; Li, C.; Wu, C.; Chen, H. A Data-Driven Convex Model for Hybrid Microgrid Operation With Bidirectional Converters. IEEE Trans. Smart Grid 2023, 14, 1313–1316. [Google Scholar] [CrossRef]
  9. Chen, K.; Baran, M. Robust Controller for Community Microgrids for Stability Improvement in Islanded Mode. IEEE Trans. Power Syst. 2023, 38, 2472–2484. [Google Scholar] [CrossRef]
  10. Shirsat, A.; Muthukaruppan, V.; Hu, R.; Paduani, V.D.; Xu, B.; Song, L.; Li, Y.; Lu, N.; Baran, M.; Lubkeman, D.; et al. A Secure and Adaptive Hierarchical Multi-Timescale Framework for Resilient Load Restoration Using a Community Microgrid. IEEE Trans. Sustain. Energy 2023, 14, 1057–1075. [Google Scholar] [CrossRef]
  11. Schwaegerl, C.; Tao, L. Micrgrid Automation and Control, 1st ed.; Wiley Onlime Library: Hoboken, NJ, USA, 2013; Chapter 1, The Microgrids Concept. [Google Scholar] [CrossRef]
  12. Marchgraber, J.; Gawlik, W. Investigation of Black-Starting and Islanding Capabilities of a Battery Energy Storage System Supplying a Microgrid Consisting of Wind Turbines, Impedance- and Motor-Loads. Energies 2020, 13, 5170. [Google Scholar] [CrossRef]
  13. Jain, H.; Seo, G.-S.; Lockhart, E.; Gevorgian, V.; Kroposki, B. Blackstart of Power Grids with Inverter-Based Resources. In Proceedings of the IEEE Power & Energy Society General Meeting (PESGM), Montreal, QC, Canada, 2–6 August 2020. [Google Scholar] [CrossRef]
  14. Barakat, S.; Emam, A.; Samy, M.M. Investigating grid-connected green power systems’ energy storage solutions in the event of frequent blackouts. Energy Rep. 2022, 8, 5177–5191. [Google Scholar] [CrossRef]
  15. Khodaei, A.; Bahramirad, S.; Shahidehpour, M. Microgrid planning under uncertainty. IEEE Trans. Power Syst. 2014, 30, 2417–2425. [Google Scholar] [CrossRef]
  16. Gholami, A.; Aminifar, F.; Shahidehpour, M. Front lines against the darkness: Enhancing the resilience of the electricity grid through microgrid facilities. IEEE Electrif. Mag. 2016, 4, 18–24. [Google Scholar] [CrossRef]
  17. Wong, L.A.; Ramachandaramurthy, V.K.; Walker, S.L.; Ekanayake, J.B. Optimal placement and sizing of battery energy storage system considering the duck curve phenomenon. IEEE Access 2020, 8, 197236–197248. [Google Scholar] [CrossRef]
  18. Stadler, M.; Cardoso, G.; Mashayekh, S.; Forget, T.; DeForest, N.; Agarwal, A.; Schönbein, A. Value streams in microgrids: A literature review. Appl. Energy 2016, 162, 980–989. [Google Scholar] [CrossRef]
  19. Yang, W.; Sparrow, S.N.; Ashtine, M.; Wallom, D.C.H.; Morstyn, T. Resilient by design: Preventing wildfires and blackouts with microgrids. Appl. Energy 2022, 313, 118793. [Google Scholar] [CrossRef]
  20. Masrur, H.; Sharifi, A.; Islam, M.R.; Hossain, M.A.; Senjyu, T. Optimal and economic operation of microgrids to leverage resilience benefits during grid outages. Int. J. Electr. Power Energy Syst. 2021, 132, 107137. [Google Scholar] [CrossRef]
  21. Krietemeyer, B.; Dedrick, J.; Sabaghian, E.; Rakha, T. Managing the duck curve: Energy culture and participation in local energy management programs in the United States. Energy Res. Soc. Sci. 2021, 79, 102055. [Google Scholar] [CrossRef]
  22. Hou, Q.; Zhang, N.; Du, E.; Miao, M.; Peng, F.; Kang, C. Probabilistic duck curve in high PV penetration power system: Concept, modeling, and empirical analysis in China. Appl. Energy 2019, 242, 205–215. [Google Scholar] [CrossRef]
  23. Aros-Vera, F.; Gillian, S.; Rehmar, A.; Rehmar, L. Increasing the resilience of critical infrastructure networks through the strategic location of microgrids: A case study of Hurricane Maria in Puerto Rico. Int. J. Disaster Risk Reduct. 2021, 55, 102055. [Google Scholar] [CrossRef]
  24. Asimakopoulou, G.E.; Hatziargyriou, N.D. Evaluation of economic benefits of DER aggregation. IEEE Trans. Sustain. Energy 2017, 9, 499–510. [Google Scholar] [CrossRef]
  25. Mutani, G.; Santantonio, S.; Brunetta, G.; Caldarice, O.; Demichela, M. An energy community for territorial resilience: Measurement of the risk of an energy supply blackout. Energy Build. 2021, 240, 110906. [Google Scholar] [CrossRef]
  26. Baca, M.; Schenkman, B.; Hightower, M. Use of advanced microgrids to support community resilience. Nat. Hazards Rev. 2021, 22, 05021012. [Google Scholar] [CrossRef]
  27. Vine, D.; Morsch, A. Microgrids: What Every City Should Know; Center for Climate and Energy Solutions: Arlington, VA, USA, 2017. [Google Scholar]
  28. Gharieh, K.; Jafari, M.A.; Mahani, K. Public-Private Partnership (PPP) Financing Model for Micro-Grids. In Proceedings of the Dynamic Energy Landscape, 33rd USAEE/IAEE North American Conference, Pittsburgh, PA, USA, 25–28 October 2015; International Association for Energy Economics: Cleveland, OH, USA, 2015. [Google Scholar]
  29. Batidzirai, B.; Trotter, P.A.; Brophy, A.; Stritzke, S.; Moyo, A.; Twesigye, P.; Puranasamriddhi, A.; Madhlopa, A. Towards people-private-public partnerships: An integrated community engagement model for capturing energy access needs. Energy Res. Soc. Sci. 2021, 74, 101975. [Google Scholar] [CrossRef]
  30. Feasibility Study for Developing a Microgrid at the Ithaca Area Waste Water Treatment Facility to Serve the Ithaca Nort Energy District. Available online: http://www.lightlink.com/francis/IthacaNEDReportFall2015.pdf (accessed on 21 June 2023).
  31. Norouzi, F.; Hoppe, T.; Elizondo, L.R.; Bauer, P. A review of socio-technical barriers to Smart Microgrid development. Renew. Sustain. Energy Rev. 2022, 167, 112674. [Google Scholar] [CrossRef]
  32. Bellido, M.H.; Rosa, L.P.; Pereira, A.O.; Falcao, D.M.; Ribeiro, S.K. Barriers, challenges and opportunities for microgrid implementation: The case of Federal University of Rio de Janeiro. J. Clean. Prod. 2018, 188, 203–216. [Google Scholar] [CrossRef]
  33. Soshinskaya, M.; Crijns-Graus, W.H.J.; Guerrero, J.M.; Vasquez, J.C. Microgrids: Experiences, barriers and success factors. Renew. Sustain. Energy Rev. 2014, 40, 659–672. [Google Scholar] [CrossRef]
  34. Yuan, C.; Illindala, M.S.; Khalsa, A.S. Co-Optimization Scheme for Distributed Energy Resource Planning in Community Microgrids. IEEE Trans. Sustain. Energy 2017, 8, 1351–1360. [Google Scholar] [CrossRef]
  35. Silva-Rodriguez, J.; Li, X. Water-Energy Co-Optimization for Community-Scale Microgrids. In Proceedings of the 2021 North American Power Symposium (NAPS), College Station, TX, USA, 14–16 November 2021; pp. 1–6. [Google Scholar] [CrossRef]
  36. Sambor, D.J.; Bishop, S.C.M.; Dotson, A.; Aggarwal, S.; Jacobson, M.Z. Optimizing demand response of a modular water reuse system in a remote Arctic microgrid. J. Clean. Prod. 2022, 346, 131110. [Google Scholar] [CrossRef]
  37. Tomin, N.; Shakirov, V.; Kozlov, A.; Sidorov, D.; Kurbatsky, V.; Rehtanz, C.; Lora, E.E.S. Design and optimal energy management of community microgrids with flexible renewable energy sources. Renew. Energy 2022, 183, 903–921. [Google Scholar] [CrossRef]
  38. Bey, M.; Hamidat, A.; Nacer, T. Eco-energetic feasibility study of using grid-connected photovoltaic system in wastewater treatment plant. Energy 2021, 216, 119217. [Google Scholar] [CrossRef]
Figure 1. A geographic area that includes a WRRF, residential and commercial buildings, electric vehicle chargers, a subway substation, and critical facilities. The orange lines represent the electricity distribution infrastructure. The diagram illustrates partial feeder versus whole feeder and area community microgrids.
Smartcities 06 00152 g001
Figure 2. Decision process for WRRF community microgrids.
Smartcities 06 00152 g002
Figure 3. Influent flow versus time.
Smartcities 06 00152 g003
Figure 4. The treatment process and a single-line diagram of its associated power system.
Smartcities 06 00152 g004
Figure 5. Typical energy consumption in WRRFs.
Smartcities 06 00152 g005
Figure 6. Typical WRRF load curve. Days 2, 3, and 4 encountered snow. Days 10, 15, 21, 22, and 31 are rainy.
Smartcities 06 00152 g006
Figure 7. Monthly biogas produced versus utilized.
Smartcities 06 00152 g007
Figure 8. Aeration tank consumption: (a) variation in energy consumption versus daily average flow, and (b) variation in DO with respect to the daily average flow.
Smartcities 06 00152 g008
Figure 9. Network assessment using load flow.
Smartcities 06 00152 g009
Figure 10. An example of a networked distribution network with a WRRF at bus 15 and a community microgrid combining buses 15, 18, and 23. We selected the IEEE 30-bus system because it is a meshed network. The meshed topology and capacity of this test system have a resemblance with the distribution network and area substations of NYC. For islanding, circuit breakers CB1, CB2, CB3, and CB4 open.
Smartcities 06 00152 g010
Figure 11. Line loading under various conditions.
Smartcities 06 00152 g011
Figure 12. Power transfer distribution factors for the 30-bus system.
Smartcities 06 00152 g012
Figure 13. Daily load curve for the West Harlem area.
Smartcities 06 00152 g013
Figure 14. Part of the distribution network adjacent to the WRRF.
Smartcities 06 00152 g014
Figure 15. Percentage loading of primary feeders (base case).
Smartcities 06 00152 g015
Figure 16. Percentage loading of primary feeders (1 MW case).
Smartcities 06 00152 g016
Figure 17. Percentage loading of primary feeders (2 MW case).
Smartcities 06 00152 g017
Figure 18. Percentage loading of primary feeders (3 MW case).
Smartcities 06 00152 g018
Figure 19. Maximum percentage loading of primary feeders.
Smartcities 06 00152 g019
Figure 20. Percentage loading of primary feeders adjacent to the WRRF.
Smartcities 06 00152 g020
Figure 21. Bus voltages (base case).
Smartcities 06 00152 g021
Figure 22. Bus voltages (1 MW case).
Smartcities 06 00152 g022
Figure 23. Bus voltages (2 MW case).
Smartcities 06 00152 g023
Figure 24. Bus voltages (3 MW case).
Smartcities 06 00152 g024
Figure 25. Bus voltages near the WRRF.
Smartcities 06 00152 g025aSmartcities 06 00152 g025b
Table 1. The literature survey and gaps filled by present work.
RefObjectivesSystem under ConsiderationProposed DER SolutionsTools UsedGrid Impact Analysis on Real-Time System
[34]Co-optimization strategy for planning DERs to minimize total annualized costA village at AEP Ohio with 4.5 MW peak loadSolar PV, wind turbine, natural gas CHP, and biomass CHP HomerNo
[35]WECoOp model for co-optimization of both water and power resources60 residential and 2 commercial units in Houston areaMicrogrid energy mangement and water management MATLAB No
[36]Energy optimization model Remote Alaska communitySolar PV and battery; WRRF as dispatchableJuliaNo
[37]Fraamework for optimal managemnt of CMGTransbaikal National Park (Russia)Solar PV, wind, and biomass gasifierBilevel Programming, Reinforcement Learning, Homer Pro, Python optimization, and machine learningNo
[38]Economic analysis of grid-connected PV system at wastewater treatment facilitySebdou, North Algeria
(town and commune)
670 kWp solar PVA computational optmization program is developedNo
Present WorkGrid impact of WWRFs on CMGWest Harlem, NYC
(Dense urban area)
Renewable biogas, PV arrays, energy storage, and cogenerationMATPOWER/OpenDSSYes
Table 2. Percent energy consumption in WRRFs.
ProcessEnergy (%)
Secondary treatment aeration55.6
Primary clarifier and sludge pumps10.3
Heating7.1
Solid dewatering7.0
Influent pumping4.9
Effluent filter and process4.5
Secondary clarifier and RAS3.7
Lighting2.2
Thickening and sludge pumping1.6
Disclaimer/Publisher’s Note: The statements, opinions and data contained in all publications are solely those of the individual author(s) and contributor(s) and not of MDPI and/or the editor(s). MDPI and/or the editor(s) disclaim responsibility for any injury to people or property resulting from any ideas, methods, instructions or products referred to in the content.

