
Selective O-alkylation of Phenol Using Dimethyl Ether
by

Mane Samruddhi
1,2,
Akash Bhatkar
1,2,
Marimuthu Prabu
1,2,
Siva Prasad Mekala
1,2,
Pranjal Gogoi
1,2,
Gourab Mohapatra
1,2 and
Raja Thirumalaiswamy
1,2,* 1
Catalysis and Inorganic Chemistry Division, CSIR-National Chemical Laboratory, Dr. Homi Bhabha Road, Pune 411008, India
2
Academy of Scientific and Innovative Research (AcSIR), CSIR-HRDC Campus, Ghaziabad 201002, India
*
Author to whom correspondence should be addressed.
Reactions 2022, 3(4), 602-614; https://doi.org/10.3390/reactions3040040
Submission received: 28 September 2022
/
Revised: 23 October 2022
/
Accepted: 31 October 2022
/
Published: 17 November 2022
Abstract
:Anisole is a straw-colored aromatic compound mainly used in making solvents, flavoring agents, perfumes, fuel additives, and in the synthesis industries. Anisole, also known as methoxybenzene, is synthesized from sodium phenoxide or phenol using various methylating agents. The use of dimethyl ether (DME) as an alkylating agent is seldom reported in the literature. Herein, we have synthesized anisole through the O-alkylation process of phenol and DME to obtain zero discharge from this process. The thermodynamic equilibrium for the reaction of phenol and DME is simulated by using Aspen HYSYS (Hyprotech and Systems). The O-alkylation of phenol has been investigated using phosphotungstic acid (PTA) over γ-Al2O3 with appropriate acidity. Active metal loadings of various percentages were studied and the conversion was optimized at 46.57% with a selectivity of 88.22% at a temperature of 280 °C. The liquid products from the continuously stirred reactor were analyzed with liquid G.C. and the conversion and selectivity were calculated. A comparison of the O-alkylation and C-alkylation of phenol at different temperatures, reactant ratios, residence times, and recyclability was explored, as well as the impact of these factors on the yield of the desired anisole. The catalyst was characterized by XRD, BET, HR-TEM, FE-SEM, elemental mapping, XPS, and DRIFT studies.
1. Introduction
Williamson’s reaction was reported as the first reaction where alkyl halides and sodium salt of phenol were used to prepare anisole. The O-alkylated products such as anisole; 1,2-Dimethoxy-4-(prop-1-enyl)-benzene; 4-methyl anisole; and 1,4-Dimethoxy-benzene, etc. are of great importance in various chemical industries as a precursor for flavoring agent, synthesis industry. The demand for O-alkylated products has been rising recently due to the molecule’s unique chemical and physical properties. Anisole is one of the essential chemicals and is mainly used in making perfumes, solvents, and flavoring agents in foods [1]. It is also used in producing dyes, pharmaceuticals, pesticides, insecticides, etc. [2,3]. Anisole’s artificial fragrance makes it one of the key ingredients in cosmetic industries [4]. Spark ignition engines’ performance is highly dependent on fuel and its anti-knock quality, mainly governed by the auto-ignition mechanism; based on this, recently, anisole has been identified as a fuel additive, as it plays a vital role in the increment of octane values of naphtha [5]. Therefore, industries and researchers are keenly focused on developing the technology for selective syntheses of anisole.
The selective O-alkylation is one of the important and promising processes to obtain anisole from phenol precursors, employing alkylating agents such as alkyl halides, dimethyl sulphate, alcohols, and ethers which are well studied for this reaction. Processes including alkyl halides and dimethyl sulphate have been recently reported; nevertheless, the serious issues caused by these chemicals, such as environmental pollution and the negative impact of runaway reactions, make the overall process hazardous and troublesome to control [6,7]. Therefore, finding an eco-benign route to convert the phenol selectively into an O-alkylated product has become the topic of interest for researchers.
Alkylation of phenols with olefins and alcohols has been extensively studied in both vapor and liquid phases, over a wide range of heterogeneous catalysts [4]. For methylation reactions, various methylating agents such as methyl halides, methanol, DMC (dimethyl carbonates), and dimethyl ether have been reported [8]. Anisole is synthesized using the above-mentioned methylating agents by the following methods: (1) Williamson synthesis; (2) by alkylation of sodium phenoxide with dimethyl sulphate (DMS); (3) alkylation of phenol with methanol; and (4) alkylation of phenol with dimethyl ether (Scheme 1). Among these is the Williamson synthesis route. The DMS route has been restricted for the last few years because the alkali used is not eco-benign, and toxic materials such as dimethyl sulphate and methyl bromide are dangerous to human health. On the other hand, stoichiometric quantities of sodium hydroxide are required to produce sodium phenoxide and large amounts of salt as a byproduct to fill the landmines. Thus, this process has minimal commercial appeal.
Dan Dang et al. have studied the reaction with KH2PO4 over activated alumina (AA) for the vapor phase methylation of phenol using methanol over their best catalyst, reported at 400 to 450 °C. Many of these reactions are reported mostly at 350 °C to 450 °C with methanol is the alkylating agent. Methanol gives water as a byproduct; sometimes, it causes harm to the catalyst, resulting in catalytic deactivation, and cumbersome downstream processes must be deployed for the purification and separation of the produced water and the desired product from the product mixture [9]. Moreover, the other hiccup with the O-methylation of phenol with methanol is the formation of byproducts through the simultaneous alkylation of the aromatic ring. Some unwanted products formed are o-cresol, m-cresol, 2–6 xylenol, xylenols, and various methyl anisoles because of competitive alkylating site at the carbon center of carbon phenol, resulting in decreased selectivity of anisole. Similar byproducts are formed in the dimethyl ether route, as well. However, a catalyst with appropriate acidity will increase the selectivity of anisole.
The catalyst used in this reaction is transition metals doped on γ-Al2O3 or silica powder [10,11]. Kiran Y Paranjpe et al. reported using γ-Al2O3 in the alkylation of phenol to form anisole. They reported that the γ-Al2O3 catalyst alone does not perform well for the selective formation of anisole. The reaction conditions were between 250 °C and 450 °C with the phenol conversion of 30–60% and methanol as an alkylating agent [12]. On the contrary, γ-Al2O3 is preferred as a support due to its high surface area, and upon modification, it increases the conversion of phenol in the reaction [2,10,11,12]. Therefore, to tune the acidity of the catalyst, some transition metals are impregnated on the surface of the support. More Lewis acidic sites and fewer Brønsted acidic sites significantly help in the selective O-alkylation of the phenol [13]. This helps to enhance the catalyst’s overall life span and performance in terms of the yield of the targeted product.
In this work, we performed the reaction with phenol and dimethyl ether to form anisole over the catalyst, which aimed to result in good conversion and selectivity of the anisole. Dimethyl ether (DME) is used as an alkylating agent, which forms methanol as a side product and can take part in the reaction as a reactant to give higher conversions. For this, γ-Al2O3-supported metal oxides such as tungsten and phosphorous were employed to get the desired result by tuning the appropriate acidity. The reactions were performed at 280 °C and autogenously generated pressure close to 50 bar in a batch process in a continuously stirred Parr reactor.
2. Results
2.1. Materials
The chemicals used in these experiments were phenol procured from Alpha Aesar and the dimethyl ether (DME) as-synthesized at CSIR-National chemical laboratory, Pune, India, with 99.99% purity. The precursors used to synthesize the catalysts were phosphotungstic acid procured from Sigma Aldrich, St. Louis, MO, USA, and the support Alumina procured from Alfa Aesar.
2.2. Catalyst Preparation
A solid acid catalyst was used for this reaction. The γ-Al2O3 was used as a support in this system, and metal oxides such as phosphorous and tungsten were impregnated on the catalyst’s surface. The catalyst was prepared by the wet impregnation method in which γ-Al2O3 pellets were crushed to make a fine powder. For a 10 g batch of catalyst, 9 g of γ-Al2O3 powder as per requirement was taken into a 100 mL beaker then dispersed in 40 mL of suitable alcohol and kept on a hot plate at 80 °C with stirring speed of 250 rpm for 0.5 h until it was thoroughly mixed. The pH of that slurry was maintained at 5 to 6. Simultaneously, in another 50 mL beaker, 1 g of phosphotungstic acid was dissolved in methanol, with the pH maintained at 1 to 2. This metal salt solution was dropped into the γ-Al2O3 slurry with the help of a burette to control the addition. The γ-Al2O3 slurry was continuously stirred at 200 rpm and heated at 80 °C. Then, the prepared catalyst slurry was mixed for 5–6 h with 250 rpm stirring at 80 °C. The pH of the uniformly mixed catalyst slurry was measured to be 4–5. Then, this catalyst was aged for 6 h on a hot plate without stirring at 80 °C. After 6 h of aging, the catalyst was dried overnight in an oven at 120 °C. The catalyst was then crushed to make it a fine powder. Then, the catalyst powder was calcined in the muffle furnace for 6 h at 650 °C with a ramp rate of 5 °C/min−1. The as-synthesized catalyst was named 10 PTA. Similarly, other combinations of catalysts were prepared and termed as 20 PTA, 30 PTA, 40 PTA, and 50 PTA by varying the PTA to γ-Al2O3 ratio as (20–50:80–50 wt%). These synthesized catalyst combinations of heterogeneous solid acid catalysts were then characterized and subjected to test their activity at various reaction parameters.
2.3. Experimental Procedure
The reaction was carried out in batch mode, and a 300 mL Parr reactor was employed to synthesize the anisole. Here, 0.2 moles of phenol were reacted with 0.4 moles of DME, which were pumped into the reactor at 15 bar pressure to ensure that DME entered the reactor in the liquid phase. This reaction occurs in the liquid phase at 280 °C under 50 bar autogenously developed pressure. The ratio of phenol to DME was maintained at 1:2. In the Parr reactor, 0.2 g of catalyst was loaded. After 5 h stirring at 300–325 rpm, the reactor was stopped and cooled until the temperature reached the ambient condition. The product was then collected into a beaker. The beaker was kept in the ambient condition for 15 min to remove/evaporate the unreacted DME from the product mixture before analyzing the products further. The selectivity of anisole and conversion for phenol was calculated by the following:
2.4. Characterization
2.4.1. X-ray Diffraction (XRD)
To check the synthesized catalyst’s crystallinity and phase changes, we performed XRD analysis. In Figure 1, the pure γ-Al2O3 support showed three broad peaks at 37.07°, 45.89°, and 66.7°, corresponding to the (131), (040), (044) (COD no. 96-154-1583), respectively [14]. The γ-Al2O3 support showed well-resolved diffraction peaks, which were well-matched to γ-Al2O3 (JCPDS 10-0425), suggesting presence of an amorphous framework, which is appropriate for impregnation [15]. The absence of characteristic peaks of PTA shows that the PTA was well-dispersed on the surface of the support, up to 30% due to the successful incorporation of PTA in the γ-Al2O3 support [16]. Furthermore, the increase in the PTA loading (40 and 50) was observed in new peaks at 23.11°, 23.63°, 23.75°, and around 33.58° with phases (002), (020), and (200), respectively, indicating the formation of a Keggin structure on the catalyst surface [17,18].
2.4.2. High-Resolution Transmission Electron Microscopy (HR-TEM)
HRTEM and STEM elemental mapping analyses were conducted to understand the catalyst’s surface better. The micrograph of the catalyst Figure 2(1a) γ-Al2O3 shows a disordered nanofiber rod-like structure [19]. The Figure 2(1b) PTA catalysts show sphere-like structures in the 5–20 nm range [20]. After impregnations of PTA on γ-Al2O3, Figure 2(1c) shows a similar structure of γ-Al2O3, which indicates that PTA is highly dispersed on the support. Figure 2(2b) shows the ‘d’ spacing values at 2.17 Å, 1.84 Å, and 1.69 Å correspond to the planes of (222), (400), and (550). The PTA catalyst and ‘d’ spacing values at 1.97 Å and 1.43 Å correspond to the γ-Al2O3 shown in Figure 2(2b). The STEM elemental mapping of 30 PTA Figure 2(2c) indicates that the phosphorous, tungsten, alumina, and oxygen are uniformly distributed without any other impurities. Figure 2(2d,2e) shows the TEM image of the 40 and 50 PTA catalysts on γ Al2O3. In these figures, it is observed that the particle size of PTA is bigger and covers a lot of the surface on the support, which might be due to the aggregation of PTA in the catalyst. Figure 2(2e) clearly shows the Keggin structure of PTA.
2.4.3. Field Emission Scanning Electron Microscopy (FE-SEM)
FE-SEM images of the synthesized catalysts and supports are shown in Figure 3. Figure 3a shows agglomerated particles of the γ-Al2O3 support and PTA; Figure 3b shows the nano-sheet-like structure in the case of PTA supported on the γ-Al2O3 support; and Figure 3c confirms PTA present on the alumina support, and there is no structural deformation. The images of 40 and 50 PTA (Figure 3d,e show a higher concentration of PTA on the surface of the support, i.e., γ-Al2O3. An agglomeration of bigger particles of PTA is also observed on the surface of the catalyst, which may be due to the Keggin structure form of PTA.
2.4.4. Brunauer–Emmett–Teller (BET)
The N2 adsorption–desorption isotherms of the synthesized catalysts are shown in Figure 4. The synthesized catalyst appears mesoporous with type IV isotherms. Typical γ-Al2O3 support has surface area of around 250 m2/g (Table 1). A gradual decrease in the surface area (250 to 180 m2/g) and pore size was observed up to the 30 PTA catalyst due to the successful incorporation or pore filling of PTA in the γ-Al2O3 support. A drastic decrease in the surface area (180–98.9 m2/g) was observed in the 40 PTA and 50 PTA cases, indicating excess PTA covering the surface of the support. This may be due to the Keggin structure on the surface of the catalyst [21]. These results are well-matched with XRD analysis.
2.4.5. X-ray Photoelectron Spectroscopy (XPS)
To further study the interactions between various elements present on the catalysts and their electronic states, XPS was performed for all the catalysts. The XPS spectra of the W4f core level of 30 PTA and 40 PTA are given in the Figure 5. The XPS spectra of W were deconvoluted into six different peaks that correspond to the W6+, W5+, and W4+ species, which likely arise from different interactions with the support. The XPS peaks observed in the higher BE range of 36.015 eV to 38.11 eV can be assigned to W6+ species in the catalysts, while the XPS peak in the lower BE range of 33.71 eV to 36.21 eV can be correlated with the W4+ species in the catalysts [22,23]. It is worth mentioning that although the weight percentages of PTA on both the catalysts (30 PTA and 40 PTA) were different, the percentage distributions of W6+ (49%), W5+ (33%), and W4+ (13%) were nearly identical. XPS spectra of the Al 2p were also recorded, and it was observed that with an increase in the PTA loading, the BE of Al shifted to a lower value [24]. When bare γ-Al2O3 is added as a control sample for Figure 5b,c the following peaks were observed. The Figure 5b shows that as the PTA concentration increases in the catalyst, the binding energy decreases, as compared to the γ-Al2O3 peak. This may be due the Keggin structure of PTA on the surface of the catalyst. It is observed in Figure 5c that the γ-Al2O3 peak has lower binding energy values as compared to 30, 40, and 50 PTA. It shows that the metal-support interaction is higher in 30, 40, and 50 PTA.
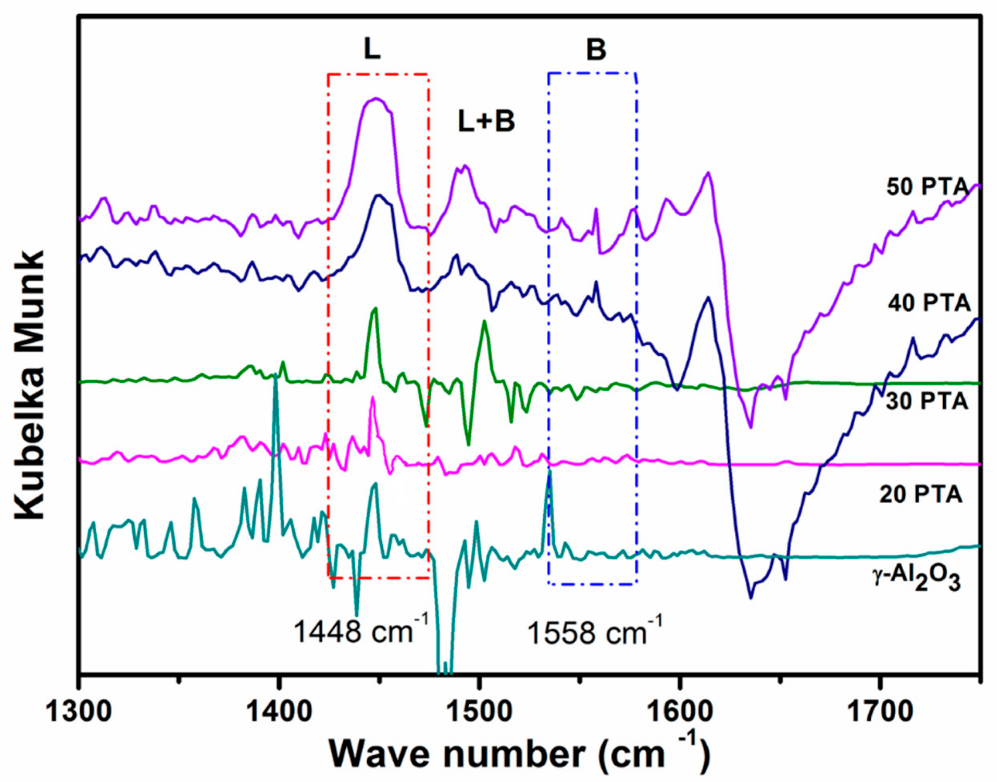
2.4.6. DRIFT Studies Using Pyridine as a Probe Molecule
Pyridine FTIR was employed to uncover the different types of acidic sites present on the synthesized catalysts. The qualitative study was conducted to verify the effect of pyridine that gets absorbed on the reactant surface through in situ Py-FTIR. The FTIR measurement was carried out on a Thermo fisher Nicolet iS50 spectrophotometer equipped with an MCT detector with a range of 4000–650 cm−1 resolution of 4 cm−1 and a scan rate of 200. The sample was loaded on the ZnSe IR cell prior to the experiment and was activated at 350 °C in nitrogen medium (30 mL/min) for 3 h. Then, the temperature was reduced to 50 °C and background spectra were collected. The pyridine absorption study began by injecting 10 µL of pyridine with a nitrogen flow (30 mL/min) to the sample at 50 °C. The spectra were collected instantly. The temperature was increased gradually at a ramping rate of 5 °C/min to 100 °C, 150 °C, 200 °C, 250 °C, and finally, to the reaction temperature of 280 °C, and spectra were collected at each temperature accordingly. Then, the temperature was reduced to 50 °C and the spectrum was collected. Figure 6 shows the pyridine FTIR spectra of the catalysts. Almost all catalysts possessed Brønsted and Lewis acid sites, as they exhibited the adsorption peaks at 1558 cm−1 and 1446 cm−1, respectively [25]. Furthermore, an additional peak was also observed at 1490–1450 cm−1, which can be assigned to the combination of both Brønsted and Lewis acidic sites [26]. The sharp Lewis acid peak (around 1448 cm−1) observed in γ-Al2O3, 20 PTA, and 30 PTA follows an increasing trend with increasing PTA lading. This may be due to the molecular form of the surface PTA which was well-dispersed. On the other hand, wide peaks of Lewis acid were observed in 40 PTA and 50 PTA, and they also followed an increasing trend. This may be due to the aggregation of PTA over the alumina surface, i.e., the formation of Keggin structure. The Brønsted acidity was also observed in the case of all the catalysts. For γ-Al2O3, 20 PTA, and 30 PTA, very small or ultrasmall peaks of Brønsted acidity (BA) were observed around 1558 cm−1, whereas the BA sites were observed with considerable amounts in the cases of 40 PTA and 50 PTA. The broadening of LA sites and increments in BA sites can be attributed to the aggregation of PTA over the surface with increasing PTA loadings. It was also observed that the intensity of the Brønsted acidic sites increased with an increase in PTA loading, which may be due to the surface hydroxyl group on the catalyst or the formation of the Keggin structure. The Lewis acidic sites on the catalysts were expected to have originated from the combination of PTA and γ-Al2O3 support [27]. It was observed that amongst all the catalysts, the 30 PTA catalyst had relatively more Lewis acidic sites compared to Brønsted acidic sites, which could be the reason for the enhanced catalytic activity of this catalyst. Based on this study, it can be concluded that a catalyst with more Lewis acidic sites is more favorable for achieving good phenol conversion with higher anisole selectivity.
3. Discussion
3.1. Effect of PTA on γ-Al2O3
The O- alkylation of phenol to anisole reaction was carried out over the synthesized catalysts and support alone to check the role of PTA with optimum reaction conditions, as shown in Figure 7. The commercial catalyst of Amberlyst 35 and γ-Al2O3 supports showing <10% conversion of phenol with around 48% selectivity of anisole. The Amberlyst 35 and γ-Al2O3 support showing 51% selectivity of other products. The 30% PTA impregnated γ-Al2O3 increases the conversion (12–42.5%) and selectivity towards anisole (44 to 88.2%). In addition, a further increase in the percentage of PTA on γ-Al2O3 diminishes the conversion (44 to 39%) and selectivity (88 to 84%) due to the higher loading of PTA, which covers the active surface sites.
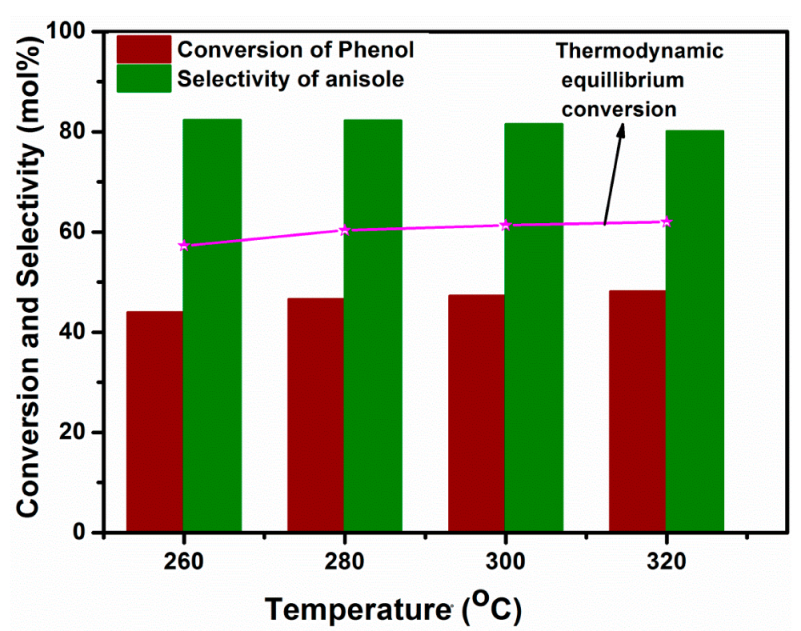
3.2. Effect of Temperature
To check the optimum reaction temperature over 30 PTA, the γ-Al2O3-supported catalyst was investigated with various temperatures (260–320 °C), as shown in Figure 8. Herein, we observed a slight increase in the conversion with increments in the temperature from 260 to 320 °C, but selectivity was slightly reduced after 280 °C (Figure 8). Similarly, simulations of the same reaction conditions were performed using Aspen HYSYS software. The equilibrium conversion for this reaction was obtained from the various temperatures where DME was used as an alkylating agent. The equilibrium conversion was found at around 63% at 320 °C.
3.3. Effect of Reactant Ratios
Alkylation of phenol reactions were carried out with various ratios of phenol and DME over 30 PTA catalysts. The high phenol to DME ratio (3:1) shows very low conversion and selectivity, and an equal ratio of phenol to DME shows good selectivity, but conversion is very low. Furthermore, we observed an increase in the phenol to DME ratio (1:2 and 1:3) in conversion from 18 to 42%. The selectivity of anisole was reduced after 1:2 ratios, which suggests that DME plays a key role in the formation of anisole as a major product (Figure 9). These results are well-matched with the thermodynamic equilibrium result.
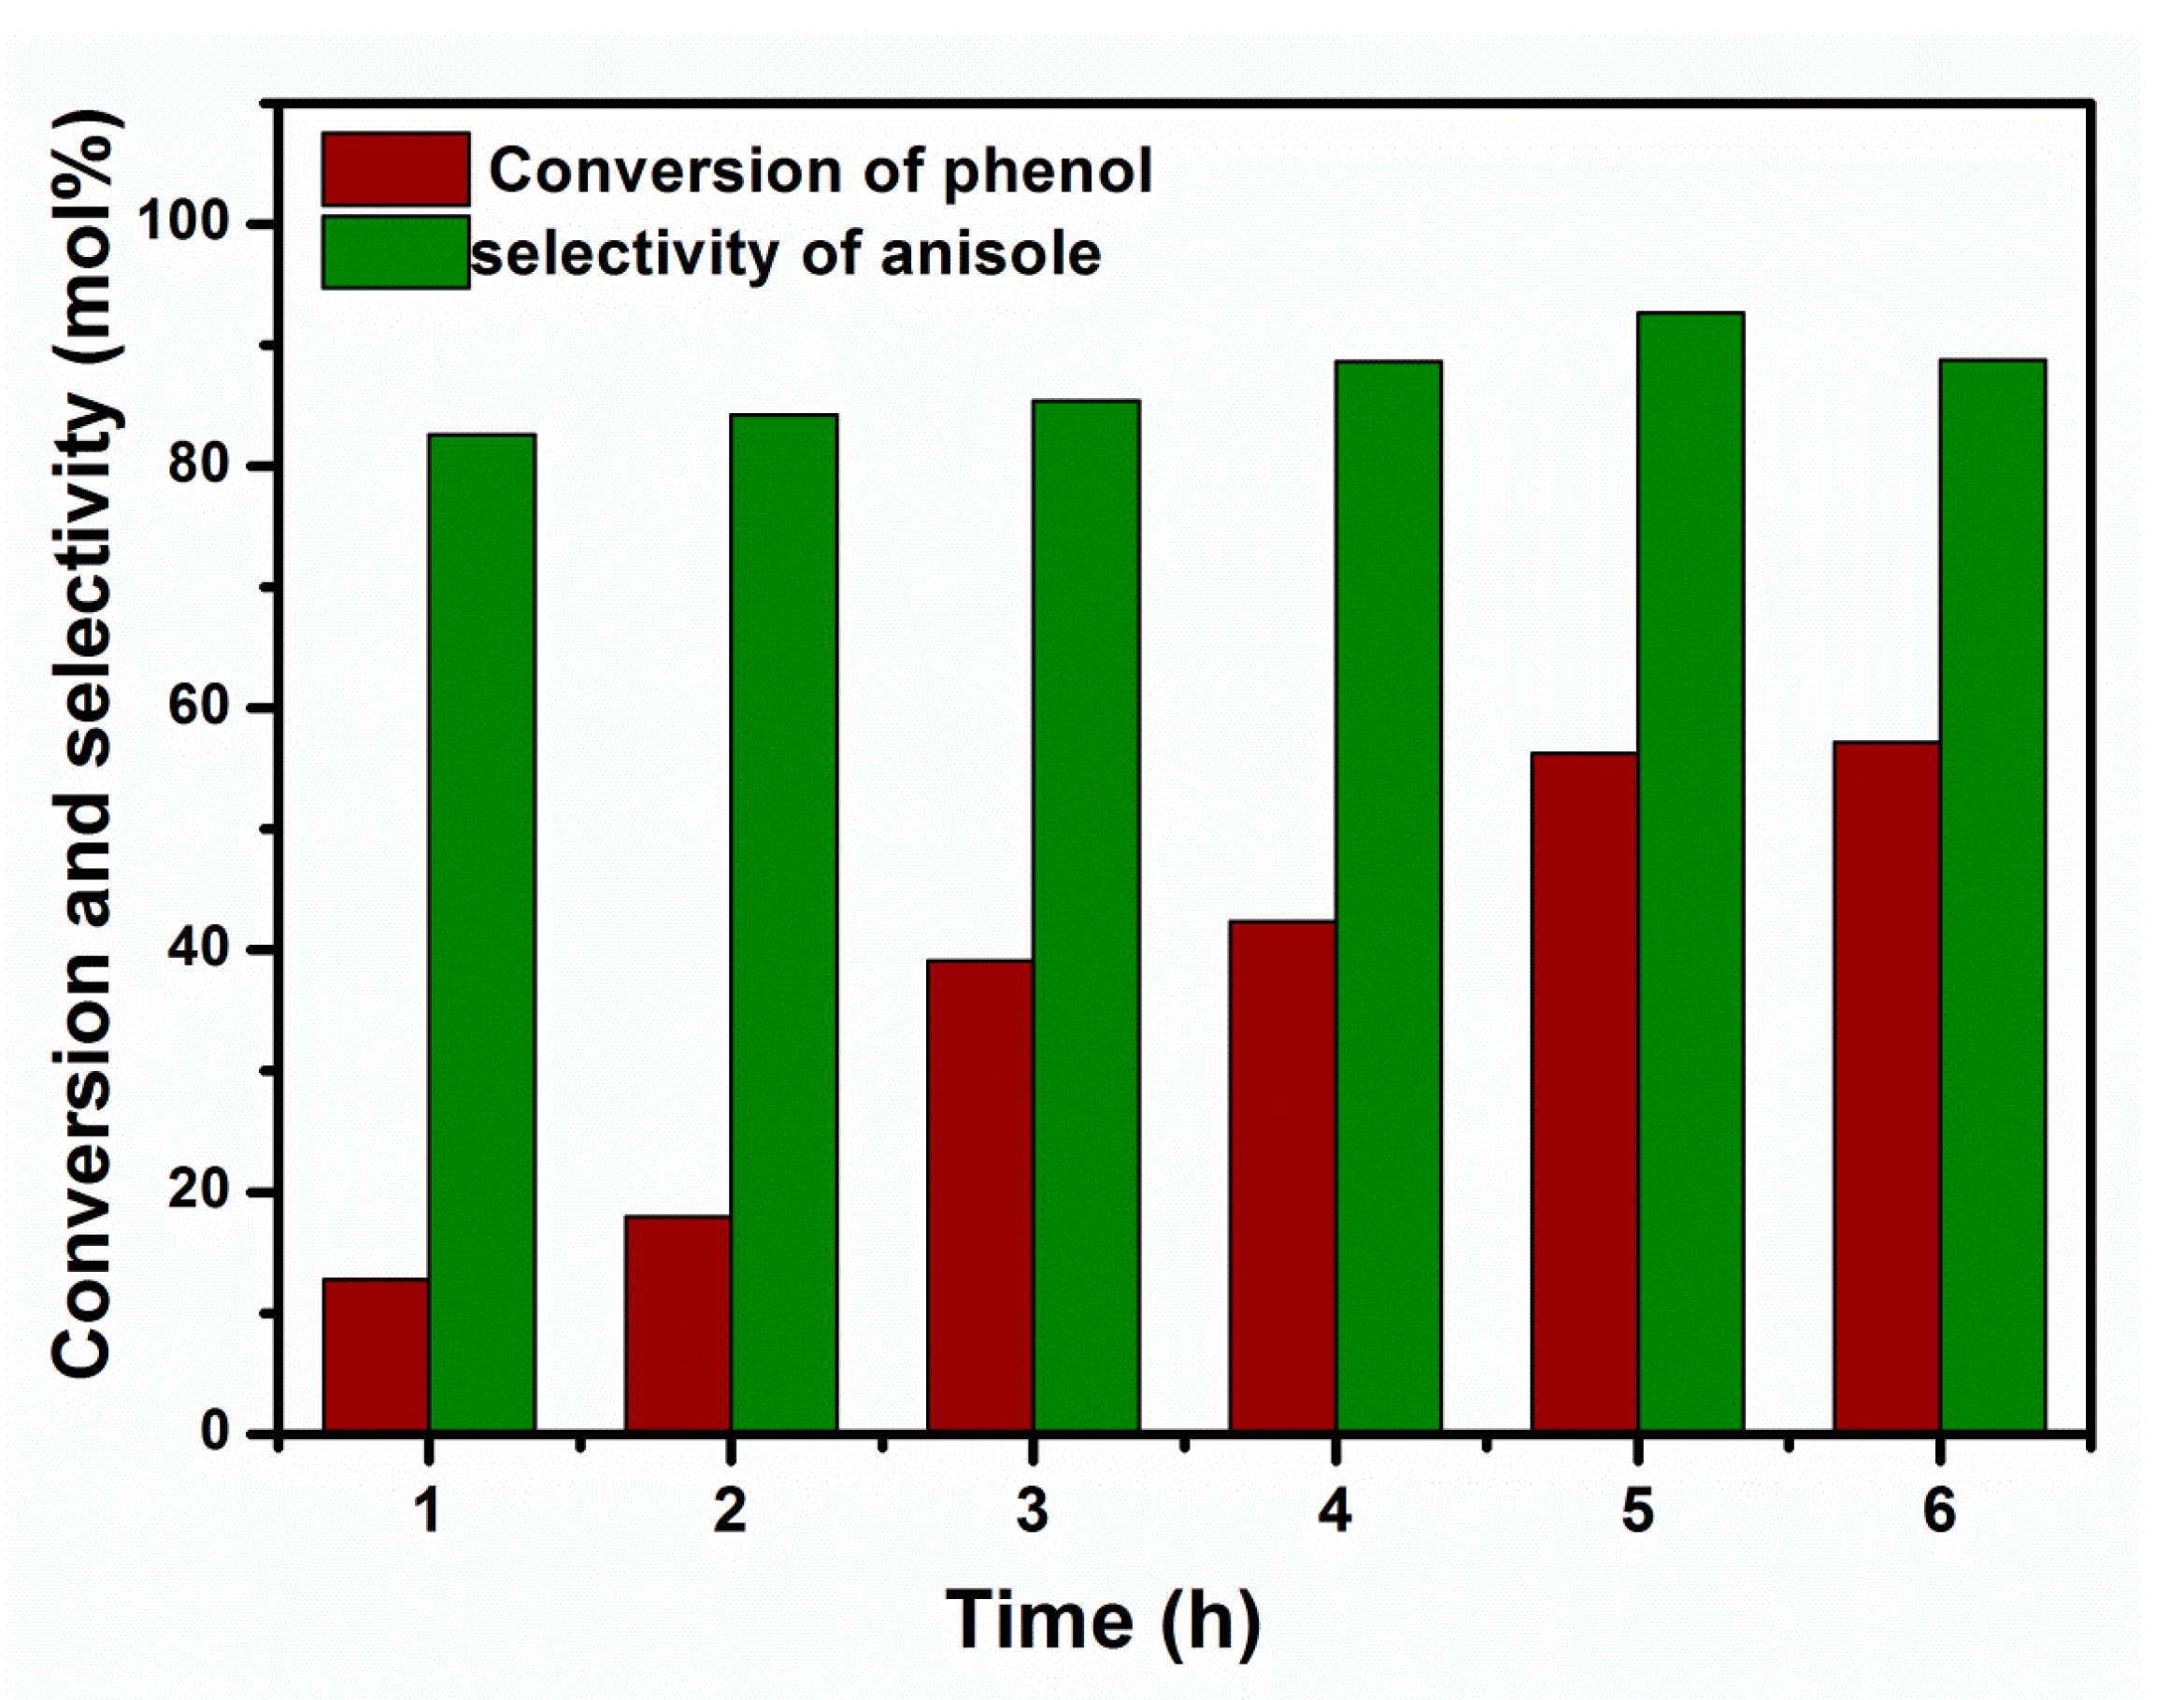
3.4. Effect of Reaction Time
To check the optimum reaction time, we investigated the catalytic activity with different reaction times (1–6 h) shown in Figure 10. The conversion of phenol and selectivity towards anisole increased with an increase in the time up to 5 h. With a further increase in time, we noticed a decrease in the anisole selectivity.
3.5. Recyclability Test
The stability of the catalyst performed four consecutive cycles, shown in Figure 11. There was no substantial decrease in the selectivity after three cycles, which may be due to the surface-active site covered by substrate.
4. Conclusions
In this work, we demonstrated scalable and reproducible PTA on γ-Al2O3 catalysts prepared by the wet impregnation method. DME was used as an alkylating agent for the first time to achieve high selectivity towards anisole. The enhanced selectivity towards anisole production is caused by increased dispersion of PTA across alumina support and a combination of more Lewis acidic sites than Brønsted acidic sites. Our results conclude that 30 PTA catalysts give excellent conversion of phenol (mole %) and selectivity of anisole (mole %) by using DME. as an alkylating agent at optimized reaction conditions.
Author Contributions
Conceptualization, M.S. and R.T.; Methodology, M.S. and A.B.; Software, M.S.; Validation, M.S. and R.T.; Formal analysis, M.S., S.P.M. and M.P.; Resources, M.S., P.G. and G.M.; Writing—original draft preparation, M.S.; Writing—review and editing, R.T.; Supervision, R.T.; Project administration, R.T. All authors have read and agreed to the published version of the manuscript.
Funding
This research received no external funding.
Institutional Review Board Statement
Not applicable.
Informed Consent Statement
Not applicable.
Data Availability Statement
Not applicable.
Acknowledgments
We acknowledge Satyapaul A Singh, department of chemical engineering, BITS- Pilani, Hyderabad campus, India for his active discussions and suggestions.
Conflicts of Interest
The authors declare no conflict of interest.
References
- Chada, R.R.; Enumula, S.S.; Reddy, S.; Gudimella, M.; Kamaraju, S.R.; Burri, D.R. Direct and Facile Synthesis of LaPO4 Containing SBA-15 Catalyst for Selective O-Methylation of Phenol to Anisole in Continuous Process Microporous and Mesoporous Materials; Elsevier: Amsterdam, The Netherlands, 2020; Volume 300, pp. 110–144. [Google Scholar]
- Wang, H.; Wang, D.; Wang, K.; Luo, G.S. Continuous synthesis of anisole in microreactor system. CIESC J. 2019, 70, 922–928. [Google Scholar]
- Mossman, A.B. Catalytic Etherification of Phenols to Alkyl Aryl Ethers. U.S. Patent 4,675,454, 23 June 1987. [Google Scholar]
- Cazorla, C.; Pfordt, E.; Duclos, M.C.; Etay, E.M.; Lemaire, M. O-Alkylation of phenol derivatives via a nucleophilic substitution. Green Chem. 2011, 13, 2482–2488. [Google Scholar] [CrossRef]
- Tian, M.; Mccormick, R.L.; Ratcliff, M.A.; Luecke, J.; Yanowitz, J.; Glaude, P.A.; Uijpers, M.; Boot, M.D. Performance of lignin derived compounds as octane boosters. Fuel 2017, 189, 284–292. [Google Scholar] [CrossRef] [Green Version]
- Muley, P.D.; Wang, Y.; Huc, J.; Shekhawata, D. Microwave-Assisted Heterogeneous Catalysis; S.P.R.–Catalysis; R.S.C.: London, UK, 2021; Volume 33, pp. 1–37. [Google Scholar]
- Brgeot, N.F.; Raushel, J.; Sandrock, D.L.; Dreher, S.D.; Molander, G.A. Rapid and efficient access to secondary Arylmethylamines. Chem. Eur. J. 2012, 18, 9564–9570. [Google Scholar] [CrossRef] [PubMed] [Green Version]
- Bhatkar, A.; Mane, S.; Mekala, S.P.; Gogoia, P.; Mohapatra, G.; Ramakrishnan, A.; Marimuthu, P.; Raja, T. Microwave-assisted selective N-alkylation of aniline over molybdenum supported catalyst. Cat. Commun. 2022, 168, 106464. [Google Scholar] [CrossRef]
- Samolada, M.C.; Grigoriadou, E.; Kiparissides, Z.; Vasalos, I.A. Selective O-Alkylation of Phenol with Methanol over Sulfates Supported on γ-Al2O3. J. Catal. 1995, 152, 52–62. [Google Scholar] [CrossRef]
- Farcasiu, D. Etherification of Phenol. U.S. Patent 4,487,976, 11 December 1984. [Google Scholar]
- Dang, D.; Wang, Z.; Lin, W.; Song, W. Synthesis of anisole by vapor phase methylation of phenol with methanol over catalysts supported on activated alumina. Chin. J. Catal. 2016, 37, 720–726. [Google Scholar] [CrossRef]
- Paranjpe, K.Y. Alpha, Beta and Gamma Alumina as a catalyst—A Review. Pharma Innov. J. 2017, 6, 236–238. [Google Scholar]
- Sad, M.E.; Padró, C.L.; Apesteguía, C.R. Study of the phenol methylation mechanism on zeolites HBEA, HZSM5 and HMCM22. J. Mol. Catal. A Chem. 2010, 327, 63–72. [Google Scholar] [CrossRef]
- Shu, J.; Wang, Z.; Zhang, Z.; Ding, Y.; Zhang, Q.; Gao, W.; Liu, G.; Yang, Y. High-Performance Na-CH3ONa/γ-Al2O3 Catalysts for High-Efficiency Conversion of Phenols to Ethers. ACS Omega 2022, 7, 10985–10993. [Google Scholar] [CrossRef]
- Wu, W.; Wan, Z.; Chen, W.; Zhu, M.; Zhang, D. Synthesis of mesoporous alumina with tunable structural properties. Microporous Mesoporous Mater. 2015, 217, 12–20. [Google Scholar] [CrossRef]
- Kooti, M.; Afshari, M. Phosphotungstic acid supported on magnetic nanoparticles as an efficient reusable catalyst for epoxidation of alkenes. Mater. Res. Bull. 2012, 47, 3473–3478. [Google Scholar] [CrossRef]
- Lakshmi, M.S.; Wabaidur, S.M.; Alothman, Z.A.; Johan, M.R.; Ponnusamy, V.K.; Dhanusuraman, R. Phosphotungstic acid-Titania loaded polyaniline nanocomposite as efficient methanol electro-oxidationcatalyst in fuel cells. Int. J. Energy Res. 2021, 45, 8243–8254. [Google Scholar] [CrossRef]
- Ganbavle, V.V.; Kim, J.H.; Rajpure, K.Y. Effect of Substrate Temperature on the Properties of Sprayed WO3 Thin Films Using Peroxotungstic Acid and Ammonium Tungstate: A Comparative Study. J. Electron. Mater. 2015, 44, 874–885. [Google Scholar] [CrossRef] [Green Version]
- Huang, B.; Bartholomew, C.H.; Woodfield, B.F. Facile structure-controlled synthesis of mesoporous γ-alumina: Effects of alcohols in precursor formation and calcinations. Microporous Mesoporous Mater. 2013, 177, 37–46. [Google Scholar] [CrossRef]
- Vadivelmurugan, A.; Anbazhagan, R.; Arunagiri, V.; Lai, J.Y.; Tsai, H.C. Pluronic F127 self-assembled MoS2 nanocomposites as an effective glutathione responsive anticancer drug delivery system. RSC Adv. 2019, 9, 25592–25601. [Google Scholar] [CrossRef] [Green Version]
- Qing, H.S.; Ye, Y.J.; Xin, S.; Ling, G.A.; Chun, H.J. Experimental and theoretical research on catalytic synthesis of thiophene from furan and H2S. Braz. J. Chem. Eng. 2011, 28, 1146–1152. [Google Scholar]
- Li, W.; Jin, G.; Hu, H.; Li, J.; Yang, Y.; Chen, Q. Phosphotungstic acid and WO3 incorporated TiO2 thin films as novel photoanodes in dye-sensitized solar cells. Electrochim. Acta 2015, 153, 499–507. [Google Scholar] [CrossRef]
- Xie, F.Y.; Gong, L.; Liu, X.; Tao, Y.T.; Zhang, W.H.; Chen, S.H.; Meng, H.; Chen, J. XPS studies on surface reduction of tungsten oxide nanowire film by Ar+ bombardment. J. Electron Spectrosc. Relat. Phenom. 2012, 185, 112–118. [Google Scholar] [CrossRef]
- Yue, D.; Lei, J.; Lina, Z.; Zhenran, G.; Du, X.; Li, J. Three-dimensional ordered macroporous HPW/titania–alumina catalysts for catalytic oxidative desulfurization of fuels. J. Porous Mater. 2019, 26, 133–144. [Google Scholar] [CrossRef]
- Jia, W.; Wu, Q.; Lang, X.; Hu, C.; Zhao, G.; Li, J.; Zhu, Z. Influence of lewis acidity on catalytic activity of the porous alumina for dehydrofluorination of 1, 1, 1, 2-tetrafluoroethane to trifluoroethylene. Catal. Lett. 2015, 145, 654–661. [Google Scholar] [CrossRef]
- El Rahman, A.; Khder, S.; Hassan, H.M.A.; El-Shall, M.S. Acid catalyzed organic transformations by heteropoly tungstophosphoric acid supported on MCM-41. Appl. Catal. A Gen. 2012, 411, 77–86. [Google Scholar]
- Ma, T.; Ding, J.; Shao, R.; Xu, W.; Yun, Z. Dehydration of glycerol to acrolein over Wells–Dawson and Keggin type phosphotungstic acids supported on MCM-41 catalysts. Chem. Eng. J. 2017, 316, 797–806. [Google Scholar] [CrossRef]
Scheme 1.
Phenol to anisole reaction.

Figure 1.
XRD pattern of various amount of phosphotungstic acid in the catalyst.

Figure 2.
HR-TEM images of: (1a) γ-Al2O3, (1b) PTA, and (1c) 30 PTA on γ-Al2O3. (2a,2b) Selected area of 30 PTA and STEM elemental mapping of 30 PTA. (2c) Dispersion of Metals in the catalyst TEM image of (2d) 40 PTA on γ-Al2O3. (2e) 50 PTA on γ-Al2O3.
Figure 2.
HR-TEM images of: (1a) γ-Al2O3, (1b) PTA, and (1c) 30 PTA on γ-Al2O3. (2a,2b) Selected area of 30 PTA and STEM elemental mapping of 30 PTA. (2c) Dispersion of Metals in the catalyst TEM image of (2d) 40 PTA on γ-Al2O3. (2e) 50 PTA on γ-Al2O3.

Figure 3.
FE-SEM images of: (a) γ-Al2O3; (b) PTA; (c) 30 PTA on γ-Al2O3; (d) 40 PTA on γ-Al2O3; and (e) 50 PTA on γ-Al2O3.
Figure 3.
FE-SEM images of: (a) γ-Al2O3; (b) PTA; (c) 30 PTA on γ-Al2O3; (d) 40 PTA on γ-Al2O3; and (e) 50 PTA on γ-Al2O3.

Figure 4.
N2 adsorption–desorption isotherms of synthesized catalysts.

Figure 5.
XPS W 4f, O1s, and γ-Al2O3 core level spectra of the tungsten oxide deposited on γ-Al2O3: (a) W 4+, W5+, and W6+ in 30 PTA; (b) O1s in 30 PTA, 40 PTA, and 50 PTA; and (c) shows the XPS W 4f spectra of γ-Al2O3 in 30 PTA, 40 PTA, and 50 PTA.
Figure 5.
XPS W 4f, O1s, and γ-Al2O3 core level spectra of the tungsten oxide deposited on γ-Al2O3: (a) W 4+, W5+, and W6+ in 30 PTA; (b) O1s in 30 PTA, 40 PTA, and 50 PTA; and (c) shows the XPS W 4f spectra of γ-Al2O3 in 30 PTA, 40 PTA, and 50 PTA.

Figure 6.
Pyridine FTIR of 20 PTA, 30 PTA, 40 PTA, and 50 PTA catalysts.

Figure 7.
Catalyst performance at 0.2 g loading at 280 °C for 5 h. * For Amberlyst-35 reaction carried out at 145 °C for 5 h.
Figure 7.
Catalyst performance at 0.2 g loading at 280 °C for 5 h. * For Amberlyst-35 reaction carried out at 145 °C for 5 h.

Figure 8.
Performance study of the best catalyst against thermodynamic equilibrium calculated from Aspen HYSYS.
Figure 8.
Performance study of the best catalyst against thermodynamic equilibrium calculated from Aspen HYSYS.

Figure 9.
Conversion and selectivity of the catalyst at various ratios of phenol to DME and its thermodynamic equilibrium calculated from Aspen HYSYS.
Figure 9.
Conversion and selectivity of the catalyst at various ratios of phenol to DME and its thermodynamic equilibrium calculated from Aspen HYSYS.

Figure 10.
Time on stream study of catalyst.

Figure 11.
Recyclability study of the best catalyst at optimized reaction condition.


Table 1.
Physiochemical studies of synthesized catalysts.
| Sr.no | Catalyst | Surface Area (m2/g) | Pore Volume (cc/g) | Average Diameter (nm) |
|---|---|---|---|---|
| 1 | γ-Al2O3 | 250 | 0.8 | 1.8 |
| 2 | 10 PTA | 208.647 | 0.3597 | 0.6482 |
| 3 | 30 PTA | 180.570 | 0.2762 | 0.5496 |
| 4 | 40 PTA | 115.575 | 0.2171 | 0.5520 |
| 5 | 50 PTA | 98.985 | 0.1986 | 0.6421 |
Publisher’s Note: MDPI stays neutral with regard to jurisdictional claims in published maps and institutional affiliations. |
© 2022 by the authors. Licensee MDPI, Basel, Switzerland. This article is an open access article distributed under the terms and conditions of the Creative Commons Attribution (CC BY) license (https://creativecommons.org/licenses/by/4.0/).
Share and Cite
MDPI and ACS Style
Samruddhi, M.; Bhatkar, A.; Prabu, M.; Mekala, S.P.; Gogoi, P.; Mohapatra, G.; Thirumalaiswamy, R. Selective O-alkylation of Phenol Using Dimethyl Ether. Reactions 2022, 3, 602-614. https://doi.org/10.3390/reactions3040040
AMA Style
Samruddhi M, Bhatkar A, Prabu M, Mekala SP, Gogoi P, Mohapatra G, Thirumalaiswamy R. Selective O-alkylation of Phenol Using Dimethyl Ether. Reactions. 2022; 3(4):602-614. https://doi.org/10.3390/reactions3040040
Chicago/Turabian StyleSamruddhi, Mane, Akash Bhatkar, Marimuthu Prabu, Siva Prasad Mekala, Pranjal Gogoi, Gourab Mohapatra, and Raja Thirumalaiswamy. 2022. "Selective O-alkylation of Phenol Using Dimethyl Ether" Reactions 3, no. 4: 602-614. https://doi.org/10.3390/reactions3040040