Evaluating the Impact of Engineering Works in Megatidal Areas Using Satellite Images—Case of the Mont-Saint-Michel Bay, France


Faculty of Science, Université de Reims Champagne-Ardenne, UR 3795 GEGENAA, 51100 Reims, France
GeoHazards 2023, 4(4), 453-474; https://doi.org/10.3390/geohazards4040026
Submission received: 16 September 2023
/
Revised: 4 November 2023
/
Accepted: 8 November 2023
/
Published: 10 November 2023
Abstract
:The Mont-Saint-Michel is known worldwide for its unique combination of the natural site and the Medieval abbey at the top of the rocky islet. But the Mont is also located within an estuarine complex, which is considerably silting up. For two decades, large-scale works were planned to prevent the Mont from being surrounded by the expanding salt meadows. The construction of a new dam over the Couesnon River, the digging of two new channels, and the destruction of the causeway were the main operations carried out between 2007 and 2015. The remote sensing approach is fully suitable for evaluating the real impact of the engineering project, particularly the expected large-scale hydrosedimentary effects of reestablishing the maritime landscape around the Mont. The migration of the different channels and the erosion-progradation balance of the vegetation through space and time are the main features to study. Between 2007 and 2023, the erosion of the salt meadows was significant to the south-west of the Mont but more limited to the south-east. During the same period, the sedimentation considerably increased to the north-east of the Bay, which seems to be facing the same silting-up problem. At this stage, the remote-sensing survey indicates mixed results for the engineering project.
1. Introduction
Tidal flats are a widespread morphology and ecosystem along all coasts characterized by low-sloping and being influenced by the tide [1,2]. These areas are alternately covered and uncovered by seawater. Fieldwork is difficult, if not impossible, because of difficulties such as walking slowly, crossing channels, the risk of getting stuck during the flood, sinking in mud, etc. In temperate climate zones, tidal flats include a vegetation fringe in the uppermost part known as the ‘schorre’, and mineral surfaces corresponding to the main part known as the ‘slikke’. Due to the tidal currents, the fine particles are trapped in the ‘schorre’, whereas the ‘slikke’ presents a gradient from fine to medium sand (Figure 1).
Rising sea levels and human pressure are transforming tidal flats into a particularly sensitive environment. Moreover, any facility induces local and regional consequences. In China, the extension of the port facilities disrupts sedimentation along the Yellow Sea coast [3]. A beach nourishment project in Louisiana (USA) had impacts on the dynamics of the shoreline made of mangroves and marshes [4].
Optical and radar remote sensing are particularly suitable for studying tidal flats [5,6,7]. Some areas have been deeply investigated, such as the Wadden Sea. A navigational X-Band radar was used to monitor the placement of millions of m3 ebb-tidal delta nourishment [8]. In the German part of the Wadden Sea, the mapping of seagrass beds using an automated classification has been described [9]. In the Dutch part, the Sentinel-2 spectral bands were used to predict sediment characteristics such as median grain size or silt content [10]. Studies on the British flats such as the Wash, the Bristol Channel, and particularly Morecambe Bay also demonstrate the effectiveness of remote sensing for measuring long-term morphological change in the tidal flats [11]. Asian tidal flats such as the Korean coast [12], the coast of Jiangsu Province, China [13], or the Red River estuary in Vietnam [14] have been investigated more recently, and the studies show an interest in waterline methods or different classification methods. In France, the Arcachon Basin [15], the Baie des Veys [16] and the Mont-Saint-Michel Bay [17,18] have been extensively studied. The present paper deals with the Mont-Saint-Michel Bay, which has been monitored for two decades due to outstanding engineering work to restore the maritime character of the Mont. Remote sensing is the main tool, combined with some field observations.
In this paper, we examine the complex processes occurring in a macrotidal bay, including tidal characteristics (range, regime), sedimentation, vegetation characteristics and dynamics, and large-scale anthropogenic influence. The main question is to understand, in a period of sea level rise and positive sediment balance, whether engineering works based on different models have the expected effects on the immediate environment. Next, it is important to see whether areas further away from the Mont are also affected and to what extent. The focus is on the benefit of a remote sensing database including time-series satellite images.
2. Materials and Methods
2.1. Study Site
The Mont-Saint-Michel Bay along the Channel is a megatidal embayment located in the northwestern part of France [19,20,21,22,23,24]. It is spread over two French regions: Brittany to the west and Normandy to the east. The size of the bay is about 500 km2, including 300 km2 of tidal flats during the spring low tides and 40 km2 of salt marshes locally called les Herbus (Figure 2). The Mont is in the southeastern part of the bay, within an estuarine complex of about 80 km2, mainly composed of the Couesnon, Sée, and Sélune rivers (Figure 2). It is a circular granitic islet about 250 m in diameter, culminating at 46 m and capped by the Medieval abbey.
The bay has a semidiurnal tide, with a spring tidal range of about 13 m (exceptionally 14 m) and a neap tidal range of 4 m as observed at the Cancale gauge station. The water height varies during half a lunar month (about 29.5 days), separating two dead water slacks. Due to the barrier effect of the Cotentin peninsula, the ebb is always longer than the flood, and this latter reaches high speed during spring tides (up to 4 m/s). Tidal flats dominate up to about 15 km offshore.
2.2. The Sediments in the Bay
The Mont-Saint-Michel tidal flats include four main environments [21]. In the internal part of the embayment, the Mont and the Tombelaine islets are located within the estuarine complex, where the outlets of the Sée, Sélune, and Couesnon River estuaries converge. A lot of creeks drain water from the salt meadows. The thickness of recent sediments overlaying the bedrock ranges between 14 m and 20 m [21]. The sediments are fine to very fine sand and calcareous sandy shelly mud locally known as the ‘tangue’ (I, Figure 2, see also Figure 1). In the centre, a tidal delta fan is the continuation of the estuarine complex. It is mainly composed of fine sand cut by large tidal channels (II, Figure 2). In the northeast part, close to the Bec d’Andaine, a sandy barrier beach extends between Saint-Jean-le-Thomas and Genêts (III, Figure 2). In the southwest part, particularly between Saint-Benoît-des-Ondes and Cherrueix, the bottom of the bay is very gently sloping. The sediments range from mud and silty sand to shell bars. The Hermelles Bank, a reef built by annelid worms, lies in the lower part of the tidal flat (IV, Figure 2).
2.3. Restoring the Maritime Character of Mont-Saint-Michel
For two centuries (1769–1969), all interventions contributed to the silting up of the bay and to the development of the polder surfaces [18,25]. The Couesnon River was channelized in 1863 (Figure 3, 1952, Cchl and Cchr), and the diking of the polders to the west of the Mont launched in 1769 was achieved in 1933 (d and pw). A tidal power plant project between Cancale and the Chausey Islands, situated 20 km off the coast, was abandoned in the 1950s. A dam (Barrage de la Caserne) was built over the Couesnon River in 1969 (Figure 3, 1986, CaD), mainly to drain the surrounding marshes. The dam represented the last facility contributing to the silting-up.
The re-establishment of the maritime character of Mont-Saint-Michel is a long-term operation. The question of the insularity of the Mont was put back on the agenda in 1966 during the celebration of the abbey’s first millenium. Studies were launched as early as 1972 by the Laboratoire central d’hydraulique de France (LCHF). Recommendations resulted in considerable and wide-ranging works, including two new dams, the storage of one million cubic metres of water in the restored Couesnon channel, two seven hundred thousand cubic metres of reservoirs close to the coast, and the restoration of the Guintre and Ruisseau Landais river mouths. The Roche Torin dike in the southeastern part of the bay was cut flush in 1983–1984, but the other recommendations were not followed up. The Mission du Mont-Saint-Michel created in 1989 considered new solutions based on a scale model developed by SOGREAH [26,27]. The work had to be concentrated around the Mont and more respectful of the environment. The political decision by the French government was taken in March 1995. The development phase, including the public inquiry, was completed in 2003 and identified the project’s main potential effects on the environment. The work whose effects are studied here began only in 2007, when the meadow extension was critical and the Mont seemed to be caught in a pincer (Figure 3, 2003).
The main facility is a new dam with flood tide gates over the Couesnon River, completed as early as May 2009 (Figure 3, 2007, CoD). This dam replaces the 1969 dam and is associated with the ‘Anse de Moidrey’ upstream reservoir (Figure 2, AM), completed in 2014, to restore the Couesnon’s hydraulic capacity and move sediment away from the Mont. In 2010–2013, a landscaped car park, reception and service buildings, the pedestrian footbridge (760 m long, pf), and the new causeway (1085 m long, ncw) were built. Hydraulic developments downstream of the dam took place between 2011 and 2015, with the construction of the West channel in 2012 (Figure 3, 2015, Cwc) and the East channel in 2015 (Figure 3, 2016, Cec) separated by a spur (sp) composed of the bulkheads formerly protecting the Couesnon riverbanks. In 2015, the main phase of the works was achieved with the destruction of the old causeway (dcw), which was built in 1879 and since then blocked the tidal currents and played a major role in silting up around the Mont.
2.4. Previous Remote Sensing Studies
The Mont-Saint-Michel Bay was used as a reference area for several remote-sensing experiments. A Spot image acquired in 1986 was the background for the geological mapping [21]. The Optical Sensor onboard JERS appeared to be able to detect carbonate responses, especially suspended particles in the turbid plumes [17]. The evolution between 1986 and 1995 surveyed with Spot images showed the development of the salt meadows [28]. Seminal lidar works were carried out for the study of the vegetation of the schorre [29]. More recently, lidar data have been acquired close to the Mont to control the efficiency of the new facilities [30] and to study facies models for tidal point bars lacking a three-dimensional perspective [31].
3. Methods
3.1. Acquisition of Remote Sensing Data
Aerial photographs are widely used (Figure 3), but the revisit time is too large (usually one to five years) for a regular survey. The method developed in the present approach deals with the use of time-series satellite images. Due to the size of the main features, only resolutions (or pixel sizes) up to 20 m are considered. The survey of the environment of the Mont is carried out before, during, and after the facilities were built. The latter ranged from 2007 to 2015. Therefore, we used two data sets. The main data set is composed of 205 Sentinel 2 (115 S2A, 90 S2B) images from the European Space Agency satellites launched on 23 June 2015 (S2A) and 7 March 2017 (S2B), respectively. The selected S2 images correspond to the code T30UXV according to the Sentinel-2 UTM tiling grid. They were acquired between 1 August 2015, and 10 October 2023. These cloud-free images represent 20% of the 1027 S2 images acquired during the period. About 74% of satellite images show cloud cover greater than 25%. The S2-images present a 10 m resolution available for the blue (b2: 497 nm), green (b3: 560 nm), red (b4: 664 nm), and near IR (b8: 835 nm) ranges, or a 20 m resolution also including the red edge (b5: 704 nm; b6: 740 nm; b7: 782 nm), mid- (b11: 1614 nm) and short-wave IR (b12: 2202 nm) ranges. The images cover the whole post-work period (the eastern channel was achieved in May 2015) with a high revisit time: theoretically, one image every 2.6 days on average; in the database, one image every 15 days on average because of the cloud cover.
The Advanced Spaceborne Thermal Emission and Reflection Radiometer (Aster) images are acquired onboard Terra, a joint mission within NASA’s Earth Science Enterprise launched on 18 December 1999. The Aster data were used especially for the period prior to the works, although the sensor is still operating in 2023. Twelve images ranging from 7 April 2000 to 22 September 2017 were selected. The sensor comprises three bands in the green (b1: 560 nm), red (b2: 660 nm), and near-IR (b3N: 820 nm) ranges with a 15 m space resolution. The other spectral bands in the mid- and short-wave IR offer a coarser resolution at 30 m and are not used in the present study. The Aster VNIR sensor requires resampling and geometric correction to render the images in the same geometry as the S2 images.
The ALOS-1 satellite was launched on 24 January 2006 and was declared dead in orbit on 12 May 2011, after abruptly powering down and turning off all the observation devices. ALOS carried three sensors: the Phased Array L-band Synthetic Aperture Radar (PALSAR), the Panchromatic Remote-Sensing Instrument for Stereo Mapping (PRISM), and the Advanced Visible and Near-Infrared Radiometer type 2 (AVNIR-2). This latter has been used in the present study. It comprised four bands in the blue (b1: 460 nm), green (b2: 560 nm), red (b3: 650 nm), and near-IR (b4: 825 nm) ranges with a 10 m space resolution. The scene acquired on 24 October 2007 was included in the database because it represents the lowest height of the sea at the time of acquisition (2.56 m) and fills the lack of Aster data at the time of the new dam construction. ALOS-2 launched in 2014 had optical cameras removed to reduce costs, and ALOS-3, including an enhanced optical sensor, was unsuccessfully launched in March 2023.
Other archive satellite data have been consulted, particularly Landsat Thematic Mapper (TM) images covering the last four decades with a resolution of 30 m. Most of the digital processing, such as resizing, registration, layer stacking, region of interest selection, or statistic computation, was carried out using the ENVI Classic software.
3.2. Definition of the Tidal Parameters and Satellite Data Pre-Processing
Sentinel-2 Level-1C products were corrected using Sen2Cor for atmospheric scattering and absorbance, delivering a Level-2A product [32]. All 201 satellite images were geo-registered with the Universal Transversal Mercator coordinates (WGS84, UTM zone 30 U) and geometrically corrected using the nearest neighbour’s re-sampling method (pixel size = 10 m). They were brought together in a database comprising the date of acquisition, the UTC hour, the sensor (Sentinel 2A, 2B, ALOS-AVNIR-2, or Terra-Aster), the flood, ebb, or slack water status, the place in the half-a-lunar month cycle, and the height of the sea provided by the French Service Hydrographique et Océanographique de la Marine (SHOM). A correction of the standard height is necessary by considering the actual atmospheric pressure at the time of acquisition [24]. A difference from the average of 1 hPa causes a difference of 1 cm in elevation (standard conditions are defined at 1013.25 hPa). The actual pressure in the bay area ranges from 989 to 1044 hPa, with an average value of 1022 hPa.
The time-series satellite images are useful for the temporal survey of the bay. The evaluation of the sedimentary balance necessitates identifying pairs or triplets of images acquired under the same hydrographic conditions but on different dates and, if possible, the furthest apart in time. The database indicates that these comparisons are relatively difficult to establish. The tidal parameters play a major role in this approach.
3.3. Spectral Ranges
The choice of spectral ranges to be used depends on the reflectance of the main objects on the surface of the tidal flats. Basically, three main landscape units can be distinguished. 1. The water bodies, including clear water off the estuarine complex and turbid water in the estuaries and channels; 2. the sediments forming large sandbanks, for which moisture is the main feature to be considered; 3. the vegetation, which is rare at the surface of the tidal flat (some red algae, for example) but covers the schorre and the salt meadows. To show which spectral ranges are relevant, six areas of interest have been defined using the S2 scene from 20 October 2022 and the statistics (mean + standard deviation) for each band have been computed. They are provided as surface reflectance according to the level-2A delivered by the European Space Agency (Table 1 and Figure 4).
The classic shape of the reflectance curves of the three main landscape units (water, vegetation, and mineral surfaces) can be observed. But it is also possible to underline the influence of one parameter on each landscape unit. Water surfaces are mainly influenced by turbidity, which tends to increase reflectance in all spectral ranges. This is particularly noticeable in the visible range (bands 2 to 5), with increases of 7 to 14%. The increase is significant in the red edge and near-infrared ranges (+9 to 6%), but negligible in the MIR and SWIR ranges (+0.4 and +0.3, respectively). In the case of the intertidal zone, mineral surfaces are mainly influenced by humidity. The drop in reflectance due to humidity is uniform in the visible to near-infrared range (+7 to 10%) and is more pronounced in the MIR (+18%) and SWIR ranges (+17%). The spectral response of vegetated surfaces depends mainly on the nature of the plants. The example shows the comparison of halophytic plant associations including pioneer plants such as the glassworts and the common cordgrass (vegetation Grand Banc) and salt meadow plant associations at higher altitudes dominated by the red fescue, the creeping bentgrass, and the sea couch (vegetation salt meadows). Reflectance in salt meadows is slightly higher, but with modulations ranging from +2% in the green spectral range (band 3) to +9% in the near infrared (band 8) and +10% in the MIR (band 11).
These results also indicate that tidal flats are difficult environments for using classical ratios such as the Normalised Difference Vegetation Index [NDVI = (NIR−Red)/(NIR + Red], the Normalised Difference Water Index [NDWI = (NIR−MIR)/(NIR + MIR)], or the Brighness Index [(Red2 + NIR2)1/2] (Table 1). For instance, the NDWI values are similar for turbid water and vegetation in the Grand Banc, which is characterised by a high moisture level (0.21–0.23). The NDVI classically distinguishes vegetation from the other landscape units (mineral, water), but the NDVI values are the same for clear water and humid sediments (−0.02). The Brightness Index does not allow separating turbid water and humid sediments (28–30) or dry sediments and vegetation of the Grand Banc (42–44). For these reasons, the analysis is mainly visual, based on coloured composites.
Four main colour composites were used.
- -
- The RGB true colour composite (R = red range, i.e., S2-band 4 or Alos-band 3; G = green range, i.e., S2-band 3 or Alos-band 2; B = blue range, i.e., S2-band 2 or Alos-band 1). Due to the lack of the blue range in the Aster data, the true colour composite cannot be obtained with this sensor. The true colour composite is interesting for a global approach of the tidal flats, but it is sometimes difficult to accurately detect the limit between the vegetation front (especially in wintertime), the humid sediments, and the water in the channels due to the turbidity (Figure 4, bands 2–4, turbid water and humid sediments).
- -
- The RGB standard false colour composite (R = near infrared range, i.e., S2-band 8 or Alos-band 4 or Aster-band 3N; G = red range, i.e., S2-band 4 or Alos-band 3 or Aster-band 2; B = green range, i.e., S2-band 3 or Alos-band 2 or Aster-band 1). The edge of the schorre is easier to detect on the standard false colour composite because the reflectance of vegetation is high in the near infrared (Figure 4, vegetation, band 8), whatever the season of acquisition. The contrast is less marked on the true colour composite.
- -
- A black-and-white image of the near infrared range (S2-band 8 or Alos-band 4 or Aster-band 3N). This image is better for distinguishing between water and humid sediments (Figure 4, band 8, turbid water and humid sediments).
- -
- A RGB false colour composite at 20 m resolution including only infrared ranges (R = near IR range, i.e., S2-band 8A; G = mid-IR range, i.e., S11-band 3; B = short waves IR range, i.e., S2-band 12). The IR false colour composite is useful for distinguishing between the waterbodies (black) and the land surfaces (clear), with the different kinds of vegetation in shades of red (Figure 4, bands 8–11–12, vegetation).
3.4. Mapping
The question of the drawing method is critical because the landscape units in the bay are deeply changing in time and space. The main objective of the project is to prevent the islet from being joined to the salt meadows. Thus, a large part of the schorre to the west and to the east of the Mont should be eroded. The time-series is mainly used for drawing the successive frontlines of the vegetation and to survey the courses of the Couesnon channels and those of the Sée-Sélune estuary as well. The S2-images chronicle is also used for detecting the movement of the main banks between two dates and to discuss the sedimentary balance in the estuarine complex. As previously indicated, the comparison between images can only be validly carried out in a mega tidal bay if the data has been acquired under identical tidal conditions. This step requires a detailed analysis of the tidal parameters, which is not necessarily as advanced in the case of coastline studies. The analysis is particularly necessary in the Mont-Saint-Michel Bay as there is no continuous tidal recording, and the standard height must therefore be systematically corrected.
Therefore, manual or semi-automatically drawn drawings have been developed. Finally, the main goal is to understand whether the hydraulic hypotheses are confirmed or not by the short-term evolution of the bay. From a methodological viewpoint, the database is used for identifying identical water elevation conditions with the same tidal parameters but separated by a certain period. Due to the very large meander divagation, it is difficult to use the classical waterline method [33] in the estuarine complex. Nevertheless, the method is evaluated here for detecting the movement of the banks and silting-up in the northeastern part of the bay.
The overall methodology is summarised in Figure 5.
4. Results
4.1. The Schorre (Vegetation Frontline)
Thirteen satellite images have been selected to cover the period from 2000 to the present. Nine Sentinel-2 images cover the post-work period (2015–2023), with one image per year considering the first (1 August 2015) and one of the last (8 April 2023) available S2 images. Four other satellite images, Aster and ALOS, cover the 2000–2012 period, i.e., before and during the works. The schorre was surveyed according to four areas: the so-called polders W, MSM W, MSM E, and polders E (Figure 5). MSM W and MSM E are located about 2 km from the Mont and are used to characterise the direct impact of the engineering works. Polders W and polders E allow surveying the global evolution at about 10 km to the west and 6 km to the east of the Mont.
In the period 2000–2007, the vegetation continued to expand and the schorre surface reached a maximum of about 2621 ha (see ‘Grand Total’ in Table 2). All areas are characterized by accretion, except for local erosion phenomena along the polders W. Between the beginning of the works in 2007 and the present (2023), the erosion of the salt meadows has been significant to the south-west of the Mont (−150 ha), but more limited to the south-east (−65 ha). The erosion effect is restricted to the environment close to the new facilities. The vegetation fringe along the dike is slightly increasing to the west (+35 ha for polders W) and to the east (+40 ha for polders E). For the period 2000 to 2023, the increase is higher in both the polders west (+80 ha) and the polders east (+70 ha), illustrating the trend known since the construction of the last dikes in the 1930s.
For the reason that the Couesnon River has been divided into two channels since May 2015, some small islands have developed in the central part (‘Couesnon’ in Table 2). These islands are covered by halophytic plants, but they currently represent less than 10 ha and are deeply influenced by human activities (mowing, trampling, etc.).
4.2. Evolution of the Channels
4.2.1. The Western Channel (Couesnon W, Figure 7)
The western channel corresponds to the former river course when the old causeway blocked any sedimentary transfer towards the east of the Mont. The western channel can occasionally erode the eastern area, as observed in May 2012 when the Couesnon River course circled the Mont and went along the eastern schorre for more than 500 m.
Figure 7.
Time-series Sentinel-2 data from 2015 to 2023 illustrating the changes in the hydrographic network (Sée-Sélune and Couesnon rivers) close to the Mont-Saint-Michel. Black and white images of the near infrared range (band 8). Date format is yyyymmdd.
Figure 7.
Time-series Sentinel-2 data from 2015 to 2023 illustrating the changes in the hydrographic network (Sée-Sélune and Couesnon rivers) close to the Mont-Saint-Michel. Black and white images of the near infrared range (band 8). Date format is yyyymmdd.
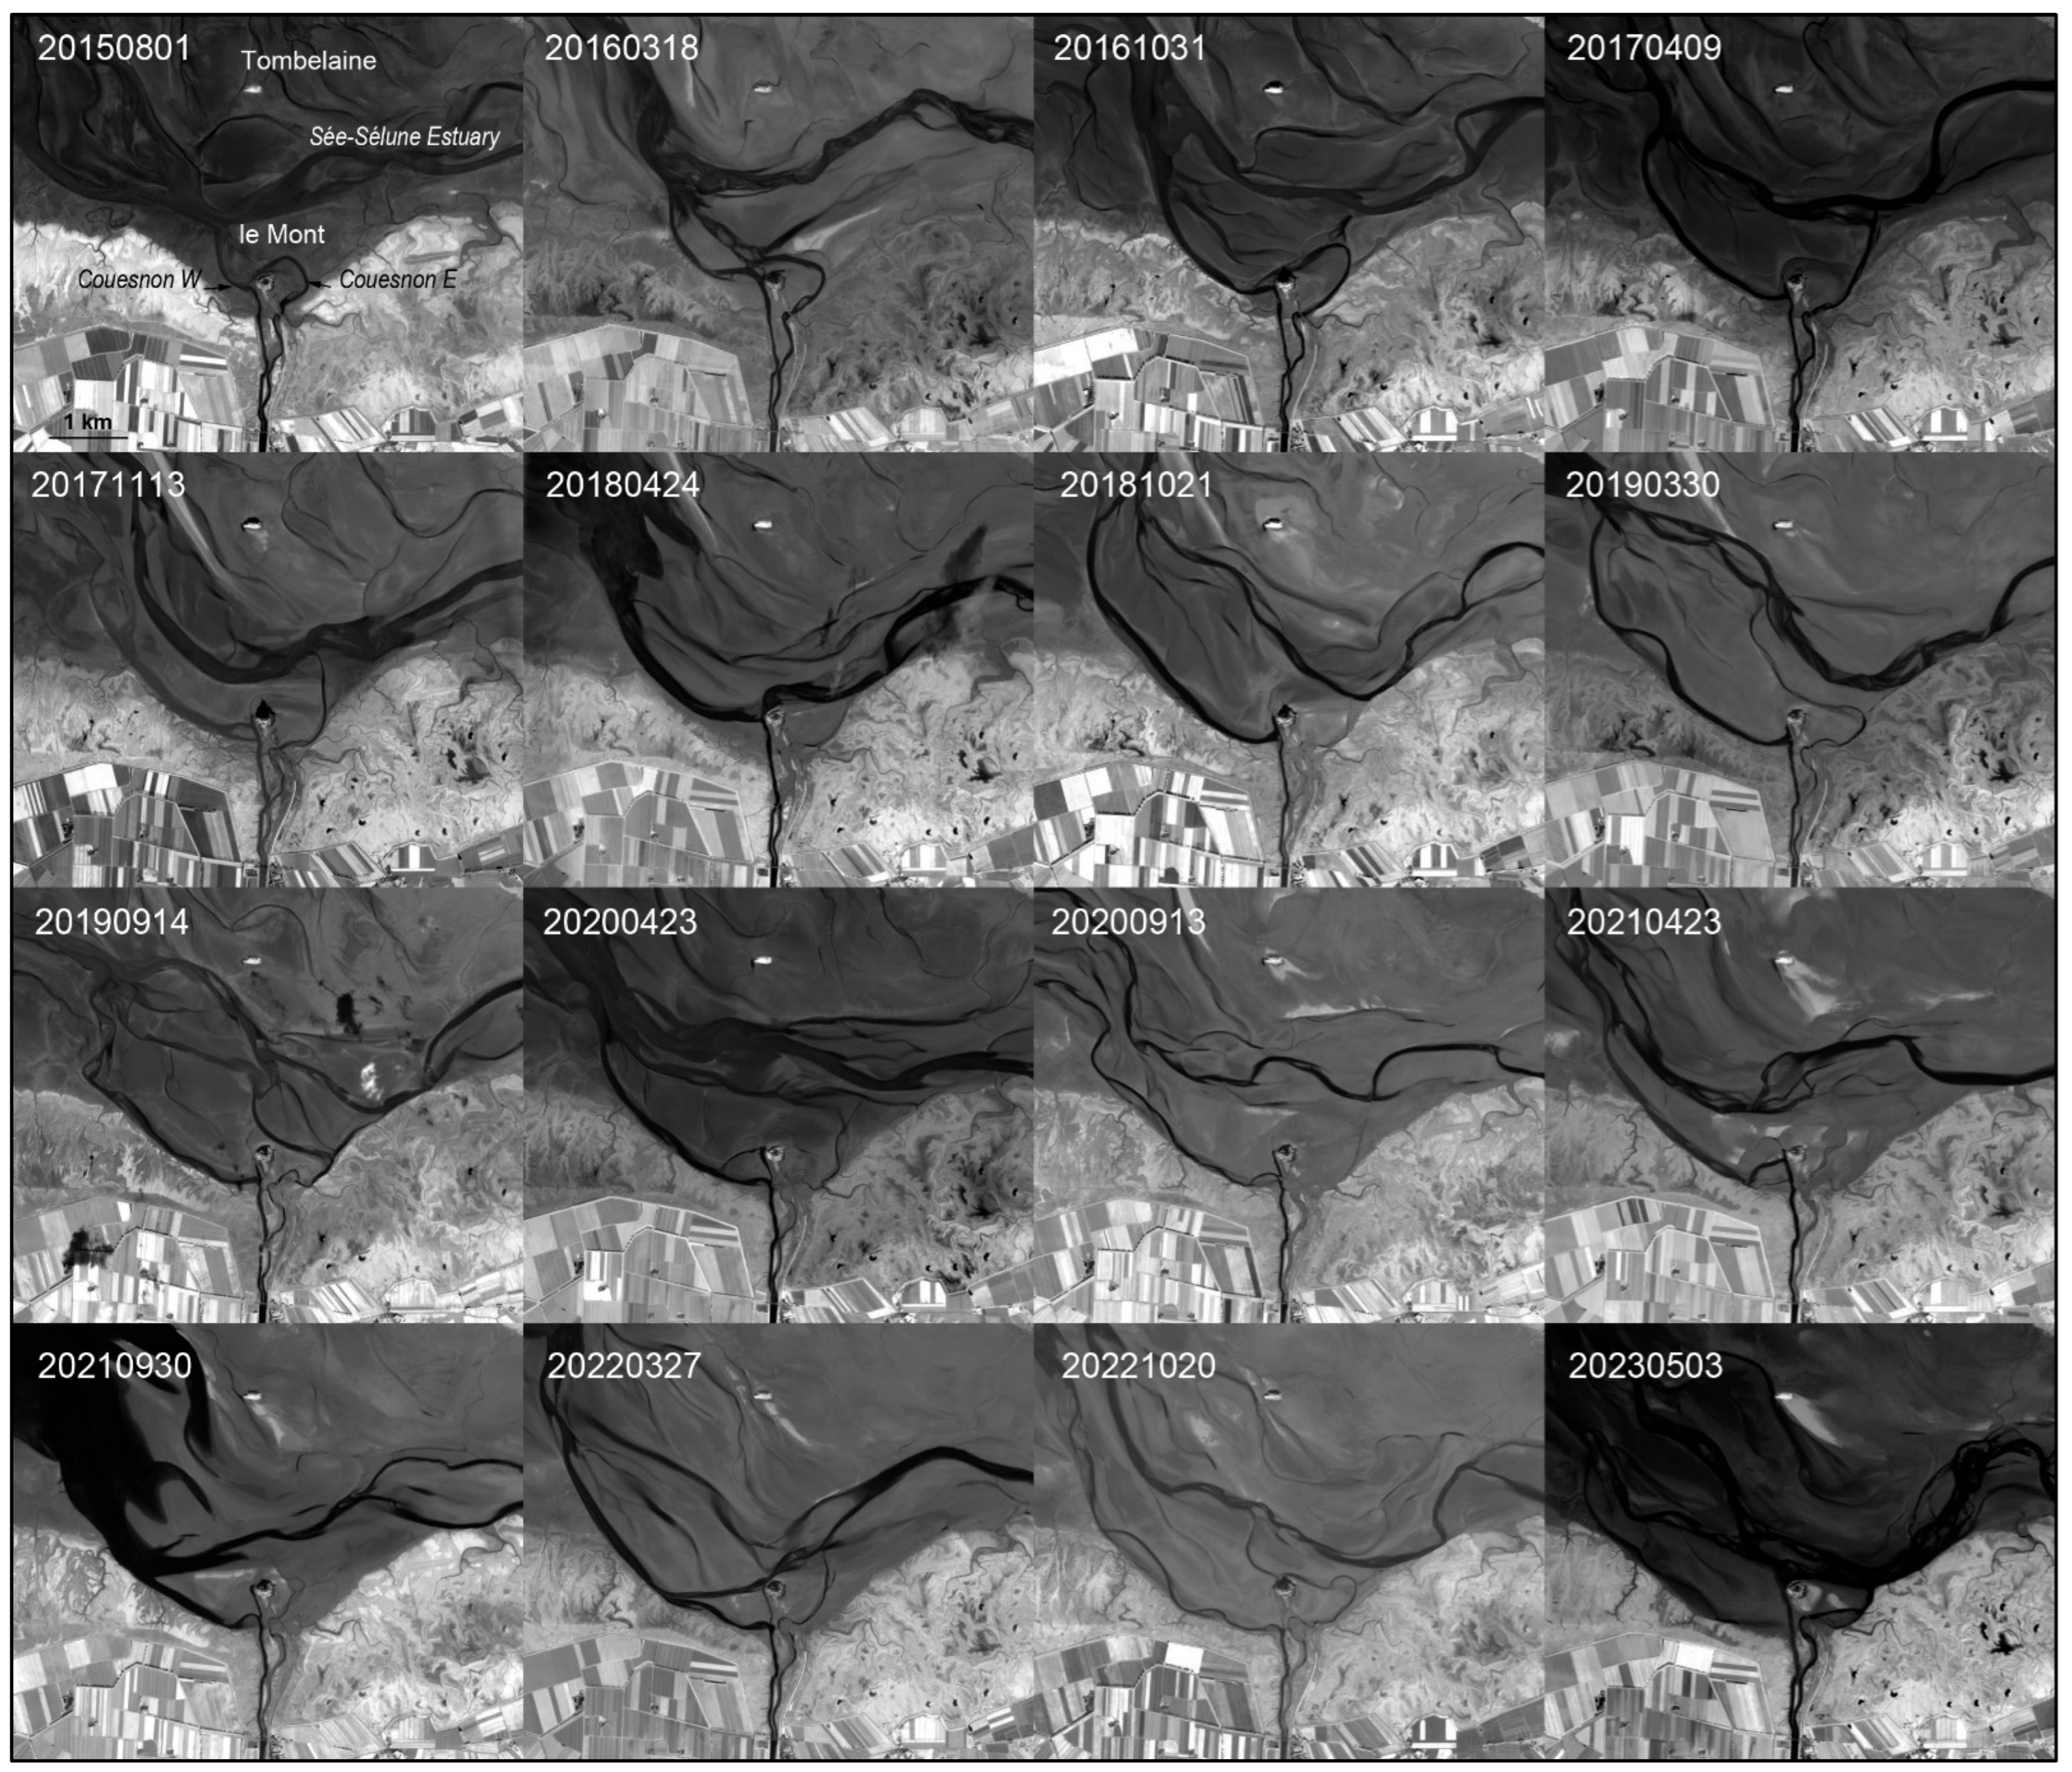
As early as 2016, the Couesnon W migrated towards the schorre and began considerable erosion activity to the south-west of the Mont (see also Section 4.1). Since then, the watercourse has been relatively stable, but a change was observed in February 2023 with a new branch flowing straight to the north, running very close to the Tour Gabriel to the west of the Mont, and joining the Sée-Sélune main estuary.
4.2.2. The Eastern Channel (Couesnon E, Figure 7)
Operating in May 2015, the eastern channel first went around the Mont and joined the course of the Couesnon W from the north and very close to the Mont. It contributed to the erosion of the eastern schorre from July 2016 onward. In early 2017, the channel migrated to the northeast, in the direction of the Sée-Sélune River, and the erosion of the schorre to the east of the Mont (MSM-E) ceased. Since then, the Couesnon E appears relatively limited. In late 2022, a large meander was very close to the Mont. The image dated to early May 2023 indicates an unusually important watercourse, probably because of the rainy conditions prevailing for several weeks.
4.2.3. The Sée-Sélune Estuary (Figure 7)
The Sée-Sélune estuary is not directly impacted by the new facilities, but it plays a major role in the sedimentology of the estuarine complex. During the period from February to April 2018, the Sée-Sélune River migrated to the south and deeply eroded the schorre in the southeastern part of the bay. This erosion also concerned the schorre to the east of the Mont. It ceased in late September 2018 when the Sée-Sélune River course headed north. The last images (from late 2022 onward) indicate a new migration of the Sée-Sélune to the south with the erosion of the Grand Banc (see also GB, Figure 2).
4.3. Sedimentary Balance
The sedimentary balance can only be assessed from images acquired under the same conditions, but on different dates and, if possible, the furthest apart in time. Only two pairs are presented here to illustrate the most important change (Figure 8 and Figure 9).
Figure 8 shows the slikke (i.e., mineral) surfaces in 2015 and 2020, respectively, with the same corrected water height of 9.90 m and the same tidal conditions characterised by an ebb tide about 5 h and a quarter before the low tide and the same place in the tidal cycle. In 2015, one of the first S2 images acquired on 21 August 2015 shows alternating tidal channels and banks between Tombelaine and the eastern coast. On 28 May 2020, the area between Tombelaine and Grouin du Sud was covered by sediments without any waterbodies. Tombelaine Island is now accreted to the coast. The main flood-tide channel between Bec d’Andaine and Tombelaine is still visible. The slikke surface to the northeast of the bay has increased from 672.5 ha to 1402 ha.
Figure 9 shows the difference between the slikke surfaces in 2018 and 2023, with the corrected water heights of 10.21 m and 10.23 m, respectively. The slikke surface to the north-east of the bay has increased from 705 ha to 1328 ha. The change is probably slightly underestimated because of the 2 cm difference in elevation (10.23 m vs. 10.21 m). The flood-dominated channel between Bec d’Andaine and Tombelaine is still visible but narrower. The silting-up of this area seems to have accelerated within the last few years. Note that the trend is confirmed by the analysis of another image acquired on 19 December 2020 with a water height of 10.21 m, not illustrated here for readability. The corresponding slikke surface is 930 ha. The erosion of the schorre close to the Mont seems to be accompanied by a large-scale silting up in the internal part of the bay. If the erosion due to the Couesnon W along the schorre is evident, sediments are concentrating just west of the Mont (Figure 9, M, also visible in Figure 8).
5. Discussion
5.1. Evolution Close to the Mont
The main goal of the project to reestablish the maritime character of the Mont-Saint-Michel is for the islet to be surrounded by more high tides in the future. Eight years after the last facilities were built, the analysis of time-series satellite images indicates important erosion phenomena close to the Mont, particularly to the southwest due to the Couesnon West channel. Nevertheless, at about 3 km from the Mont, the vegetation surface (schorre) is stable or even tends to progress slightly, according to the trend that has prevailed for a century. Two main features must be discussed: the role of the vegetation and the new sedimentation conditions in the northeastern part of the bay, the evolution of which could be linked to the hydraulic works.
The type of vegetation plays a very important role, along with the change in the hydraulic conditions. Considering the state of vegetation close to the Mont in 2007 [34], the salt meadows extend up to 2.6 km from the dikes to the east (Figure 6, pe) and about 1.4 km from the dikes to the west (Figure 6, pw). These distances are 2.3 and 0.4 km in 2023, respectively, illustrating the dramatic erosion of the western schorre. The slope is very small in both areas because the difference in height is only 3 m (maximum 12–13 m and minimum 9–10 m). The analysis of the satellite images and the fieldwork shows great changes in the vegetal associations. Three parts can be distinguished on a morphological basis (Figure 10).
The low marsh is dominated by the saltmarsh-grass (Puccinellia maritima), which forms large grasslands. Some sea asters (Tripolium pannonicum) in the west and annual seablites (Suaeda maritima) in the east are mixed with the saltmarsh-grass. At the contact between the schorre and the sandy slikke, the glassworts (Salicornia sp.) and the common cordgrass (Sporobulus anglicus, also known as Spartina sp.) act as pioneer plants. Particularly, the cordgrass sends out underground stems, which eventually form new clumps of grass. The dense root system binds mud, and the stems increase silt deposition. The density and the height of the cordgrass clumps are decreasing towards the sea. The common cordgrass is more frequent to the east of the Mont. Note that the pioneer area is frequently preceded by a hummocky zone [35].
The middle marsh is more regular and characterised by dense sea purslane (Atriplex portulacoides), a typical greyish-green shrub that grows to 75 cm. The species also has a high potential for sediment fixation. The sea aster to the east and the sea couch (Elymus athericus) to the west are also present.
The high marsh is more contrasted between the west and east areas, probably due to the extensive sheep grazing to the east. In the latter area, the red fescue (Festuca rubra) is dominant. This plant presents narrow, needle-like leaves, which make it less palatable to livestock. The creeping bentgrass (Agrostis stolonifera), a perennial grass species forming extensive mats, is also present. To the west, there is a mixture of sea couch and red fescue. The sea purslane tufts are also frequent. The sea couch can tolerate harsh weather conditions. It is also a pioneer species generally associated with sand dunes not existing here because of the developments. The progression of the sea couch in this marsh area is spectacular, as revealed by [34], indicating that it represented about 3% of the surface area of salt marshes in 1984 and 45% in 2013. The main reason for this rapid evolution is eutrophication due to the increase in nutrient levels in the waters of the bay coming from the watersheds, including those of the Sée, Sélune, and Couesnon rivers [36].
The results of the survey indicate that the low marsh has been totally eroded to the west between 2007 and 2023, along with about 75% of the middle marsh. On the contrary, only a small part of the low marsh has been eroded to the east of the Mont.
5.2. Evolution of the Inner Part of the Bay du Mont-Saint-Michel
For the reason that the comparison of Sentinel-2 images with the same tidal conditions is relevant for a short period (see, for example, Section 4.3), ancient satellite data from the classical Landsat 5 Thematic Mapper (TM) has also been analysed for comparing dates separated by decades. The previous analysis indicates that only acquisitions with a water height of at least 8.50 m must be selected among hundreds of TM images to allow the key sector of Bec d’Andaine-Tombelaine-Grouin du Sud to be observed. Figure 11 illustrates the comparison of the Sentinel-2A image acquired on 28 October 2021 and the Landsat 5-TM image acquired on 27 September 1990. Both images were acquired in neap tide conditions, with a water height of 9.11 m in 1990 and 9.10 m in 2021. The ebb tide acquisition was about six hours before the low tide, corresponding to the beginning of the ebb.
Although the colour composites are elaborated with the same spectral ranges, major changes are observed. The vegetation of the schorre along the southern coast is obviously different. In 1990, the vegetation association was more homogeneous. The red colour reveals the reflectance of the dominant sea purslane. As already mentioned, the middle and high marsh zones have been invaded from the 1990s onward by the sea couch, a plant that is dry in autumn. The yellow/green colour in the 2021 colour composite represents the sea couch dominancy, whereas the shades of red indicate the sea purslane, an evergreen plant. Note that we compared the Sentinel-2B image acquired on 30 September 2021 (approximately the same date as the 1990 image) to check that the one-month difference (end-September vs. end-October) does not significantly influence the mapping of the vegetation.
The comparison reveals that, initially, the sediments were accumulated off Bec d’Andaine. In 1990, the main flood channel was located along the coast between Bec d’Andaine and Grouin du Sud. The tidal channel overflew to form a tidal wedge due to the high-speed flood tidal current. A considerable scouring took place during the last two decades. In 2021, the dynamics of the flood will be totally modified. The main flood channel migrated southward, approximately at the location of the Sée-Sélune River, which currently acts as the main ebb channel.
The influence of human activities in coastal areas has already been investigated using remote sensing [37,38,39]. However, human beings rarely have such a significant impact on the hydrosedimentary balance in an embayment. Figure 12 illustrates the status of the major facilities in 2023 and a comparison with the initial setting in 2007, at the very beginning of the works for reestablishing the maritime character of the Mont-Saint-Michel. Note that the Sentinel-2 image in Figure 12B was acquired six days after the photograph in Figure 12A was taken.
This easy-to-implement method could be a useful complement to airborne lidar studies [30], which require more extensive implementation. The lidar survey allows quantifying the sedimentary budget but concerns only a small part of the bay close to the Mont. Further studies will be necessary to understand whether the silting-up in the Bec d’Andaine-Tombelaine-Grouin du Sud area is directly linked to the engineering works or corresponds to a mixture of anthropic and natural evolution of the embayment.
5.3. A Tentative Volumetric Approach
Estimating the volume of sediment in a megatidal bay is challenging. Between 1858 and 1912, the sedimentation in the estuarine complex (80 km2) was estimated at 2,000,000 m3 per year [21]. This represents approximately +2.5 cm in elevation per year but is partly offset by the fact that 500,000 m3 of material is also extracted annually for agricultural use. During the XXth century, characterised by many projects and the construction of several facilities, the sedimentation in the bay dropped to 700,000–1,000,000 m3 per year in the 1970s (value used in the LCHF model) and no more than 400,000–600,000 m3 per year in the 1990s (value used in the SOGREAH model).
Although no new volume estimation has been published, the value of 400,000 m3 per year can be used for the current situation. In theory, the increase in elevation is around +0.5 cm per year in the estuarine complex. But major changes occur in the internal part of the bay, such as the southward drift of the Sée-Sélune River, the partial destruction of the Bec d’Andaine spire, and erosion caused by the facilities close to the Mont. These changes make it very difficult to estimate the real variations in sedimentation. The case of a megatidal bay is totally different from the case of a coast with a regular shoreline.
However, by analysing the Sentinel 2 image chronicle, it is possible to estimate the heights of accumulated sediment over short time intervals. These intervals must be less than half a tidal cycle, as channel migration phenomena are too great beyond that. For example, the data acquired on 27 and 29 December 2022 present a difference in water height of 1.66 m (9.75 m and 11.41 m, respectively). The comparison could also be made with the image acquired on 11 January 2023 (8.38 m) (Figure 13).
Tombelaine constitutes a fixed point to the west of which a tidal channel passes. Between Tombelaine and the Grouin du Sud, the sediment accumulates in the form of a long (about 2.2 km) and narrow (300 m on average) bank (see ‘bank’ in Figure 13) running west-east at a height of around 11.3 m. On the image of 28 May 2020 (Figure 8), the elevation was only around 10.8 m between Tombelaine and Grouin du Sud. An increase in at least +0.5 m in this bank corresponds to the accumulation of about 330,000 m3. The sediment in the northern part of the estuarine complex is probably trapped in the bank and corresponds to a great part of the income sedimentation. Unfortunately, it seems impossible to evaluate the volume of sediment eroded around the Mont using this method because of the lack of data with favourable tidal conditions and the constant migration of the sedimentary bodies. A great part of the erosion is probably displaced to the north-west of the Mont (see ‘sedimentation’ in Figure 13).
5.4. The End-User Engagement
A French public establishment, placed under the supervision of the minister responsible for culture and the minister responsible for the environment, called the Mont-Saint-Michel Public Establishment, was created in 2019. The role of this establishment is to ensure the national and international reputation of the Mont-Saint-Michel site in association with the local authorities. To this end, it manages the public facilities required for its mission on the site and encourages and coordinates the work of the various public and private players involved in the Mont-Saint-Michel site. It contributes to its development in terms of tourism, culture, landscape, and territory, in keeping with its history, the World Heritage listing of the “Mont-Saint-Michel and its Bay” property, and the fact that the Mont is part of the “Pilgrim’s Way to Santiago de Compostela”.
To ensure the management, operation, maintenance, and upkeep of the works required to restore and maintain the maritime character of the Bay of Mont-Saint-Michel, as well as the reception, parking, and transport facilities providing access to Mont-Saint-Michel, the list of which is set by order of the ministers responsible for the domain and for the environment, subject to the powers of the local authorities and their groupings in terms of managing aquatic environments and preventing flooding.
For the Mont-Saint-Michel Public Establishment, remote sensing is one of the most important tools for the survey of the bay. The focus of the Establishment deals with a regular lidar survey in the area around the Mont. Lidar techniques are used in two main ways. A terrestrial laser has been installed at the top of the abbey and provides regular mapping (on a monthly scale), but it is limited to 1500 m around the Mont. These terrestrial laser scanning observations are supplemented every six months by an airborne lidar flight covering a larger area of the estuarine fan. As early as August 2009, the terrestrial lidar shew erosion to the southwest of the Mont was due to the commissioning of the new dam. The study also showed that some of the eroded sediments were concentrated to the north-west of the Mont. Between September 2013 and April 2014, the airborne laser survey revealed the erosion of 1 to 2 m of the tidal flat around the Mont due to the commissioning of the new Couesnon West channel.
Unmanned Aerial Vehicles (UAV) are very difficult to use in the context of the bay for numerous reasons, whereas they could be envisaged in less dynamic environments such as the Po River estuary [40], for local applications such as oyster farming [41], or for shoreline studies [42]: 1. The size of the bay (about 300 km2, then it is impossible to cover the area in one shot and the tide is very important); 2. The regulations stipulate a maximum flight height of 150 m and a maximum horizontal distance of 100 m from the remote pilot. These conditions can only be met very occasionally, for example, close to the dam; 3. the winds are often strong and do not allow regular drone use. For all these reasons, satellite dates were used in this study.
The present study of Sentinel-2 data attracted the attention of the scientific committee of the Establishment, and further discussions are planned. It will be interesting to see how optical data complements the lidar data acquired around the Mont.
6. Conclusions
In this paper, it was shown that chronicles of remote sensing images such as those acquired by the Sentinel-2 satellite system, already known in vegetation studies along the Couesnon River [43], are also very useful for monitoring erosion and accretion phenomena, particularly close to the Mont-Saint-Michel. Moreover, multi-temporal images acquired on the tidal flats of the Mont-Saint-Michel Bay could be successfully compared when acquired under the same tidal conditions (water height, ebb or flood, same place in the tidal cycle, etc.). The correction of the standard height provided by tidal prediction is a very important point, particularly when in-situ measurements of the water level are not available. It is the case in the Mont-Saint-Michel, because the Cancale gauge station is located about 22 km to the west of the Mont. The human presence in the area and its relationship with the environment should also be studied, as done elsewhere [44,45]. The remote sensing approach reveals important changes in the internal part of the bay, in the Bec d’Andaine-Tombelaine-Grouin du Sud area, even threatening the insularity of Tombelaine. These changes are likely related to the work to reestablish the maritime character of the Mont. A regular survey involving field, aerial, and satellite data is now necessary to verify that the secondary effects of the engineering project are not more severe than the expected results (see Supplementary Materials).
Supplementary Materials
The following supporting information can be downloaded at: https://www.mdpi.com/article/10.3390/geohazards4040026/s1, Table S1: list of the satellite data used for the study with their tidal characteristics.
Funding
This research was funded by the University Reims Champagne-Ardenne.
Data Availability Statement
The Sentinel 2 data have been downloaded from the Copernicus website (https://dataspace.copernicus.eu/, accessed on 7 November 2023) and Aster data from the dedicated website (https://gbank.gsj.jp, accessed on 7 November 2023). The ALOS-AVNIR-2 scene was obtained in the frame of a pilot-project of the Japanese Space Agency (JAXA).
Acknowledgments
The author would thank all the students who contributed to the field investigations, particularly the students from the University of Bordeaux 3, and Yvette Marchand and Clélia Bilodeau, former students. A special thanks to Irène Offermans for reviewing a preliminary English version. The author warmly dedicates this paper to the memory of his friend, Fernand Verger (1929–2018), a great specialist of the Mont-Saint-Michel Bay.
Conflicts of Interest
The author declares no conflict of interest. The funders had no role in the design of the study; in the collection, analyses, or interpretation of data; in the writing of the manuscript, or in the decision to publish the results.
References
- Reed, D.J.; Davidson-Arnott, R.; Perillo, G.M.E. Estuaries, coastal marshes, tidal flats and coastal dunes. In Geomorphology and Global Environmental Change; Slaymaker, O., Spencer, T., Embleton-Hamann, C., Eds.; Cambridge University Press: Cambridge, UK, 2015; pp. 130–152. [Google Scholar]
- Semeniuk, V. Tidal flats. In Encyclopedia of Coastal Science; Finkl, C.W., Makowski, C., Eds.; Springer: Berlin/Heidelberg, Germany, 2019; Volume 36, pp. 1708–1727. [Google Scholar]
- Kang, Y.; Lei, J.; Wang, M.; Li, G.; Ding, X. Topographic evolution of tidal flats based on remote sensing: An example in Jiangsu coast, Southern Yellow Sea. Front. Mar. Sci. 2023, 10, 1163302. [Google Scholar] [CrossRef]
- Cohen, M.C.L.; de Souza, A.V.; Liu, K.-B.; Rodrigues, E.; Yao, Q.; Pessenda, L.C.R.; Rossetti, D.; Ryu, J.; Dietz, M. Effects of Beach Nourishment Project on Coastal Geomorphology and Mangrove Dynamics in Southern Louisiana, USA. Remote Sens. 2021, 13, 2688. [Google Scholar] [CrossRef]
- Cracknell, A. Remote sensing techniques in estuaries and coastal zones—An update. Int. J. Remote Sens. 1979, 20, 485–496. [Google Scholar] [CrossRef]
- Benveniste, J.; Mandea, M.; Melet, A.; Ferrier, P. Earth observations for coastal hazards monitoring and international services: A European perspective. Surv. Geophys. 2020, 41, 1185–1208. [Google Scholar] [CrossRef]
- Murray, N.J.; Phinn, S.R.; DeWitt, M.; Ferrari, R.; Johnston, R.; Lyon, M.B.; Clinton, N.; Thau, D.; Fuller, R.A. The global distribution and trajectory of tidal flats. Nature 2019, 565, 222–225. [Google Scholar] [CrossRef] [PubMed]
- Gawehn, M.; van Dongeren, A.; de Vries, S.; Swinkels, C.; Hoekstra, R.; Aarninkhof, S.; Friedman, J. The application of a radar-based depth inversion method to monitor near-shore nourishments on an open sandy coast and an ebb-tidal delta. Coast. Eng. 2020, 159, 103716. [Google Scholar] [CrossRef]
- Kohlus, J.; Stelzer, K.; Müller, G.; Smollich, S. Mapping seagrass (Zostera) by remote sensing in the Schleswig-Holstein Wadden Sea. Estuar. Coast. Shelf Sci. 2020, 238, 106699. [Google Scholar] [CrossRef]
- Madhuanand, L.; Philippart, C.J.M.; Wang, J.; Nijland, W.; de Jong, S.M.; Bijleveld, A.I.; Addink, E.A. Enhancing the predictive performance of remote sensing for ecological variables of tidal flats using encoded features from a deep learning model. GISci. Remote Sens. 2023, 60, 2163048. [Google Scholar] [CrossRef]
- Mason, D.C.; Scott, T.R.; Dance, S.L. Remote sensing of intertidal morphological change in Morecambe Bay, U.K., between 1991 and 2007. Estuar. Coast. Shelf Sci. 2010, 87, 487–496. [Google Scholar] [CrossRef]
- Ryu, J.H.; Choi, J.K.; Lee, Y.K. Potential of remote sensing in management of tidal flats: A case study of thematic mapping in the Korean tidal flats. Ocean Coast. Manag. 2014, 102, 458–470. [Google Scholar] [CrossRef]
- Zhang, N.; Li, H.; Zhang, J.; Chen, J.; Wu, H.; Gong, Z. Study of the spatial and temporal distributions of tidal flat surface sediment based on multitemporal remote sensing. Front. Mar. Sci. 2023, 10, 1109146. [Google Scholar] [CrossRef]
- Tong, S.S.; Deroin, J.P.; Pham, T.L. An optimal waterline approach for studying tidal flat morphological changes using remote sensing data: A case of the northern coast of Vietnam. Estuar. Coast. Shelf Sci. 2020, 236, 106613. [Google Scholar] [CrossRef]
- Salameh, E.; Frappart, F.; Turkia, I.; Laignel, B. Intertidal topography mapping using the waterline method from Sentinel-1 & -2 images: The examples of Arcachon and Veys Bays in France. ISPRS J. Photogramm. Remote Sens. 2020, 163, 98–120. [Google Scholar]
- Deroin, J.P.; Guillaneuf, A.; Laratte, S. A multisource approach for tidal flat study. Example of the Baie des Veys, Normandy, France. Z. Geomorph. 2022, 64, 17–38. [Google Scholar] [CrossRef]
- Deroin, J.P.; Marchand, Y.; Auffret, J.P. Littoral survey using the JERS-OPS multispectral sensor. Example of the Mont Saint-Michel Bay (Normandy, France). Remote Sens. Environ. 1997, 62, 2–119. [Google Scholar] [CrossRef]
- Verger, F. Marais de Dol et Baie du Mont-Saint-Michel. In Zones Humides du Littoral Français: Estuaires, Deltas, Marais et Lagunes; BELIN Ed.: Paris, France, 2009; pp. 177–201. [Google Scholar]
- Phlipponneau, M. La Baie du Mont-Saint-Michel. Etude de Morphologie Littorale. Ph.D. Thesis, University of Paris, Paris, France, 1955. [Google Scholar]
- Larsonneur, C. La Baie du Mont-Saint-Michel: Un modèle de sédimentation en zone tempérée. Bull. Inst. Géol. Bassin d’Aquitaine 1989, 46, 5–73. [Google Scholar]
- L’Homer, A.; Courbouleix, S.; Chantraine, J.; Deroin, J.P. Baie du Mont-Saint-Michel. In Geological Map of France at 1, 50,000; BRGM, Ed.; French Geological Survey: Orléans, France, 1999; Volume 208, 184p. [Google Scholar]
- Bonnot-Courtois, C.; Caline, B.; L’Homer, A.; Le Vot, M. La Baie du Mont Saint-Michel et l’estuaire de la Rance. Environnements sédimentaires, aménagements et évolution récente. In Bulletin des Centres de Recherches Exploration—Production; Elf-Aquitaine: Paris, France, 2002; Volume 26, 256p. [Google Scholar]
- Tessier, B.; Billeaud, I.; Lesueur, P. Stratigraphic organisation of a composite macrotidal wedge: The Holocene sedimentary infilling of the Mont-Saint-Michel Bay (NW France). Bull. Soc. Geol. Fr. 2010, 181, 99–113. [Google Scholar] [CrossRef]
- Deroin, J.P.; Shimada, M. The importance of local mean time in remote sensing for mapping megatidal zones. Comptes Rendus Geosci. 2010, 342, 11–18. [Google Scholar] [CrossRef]
- Verger, F. Colmatage et génie civil aux environs du Mont-Saint-Michel. Mappemonde 2001, 63, 25–28. [Google Scholar] [CrossRef]
- Viguier, J.; De Croutte, E.; Hamm, L. Hydrosedimentary studies to restore the maritime character of Mont-Saint-Michel. In Proceedings of the Coastal Engineering Conference, Cardiff, UK, 7–12 July 2002; World Scientific Publishers: Singapore, 2003; pp. 3285–3297. [Google Scholar]
- Migniot, C.; Viguier, J. The silting-up around Mont-Saint-Michel and the method used to maintain its maritime character. In Bulletin des Centres de Recherches Exploration—Production; Bonnot-Courtois, C., Caline, B., L’Homer, A., Le Vot, M., Eds.; Elf-Aquitaine: Paris, France, 2002; pp. 125–152. [Google Scholar]
- Marchand, Y.; Deroin, J.-P.; Auffret, J.-P. Morphodynamics of the Mont Saint-Michel Bay (West France) since 1986 by remote sensing data. Comptes Rendus Acad. Sci. 1998, 327, 155–159. [Google Scholar]
- Bilodeau, C.; Deffontaines, B.; Deroin, J.P.; Radureau, A.; Cohen, M. Estimation du potentiel des données LIDAR multi-échos pour l’étude de la végétation des marais salés: Étude du biais des données LIDAR acquises au-dessus de la baie du Mont Saint-Michel et recherche d’une méthode de correction. Revue Soc. Franç. Photogramm. Télédétect. 2010, 192, 189–190. [Google Scholar]
- Levoy, F.; Anthony, E.J.; Dronkers, J.; Monfort, O.; Montreuil, A. L Short-term to decadal-scale sand flat morphodynamics and sediment balance of a megatidal bay: Insight from multiple LiDAR datasets. J. Coastal Res. 2019, 88, 61–76. [Google Scholar] [CrossRef]
- Cosma, M.; Lague, D.; D’Alpaos, A.; Leroux, J.; Feldmann, B.; Ghinassi, M. Sedimentology of a hypertidal point bar (Mont-Saint-Michel Bay, north-western France) revealed by combining lidar time-series and sedimentary core data. Sedimentology 2022, 68, 1179–1208. [Google Scholar] [CrossRef]
- Pancorbo, J.L.; Lamb, B.T.; Quemada, M.; Hively, W.D.; Gonzalez-Fernandez, I.; Molina, I. Sentinel-2 and WorldView-3 atmospheric correction and signal normalization based on ground-truth spectroradiometric measurements. ISPRS J. Photogramm. Remote Sens. 2021, 173, 166–180. [Google Scholar] [CrossRef]
- Mason, D.C.; Amin, M.; Davenport, I.J.; Flather, R.A.; Robinson, G.J.; Smith, J.A. Measurement of recent intertidal sediment transport in Morecambe Bay using the waterline method. Estuar. Coast Shelf Sci. 1999, 49, 427–456. [Google Scholar] [CrossRef]
- Détriché, S.; Susperregui, A.S.; Feunteun, E.; Lefeuvre, J.C.; Jigorel, A. Interannual (1999–2005) morphodynamic evolution of macro-tidal salt marshes in Mont-Saint-Michel Bay (France). Cont. Shelf Res. 2011, 31, 611–630. [Google Scholar] [CrossRef]
- Canard, A.; Prigent, L.; Ysnel, F.; Robin, T.; Carpentier, A.; Lefeuvre, J.C.; Bioret, F. Le Mont-Saint-Michel et sa baie peuvent-ils se réconcilier? Documents phytosociologiques—Actes du colloque de Bailleul 2017. Société Française Phytosociologie 2019, 12, 114–122. [Google Scholar]
- Valéry, L.; Lefeuvre, J.C. The macrotidal Bay of Mont-Saint-Michel (France): The function of salt marshes. In The Wetland Book; Finlayson, C., Milton, G., Prentice, R., Davidson, N., Eds.; Springer: Dordrecht, The Netherlands, 2018; pp. 1079–1088. [Google Scholar]
- Tian, Q.; Wang, Q.; Liu, Y. Geomorphic change in Dingzi Bay, East China since the 1950s: Impacts of human activity and fluvial input. Front. Earth Sci. 2017, 11, 385–396. [Google Scholar] [CrossRef]
- Blum, M.D.; Roberts, H.H. Drowning of the Mississippi Delta due to insufficient sediment supply and global sea-level rise. Nat. Geosci. 2009, 2, 488–491. [Google Scholar] [CrossRef]
- Kang, Y.; He, J.; Wang, B.; Lei, J.; Wang, Z.; Ding, X. Geomorphic Evolution of Radial Sand Ridges in the South Yellow Sea Observed from Satellites. Remote Sens. 2022, 14, 287. [Google Scholar] [CrossRef]
- Brunetta, R.; Duo, E.; Ciavola, P. Evaluating Short-Term Tidal Flat Evolution Through UAV Surveys: A Case Study in the Po Delta (Italy). Remote Sens. 2021, 13, 2322. [Google Scholar] [CrossRef]
- Roman, A.; Prasyad, H.; Oiry, S.; Davies, B.F.R.; Brunier, G.; Barillé, L. Mapping intertidal oyster farms using unmanned aerial vehicles (UAV) high-resolution multispectral data. Estuar. Coast. Shelf Sci. 2023, 291, 108432. [Google Scholar] [CrossRef]
- Xiucheng, Y.; Zhe, Z.; Shi, Q.; Kroeger, K.D.; Zhiliang, Z.; Covington, S. Detection and characterization of coastal tidal wetland change in the northeastern US using Landsat time series. Remote Sens. Environ. 2022, 276, 113047. [Google Scholar]
- Rapinel, S.; Mony, C.; Lecoq, L.; Clément, B.; Thomas, A.; Hubert-Moy, L. Evaluation of Sentinel-2 time-series for mapping floodplain grassland plant communities. Remote Sens. Environ. 2019, 223, 115–129. [Google Scholar] [CrossRef]
- Nieuwhof, A.; Bakker, M.; Knol, E.; de Langen, G.J.; Nicolay, J.A.W.; Postma, D.; Schepers, M.; Varwijk, T.W.; Vos, P.C. Adapting to the sea: Human habitation in the coastal area of the northern Netherlands before medieval dike building. Ocean Coast. Manag. 2019, 173, 77–89. [Google Scholar] [CrossRef]
- Kim, J.W.; Kim, H.G.; Kim, H.; Hawkins, S.J.; Seo, I.S.; Oh, C.W. Spatial distribution of meiofaunal and macrofaunal assemblages in the tidal flats of the southern Korean coast in relation to natural and anthropogenic impacts. Mar. Pollut. Bull. 2023, 194, 115377. [Google Scholar] [CrossRef]
Figure 1.
A NW-SE profile through the Mont-Saint-Michel Bay showing the main morphological units, their elevation, and the main sediments. The height is expressed according to the maritime scale (i.e., 0 m corresponds to about—4 m French terrestrial maps). HNT. Highest neap tides, HST. Highest spring tides, LNT. Lowest neap tide, LST. Lowest spring tides. See also location of the profiles a–b in Figure 2.
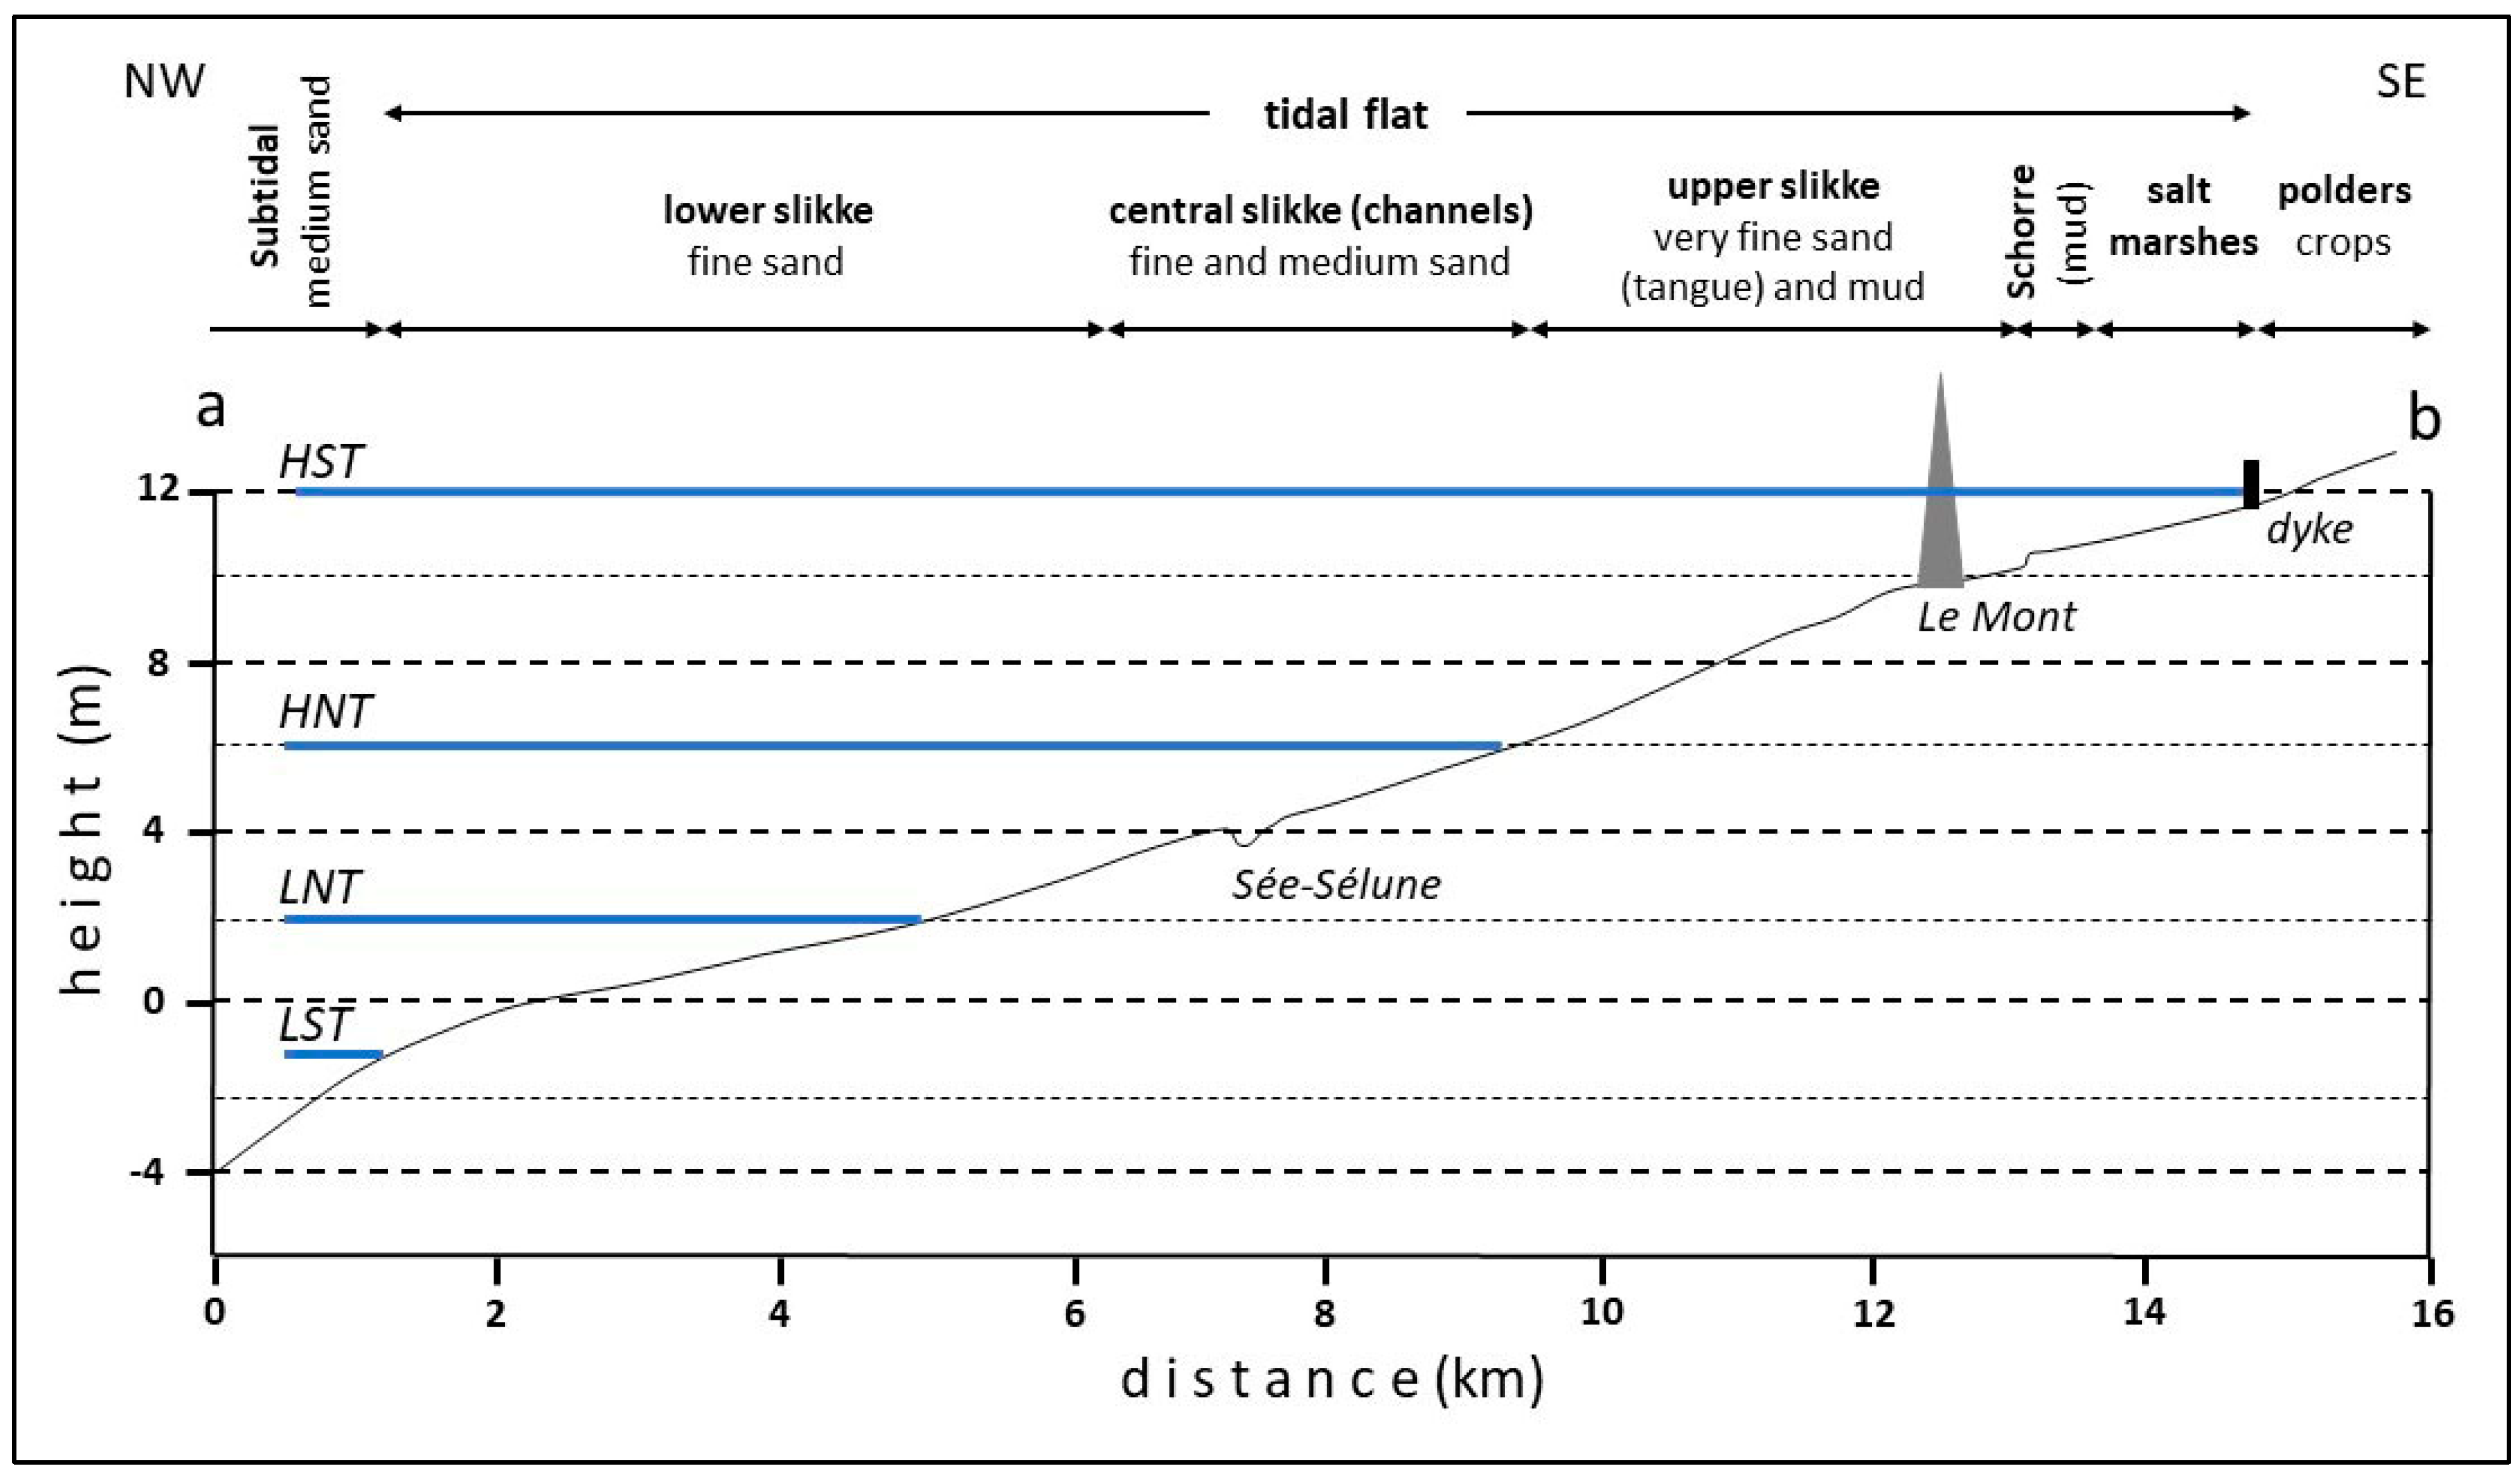
Figure 2.
The Mont-Saint-Michel Bay (MSM Bay) and its tidal flats viewed with Sentinel-2 (true colour composite from the image acquired on 12 November 2020). White dashed line: Elevation is 0 m. Blue dashed line: the elevation of the sea at the time of acquisition is 3.75 m, one hour after the low tide. Red solid/dashed lines: main dikes. AM. Anse de Moidrey reservoir; BA. Bec d’Andaine; D. Couesnon Dam; FC. Falaises (cliffs) de Champeaux; GB. Grand Banc; GS. Grouin du Sud; HB. Hermelles Bank; HC. Hermelles de Champeaux; HE. Herbus or schorre (East); HW. Herbus or schorre (West); M. Mont-Saint-Michel; MD. Mont Dol; PG. Pointe du Grouin; RT. Roche Torin; T. Tombelaine islet; I to IV. See text. a–b NW-SE profile (Figure 1).
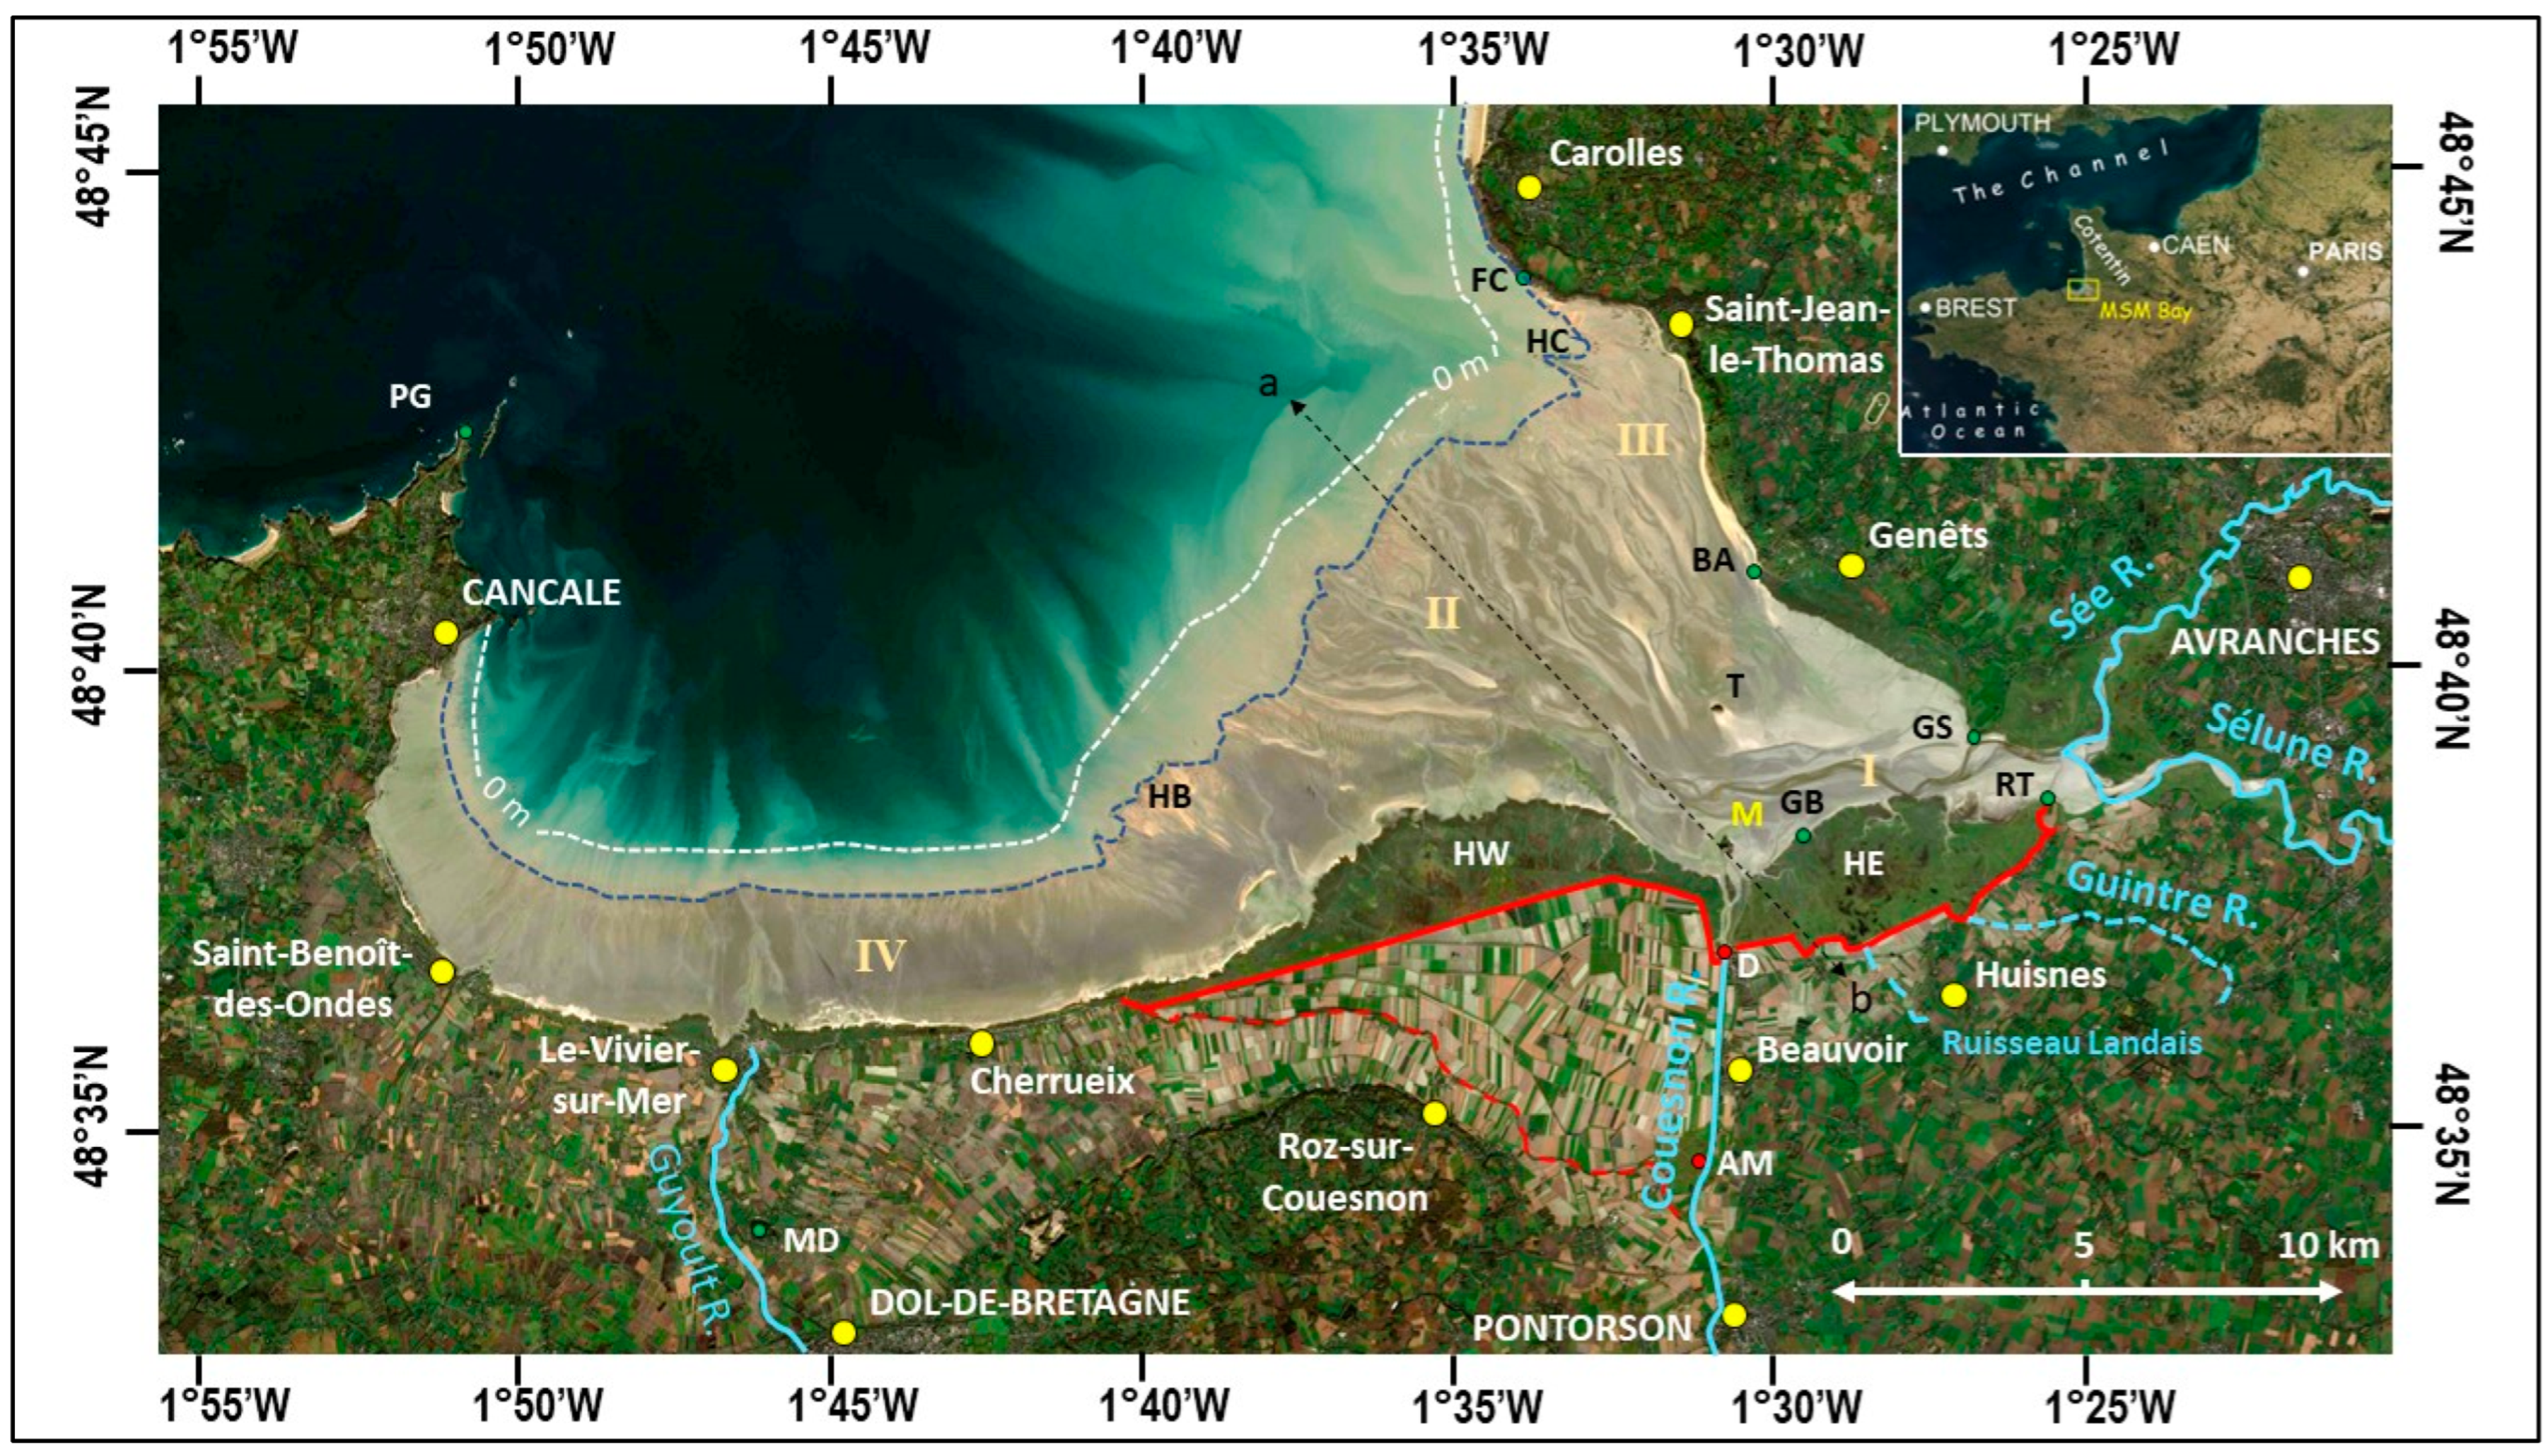
Figure 3.
Evolution of the Mont from 1952 to 2022 (aerial photographs from Google Earth except for between 1952 and 1986): facilities and sedimentation. Red arrows: erosion of the schorre; green arrows: progradation of the schorre. Light-blue dashed lines: Couesnon watercourses. CaD: Caserne Dam (1969); Cchl: Couesnon channel left bank; Cchr: Couesnon channel right bank; Cec: Couesnon eastern channel (2015); CoD: Couesnon Dam (2007–2009); cw: causeway (1878–1879); Cwc: Couesnon western channel (2012); d: dike (1933); dcw: destroyed causeway (2015); ncw: new causeway (2012); pe: polder east (1946); pf: pedestrian footbridge (2013); pw: polder west (1934); sp: spur (2015).

Figure 4.
Surface reflectance of the main landscape units in the Mont-Saint-Michel Bay from the S2-image acquired on 20 October 2022 (see also Table 1).
Figure 4.
Surface reflectance of the main landscape units in the Mont-Saint-Michel Bay from the S2-image acquired on 20 October 2022 (see also Table 1).

Figure 5.
Principles of image selection and main methodological steps. Solid arrow: satellite still operating in 2023; dashed arrow: no longer operational satellite; dashed double arrow: period of the works.
Figure 5.
Principles of image selection and main methodological steps. Solid arrow: satellite still operating in 2023; dashed arrow: no longer operational satellite; dashed double arrow: period of the works.
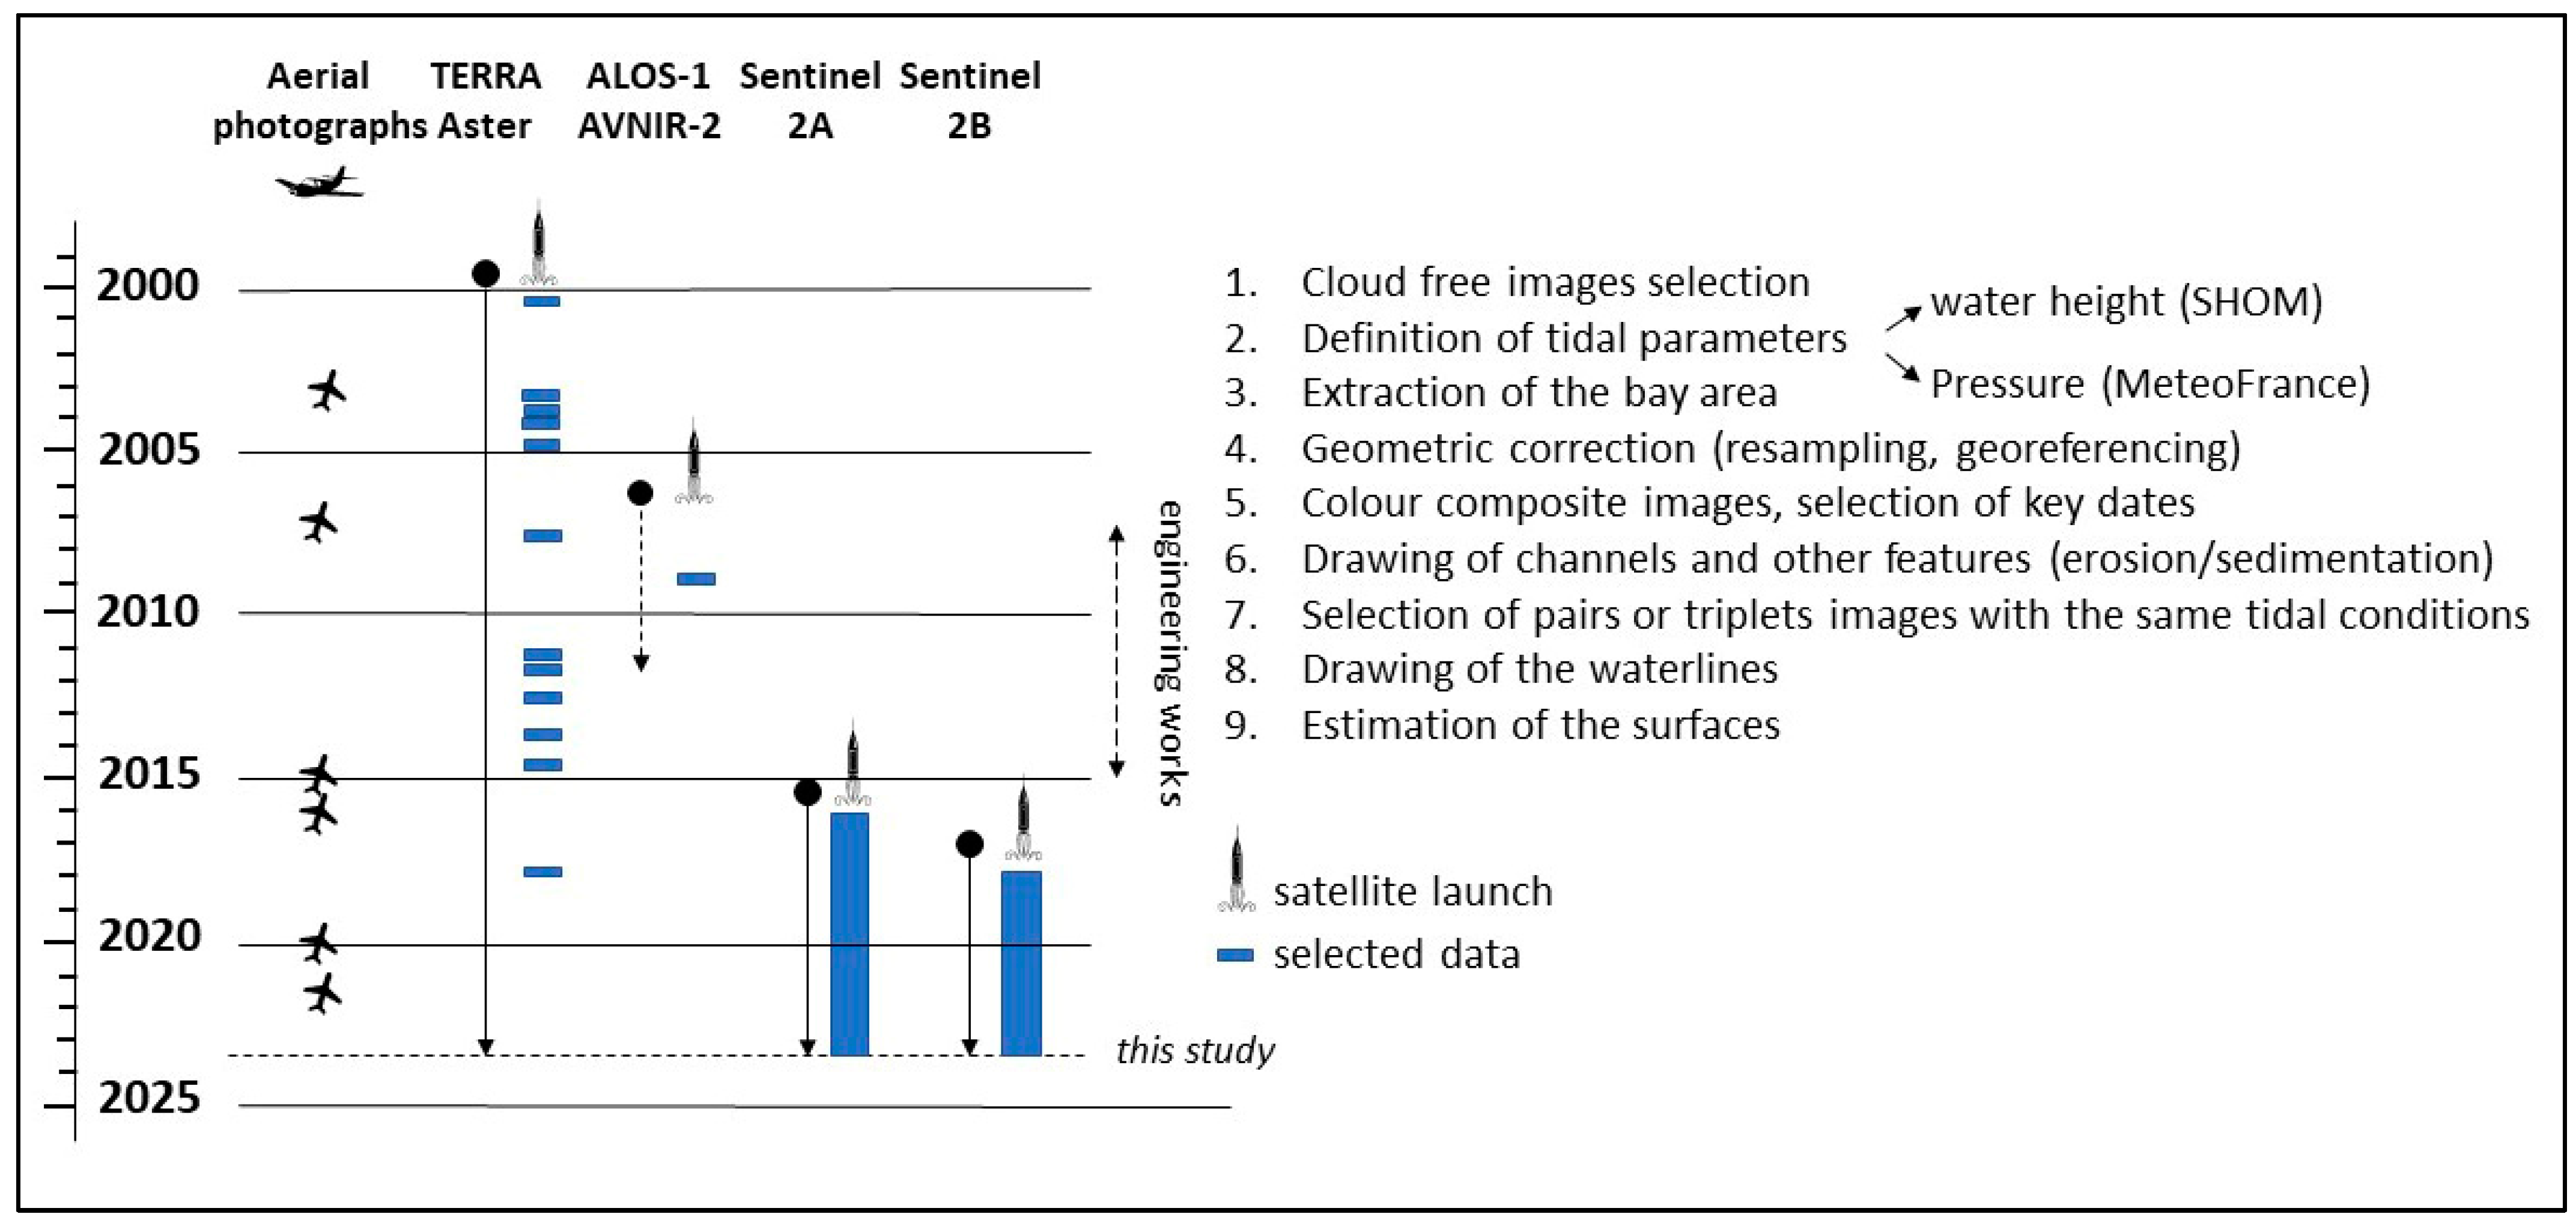
Figure 6.
Survey of the schorre lines. Areas used for calculating the schorre surface (Table 2). For readability, only three dates are illustrated (2007, 2015, 2022). The background image is the ALOS-AVNIR-2 false colour composites acquired on 24 October 2007. The Couesnon River constitutes the limit between MSM W and MSM E. The new facilities induce new schorre areas in the former course of the Couesnon (see ‘Couesnon’ in Table 2). Pw and pe correspond to the profiles for MSM-W and MSM-E, respectively.
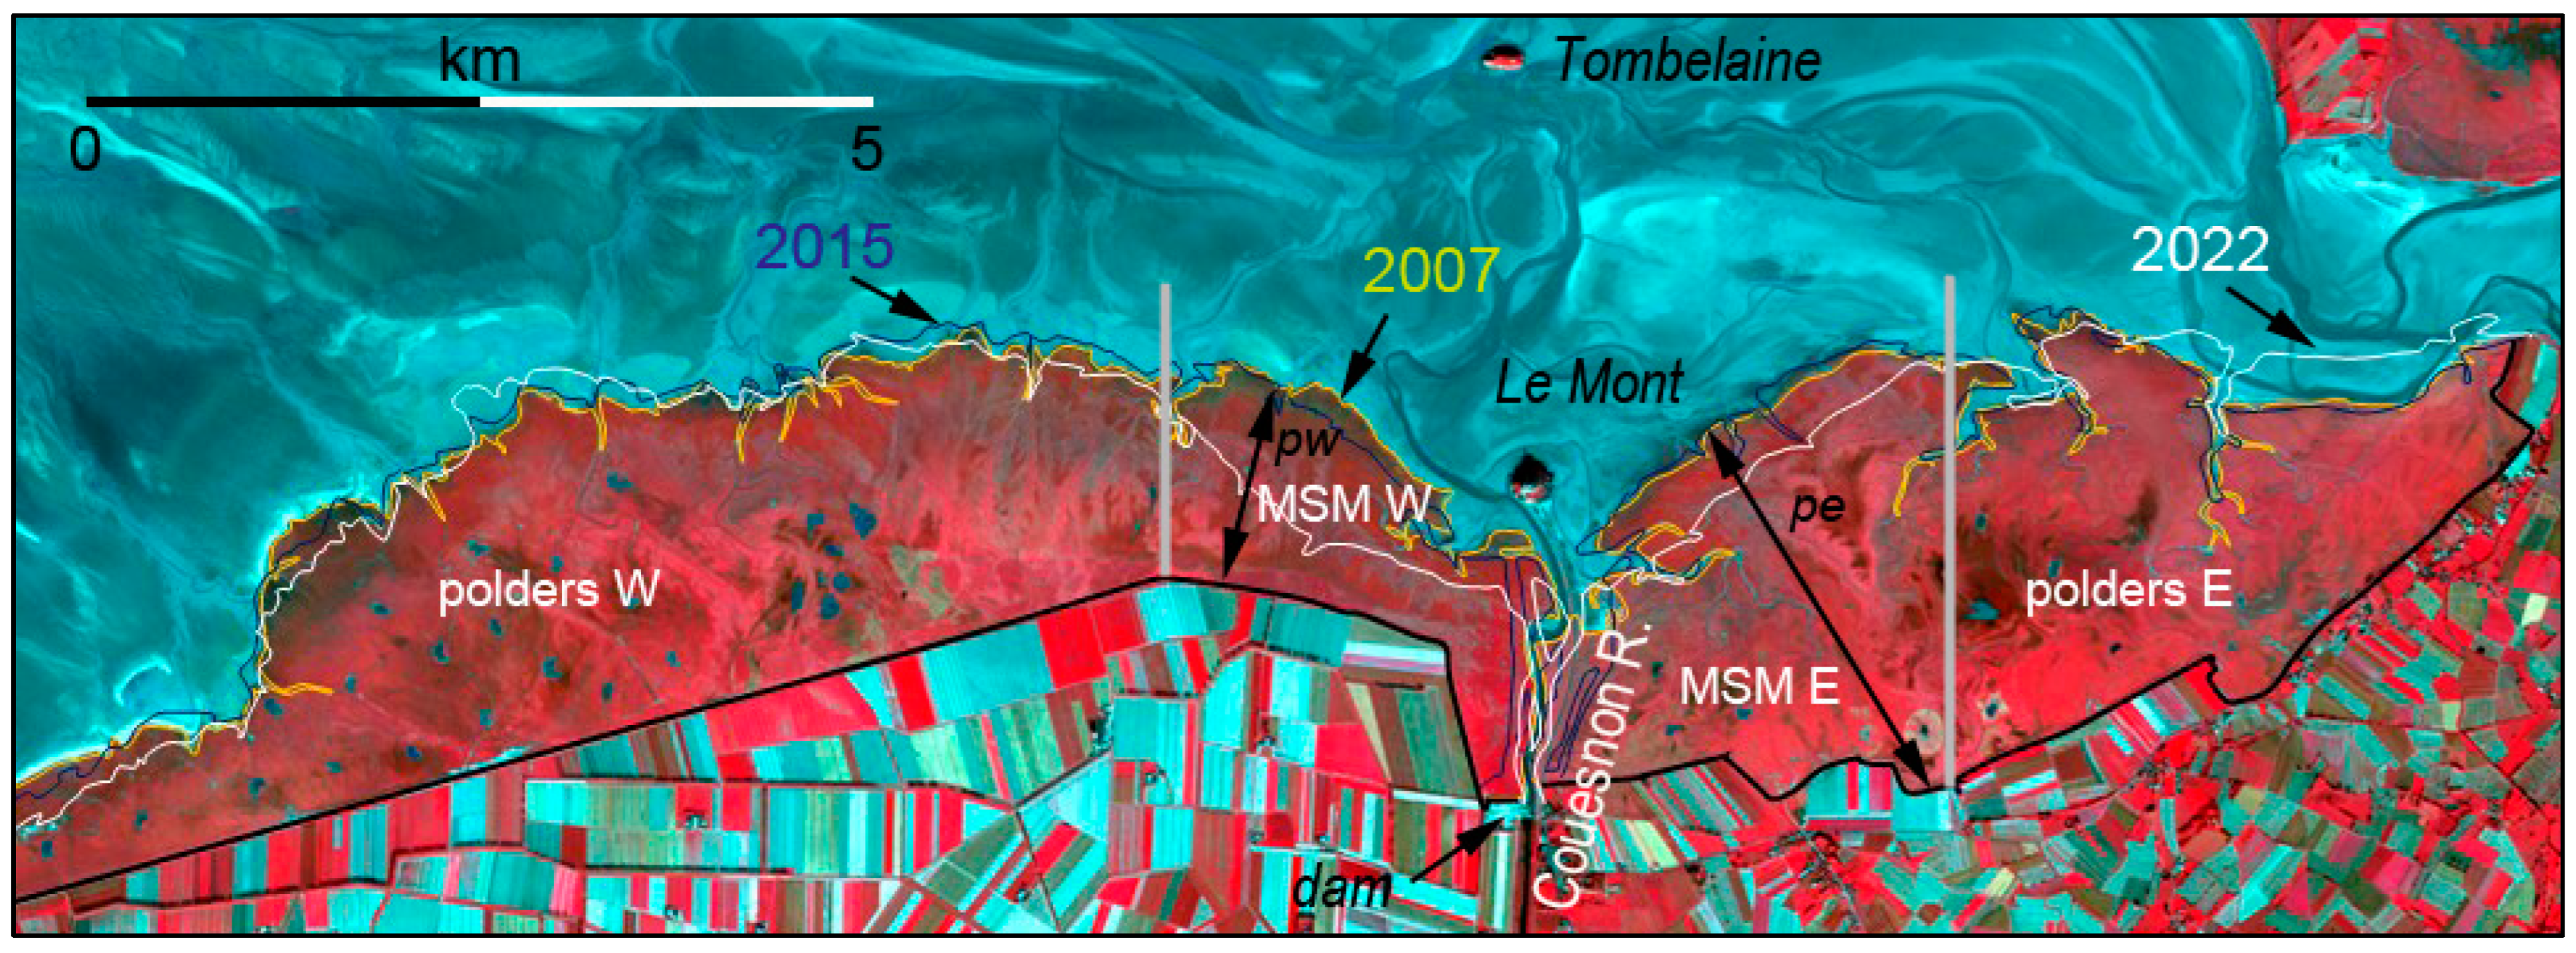
Figure 8.
Comparison of two S2 colour composites using only the infrared ranges (Red = near IR, i.e., band 8, Green = mid IR, i.e., band 11, Blue = Short Waves IR, i.e., band 12). The colour composite highlights the water bodies vs. land surfaces. BA: Bec d’Andaine; GS: Grouin du Sud; M: Mont-Saint-Michel; T: Tombelaine. The dashed lines correspond to the water height of 9.90 m.
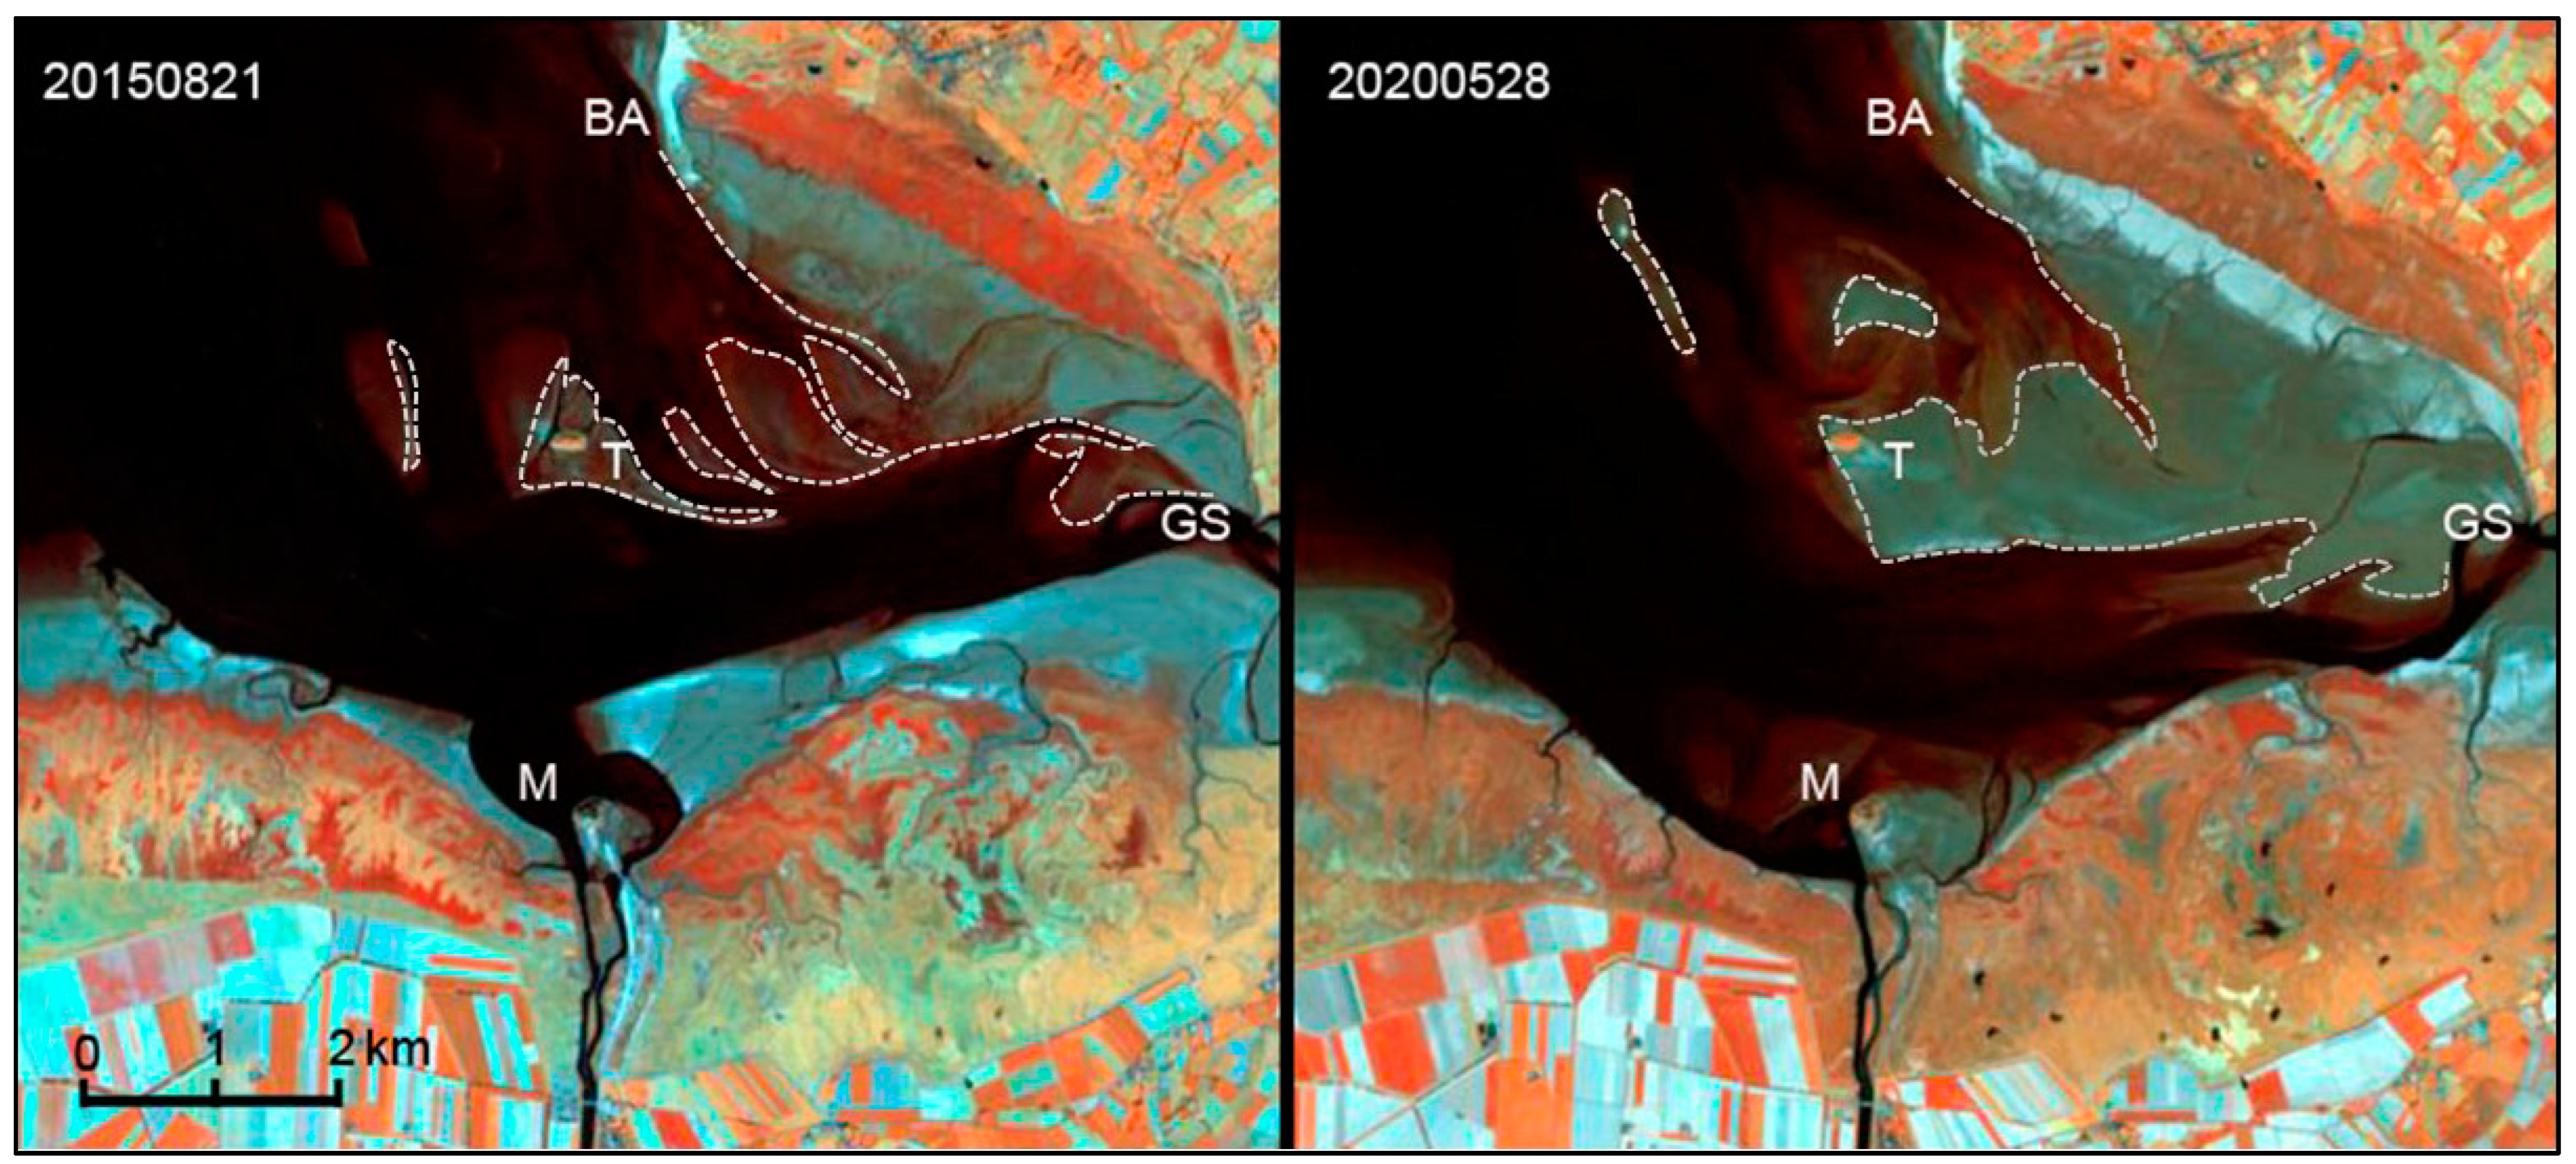
Figure 9.
Comparison of two S2 colour composite (see Figure 7 for further explanations). The dashed lines correspond to the water height of 10.21–10.23 m. A large-scale silting-up of the northeastern part of the bay is observed between Bec d’Andaine (BA), Grouin du Sud (GS), and Tombelaine (T).
Figure 9.
Comparison of two S2 colour composite (see Figure 7 for further explanations). The dashed lines correspond to the water height of 10.21–10.23 m. A large-scale silting-up of the northeastern part of the bay is observed between Bec d’Andaine (BA), Grouin du Sud (GS), and Tombelaine (T).
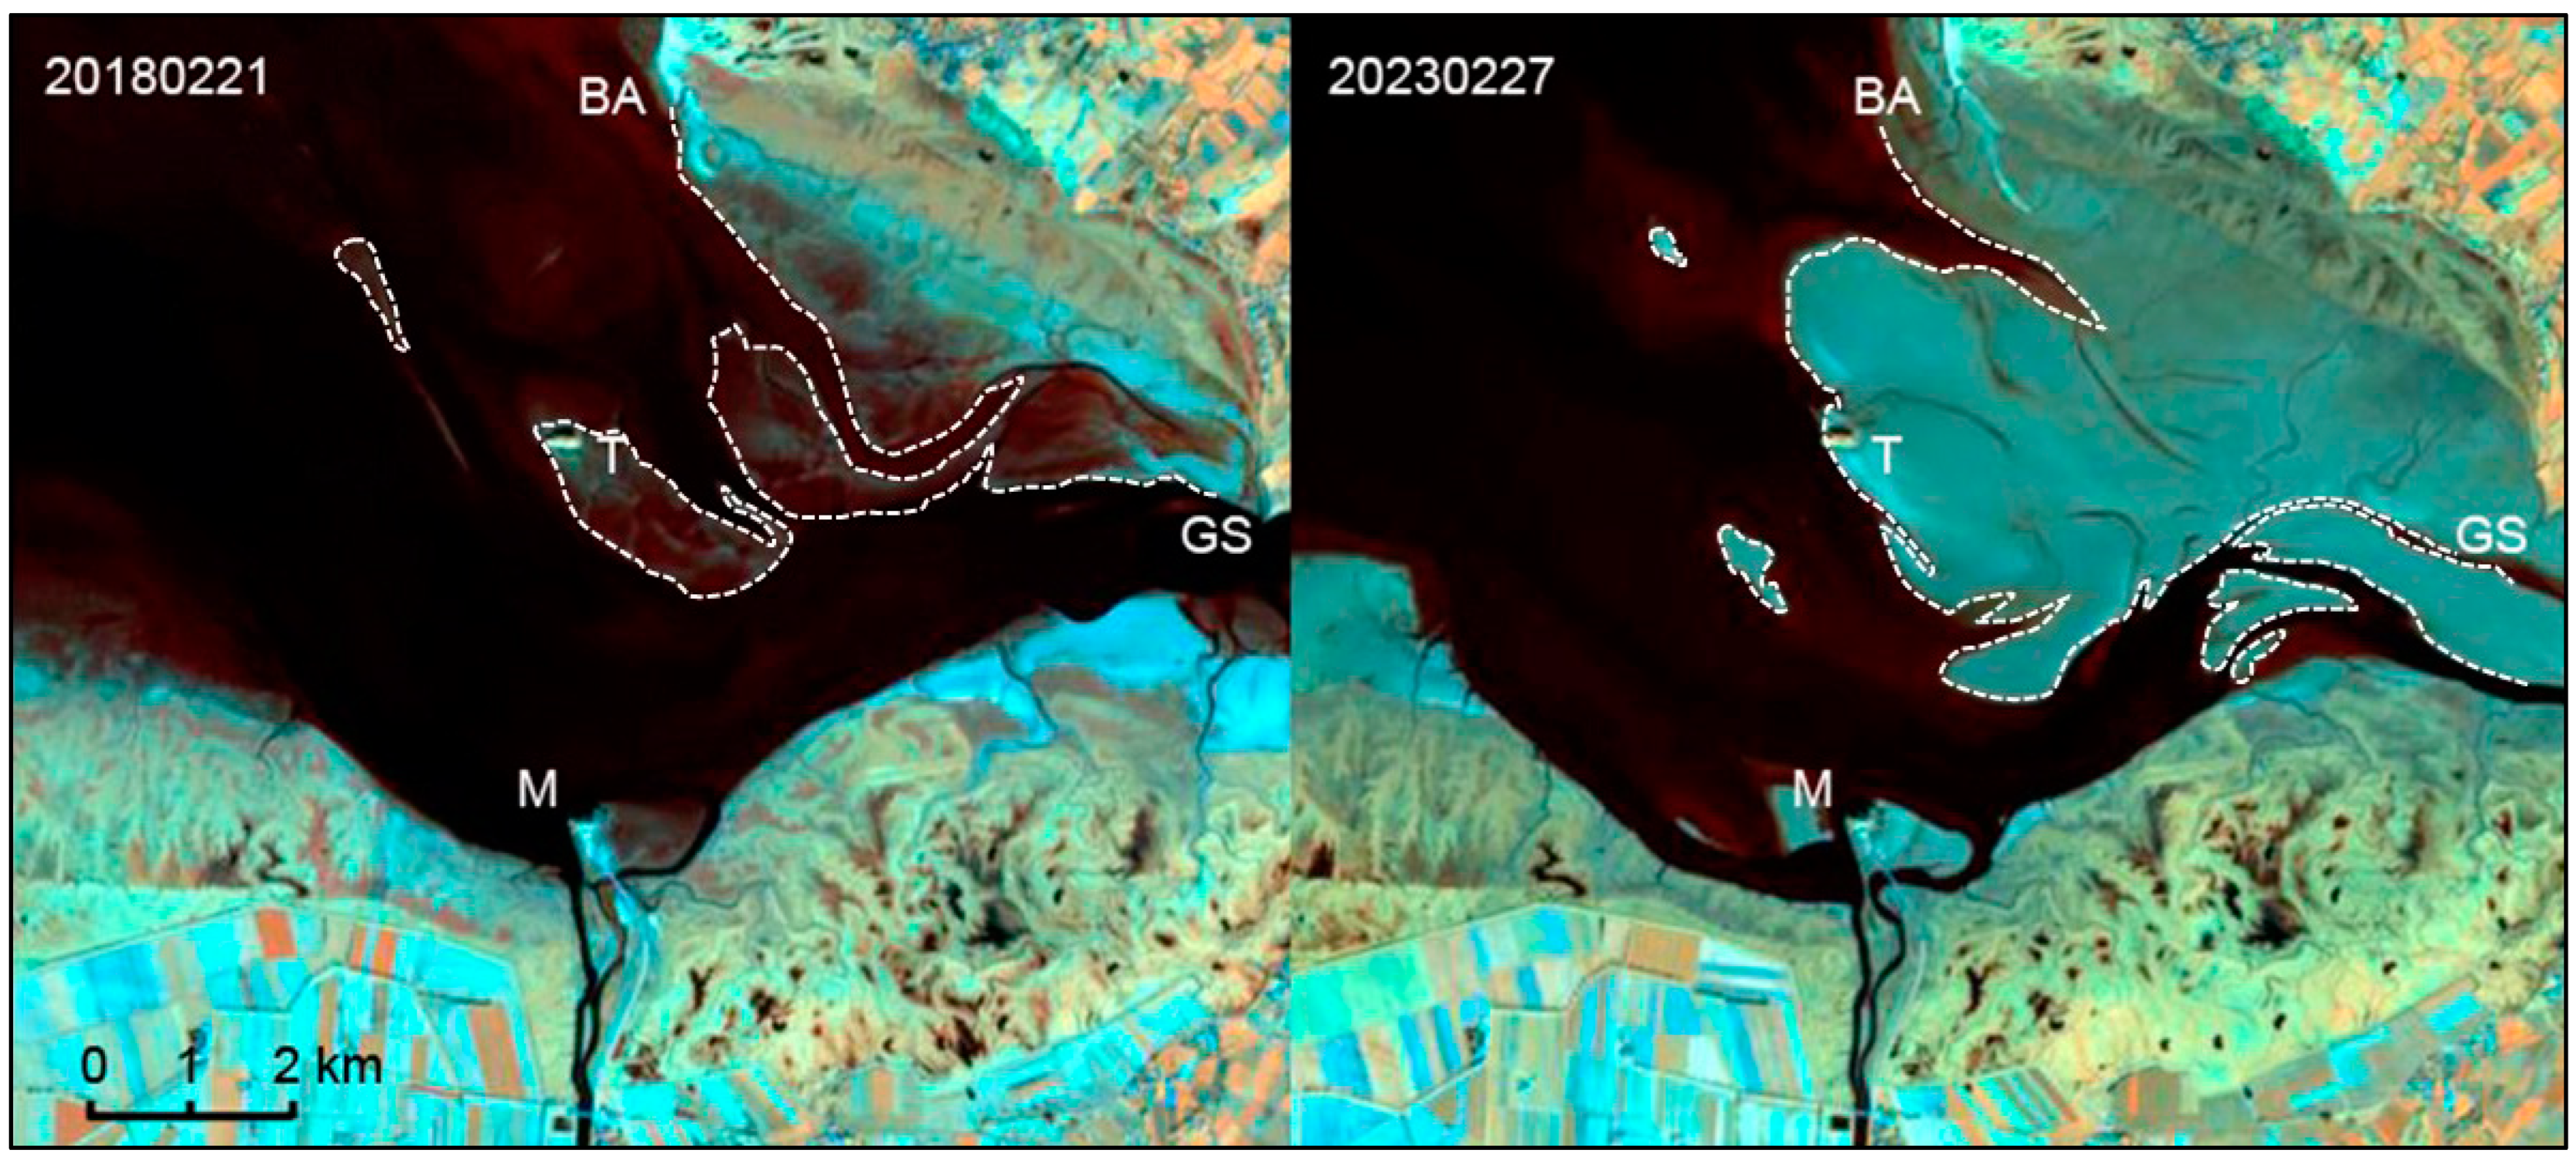
Figure 10.
Sketch of the marsh in both the west and east zones on 2007 (beginning of the works) and 2023 (present-day setting) showing the differential erosion. The western area has been totally modified within the next few years by mowing and replanting works.
Figure 10.
Sketch of the marsh in both the west and east zones on 2007 (beginning of the works) and 2023 (present-day setting) showing the differential erosion. The western area has been totally modified within the next few years by mowing and replanting works.

Figure 11.
Mont-Saint-Michel. Comparison of two-colour composite acquired in the same tidal conditions (neap tide, water height of 9.11 m in 1990 and 9.10 m in 2021, ebb tide about six hours before the low tide). The two dates are separated by 31 years. Only the infrared ranges are used. (Left): Landsat-5 TM acquired on 27 September 1990 (Red = near IR i.e., band 4, Green = mid IR i.e., band 5, Blue = Short Waves IR i.e., band 7). (Right): Sentinel 2A acquired on 28 October 2021 (Red = near IR i.e., band 8, Green = mid IR i.e., band 11, Blue = Short Waves IR i.e., band 12. BA: Bec d’Andaine, GS: Grouin du Sud, M: Mont-Saint-Michel, T: Tombelaine. Red dashed line: main erosion lines in 2021; black dashed lines: superimposition of the 2021 erosion lines; gray dashed lines: main flood channels; yellow dashed lines: Sée-Sélune River. See text for details.

Figure 12.
Photographs taken from the ramparts of the Mont-Saint-Michel (southward views). (A). 21 February 2023. (B). 31 May 2007. Note that the view angle is slightly different. Cars were parked very close to the Mont in 2007. In the background, demolition work on the Caserne dam has begun (a construction crane is visible). The Couesnon River is largely meandering in the schorre and located only to the west of the causeway. The new facilities will separate the Couesnon River into different parts (Couesnon east and west, channel along the spur) in 2023. The schorre has been partly eroded (see text for details).
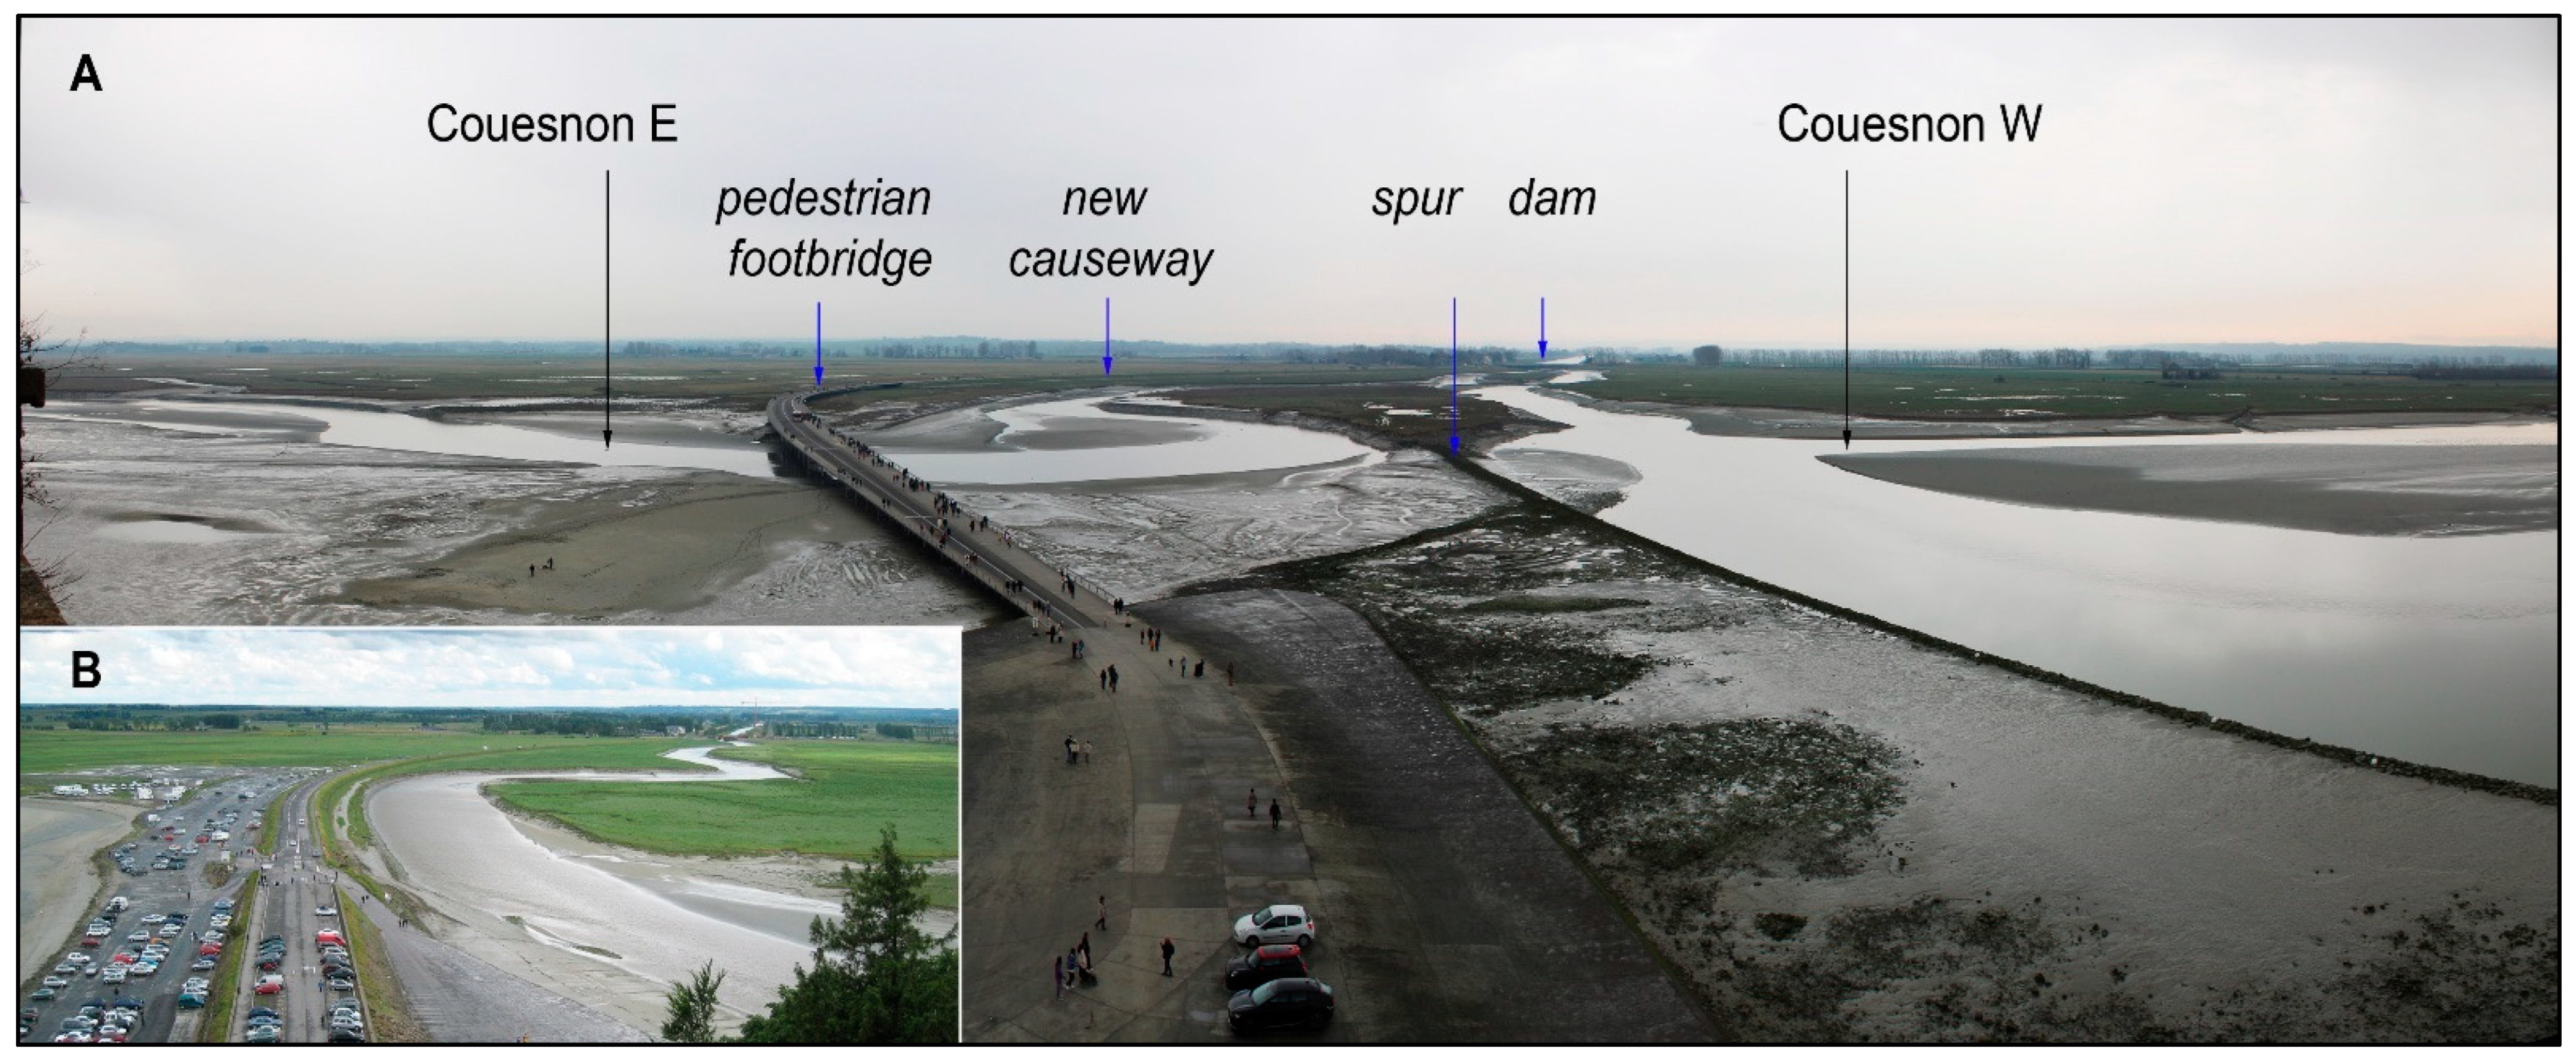
Figure 13.
Waterlines for 27 December 2022 (9.75 m in yellow dotted line), 29 December 2022 (11.41 m in red dotted line), and 11 January 2023 (8.38 m in black dotted line). The background image is the Sentinel-2 data acquired on 21 January 2023, at very low tide (3.01 m). BA: Bec d’Andaine, GS: Grouin du Sud, M: Mont-Saint-Michel, T: Tombelaine.


Table 1.
Surface reflectance of six regions of interest expressed in percentage from the S2-image acquired on 20 October 2022 and examples of ratios (NDVI, NDWI, Brightness Index) (see also Figure 4).
Table 1.
Surface reflectance of six regions of interest expressed in percentage from the S2-image acquired on 20 October 2022 and examples of ratios (NDVI, NDWI, Brightness Index) (see also Figure 4).
| S2-Spectral Range | Clear Water | Turbid Water | Humid Sediments | Dry Sediments | Vegetation Grand Banc | Vegetation Salt Meadows |
|---|---|---|---|---|---|---|
| Band 2 (497 nm) | 12.9 ± 1.22 | 19.8 ± 0.21 | 19.2 ± 0.98 | 25.8 ± 0.99 | 12.9 ± 0.90 | 13.7 ± 0.59 |
| Band 3 (560 nm) | 12.8 ± 1.20 | 23.4 ± 0.17 | 21.5 ± 1.27 | 27.9 ± 0.99 | 16.1 ± 0.67 | 18.0 ± 0.53 |
| Band 4 (664 nm) | 10.2 ± 0.95 | 22.9 ± 0.59 | 21.5 ± 1.08 | 28.5 ± 1.15 | 14.0 ± 1.45 | 14.9 ± 0.75 |
| Band 5 (704 nm) | 10.0 ± 0.93 | 24.1 ± 0.92 | 22.4 ± 1.09 | 30.1 ± 1.19 | 20.3 ± 0.65 | 24.0 ± 0.43 |
| Band 6 (740 nm) | 9.6 ± 0.90 | 18.8 ± 1.56 | 20.8 ± 2.34 | 29.7 ± 1.20 | 36.8 ± 6.78 | 44.2 ± 2.69 |
| Band 7 (782 nm) | 9.7 ± 0.90 | 18.8 ± 1.57 | 20.9 ± 2.37 | 29.9 ± 1.21 | 40.8 ± 8.00 | 48.3 ± 3.12 |
| Band 8 (835 nm) | 9.7 ± 0.91 | 15.8 ± 1.37 | 20.5 ± 3.48 | 30.5 ± 1.35 | 42.0 ± 8.80 | 51.2 ± 3.10 |
| Band 11 (1614 nm) | 9.9 ± 0.91 | 10.3 ± 0.10 | 16.4 ± 5.07 | 34.2 ± 2.85 | 26.4 ± 5.18 | 36.3 ± 1.08 |
| Band 12 (2202 nm) | 10.0 ± 0.92 | 10.3 ± 0.10 | 14.3 ± 3.92 | 30.9 ± 3.44 | 18.2 ± 2.37 | 23.4 ± 0.53 |
| Ratios | ||||||
| NDVI | −0.02 | −0.18 | −0.02 | 0.03 | 0.50 | 0.55 |
| NDWI | −0.01 | 0.21 | 0.11 | −0.06 | 0.23 | 0.17 |
| Brightness Index | 14.1 | 27.9 | 29.7 | 41.8 | 44.3 | 53.3 |
Table 2.
Surfaces of the ‘schorre’ surfaces expressed in ha. The dates are given according to yyyymmdd (see also Figure 6 for location).
Table 2.
Surfaces of the ‘schorre’ surfaces expressed in ha. The dates are given according to yyyymmdd (see also Figure 6 for location).
| Date | Polders W | MSM W | Total W | MSM E | Polders E | Total E | Couesnon | Grand Total |
|---|---|---|---|---|---|---|---|---|
| 20000407 | 1077.2 | 254.4 | 1331.6 | 488.1 | 571.5 | 1059.6 | 2391.2 | |
| 20040909 | 1199.6 | 281.1 | 1480.7 | 511.5 | 551.7 | 1063.3 | 2544.0 | |
| 20071024 | 1194.8 | 285.7 | 1480.5 | 535.9 | 604.5 | 1140.4 | 2620.9 | |
| 20120526 | 1176.0 | 259.8 | 1435.8 | 501.3 | 606.8 | 1108.1 | 2543.9 | |
| 20150801 | 1214.0 | 251.3 | 1465.3 | 493.7 | 628.7 | 1122.4 | 14.5 | 2602.3 |
| 20161031 | 1225.0 | 243.4 | 1468.4 | 518.6 | 616.7 | 1135.3 | 9.7 | 2613.4 |
| 20171113 | 1213.8 | 225.0 | 1438.8 | 502.9 | 621.2 | 1124.1 | 12.6 | 2575.4 |
| 20181021 | 1224.7 | 214.3 | 1439.1 | 508.5 | 629.9 | 1138.4 | 8.7 | 2586.1 |
| 20190919 | 1226.6 | 190.6 | 1417.3 | 489.5 | 641.3 | 1130.8 | 9.2 | 2557.2 |
| 20200913 | 1236.7 | 178.2 | 1414.9 | 466.7 | 661.2 | 1127.9 | 9.3 | 2552.0 |
| 20211008 | 1236.6 | 162.6 | 1399.2 | 475.6 | 664.6 | 1140.2 | 10.2 | 2549.6 |
| 20221020 | 1217.9 | 150.2 | 1368.1 | 448.3 | 684.1 | 1132.4 | 9.0 | 2509.5 |
| 20230408 | 1228.9 | 132.5 | 1361.4 | 469.2 | 644.3 | 1113.6 | 7.5 | 2482.4 |
Disclaimer/Publisher’s Note: The statements, opinions and data contained in all publications are solely those of the individual author(s) and contributor(s) and not of MDPI and/or the editor(s). MDPI and/or the editor(s) disclaim responsibility for any injury to people or property resulting from any ideas, methods, instructions or products referred to in the content. |
© 2023 by the author. Licensee MDPI, Basel, Switzerland. This article is an open access article distributed under the terms and conditions of the Creative Commons Attribution (CC BY) license (https://creativecommons.org/licenses/by/4.0/).
Share and Cite
MDPI and ACS Style
Deroin, J.-P. Evaluating the Impact of Engineering Works in Megatidal Areas Using Satellite Images—Case of the Mont-Saint-Michel Bay, France. GeoHazards 2023, 4, 453-474. https://doi.org/10.3390/geohazards4040026
AMA Style
Deroin J-P. Evaluating the Impact of Engineering Works in Megatidal Areas Using Satellite Images—Case of the Mont-Saint-Michel Bay, France. GeoHazards. 2023; 4(4):453-474. https://doi.org/10.3390/geohazards4040026
Chicago/Turabian StyleDeroin, Jean-Paul. 2023. "Evaluating the Impact of Engineering Works in Megatidal Areas Using Satellite Images—Case of the Mont-Saint-Michel Bay, France" GeoHazards 4, no. 4: 453-474. https://doi.org/10.3390/geohazards4040026