
Seismic Fragility Curves of RC Buildings Subjected to Aging
by
 , and
, and
Spyridon Diamantopoulos
1,
Zeinep Achmet
1,
Sotiria Stefanidou
2,
Olga Markogiannaki
2 and
Michalis Fragiadakis
1,* 1
School of Civil Engineering, National Technical University of Athens, 9, Iroon Polytechniou St., 15780 Athens, Greece
2
Competence Center SURE, 50100 Kozani, Greece
*
Author to whom correspondence should be addressed.
GeoHazards 2024, 5(1), 192-208; https://doi.org/10.3390/geohazards5010010
Submission received: 26 January 2024
/
Revised: 15 February 2024
/
Accepted: 18 February 2024
/
Published: 27 February 2024
(This article belongs to the Topic Natural Hazards and Environmental Challenges in the Anthropocene Age)
Abstract
:A large number of existing reinforced concrete (RC) buildings have surpassed their anticipated service life and show signs of degradation due to aging; this degradation is a function of the construction practices adopted in the past as well as environmental conditions. This paper discusses seismic fragility and the risk assessment of RC structures, emphasizing the impact of corrosion due to concrete aging and the associated deterioration mechanisms. The literature on this topic is critically reviewed, and a methodology for studying the seismic fragility of deteriorated RC buildings is proposed. As a case study, a four-story RC building designed according to contemporary code provisions is examined. The investigation encompasses the derivation of fragility curves, considering critical parameters such as the corrosion rate, the initiation time, and the cover depth. The proposed approach enables the evaluation and quantification of the impact of corrosion mechanisms on the seismic performance of buildings.
1. Introduction
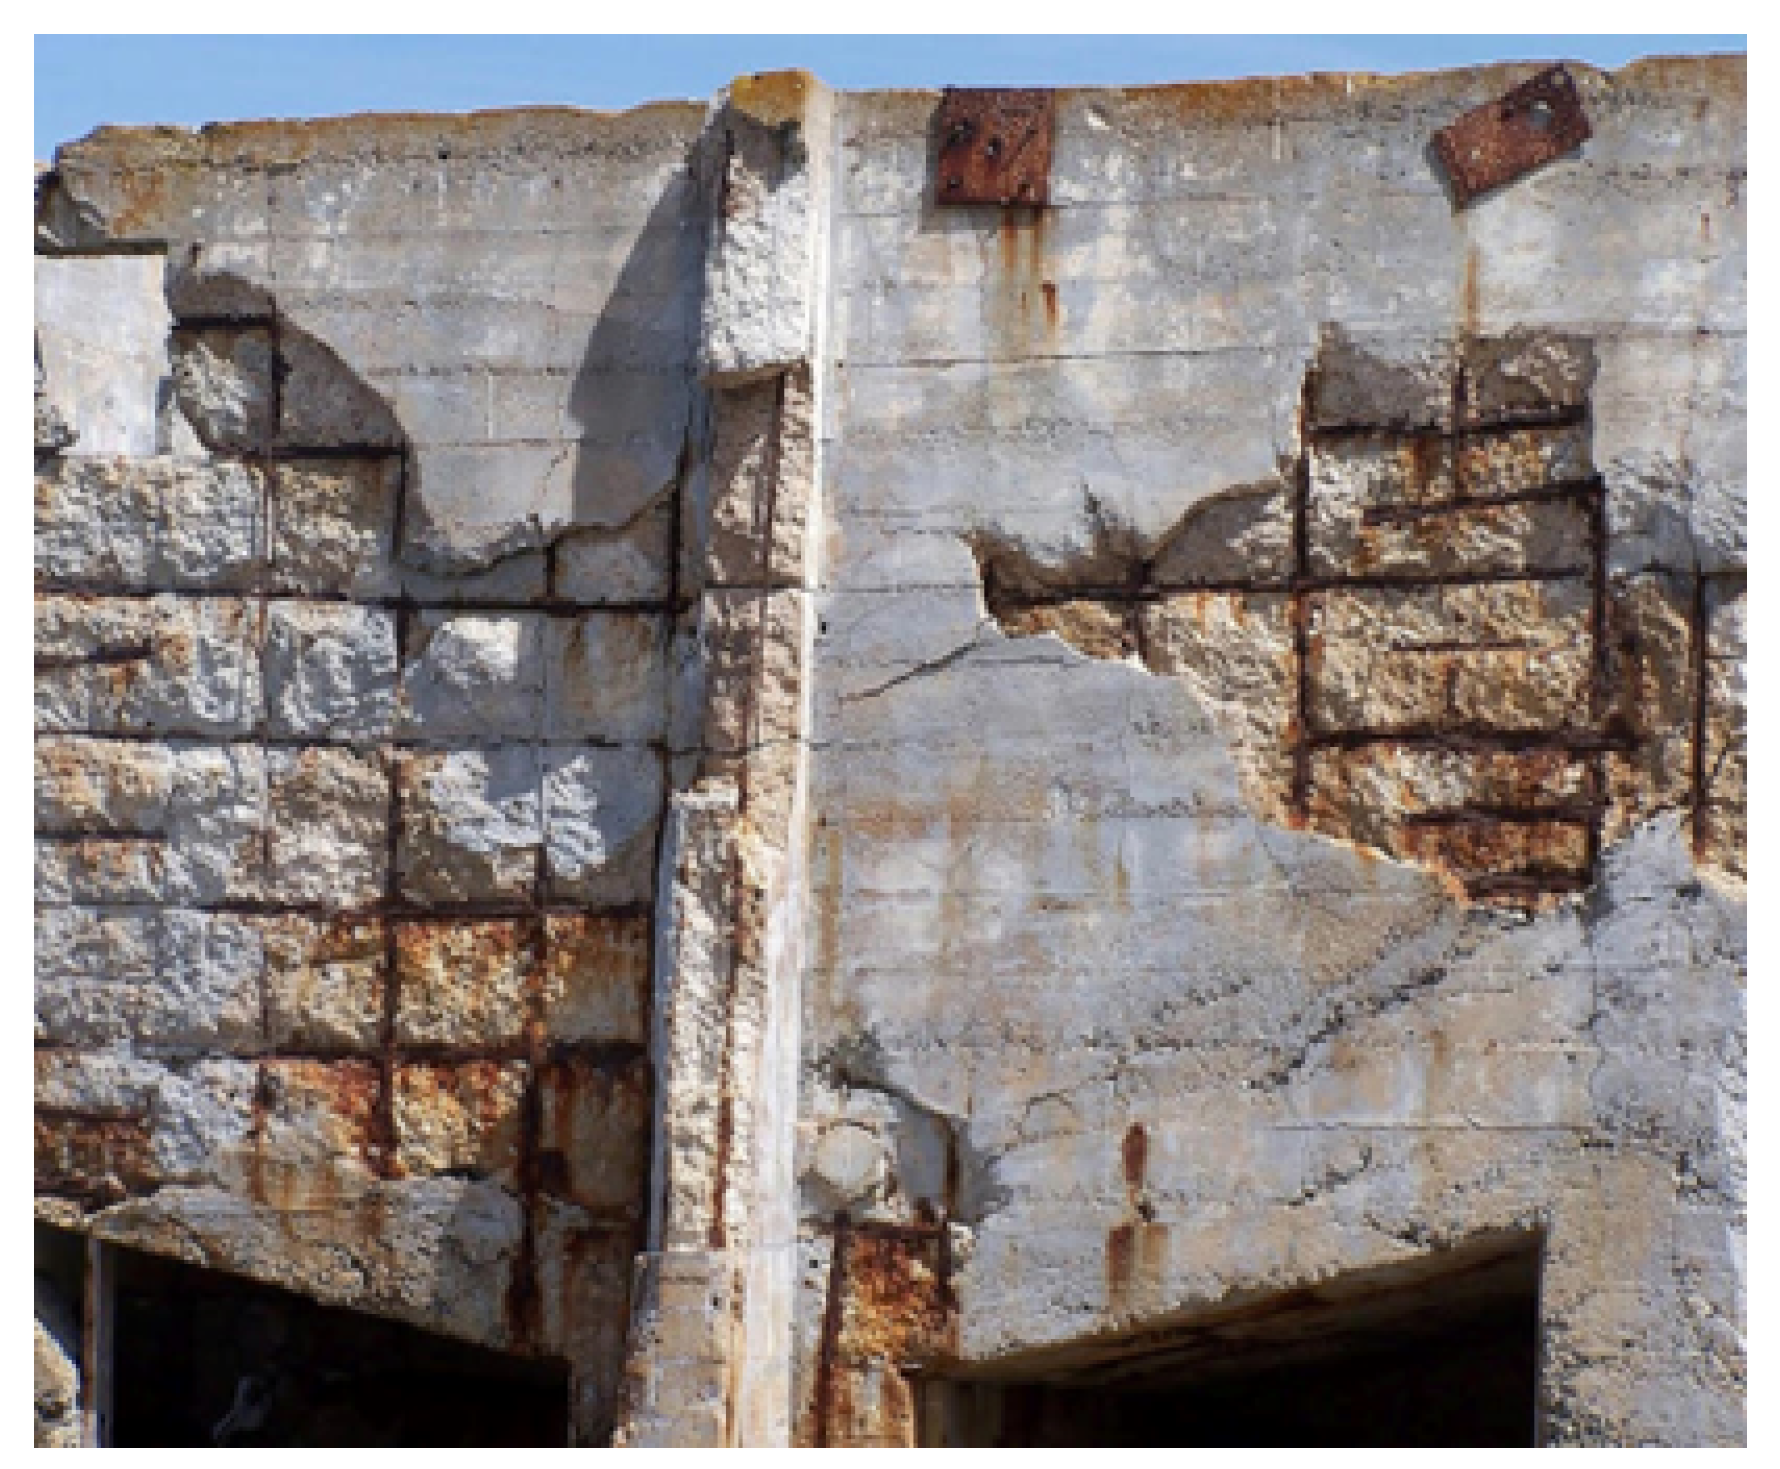
Reinforced concrete (RC) has been a widely used structural material for several decades. However, particularly in seismic-prone areas, in recent years, we have seen a growing number of discussions regarding the optimal lifespan of concrete structures. Research shows that the lifespan of RC buildings depends mainly on concrete characteristics and environmental conditions. The most common factors that affect concrete durability are as follows: (i) An intensely alkaline atmospheric environment (pollution); (ii) Intense temperature fluctuations in the environment; and (iii) The proximity to a marine environment. Concrete aging often damages the RC members, as shown in Figure 1. Therefore, it is evident that the long-term durability of an RC structure is characterized by its ability to meet functional, structural, and stability criteria throughout its service life, with a minimal loss of capacity. Due to the high cost of addressing concrete aging, the international community considers concrete durability to be a major problem facing modern societies. The significance of considering the environmental conditions during the design and assessment of RC structures, as well as the possibility of preventive measures, is a topic that should be explicitly addressed in design codes and guidelines.
According to Bertolini et al. [1], the processes that may cause concrete degradation are mechanical, physical, structural, biological, and chemical. Chemical processes, such as attacks by alkali, sulfate, water, and electrochemical (chloride ions [2], carbonation) reactions, may lead to the corrosion of reinforcing steel. Moreover, the carbonation [3,4,5] of concrete and the penetration of chlorides are two common reasons for reinforcement corrosion [6,7]. Figure 2a shows the impact of chloride ions attacking the rebars [8] in an RC structure, while Figure 2b shows an example of progressive structural deterioration due to concrete carbonation [9]. In fact, deterioration encompasses a broader range of factors, including aging, which contribute to structural degradation.
Aging reduces the structural capacity of a building. This is a critical problem, especially in seismic-prone areas. Considering the above, during the capacity assessment of existing RC structures, the impact of corrosion should be taken into consideration. The current study aims to examine the impact of aging and the corresponding deterioration mechanisms with respect to seismic capacity. With the aid of a case study of a four-story RC building designed in accordance with contemporary code provisions, our study involves deriving fragility curves to study the impacts of the most critical problem parameters. This analysis facilitates the assessment and quantification of the influence of structural and environmental parameters on seismic performance, juxtaposed with existing findings in the literature.
2. Degradation of Reinforced Concrete Structures
2.1. Damage and Durability
Concrete damage refers to the degradation of a material’s mechanical properties. Although the design of RC structures to modern standards and codes tends to mitigate the problem, the inevitable aging of structures leads to capacity degradation. The durability of concrete depends on several factors, all of which significantly influence its long-term performance. Major parameters include the water–cement ratio, curing methodologies, the mix design, and the quality of constituent materials. Specific properties are influenced by admixtures and air entrainment, whereas the selection and quality of aggregates impact both strength and ductility. Furthermore, construction practices, reinforcement protection, exposure conditions, and temperature control are essential for ensuring durability. Further durability enhancement can be achieved through crack and shrinkage control, the incorporation of corrosion inhibitors, and the use of sealants. In all, each element in the concrete mix and construction process contributes to the overall resilience of the structure, while structural design plays a pivotal role in ensuring that an RC building can withstand both design actions and environmental challenges during the building’s lifetime.
The major threat to concrete durability is the corrosion of reinforcement. Corrosion leads to the formation of oxidation products, which, due to their increased volume, can cause concrete cracking. This phenomenon occurs when the protective layer of steel, known as passivation, is disrupted by the alkaline conditions within the concrete in the presence of moisture and oxygen. The corrosion of steel leads to a decrease in the bar’s cross-sectional area as the affected steel becomes rust. Furthermore, corrosion not only diminishes the ductility of steel but also disproportionately weakens its strength, significantly impacting the seismic performance of the structural members. Since the rust has two to six times the volume of steel, it induces cracking by delaminating the protective cover, reducing (or even eliminating) the bond, and exposing the steel rebars to further corrosion. These factors cumulatively reduce the mechanical properties of the steel material. The absence of seismic design codes at the time these buildings were constructed has increased their vulnerability, imposing the need for retrofitting actions.
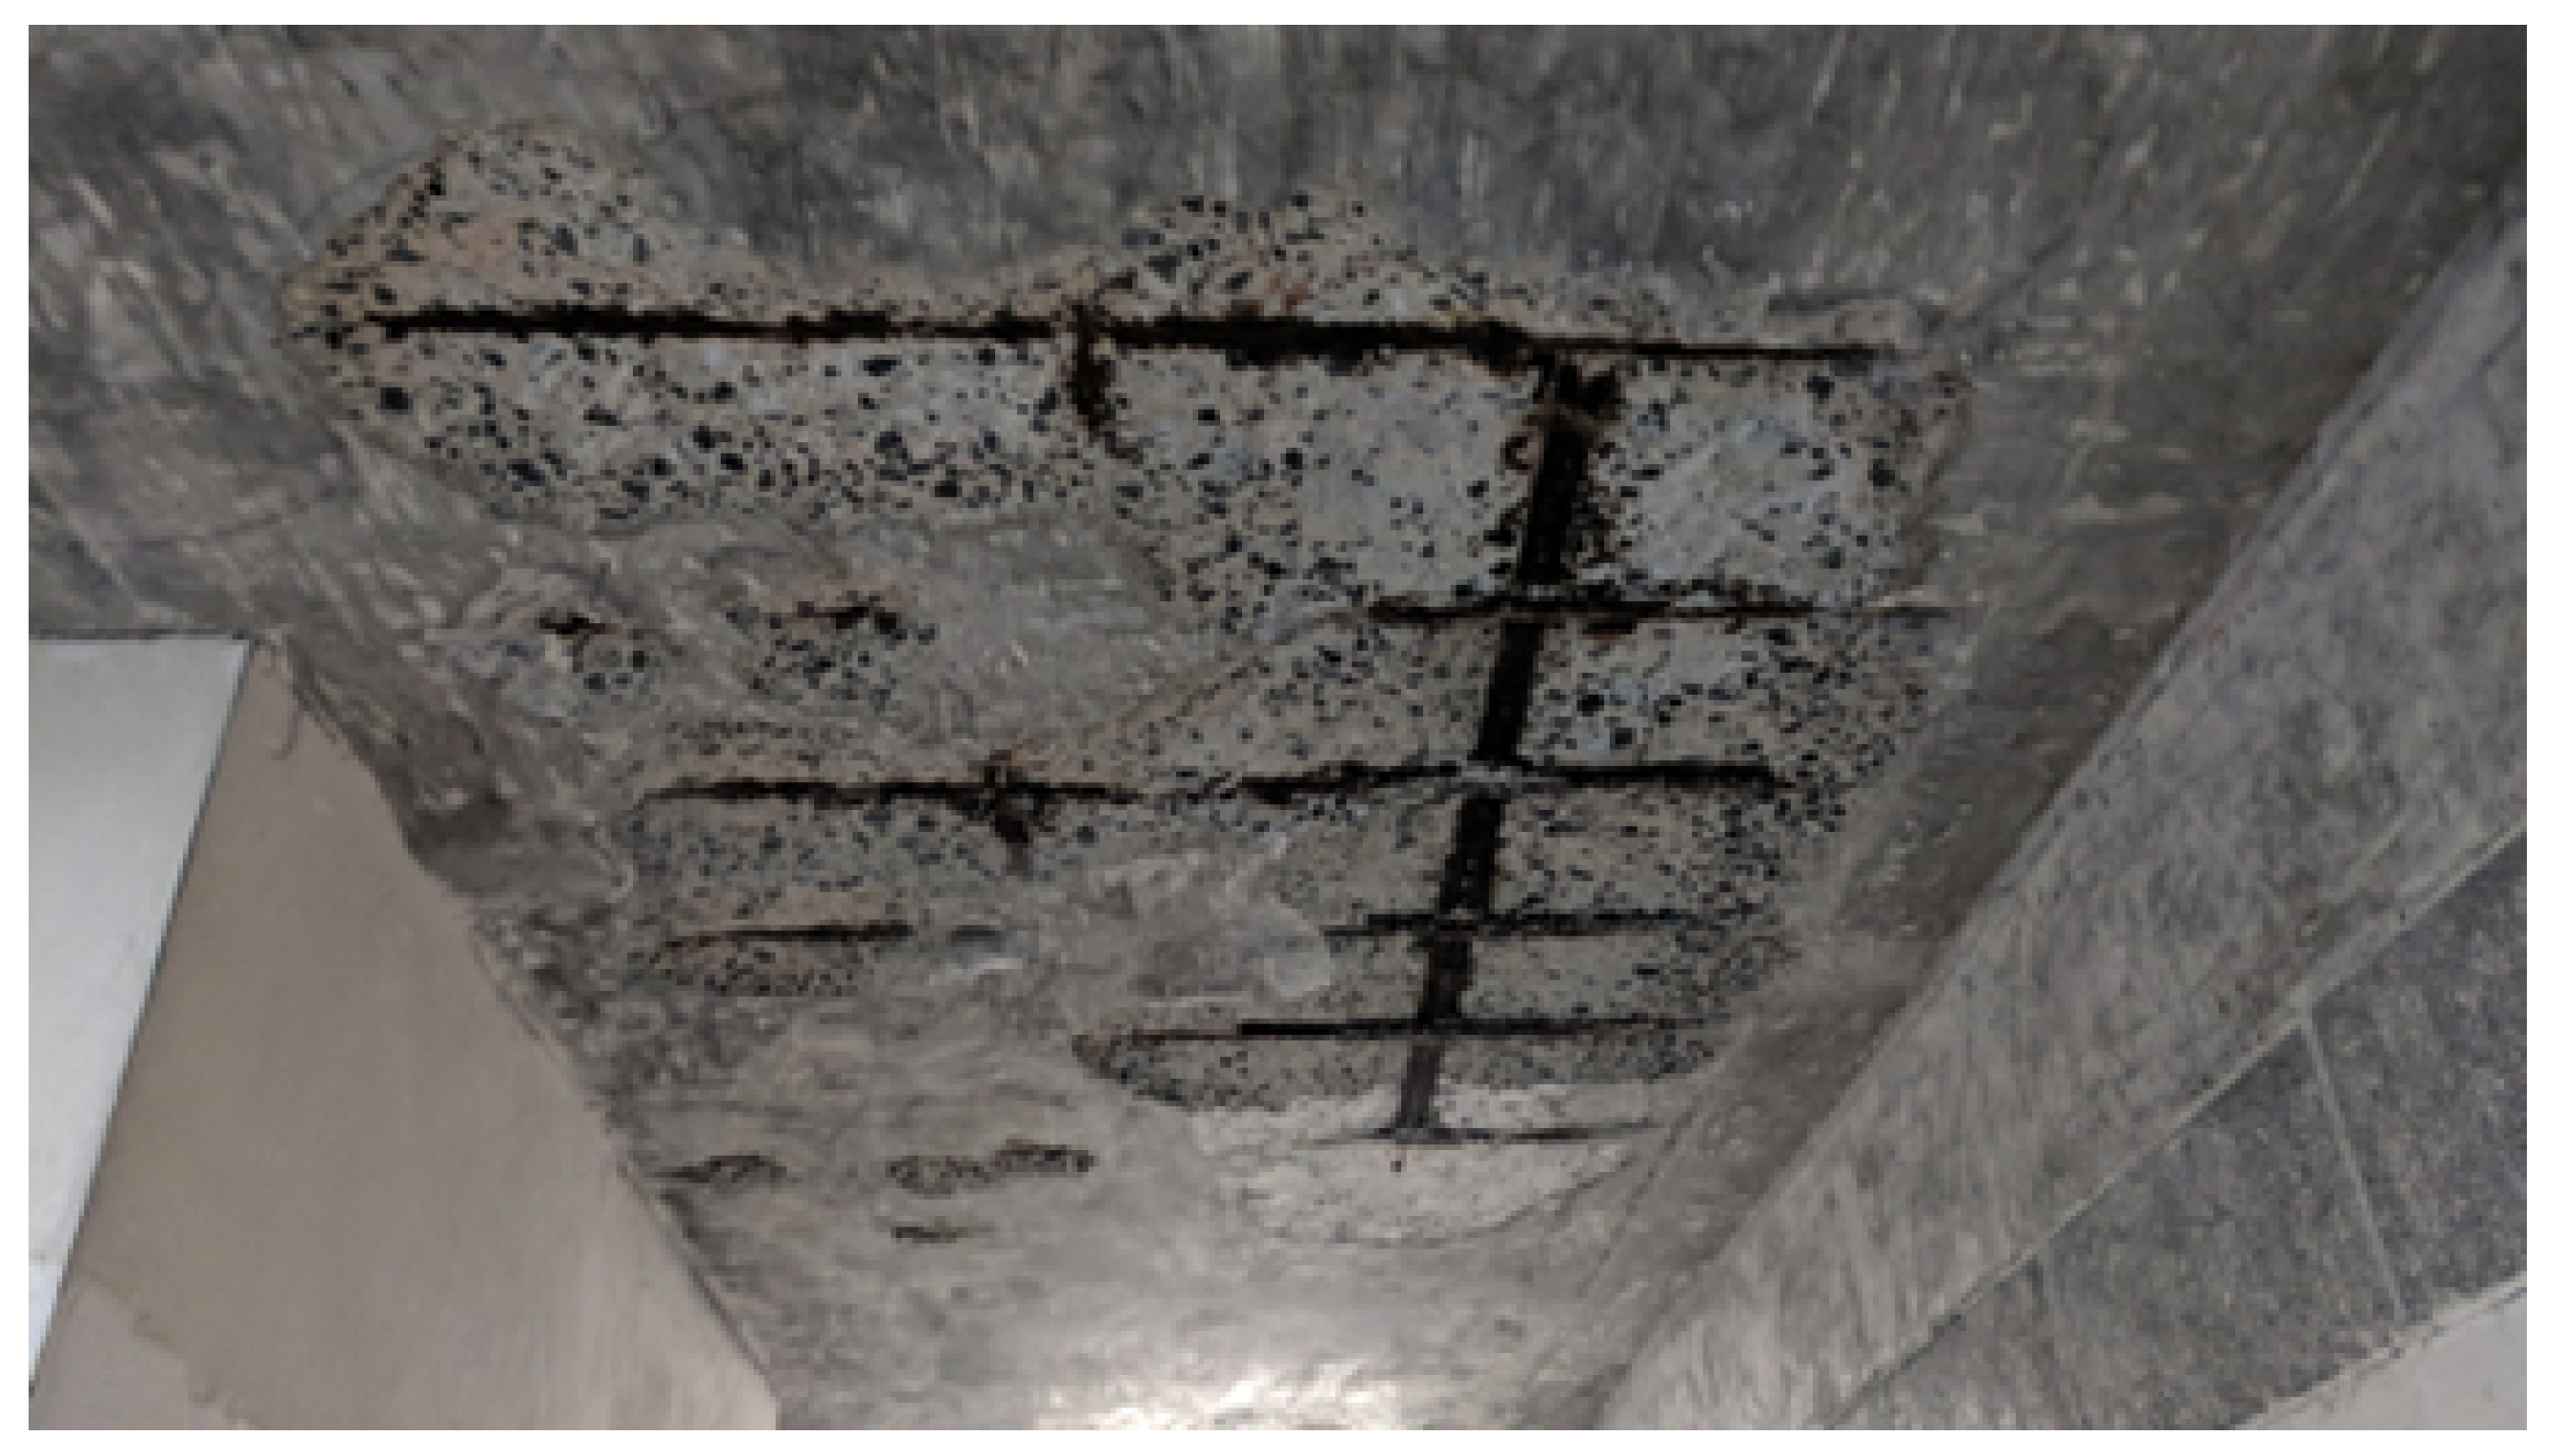
The process in which the cement paste reacts with atmospheric carbon dioxide is termed concrete carbonation. An example of concrete carbonation in a structural member of a building is shown in Figure 3. As carbon dioxide uses the gaseous phase within the concrete, the level of carbonation intensifies. One immediate outcome of carbonation is the decline in alkalinity of the concrete encasing the reinforcement rebars, with pH values that are dropped below 9. The chlorides exist either as internal components of concrete, e.g., due to the incorporation of aggregates from a site close to the sea, or through the addition of chloride salts as admixtures in the concrete mix. Moreover, the chlorides can originate from the surrounding concrete environment, particularly in coastal areas. The first consequence of exposing reinforced concrete to chlorides is the deterioration of the protective oxide layer that surrounds the reinforcement rebars. This layer is a product of the high alkalinity of the concrete surrounding the reinforcement, and its loss exposes the steel rebars to a corrosive environment, as shown in Figure 4.
In summary, aging results in the degradation of concrete durability through the reduction in both concrete and steel reinforcement properties. Moreover, aging results in a reduction in the effective cross-sectional area of rebars and degrades the mechanical performance of steel rebars (Figure 4b). A loss of the concrete–steel bond is also observed.
2.2. Corrosion Mechanism
The corrosion of RC structures exhibits two phases: the initiation period and the propagation period [10]. Figure 5 shows the level of structural deterioration as a function of the two phases. Furthermore, Figure 6 shows the impact of reinforcement corrosion on an RC cross-section [11]. The first phase involves the initiation of corrosion, where chloride penetration and/or carbonation of concrete occurs. This period does not harm the concrete or the reinforcement [12]. The reinforcement is de-passivated [1] and the propagation phase starts when the carbonation front reaches the reinforcement, or the chloride concentration at the reinforcement reaches a critical threshold value. This is indicated as point 1 in Figure 5. During the propagation phase, the reinforcing element displays cracks (point 2) leading to spalling (point 3) of the concrete cover. Finally, the loss of the reinforcement cross-section or the bond failure may reduce the load-bearing capacity of structural elements and may lead to the collapse of the structure (point 4). The estimation of the corrosion initiation time and environmental and structural parameters, as well as the effects of the corrosion on the RC structure elements during the propagation phase, are discussed in the following sections.
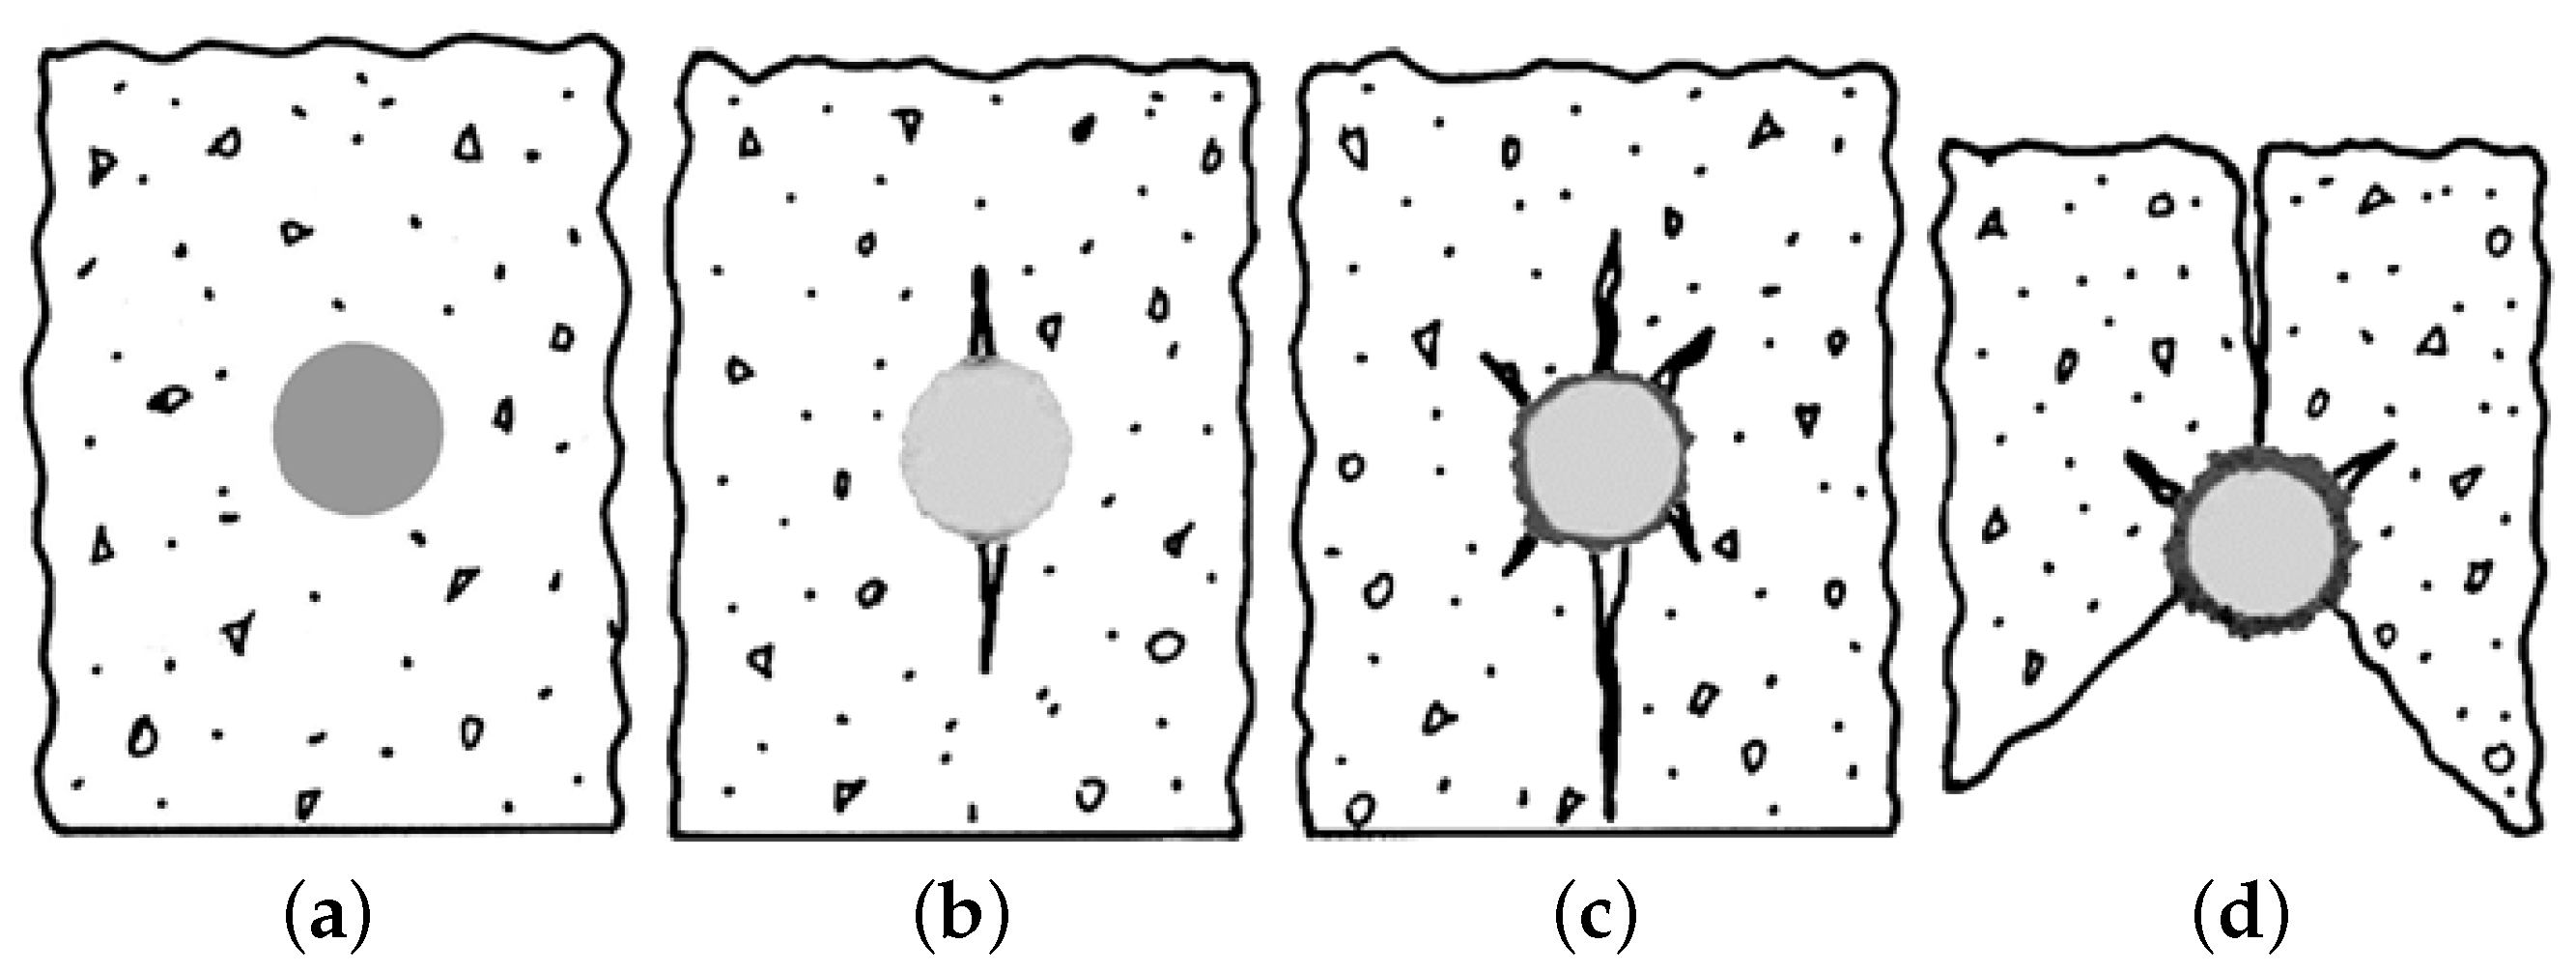
Chloride-induced corrosion of the steel reinforcement may appear in two forms, i.e., uniform and pitting. Uniform corrosion occurs over the whole surface of the steel; pitting corrosion is local and occurs only along limited areas, i.e., the so-called “pits”, which are surrounded by the non-corroded areas [1]. In this study, uniform corrosion is assumed and its effects at the cross-section level are further explained in Figure 6, with respect to the phases in Figure 5. Uniform corrosion is an idealized scenario that may be assumed for simplicity in analyses or calculations. However, engineers must recognize its limitations and consider potential variations in corrosion effects when evaluating the performance of a structure over its service life. Starting from the uncorroded phase (Figure 6a), the corrosion builds up, leading to concrete cracking and spalling (Figure 6c,d). More specifically, after the corrosion initiation period, corrosion products appear on the steel surface, corresponding to the line between points 1 and 2 in Figure 5 and Figure 6b. This process results in the reduction of the nominal diameter of the reinforcement steel while the volume of the rebar increases. This phenomenon usually leads to cracking and spalling of the concrete cover (see Figure 6c,d, and points 2 and 3 in Figure 5). Both cracking and spalling reduce the strength of the cover concrete and the bond strength of the two materials. Based on the above, in order to simulate the impact of chloride-induced corrosion, we focus on the following: (i) the reduction in the reinforcing steel’s cross-section along with the reduction in ductility; and (ii) the reduction in the compressive strength of the concrete cover.
3. Seismic Fragility Assessment of Structures
Fragility curves are useful tools for assessing the seismic capacity of RC buildings. The fragility of a system is the probability that an engineering demand parameter, , exceeds a threshold value, ; it is defined as follows:
Engineering demand parameters, , are quantities that characterize the system response, and denotes the intensity measure of interest. The usually considered for the performance assessment of RC buildings include member plastic hinge rotations or the story maximum inter-story drift ratio (); both parameters are directly related to the limit state demand. Suitable for building structures include peak ground acceleration , or, more preferably, spectral acceleration at the fundamental period . For the present study, the and adopted are the maximum inter-story drift and the first-mode spectral acceleration .
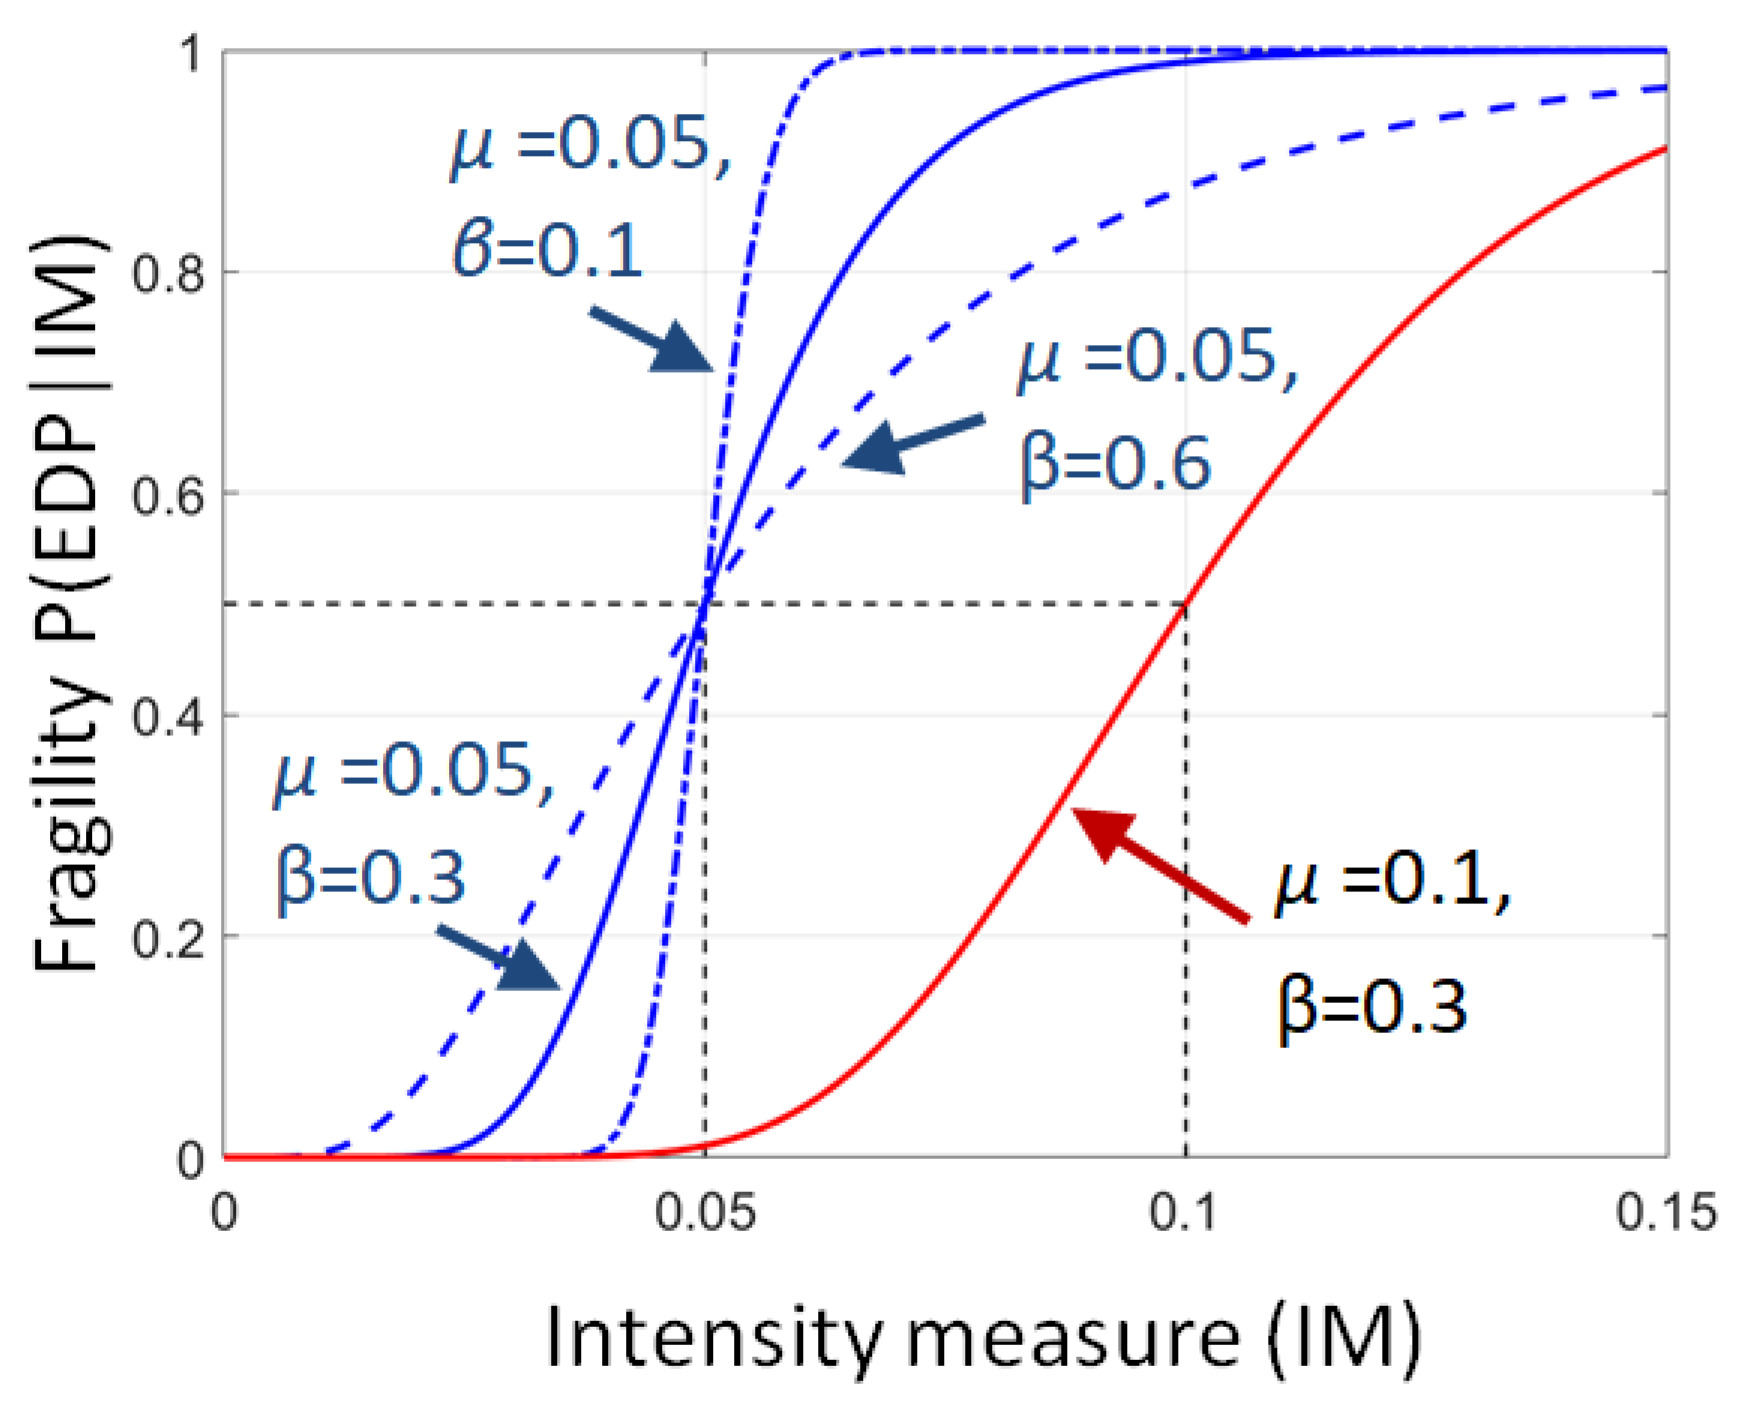
If the values are known for certain levels, and assuming that the data follow the lognormal distribution, the probability of a limit state threshold, , being surpassed is given by the following expression:
where is the standard cumulative distribution function, is the logarithmic standard deviation of the logarithms of the EDP, and is the mean value of the logarithms of the EDP. Figure 7 compares the fragility curves, considering either the same mean value or the same standard deviation. Thus, the two solid lines have different mean values but the same standard deviation, while blue lines have the same mean value and different standard deviations.
3.1. Fragility Analysis Methods
3.1.1. Multiple-Stripe Analysis
The limit state fragility curves of a system can be calculated using different approaches. The incremental dynamic analysis (IDA) method is a common tool. IDA involves subjecting the system to a suite of ground motion records, each scaled to multiple levels of intensity. After incrementally scaling every ground motion, single-record capacity curves are produced in terms of demand versus seismic intensity. IDA has conceptual similarities to the multiple-stripe analysis (MSA) method [13], where instead of scaling up every ground motion, the records are scaled to the same IM level. Since—for every scaling level—the ground motions have the same IM value, the EDP values form a “stripe”, which allows us to directly calculate the median (50% percentile) and the 16% and 84% percentile capacity curves conditional on the IM. Strictly speaking, in IDA, the scaling factors will be different, but stripped data can be easily obtained with interpolation.
3.1.2. Cloud Analysis
If the data are not stripped, then they will form a “cloud”, and the “cloud analysis” method has to be adopted instead. Cloud analysis is a common method when the data are scattered in the EDP-IM plane. This occurs when the ground motions are left unscaled, or when they have all been scaled with the same factor. A linear fit provides the mean of the logarithms () and a single constant value for the dispersion . The knowledge of and facilitates the fragility calculation. More details can be found in the work by Fragiadakis and Diamantopoulos [14].
3.1.3. Maximum Likelihood (MLE) Fitting
A maximum likelihood (MLE) fitting can be also adopted, either when the data are striped or form a cloud in the plane. The MLE fitting approach fits the CDF (cumulative distribution function) of a lognormal distribution on the EDP-IM data; thus, the fragility function is simply a lognormal CDF of the following form:
where and are the median and dispersion that have to be determined by maximizing the likelihood function.
At discrete IM levels (stripes), the multiple-stripe analysis provides the number of successes , i.e., the number of simulations in which the limit state has been exceeded after total simulations. Using the binomial distribution on the data of a single stripe, the probability of having exactly successes after simulations will be as follows:
If there are k stripes, substituting Equation (3) into Equation (4), we obtain the MLE function as follows:
The only unknowns are parameters and , which are the values that maximize the likelihood function of Equation (5), or preferably, its natural logarithm. This can be easily achieved with a spreadsheet or a simple computer script. Note that the fit is performed on all the data. If the EDP-IM pairs form a cloud, each simulation is assumed as a stripe. Therefore, k is the number of simulations, is equal to one (), and is equal to one or zero, depending on whether the simulation exceeds the limit state threshold or not. The fragility curves presented in the following sections were obtained by using the above modeling approach.
3.1.4. SPO2IDA Tool
Another approach for the fragility calculation is based on the SPO2IDA (static pushover to incremental dynamic analysis) tool. This tool can be easily extracted from the work of Fragiadakis and Vamvatsikos [15], who proposed a method for estimating the median incremental dynamic analysis (IDA) capacity curve and its fractiles from the backbone of the static pushover. Once the fractile IDAs are known, calculating the fragility curves becomes straightforward; hence, this methodology enables their rapid estimation. The following lines describe the steps of the approach.
Initially, the pushover (backbone) curve of the building is obtained. The pushover curve is then trilinearized using optimum fitting, as discussed in reference [15], in order to define the theoretical “yielding” and “ultimate” displacement. The trilinear force-displacement () capacity curve is then converted to the curve of the equivalent single-degree-of-freedom (ESDOF) oscillator using the N2 method. The force, , and the displacement, , of the ESDOF are related to the structure’s base shear and roof displacement with the aid of the first mode modal participation factor, .
Once the period and the curve of the equivalent SDOF system are obtained, the median and the 16th and 84th percentile fractile IDA curves are approximately calculated using the SPO2IDA tool, as discussed in reference [15]. These IDA fractiles of the SPO2IDA tool are provided in normalized coordinates. The strength reduction factor, R, is defined as the ratio , where denotes the values of the first spectral acceleration causing the first yield. The ductility, , is the maximum displacement of ESDOF, normalized by the yield displacement.
Assuming appropriate limit state thresholds and the as the engineering demand parameter, the fragility curves are calculated from the IDA curves. More specifically, from the fractile IDA curves, for every IM level, one can calculate the mean, , and a standard deviation, , in a straightforward manner, as follows:
where is the x% fractile of the structural intensity causing exceedance of one limit state. This approach does not provide a lognormal CDF as the fragility curve. However, a CDF can be easily fitted with MLE fitting. This allows the characterization of the fragility curves with the aid of mean and standard deviations (Figure 7).
4. Past Research on the Fragility Assessment of Corroded RC Structures
For the capacity assessment of reinforced concrete (RC) structures, it is necessary to consistently consider the impact of corrosion, even in the absence of robust assessment methodologies. Numerous studies have aimed to investigate the impact of corrosion on the seismic capacity and fragility of RC buildings, recognizing that aging can significantly reduce structural capacity under a strong earthquake. For instance, Karapetrou et al. [16] investigated the effects of chloride-induced corrosion on the seismic vulnerability of three RC buildings in a marine environment. Similarly, Geng et al. [17] examined the effects of carbonation-induced corrosion on the seismic fragility of RC buildings in an inland atmosphere. In the work by Dizaj et al. [18], the spatial variability of pitting corrosion and the record-to-record variability on the seismic vulnerability of RC frames were investigated. Moreover, Dizaj et al. [19] described the effects of chloride-induced corrosion in terms of mass loss percentage when the studied frame structure was subjected to mainshock–aftershock sequences. Guidelines for modeling the effects of reinforcement corrosion on the mechanical properties of steel and concrete were provided by Dizaj et al. [20]. Finally, Yu et al. [21] summarized the corrosion damage models available for RC structures and investigated their impact on the seismic fragility assessment of RC buildings.
In a more applied context, Yalciner et al. [22] investigated a 50-year-old high school building that had undergone extensive corrosion. The corrosion level was defined, based on specimens extracted from the building, and seismic fragility curves were provided. Furthermore, Karapetrou et al. [23] examined the impact of corrosion on the performance of an existing hospital building by integrating field monitoring data with finite element models. Couto et al. [24] modeled three RC buildings with masonry infills, representing the existing building stock in Portugal. They estimated the impact of reinforcement corrosion for various exposure scenarios. Evangelisti et al. [25] conducted experimental measurements in an old Italian building from the 1960s, which had experienced aging and weathering effects. In a more general process, Tomás et al. [26] proposed new values of behavior modifiers for the seismic vulnerability evaluation of RC buildings, using data from a real earthquake.
The impact of corrosion on buildings designed according to old design codes, with limited or no seismic provisions, has been a notable subject in the literature. For instance, Di Sarno and Pugliese [27] delved into the influence of various seismic intensity measures (IMs) on the seismic capacity of three corroded reinforced concrete (RC) buildings. Furthermore, the same authors [28] explored mainshock–aftershock ground motion sequences and exposure to different levels of corrosion to estimate the seismic fragility of existing RC buildings. In reference [29], the authors discussed the impact of near-field and far-field records on corroded RC frames. All the above studies conclude that reinforcement corrosion is a major parameter that influences the degradation of RC structures and significantly affects their seismic capacity.
In several publications from the above section, the impact of aging was investigated by comparing fragility curves between corroded and uncorroded building models. Quantitative comparisons reveal that the impact of aging may range from negligible to significant, depending on the parameters, such as the cover depth, the corrosion rate, and the limit states, among others. When assuming mean value fragility curves, there are instances where the probability of exceedance remains practically unaffected, as seen in the work of Geng et al. [17]. On the other hand, studies indicate that the increase in fragility, measured by the mean fragility values, , can be in the order of 60–65%, as shown in work by Dizaj and Kashani [20]. These substantial differences found in the literature contribute to the complexity of understanding the impact of aging on the structural response, especially in the presence of seismic actions.
In summary, Table 1 shows the influence of aging on the fragility curves of building structures, as obtained from some of the aforementioned studies. The table shows the percentage of the mean value increase of the fragility curve, assuming that the dispersion is practically not affected. In other words, Table 1 gives the quantity of that measures the increase:
It should be noted that Table 1 shows the variation of the fragility curve’s mean value. Due to the fact that different research publications consider different limit states, we summarize three limit states, LS1, LS2, and LS3 (qualitatively); the percentage of increase is calculated following Equation (8).
Table 2 shows the same comparison for structures that were investigated, considering a practically similar corrosion reinforcement level, CL (%). The corrosion level, CL (%), in terms of area loss, is expressed as follows [28]:
where is the uncorroded steel bar area, and is the net cross-sectional area of the corroded rebar. The table provides insight into the influence of aging on the fragility curves of different building structures. There are cases in which the influence of aging is found to be negligible (e.g., 1–2%) and others that confirm that the modification of the mean of the fragility curve can rise to 65%. This increase tends to be smaller for the upper limit states, while for the ultimate limit state (practically close to collapse), the first two papers cited do not provide information.
5. Corrosion Modelling
5.1. Initiation Time of Corrosion
Concrete service life models such as DuraCrete [30,31,32], LIFECON [33], and the fib Bulletin 34 [12] provide probabilistic models in order to estimate the initiation time of chloride and carbonation-induced corrosion on RC structures. In this study, the corrosion model adopted consists of a combination of equations that already exist in the literature. Chloride-induced corrosion is assumed to be a critical source of reinforcement corrosion, considering that a large number of RC structures are exposed to chlorides, i.e., exposure classes XS1, XS2, and XS3, according to EC-2 [34]. The initiation time, , of chloride-induced corrosion can be estimated using the probabilistic model of fib Bulletin 34 [12]:
where is the concrete cover depth (mm), is the environmental transfer variable, which is related to the temperature of the structural element or ambient air, and is a regression parameter that considers the influence of the test method. is the chloride migration coefficient (m2/s) that depends on the water–cement ratio and the cement type. n is the aging exponent related to the cement type Finally, is the critical chloride content, which leads to the depassivation of reinforcing steel (wt%/cement); it depends on the type of steel and the electrochemical environment in concrete. is the chloride content at the concrete surface.
Therefore, in this work, the corrosion effects on structural elements are considered through three parameters: (i) the reduction in the diameter of the reinforcement rebars, (ii) the reduction in the cover compressive strength, and (iii) the reduction in ductility through the reduction in steel elongation at maximum load.
5.2. Reduction of Rebar Diameter and Ductility
During the propagation phase of chloride-induced corrosion, the diameter and the rebar area are calculated as follows [35]:
where is the number of reinforcement rebars, is the initial diameter of the rebar, and is the corrosion rate. The corrosion rate is expressed as current density in A/cm2, where (mm/year) (A/cm2), and it is affected by the availability of oxygen and water at the steel surface; therefore, it is related to environmental factors, the concrete quality, and the cover depth. The factor 0.0116 is a conversion factor of A/cm2 into mm/year for steel material [36]. The reduction in the ductility of reinforcement steel is taken into account through the reduction in steel elongation at maximum load. The experimental results provided by Rodriquez and Andrade [37] are used to assess the reduction in the ultimate steel deformation, . This reduction varies between 30% and 50%, while the loss of the reinforcement’s cross-sectional area varies from 15% to 28%, respectively. Thus, we use linear interpolation when the reinforcement’s cross-sectional reduction is between 15% and 28%, while for values smaller than 15%, we assume that the increase is linear. In other words, if the loss is 22.5%, then the reduction is 40%; if the loss is 7.5%, the reduction is 15%.
5.3. Reduction in the Concrete Cover Compressive Strength
The reduced concrete cover’s compressive strength, , is calculated according to the model by Coronelli and Gambarova [38]:
where K is a coefficient related to the rebar diameter and roughness and is equal to 0.1 for medium-diameter ribbed rebars. is the strain at peak compressive stress, , and is the average tensile strain of the cracked concrete, which is calculated as follows [38]:
In Equation (14), is the initial section width before the corrosion initiation and is the increased section width due to rust expansion and corrosion cracking. An approximation of the increase of the section is obtained as follows [38]:
where is the number of rebars under compression and is the total crack width for a given corrosion intensity level, given as follows [38]:
6. Case Study
6.1. Four-Story RC Building under Corrosion
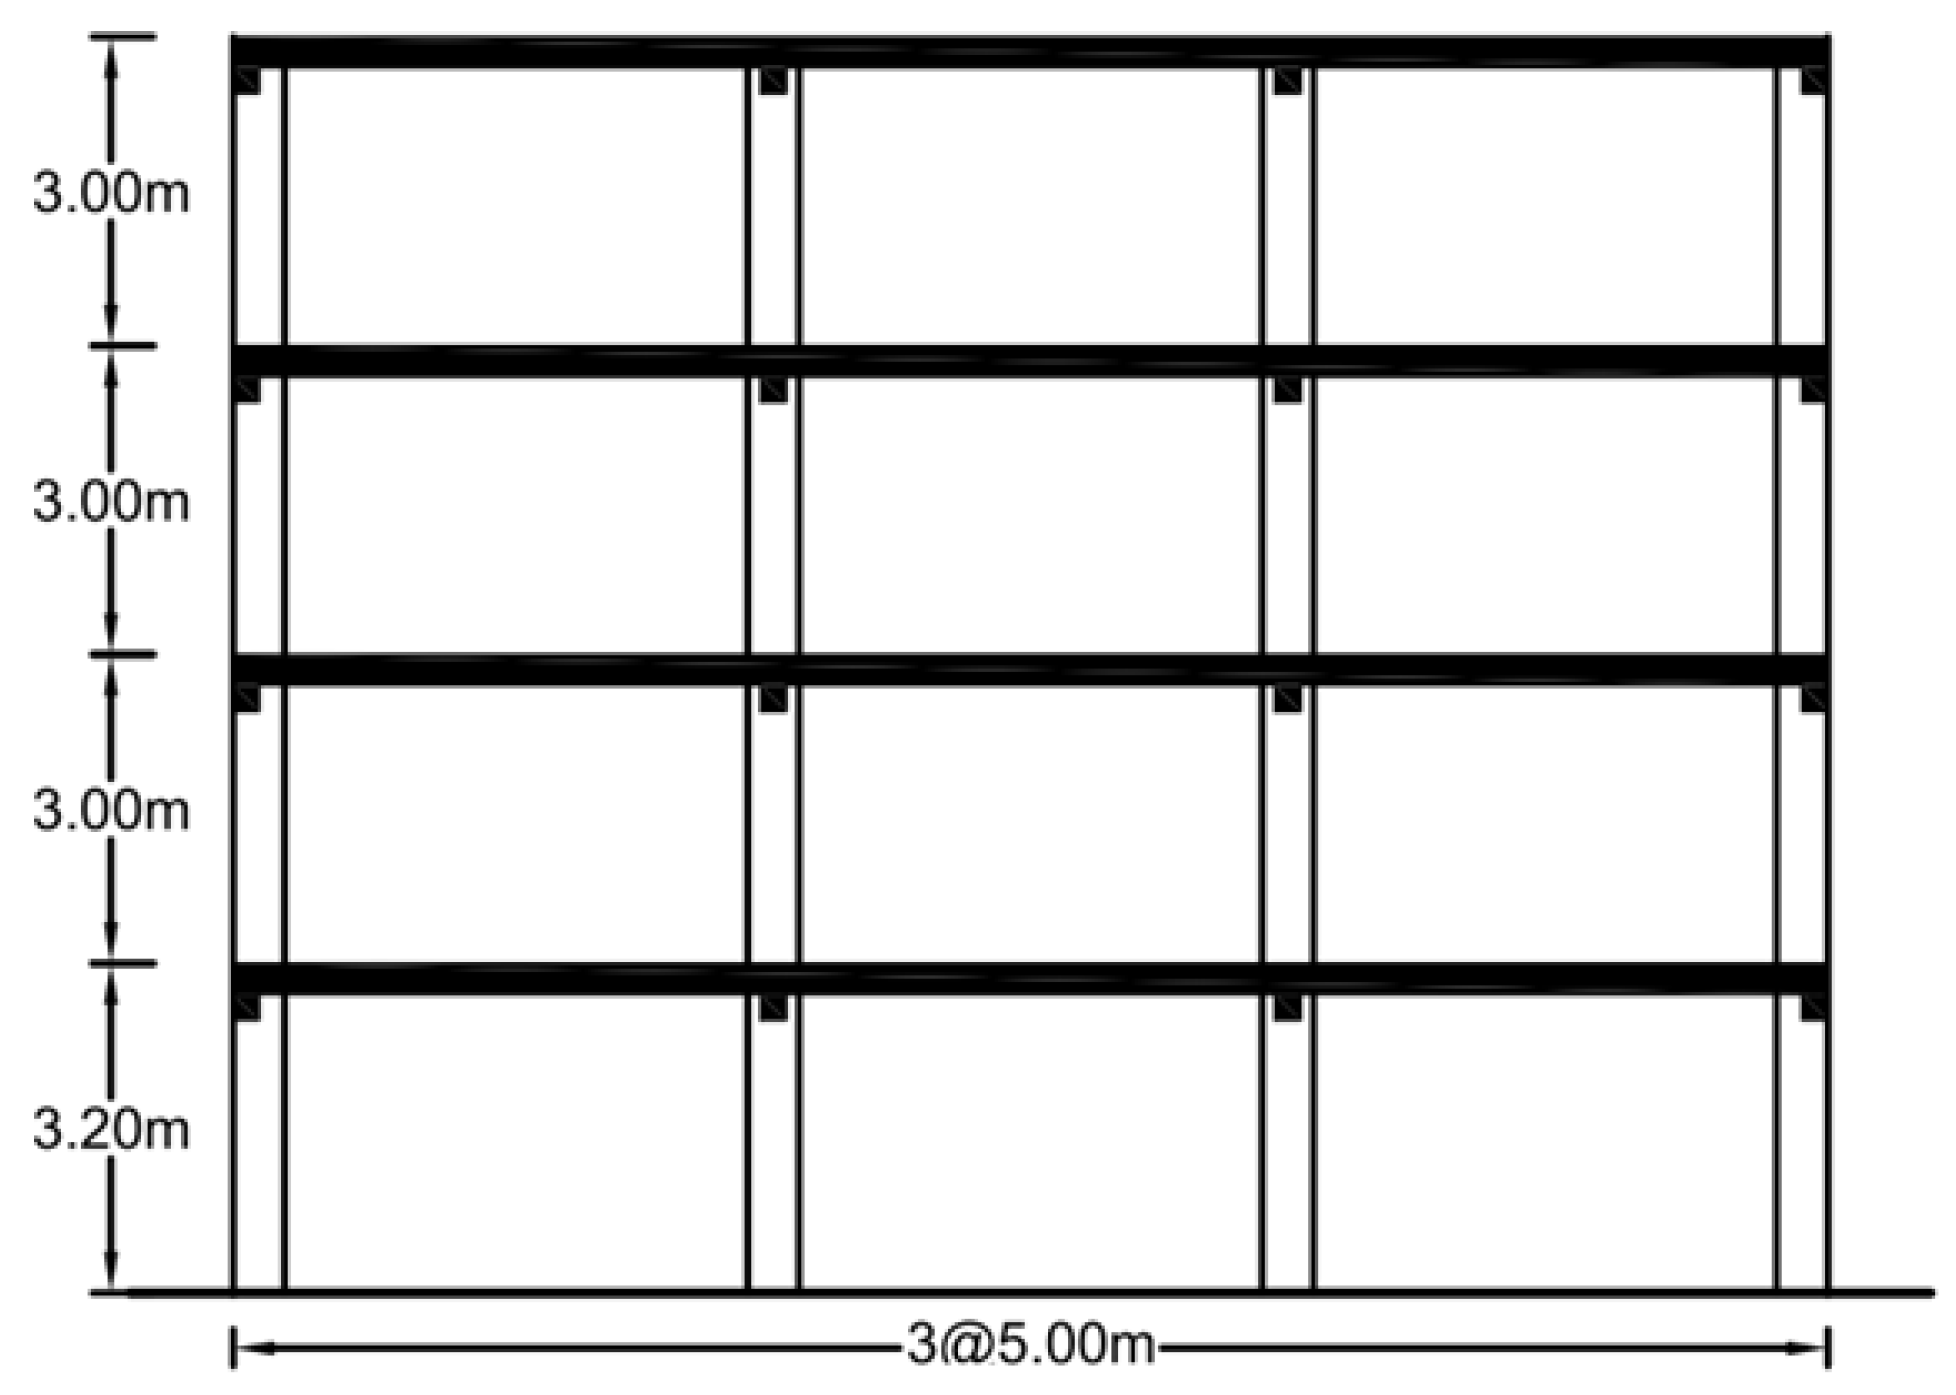
The four-story RC building shown in Figure 8 is considered as the case study. The structure is a modern building designed for Eurocode 2 and Eurocode 8, assuming ductility class high (DCH). The cross-section of the side columns of the first two stories is cm and of the internal columns is cm. On the third story, the side columns have a cross-section of cm, while the internal columns are cm. The columns of the top story have a cross-section of cm and the cross-section of the beams is cm for all stories. The column reinforced is 8∅16 mm, apart from the cm cross-section that was reinforced with 8∅20 mm. The reinforcement of the beams is 3∅12 mm and 3∅14 mm, at the span and the supports, respectively.
The building examined is located in Greece, and the national codes and annexes have been considered. It features a 2D frame structure designed with a behavior factor equal to 4, under the actions of a 475-year return period. The frame was modeled using OpenSees [40] software, assuming lumped masses at every story. The considered story mass equals 60t for every story, apart from the top, where it is assumed equal to 50t. The materials specified for the design are as follows: C20/25 for concrete and B500C for the reinforcement. A similar version of the building was discussed in work by Fragiadakis and Diamantopoulos [14], where further details are available. The building’s model was implemented in OpenSees using force-based fiber elements, employing Concrete04 and ReinforcingSteel materials for the concrete and steel fibers, respectively. Confined concrete strength is considered, while second-order () effects are explicitly taken into consideration in the numerical simulations.
Modal analysis was initially performed; the first eigenperiod of the uncorroded building was equal to s, with a high mass modal participation factor, indicating that the building is first mode-dominated. We should note that for the corroded cases, the fundamental period is always different, usually larger since the structure becomes more flexible. The latter can be seen from the pushover curves, as discussed in the next subsection. Furthermore, several works that evaluate the changes in the dynamic characteristics can be found in the literature, e.g., Ditommaso et al. [41] and Cataldo et al. [42].
The methodology described in Section 3 has been applied to both the corroded and uncorroded building models, and the corresponding seismic fragility curves were obtained.
The corrosion assumptions for the case study considered are as follows: (i) marine environment, (ii) atmospheric zone as the environment of the structure, (iii) ambient air temperature equal to 20 C, (iv) cement type CEM I used in the concrete mix, and (v) the water to cement ratio equal to 0.5, i.e., . These assumptions determine the parameters of the corrosion model adopted. More specifically, the statistical distribution, mean, and coefficient of variation () of these five parameters are presented in Table 3. The parameters considered concern the effects of environmental and structural factors on the initiation of chloride-induced corrosion. Their definitions are based on the environmental conditions assumed and the characteristics of the structure considered.
The evaluation of chloride-induced corrosion effects through fragility analysis requires defining the parameters that mostly affect the initiation of corrosion and its propagation. For this purpose, the initiation time, , should be calculated according to Equation (10). For all corroded realizations of the building, the reduced concrete cover strength and reduced reinforcement material properties should be determined by following Equations (12) and (13). This modification affects the member capacities, i.e., the beam and column moment-rotation, relationships, thus correspondingly reducing the global capacity.
The corrosion initiation time is calculated using Equation (10) for three cover depth values. Following modern design standards, the minimum cover value is 35 mm, while values 25 mm and 45 mm are also considered here for investigation purposes. The corresponding mean values of the corrosion initiation time are estimated to be equal to 7.34, 21.08, and 46.34, respectively.
6.2. Numerical Results
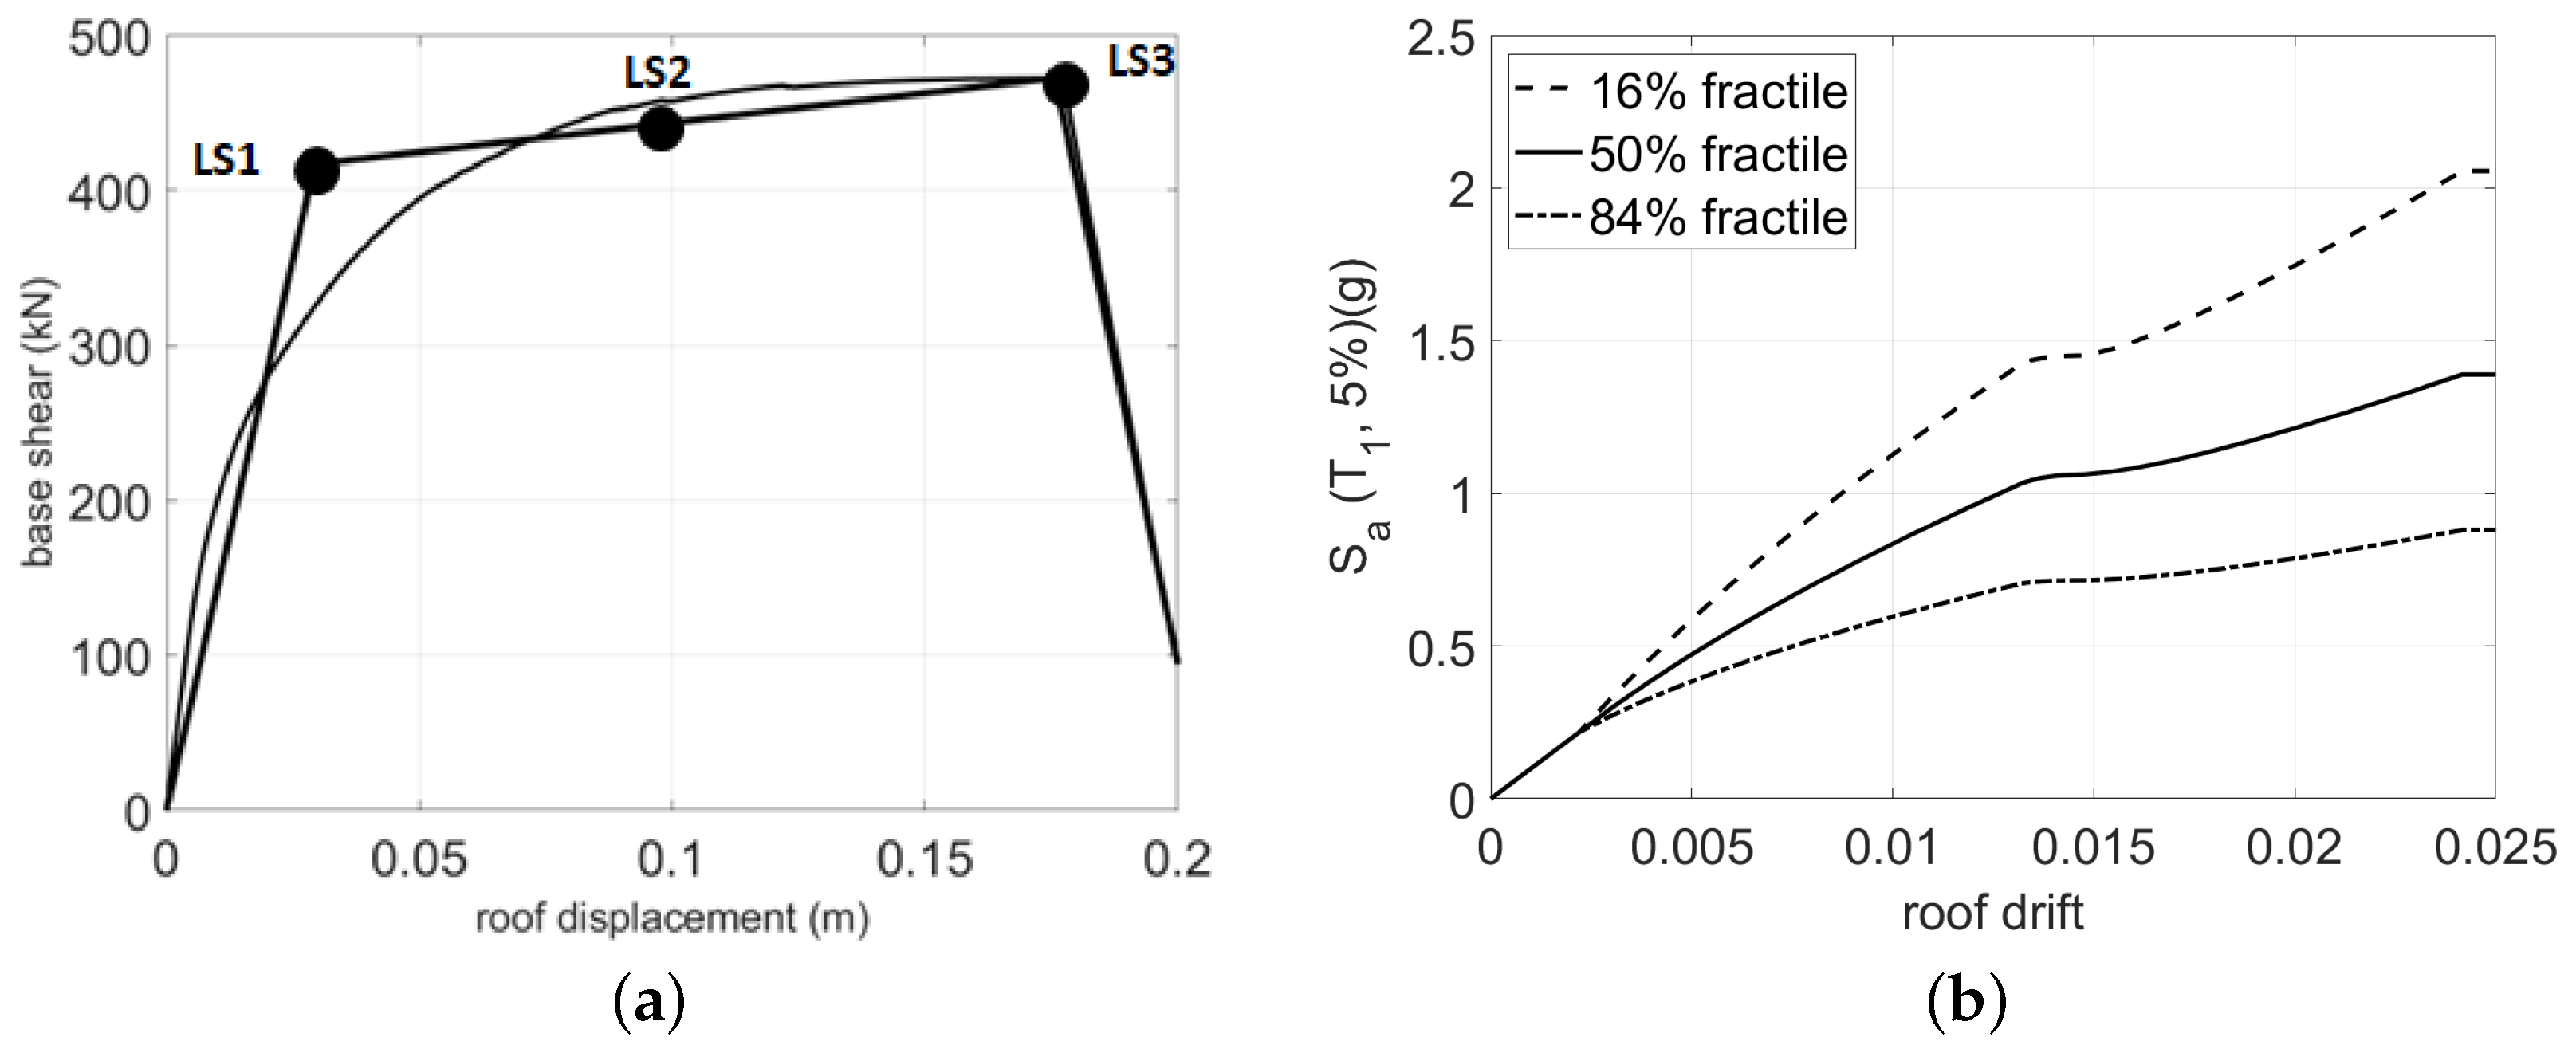
The seismic performance of the building was assessed at t = 0, 50, and 100 years after its construction in order to address the impact of corrosion on seismic fragility throughout the building’s service life. In all, 21 cases were examined, i.e., 3 uncorroded and 18 corroded building realizations. The limit states are considered and are identified based on the roof displacement of the static pushover curve. For this purpose, the pushover curve is trilinearized in order to identify the yield and the ultimate displacements, denoted as and , respectively. Figure 9a presents both pristine and ideal pushover curves. Therefore, the three limit states correspond to moderate damage (), severe damage (), and complete damage (). Figure 9b shows the IDA curve that corresponds to the pushover curve of Figure 9a, as obtained from the SPO2IDA tool [15].
Fragility analysis is more representative of the building’s capacity compared to static pushover analysis Figure 10, as it correlates demand with the corresponding limit state exceedance and, eventually, the limit state exceedance probability. Figure 10 compares the pushover curves, assuming either t = 50 years or t = 100 years and = 0.1, 2 µA/cm2. The seismic fragility curves of the case study building were obtained using the methodology presented in Section 3. We should note that possible brittle collapse mechanisms (shear failure) of the columns are not considered in the fragility assessment. In all cases, they are estimated, assuming the first-mode spectral acceleration as and the maximum roof drift as . The fragility curves shown below focus on the moderate damage (LS1) and complete damage (LS3) limit states.
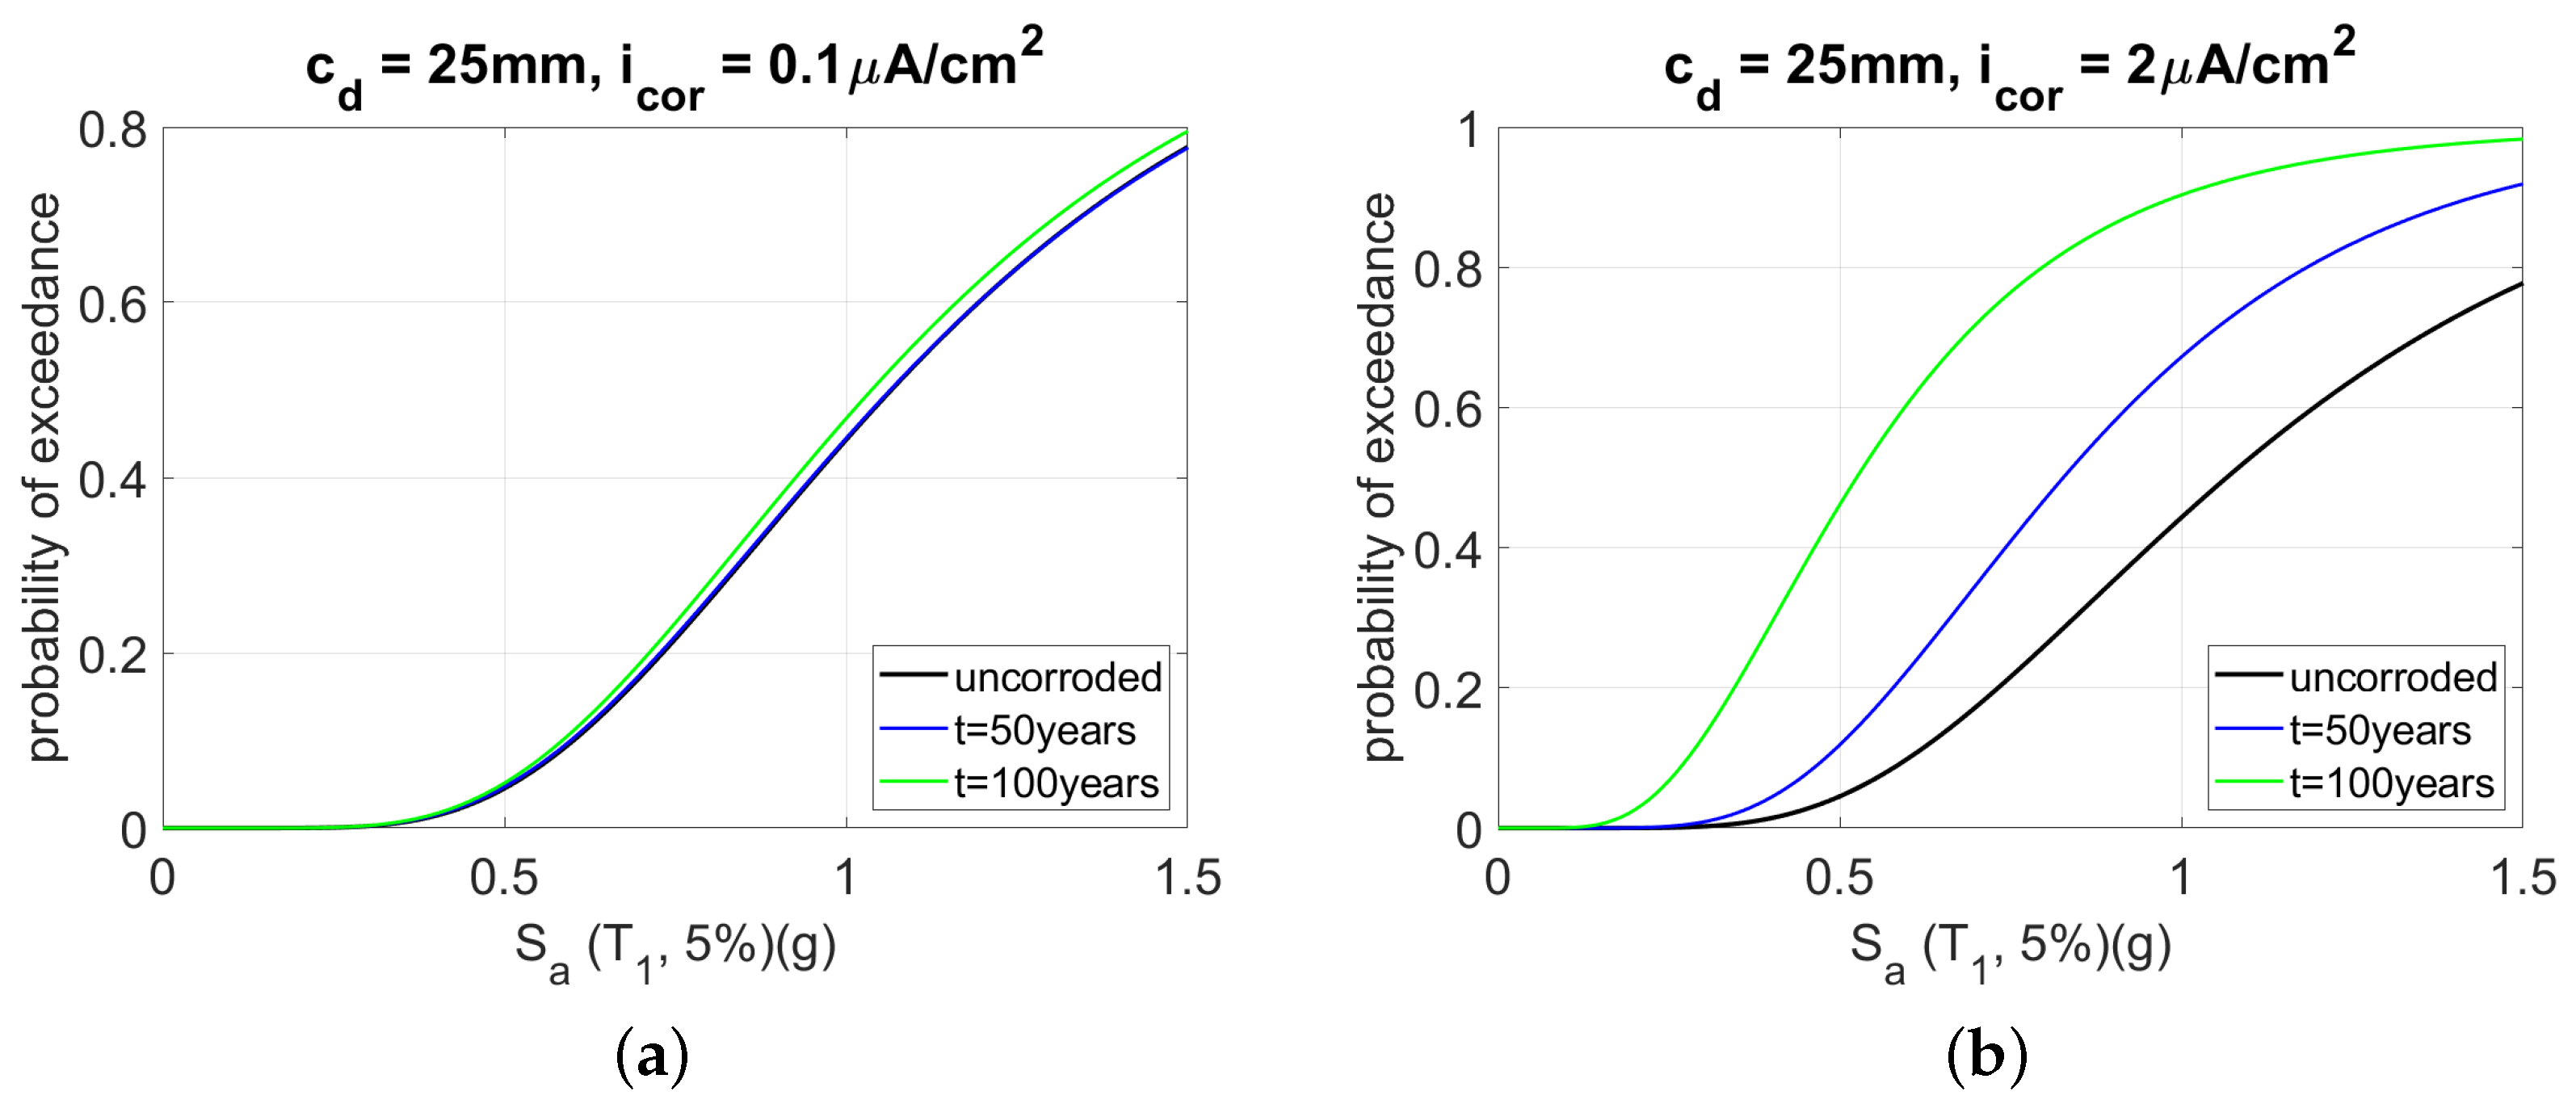
Figure 11 and Figure 12, investigate the influence of corrosion, considering different assumptions for the age of the case study structure, i.e., t = 0, 50, 100 years. Figure 11 examines the LS1 while Figure 12 considers the LS3. In both plots, very small and medium corrosion rate values, i.e., = 0.1 A/cm2 and = 2 A/cm2, are assumed. Due to the two-dimensional structure, all columns are assumed with the same corrosion rate, even if different values should be adopted for external and internal columns of a three-dimensional structure.
From Figure 11a and Figure 12a, it can be observed that small values of the corrosion rate, i.e., = 0.1 A/cm2, cannot affect the fragility curve, even if the cover depth is = 25 mm. However, = 2 A/cm2 always reduces the structural capacity, a point that becomes obvious considering Figure 11b and Figure 12b.
Furthermore, in Figure 13, the influence of cover depth is examined. LS1 and LS3 are assumed in Figure 13a and Figure 13b, respectively. It is highlighted that a cover depth equal to 45 mm improves seismic fragility, especially in the case of larger building service life, i.e., t = 100 years for both limit states considered. For the first limit state, the difference between the fragility curves that correspond to cover depths equal to 35 and 45 mm is not as substantial as in the case of the complete damage limit state.
In all cases examined, the results demonstrate the discrepancy between the fragility curves of the corroded and uncorroded buildings, as well as the range of the mean values of the fragility curves, assuming that the standard deviation of the curves remains, practically, constant. It can be observed that the dispersion of the mean values of the fragility curves decreases as the cover depth increases. This observation verifies the impact of the cover depth on the seismic performance of RC buildings.
In order to compare the current work with the literature, Table 4 is introduced. Table 4 presents the percentage decrease (Equation (8)) of the mean value of the fragility curves between the corroded and pristine buildings. It includes both 50 and 100 years for comparison purposes. It can be observed that this increase is larger for LS3, while in all cover depths, this increase is almost similar for LS2 and LS3. The fragility modification is always more critical for lower values of the cover depth, considering all limit states and both t = 50 and 100 years. For example, the mean value of the fragility curve, considering LS1, is modified approximately for = 25 mm in t = 100 years, while the same modification is equal to when = 45 mm. Comparing Table 4 with Table 1, it can be observed that the fragility curve of a new building that follows contemporary design codes and has a minimum cover depth equal to 35 mm has not changed by more than during its service life. This percentage can be equal to in the case of t = 100 years. In fact, the current work demonstrates the modifications, showing that when the cover depth increases, the fragility curve modification is not as significant as in the case of lower values of the cover depth. The worst case is always the larger value for the corrosion rate, i.e., = 2 A/cm2, and the minimum value for the cover depth, i.e., = 25 mm.
7. Conclusions
Quantifying the impact of aging on RC structures is a complex task characterized by considerable variability. Quantifying the impact of corrosion on the dynamic characteristics of numerical models is not proposed in the current work. However, it should be noted that for corroded cases, the fundamental period is always larger than the pristine structure. In this study, the impact of aging on fragility assessment is investigated through a seismic fragility analysis of a case study structure. It was found that the most significant parameter that affects corrosion initiation is the cover depth. Moreover, the corrosion rate, , affects the area of the rebar during the propagation phase of chloride-induced corrosion; thus, both parameters are investigated in detail. In order to systematically assess the influence of both structural and environmental factors on fragility assessment, the outcomes of this study are compared with findings from the literature. It should be noted that, despite the inherent complexity of the problem at hand, this paper can be considered an attempt to quantify the impact of aging at a probabilistic level.
Author Contributions
Conceptualization, S.D., Z.A., S.S., O.M. and M.F.; methodology, S.D., Z.A., S.S. and O.M., software, S.D. and Z.A.; validation, S.D., Z.A., S.S., O.M. and M.F.; formal analysis S.D. and Z.A.; investigation, S.D. and Z.A.; resources, S.S. and O.M.; data curation, M.F.; writing—original draft preparation, S.D. and M.F.; writing—review and editing, S.D.; visualization, S.S., O.M. and M.F.; supervision, M.F.; project administration, S.S. and O.M.; funding acquisition, S.S. and O.M. All authors have read and agreed to the published version of the manuscript.
Funding
This research was co-financed by Greece and the European Union through the program “Competitiveness Entrepreneurship Innovation 2014–2020” in the framework of action “Competence Center” within the program “Competence Center for a Sustainable and Resilient Built Environment using smart technologies” (MIS 5130744).
Data Availability Statement
The data presented in this study are available on request from the corresponding author.
Conflicts of Interest
The authors declare no conflict of interest.
References
- Bertolini, L.; Elsener, B.; Pedeferri, P.; Polder, R.B. Corrosion of Steel in Concrete; John Wiley & Sons, Ltd.: Hoboken, NJ, USA, 2003. [Google Scholar]
- Khan, M.; Deng, X.; Wang, Y. Service life prediction model for chloride-induced corrosion of concrete-steel tubular columns. J. Build. Eng. 2023, 74, 106761. [Google Scholar] [CrossRef]
- Qian, R.; Li, Q.; Fu, C.; Zhang, Y.; Wang, Y.; Jin, N.; Jin, X. Investigations on atmospheric carbonation corrosion of concrete structure beam exposed to real marine-environment for 7 years. J. Build. Eng. 2023, 71, 106517. [Google Scholar] [CrossRef]
- Zucca, M.; Crespi, P.; Stochino, F.; Puppio, M.L.; Coni, M. Maintenance interventions period of existing RC motorway viaducts located in moderate/high seismicity zones. Structures 2023, 47, 976–990. [Google Scholar] [CrossRef]
- Crespi, P.; Zucca, M.; Valente, M.; Longarini, N. Influence of corrosion effects on the seismic capacity of existing RC bridges. Eng. Fail. Anal. 2022, 140, 106546. [Google Scholar] [CrossRef]
- Böhni, H. Corrosion in Reinforced Concrete Structures; Woodhead Publishing Ltd.: Sawston, UK; CRC Press LLC: Boca Raton, FL, USA, 2005. [Google Scholar]
- Zhou, Y.; Gencturk, B.; Willam, K.; Attar, A. Carbonation-induced and chloride-induced corrosion in reinforced concrete structures. J. Mater. Civ. Eng. 2015, 27, 04014245. [Google Scholar] [CrossRef]
- Yin, D.; Jin, H.; Gu, X.; Yu, S.; Wang, Z. Influence of rubber geometrical characteristics on the corrosion behavior of rebar in rubberized concrete. J. Build. Eng. 2023, 77, 107535. [Google Scholar] [CrossRef]
- CP Technologies. Identifying and Treating Corrosion in Reinforced Concrete Structures. 2017. Available online: https://cp-tech.co.uk/identifying-and-treating-corrosion-in-reinforced-concrete-structures/ (accessed on 29 November 2022).
- Tuutti, K. Corrosion of Steel in Concrete; Swedish Cement and Concrete Research Institute: Stockholm, Sweden, 1982. [Google Scholar]
- Zheng, Y.; Zheng, S.-S.; Yang, L.; Dong, L.-G.; Ruan, S. Experimental study and numerical model of the seismic behavior of reinforced concrete beams in an artificial corrosion environment. J. Build. Eng. 2022, 46, 103705. [Google Scholar] [CrossRef]
- Schießl, P.; Bamforth, P.; Baroghel-Bouny, V.; Corley, G.; Faber, M.; Gehlen, C.; Helland, S.; Ishida, T.; Helene, P.; Markeset, G.; et al. Fib Bulletin 34: Model Code for Service Life Design; The International Federation for Structural Concrete: Lausanne, Switzerland, 2006. [Google Scholar]
- Jalayer, F. Direct Probabilistic Seismic Analysis: Implementing Non-Linear Dynamic Assessments. Ph.D. Thesis, Department of Civil and Environmental Engineering, Stanford University, Stanford, CA, USA, 2003. [Google Scholar]
- Fragiadakis, M.; Diamantopoulos, S. Fragility and risk assessment of freestanding building contents. Earthq. Eng. Struct. Dyn. 2020, 49, 1028–1048. [Google Scholar] [CrossRef]
- Fragiadakis, M.; Vamvatsikos, D. Fast performance uncertainty estimation via pushover and approximate IDA. Earthq. Eng. Struct. Dyn. 2010, 39, 683–703. [Google Scholar] [CrossRef]
- Karapetrou, S.; Fotopoulou, S.; Pitilakis, K. Seismic vulnerability of RC buildings under the effect of ageing. Procedia Environ. Sci. 2017, 38, 461–468. [Google Scholar] [CrossRef]
- Geng, F.; Wen, Z.; Xu, C.; Chau, K. Time-dependent seismic fragility for ageing RC frame structures in the inland atmosphere environment. J. Earthq. Eng. 2023, 27, 1440–1457. [Google Scholar] [CrossRef]
- Dizaj, E.A.; Madandoust, R.; Kashani, M.M. Probabilistic seismic vulnerability analysis of corroded reinforced concrete frames including spatial variability of pitting corrosion. Soil Dyn. Earthq. Eng. 2018, 114, 97–112. [Google Scholar] [CrossRef]
- Dizaj, E.A.; Salami, M.R.; Kashani, M.M. Seismic vulnerability assessment of ageing reinforced concrete structures under real mainshock-aftershock ground motions. Struct. Infrastruct. Eng. 2022, 18, 1674–1690. [Google Scholar] [CrossRef]
- Dizaj, E.A.; Kashani, M.M. Nonlinear structural performance and seismic fragility of corroded reinforced concrete structures: Modelling guidelines. Eur. J. Environ. Civ. Eng. 2022, 26, 5374–5403. [Google Scholar] [CrossRef]
- Yu, X.-H.; Dai, K.-Y.; Li, Y.-S. Variability in corrosion damage models and its effect on seismic collapse fragility of ageing reinforced concrete frames. Constr. Build. Mater. 2021, 295, 123654. [Google Scholar] [CrossRef]
- Yalciner, H.; Sensoy, S.; Eren, O. Seismic performance assessment of a corroded 50-year-old reinforced concrete building. J. Struct. Eng. 2015, 141, 05015001. [Google Scholar] [CrossRef]
- Karapetrou, S.; Manakou, M.; Bindi, D.; Petrovic, B.; Pitilakis, K. “Time-building specific” seismic vulnerability assessment of a hospital RC building using field monitoring data. Eng. Struct. 2016, 112, 114–132. [Google Scholar] [CrossRef]
- Couto, R.; Requena-García-Cruz, M.V.; Bento, R.; Morales-Esteban, A. Seismic capacity and vulnerability assessment considering ageing effects: Case study—Three local Portuguese RC buildings. Bull. Earthq. Eng. 2021, 19, 6591–6614. [Google Scholar] [CrossRef]
- Evangelisti, L.; Guattari, C.; Fontana, L.; De Lieto Vollaro, R.; Asdrubali, F. On the ageing and weathering effects in assembled modular facades: On-site experimental measurements in an Italian building of the 1960s. J. Build. Eng. 2022, 45, 103519. [Google Scholar] [CrossRef]
- Tomás, A.; Ródenas, J.L.; García-Ayllón, S. Proposal for new values of behaviour modifiers for seismic vulnerability evaluation of reinforced concrete buildings applied to Lorca (Spain) using damage data from the 2011 earthquake. Bull. Earthq. Eng. 2017, 15, 3943–3962. [Google Scholar] [CrossRef]
- Di Sarno, L.; Pugliese, F. Seismic fragility of existing RC buildings with corroded bars under earthquake sequences. Soil Dyn. Earthq. Eng. 2020, 134, 106169. [Google Scholar] [CrossRef]
- Di Sarno, L.; Pugliese, F. Effects of mainshock-aftershock sequences on fragility analysis of RC buildings with ageing. Eng. Struct. 2021, 232, 111837. [Google Scholar] [CrossRef]
- Pugliese, F.; Di Sarno, L. Probabilistic structural performance of RC frames with corroded smooth bars subjected to near- and far-field ground motions. J. Build. Eng. 2022, 49, 104008. [Google Scholar] [CrossRef]
- Lindvall, A. DuraCrete, Models for Environmental Actions on Concrete Structures: DuraCrete, Probabilistic Performance Based Durability Design of Concrete Structures; CUR: Gouda, The Netherlands, 1999. [Google Scholar]
- Edvardsen, C.; Engelund, S.; Mohr, L. DuraCrete, General Guidelines for Durability Design and Redesign: DuraCrete—Probabilistic Performance Based Durability Design of Concrete Structures (Contract BRPR-CT95-0132, Project BE95-1347); CUR: Gouda, The Netherlands, 2000. [Google Scholar]
- Visser, J. DuraCrete, Statistical Quantification of the Variables in the Limit State Functions: DuraCrete, Probabilistic Performance Based Durability Design of Concrete Structures; CUR: Gouda, The Netherlands, 2000. [Google Scholar]
- Sascha, L.; Schießl, P.; Cairns, J. Life Cycle Management of Concrete Infrastructures for Improved Sustainability, Technical Report No. D 3.2. Probabilistic Service Life Models for Reinforced Concrete Structures; Transportation Research Board: Washington, DC, USA, 2003. [Google Scholar]
- EN 1992-1-1; Eurocode 2: Design of Concrete Structures-Part 1-1: General Rules and Rules for Buildings. CEN: Brussels, Belgium, 2005.
- Ghosh, J.; Padgett, J.E. ageing considerations in the development of time-dependent seismic fragility curves. J. Struct. Eng. 2010, 136, 1497–1511. [Google Scholar] [CrossRef]
- Berto, L.; Vitaliani, R.; Saetta, A.; Simioni, P. Seismic assessment of existing RC structures affected by degradation phenomena. Struct. Saf. 2009, 31, 284–297. [Google Scholar] [CrossRef]
- Jesús, R.; Andrade, C. CONTECVET: A Validated Users Manual for Assessing the Residual Service Life of Concrete Structures; eC Innovation project IN30902I; Division of Building Materials, LTH, Lund University: Lund, Sweden, 2001; Volume 7161. [Google Scholar]
- Coronelli, D.; Gambarova, P. Structural assessment of corroded reinforced concrete beams: Modeling guidelines. J. Struct. Eng. 2004, 130, 1214–1224. [Google Scholar] [CrossRef]
- Simioni, P. Seismic Response of Reinforced Concrete Structures Affected by Reinforcement Corrosion. Ph.D. Thesis, Faculty of Engineering, University of Florence, Florence, Italy, 2009. [Google Scholar]
- McKenna, F.; Fenves, G.L.; Scott, M.H. Opensees (Open System for Earthquake Engineering Simulation); University of California: Berkeley, CA, USA, 2000. [Google Scholar]
- Ditommaso, R.; Iacovino, C.; Auletta, G.; Parolai, S.; Ponzo, F.C. Damage Detection and Localization on Real Structures Subjected to Strong Motion Earthquakes Using the Curvature Evolution Method: The Navelli (Italy) Case Study. Appl. Sci. 2021, 11, 6496. [Google Scholar] [CrossRef]
- Cataldo, A.; Roselli, I.; Fioriti, V.; Saitta, F.; Colucci, A.; Tatì, A.; Ponzo, F.C.; Ditommaso, R.; Mennuti, C.; Marzani, A. Advanced Video-Based Processing for Low-Cost Damage Assessment of Buildings under Seismic Loading in Shaking Table Tests. Sensors 2023, 23, 5303. [Google Scholar] [CrossRef]
Figure 1.
Old building at McAbee Beach, USA, where the effects of aging are evident.

Figure 2.
Deterioration of RC sections due to (a) chloride-induced and (b) carbonation-induced corrosion of reinforcement.
Figure 2.
Deterioration of RC sections due to (a) chloride-induced and (b) carbonation-induced corrosion of reinforcement.

Figure 3.
Example of concrete carbonation and corroded steel reinforcement.

Figure 4.
(a) Result of the action of chlorides on an RC beam and (b) reduction in the effective cross-section of the rebars due to corrosion.
Figure 4.
(a) Result of the action of chlorides on an RC beam and (b) reduction in the effective cross-section of the rebars due to corrosion.

Figure 5.
Deterioration process of reinforcement corrosion [12].
Figure 5.
Deterioration process of reinforcement corrosion [12].

Figure 6.
The effects of reinforcement corrosion on RC cross-section: (a) uncorroded reinforcement, (b) build-up of corrosion products, (c) cracking, and (d) spalling.
Figure 6.
The effects of reinforcement corrosion on RC cross-section: (a) uncorroded reinforcement, (b) build-up of corrosion products, (c) cracking, and (d) spalling.

Figure 7.
Definition of fragility curve parameters and .

Figure 8.
The four-story case study building.

Figure 9.
(a) Pushover curve of the pristine building and (b) the corresponding IDA curves.

Figure 10.
Effect of on pushover curves, assuming = 25 mm and (a) t = 50 years, and (b) t = 100 years.
Figure 10.
Effect of on pushover curves, assuming = 25 mm and (a) t = 50 years, and (b) t = 100 years.

Figure 11.
Moderate damage (LS1) fragility curves when comparing the different t-values examined when the corrosion rate is equal to (a) = 0.1 µA/cm2 and (b) = 2 µA/cm2.
Figure 11.
Moderate damage (LS1) fragility curves when comparing the different t-values examined when the corrosion rate is equal to (a) = 0.1 µA/cm2 and (b) = 2 µA/cm2.

Figure 12.
Complete damage (LS3) fragility curves when comparing the different t-values examined when the corrosion rate is equal to (a) = 0.1 µA/cm2 and (b) = 2 µA/cm2.
Figure 12.
Complete damage (LS3) fragility curves when comparing the different t-values examined when the corrosion rate is equal to (a) = 0.1 µA/cm2 and (b) = 2 µA/cm2.

Figure 13.
Fragility curves for constant = 2 µA/cm2 and = 25, 35, 45 mm for (a) LS1 and (b) LS3.


Table 1.
Influence of aging on the mean of the fragility curves () of different RC structures in terms of percentage modification at 40 to 60 years after construction.
Table 1.
Influence of aging on the mean of the fragility curves () of different RC structures in terms of percentage modification at 40 to 60 years after construction.
| Paper | t | LS1 | LS2 | LS3 | |||
|---|---|---|---|---|---|---|---|
| Years | Min | Max | Min | Max | Min | Max | |
| Karapetrou et al. [16] | 50 | - | - | 0.17 | 0.24 | - | - |
| Dizaj et al. [20] | 40 | 0.15 | 0.17 | 0.49 | 0.52 | 0.44 | 0.49 |
| Yalciner et al. [22] | 50 | 0.25 | 0.25 | 0.15 | 0.15 | 0.41 | 0.41 |
| Couto et al. [24] | 40–60 | 0.11 | 0.17 | - | - | - | - |
| Karapetrou et al. [23] | 45 | 0.013 | 0.15 | 0.18 | 0.36 | - | - |
| Pugliese and DiSarno [29] | 50 | 0.25 | 0.63 | 0.28 | 0.61 | 0.28 | 0.55 |
Table 2.
The influence of aging on the fragility curves in terms of percentage modification, considering the evaluation for %.
Table 2.
The influence of aging on the fragility curves in terms of percentage modification, considering the evaluation for %.
| Paper | CL | LS1 | LS2 | LS3 | |||
|---|---|---|---|---|---|---|---|
| % | Min | Max | Min | Max | Min | Max | |
| Dizaj et al. [18] | 10 | - | - | 0.525 | 0.526 | - | - |
| DiSarno & Pugliese [27] | 10 | 0.44 | 0.448 | 0.4 | 0.412 | - | - |
| DiSarno & Pugliese [28] | 10 | 0.368 | 0.411 | 0.22 | 0.278 | 0 | 0 |
Table 3.
Statistical properties of the parameters that affect chloride-induced corrosion.
| Parameter | Mean | COV | Distribution |
|---|---|---|---|
| 0.676 | 0.17 | Gamma | |
| 1.25 | 0.28 | Normal | |
| (m2/s) | 1.58 × 10⁻¹¹ | 0.2 | Normal |
| (years) | 0.0767 | - | Deterministic |
| n | 0.362 | 0.677 | Beta |
| (wt% cement) | 0.6 | 0.25 | Beta |
| (wt% cement) | 1.2825 | 0.35 | Normal |
Table 4.
The influence of aging on the fragility curves in terms of percentage modification, considering the evaluation for 50 and 100 years after the construction of the case study building.
Table 4.
The influence of aging on the fragility curves in terms of percentage modification, considering the evaluation for 50 and 100 years after the construction of the case study building.
| t | LS1 | LS2 | LS3 | ||||
|---|---|---|---|---|---|---|---|
| Years | mm | Min | Max | Min | Max | Min | Max |
| 50 | 25 | 0.00 | 0.21 | 0.00 | 0.22 | 0.00 | 0.22 |
| 35 | 0.00 | 0.09 | 0.00 | 0.03 | 0.00 | 0.04 | |
| 45 | 0.00 | 0.04 | 0.00 | 0.05 | 0.00 | 0.06 | |
| 100 | 25 | 0.00 | 0.40 | 0.00 | 0.49 | 0.00 | 0.51 |
| 35 | 0.00 | 0.31 | 0.00 | 0.35 | 0.00 | 0.37 | |
| 45 | 0.00 | 0.18 | 0.00 | 0.19 | 0.00 | 0.19 | |
Disclaimer/Publisher’s Note: The statements, opinions and data contained in all publications are solely those of the individual author(s) and contributor(s) and not of MDPI and/or the editor(s). MDPI and/or the editor(s) disclaim responsibility for any injury to people or property resulting from any ideas, methods, instructions or products referred to in the content. |
© 2024 by the authors. Licensee MDPI, Basel, Switzerland. This article is an open access article distributed under the terms and conditions of the Creative Commons Attribution (CC BY) license (https://creativecommons.org/licenses/by/4.0/).
Share and Cite
MDPI and ACS Style
Diamantopoulos, S.; Achmet, Z.; Stefanidou, S.; Markogiannaki, O.; Fragiadakis, M. Seismic Fragility Curves of RC Buildings Subjected to Aging. GeoHazards 2024, 5, 192-208. https://doi.org/10.3390/geohazards5010010
AMA Style
Diamantopoulos S, Achmet Z, Stefanidou S, Markogiannaki O, Fragiadakis M. Seismic Fragility Curves of RC Buildings Subjected to Aging. GeoHazards. 2024; 5(1):192-208. https://doi.org/10.3390/geohazards5010010
Chicago/Turabian StyleDiamantopoulos, Spyridon, Zeinep Achmet, Sotiria Stefanidou, Olga Markogiannaki, and Michalis Fragiadakis. 2024. "Seismic Fragility Curves of RC Buildings Subjected to Aging" GeoHazards 5, no. 1: 192-208. https://doi.org/10.3390/geohazards5010010