
Evaluating Cluster-Based Synthetic Data Generation for Blood-Transfusion Analysis
by
 , , and
Shannon K. S. Kroes
1,2,3,4,* ,
,
Matthijs van Leeuwen
2,
Rolf H. H. Groenwold
3,5 and
Mart P. Janssen
4 1
Netherlands Organisation for Applied Scientific Research (TNO), Anna van Buerenplein 1, 2595 DA The Hague, The Netherlands
2
Leiden Institute of Advanced Computer Science, Leiden University, 2333 CA Leiden, The Netherlands
3
Department of Clinical Epidemiology, Leiden University Medical Center, 2333 ZA Leiden, The Netherlands
4
Transfusion Technology Assessment Group, Donor Medicine Research Department, Sanquin Research, 1066 CX Amsterdam, The Netherlands
5
Department of Biomedical Data Sciences, Leiden University Medical Center, 2333 ZA Leiden, The Netherlands
*
Author to whom correspondence should be addressed.
J. Cybersecur. Priv. 2023, 3(4), 882-894; https://doi.org/10.3390/jcp3040040
Submission received: 17 September 2023
/
Revised: 2 November 2023
/
Accepted: 19 November 2023
/
Published: 1 December 2023
(This article belongs to the Special Issue Data Protection and Privacy)
Abstract
:Synthetic data generation is becoming an increasingly popular approach to making privacy-sensitive data available for analysis. Recently, cluster-based synthetic data generation (CBSDG) has been proposed, which uses explainable and tractable techniques for privacy preservation. Although the algorithm demonstrated promising performance on simulated data, CBSDG has not yet been applied to real, personal data. In this work, a published blood-transfusion analysis is replicated with synthetic data to assess whether CBSDG can reproduce more complex and intricate variable relations than previously evaluated. Data from the Dutch national blood bank, consisting of 250,729 donation records, were used to predict donor hemoglobin (Hb) levels by means of support vector machines (SVMs). Precision scores were equal to the original data results for both male (0.997) and female (0.987) donors, recall was 0.007 higher for male and 0.003 lower for female donors (original estimates 0.739 and 0.637, respectively). The impact of the variables on Hb predictions was similar, as quantified and visualized with Shapley additive explanation values. Opportunities for attribute disclosure were decreased for all but two variables; only the binary variables Deferral Status and Sex could still be inferred. Such inference was also possible for donors who were not used as input for the generator and may result from correlations in the data as opposed to overfitting in the synthetic-data-generation process. The high predictive performance obtained with the synthetic data shows potential of CBSDG for practical implementation.
1. Introduction
Health care research often is a collaborative, or even international effort. This may require exchange of data, so that an analyst can combine or compare data from different sources. When these data contain personal and sensitive information, privacy regulations and concerns may restrict data sharing, which can limit research opportunities. An increasingly popular privacy-enhancing solution is to share a synthetic version of the original data [1]. By analyzing artificial data instead of the original health care records, the privacy of the included individuals can be protected [2]. Synthetic data can be generated for a variety of purposes, such as machine learning, software testing, education, and data retention (see [3,4] for an overview of use cases).
Typically, synthetic data generation involves creating a model of the data, which describes the associations and patterns that should be reproduced with artificial individuals. These individuals are generated by sampling records from the model. Multiple approaches have been proposed; frequently used methods include Conditional Tabular Generative Adversarial Networks (CTGAN) [5], Synthpop [6], and PrivBayes [7] (see [8] for an overview).
Most synthetic data approaches have been evaluated using publicly available, real data (such as data from the UCI Machine Learning repository [9]) and several have been applied to use cases as well [10]. For example, [11] demonstrate the data quality (utility) of synthetic COVID-19 data generated with sequential trees. Although some of these applications show that analyses can be reproduced, it remains challenging to gain insight into privacy risks [3]. Assessing the magnitude of these risks is critical because synthetic data methods can leak sensitive information with the generated data [12].
Differential privacy [13] is a frequently used approach in addressing this topic, which has been implemented in combination with synthetic data generators (e.g., [14,15]). The differential privacy framework can be used to bound the impact that one individual has on the outcome distribution of the model (i.e., synthetic data) by introducing noise. As a result, strong privacy guarantees can be made, which is one of the reasons that the approach has gained considerable popularity [16]. It remains up for debate, however, how much noise is sufficient to preserve privacy [17]. Although setting an appropriate threshold is a common challenge for privacy frameworks, this is a particular complication for differential privacy, because the parameters are known to be difficult to interpret [18]. In addition, several articles (e.g., [19,20]) show that differentialy private noise can result in detrimental effects on synthetic data quality or may not succeed in avoiding privacy inference attacks.
Methods without differential privacy do not impose explicit privacy-preserving techniques onto the model; synthetic data are expected to preserve more privacy because they do not consist of real people. Empirical privacy metrics can be used to quantify any remaining risks, such as attribute inference and membership inference [19,21,22]. These types of privacy measures do not directly assess whether the model has memorized specific, personal information, but make an approximation by considering the generated data. As a result, the outcome is subject to randomness in the synthetic data and there is a risk of misestimating privacy leakage.
Recently, Cluster-Based Synthetic Data Generation (CBSDG) has been introduced, which sets itself apart from other available approaches by (1) incorporating interpretable privacy-preserving techniques into the model and (2) generating a tractable model with which privacy risks can be measured [23]. CBSDG creates clusters of similar individuals, typically containing 25 individuals, and removes all the relations between the variables within these clusters. Similar to anonymisation techniques such as k-anonymity [24] or l-diversity [25], this causes individuals to become indistinguishable from one another within a group of peers. At the same time, relations between variables can be preserved with the number, size and location of clusters, e.g., a cluster with females taller than 2 m will typically be smaller than a cluster with males over 2 m.
CBSDG has been subject to extensive experiments with simulated data, which demonstrated that the algorithm can generate high quality, privacy-preserving data [23]. In this controlled setting, several aspects of the data could be varied (types of data and sample size), but complex data features found in real data were not investigated. Contrary to other synthetic data generators, CBSDG has not been tested on real data, and further analysis is required to assess its practical potential.
Considering that CBSDG is unique in generating synthetic data with tractable privacy preservation, it is meaningful to research whether the performance on simulated data is comparable for real data. This current work investigates this by replicating a published blood-transfusion analysis by Vinkenoog et al. (2022) [26]. The data used reflect a wider variety of challenges, such as heavily skewed binary variables and multimodal continuous distributions. Furthermore, we take a deeper look into the quality of synthetic data than in [23], by assessing the preservation of intricate relations between variables. The objective of this study is to evaluate the practical potential of CBSDG by assessing whether a prediction model trained with synthetic data has the same predictive power as the model trained with real, personal donor data, and to what extent privacy is preserved.
2. Materials and Methods
To evaluate the CBSDG on real, personal data, an analysis of blood-transfusion data published by Vinkenoog et al. (2022) [26] was replicated with synthetic data. We describe the blood-transfusion analysis, research question and data used in the first subsection. In the second subsection, we describe how the data were synthesized. The third subsection outlines the measures used to quantify how the original results by Vinkenoog et al. [26] differ from the replication with synthetic data as a measure of utility. In the final subsection the used privacy measure are described.
2.1. Original Analysis by Vinkenoog et al. (2022): Predicting Deferral of Blood Donors
The Dutch blood bank tests donor hemoglobin (Hb) before each donation, so that donors with low Hb levels can be deferred. This protects donor health and ensures quality of the provided transfusions. Because on-site donor deferral forms a demotivating experience for the donor as well as an unnecessary waste of resources, Vinkenoog et al. [26] trained machine learning models (specifically support vector machines, SVMs, see below) to predict whether donors will be deferred. Using these predictions, donors with a high probability of having a low Hb can be deferred on paper and requested to return at a later time; when their Hb is expected to be sufficiently high.
Vinkenoog et al. [26] performed the analysis with 250,729 donation records from the Dutch blood bank. The donation records contained the variables Sex, Age (years), Time of day of the donation (hours), Month of donation, Last ferritin level (a protein that indicates iron storage, measured in ng/mL), Time since last ferritin measurement (days), Previous Hb level (mmol/L), Time since previous Hb measurement (days). Additionally, the donation records contained the binary variable Deferral Status, i.e., whether a donors’ Hb was sufficiently high for donation or not. The Dutch blood bank defines a sufficiently high Hb as above 7.8 mmol/L for females and 8.4 mmol/L for males.
Predictions were made with two SVMs; one for male donors and one for female donors. Donations from 2017 up to 2020 served as the training data. The SVMs predict Deferral Status, based on the predictors Time, Age, Month, Last ferritin, Time since last ferritin measurement, Previous Hb level, and Time since previous Hb measurement. Their analysis code is available online (https://zenodo.org/record/6938113#.Y67At3bMJsY, accessed on 19 January 2022). A separate test data set was used to assess whether donor Hb levels for donations in 2021 could be correctly predicted. This data set contained the same variables for 183,867 donations. Predictive performance was quantified by computing precision and recall scores. Precision is the proportion of deferred donors among donors predicted to be deferred, while recall is the proportion of donors correctly predicted to be deferred among donors who were in fact deferred. The SVMs achieved precision scores of 0.997 and 0.987 and recall scores of 0.739 and 0.637 for males and females, respectively.
2.2. Cluster-Based Synthetic Data Generation
The CBSDG algorithm previously described by Kroes et al. (2023) [23] was used to generate synthetic versions of the donor data. By constructing a two-layered MSPN, clusters of similar individuals are created, while assuming that the variables are independent within clusters [23]. That is, the probability distribution within a cluster is modeled with separate histograms; one for each variable. As a result, the information regarding which values from different variables originally belonged to the same record is removed in the model. This impedes opportunities to extract sensitive information by using background information (i.e., known values on other variables). At the same time, the relations between variables can be modeled by the fact that value combinations that are more likely will occur in more or in larger clusters.
Synthetic data are generated by sampling from the MSPN. Sampling a synthetic record can be seen as a two-step process: (1) sampling one of the clusters (where the probability of sampling a cluster is proportional to its size), and (2) sampling a value for each variable by sampling from each histogram for the sampled cluster.
We created synthetic records based on the training data (i.e., records corresponding to donations between 2017 and 2020) using the MSPN_privacy source code by Kroes et al. (2023) [23] in Python 3.8, which includes an altered version of the spflow package by Molina et al. (2019) [27,28]. With the function anonymize_data, a two-layered MSPN was constructed with 4000 clusters. We chose this number to achieve a sizable number of donors per cluster (62 on average). We generated 50 synthetic data sets by sampling records from the MSPN. One synthetic data set was generated in 6 min on a machine with 1.5 TB RAM and 16 Intel Xeon E5-2630v3 processor with CPUs @2.40 GHz. All code is available on https://github.com/ShannonKroes/CBSDG_application (accessed on 11 November 2023).
2.3. Utility Evaluation
The process for utility evaluation is visualized in Figure 1. A synthetic version of the training data (2017 up to 2020) is generated with CBSDG. Using the synthetic data set, the analyses that Vinkenoog et al. [26] performed on the real training data (i.e., the original data) are performed with the same hyperparameter choices (as used in the original analyses). Hb deferral predictions are made for donations from 2021 using SVMs based on the original data and based on the synthetic data. Utility is evaluated by comparing these predictions. The donations from 2021 were not used to train the SVMs, nor to construct the MSPN. The process is repeated 50 times (leading to 50 MSPNs, 50 synthetic data sets and 50 corresponding sets of SVMs). The objective is to asses the extent to which predictions made by SVMs are expected to differ when using synthetic instead of real, personal donor data.
For both sets of predictions, predictive performance is quantified by computing precision and recall scores. Particularly the latter is important, because less than 2.5% of donors is deferred for low Hb. Because the analyses are performed 50 times (once for each synthetic data set), the distributions of precision and recall demonstrate the stability of predictive performance over different synthetic data sets.
To convey in greater detail to what extent the variable relations were represented by the synthetic data, we also evaluate how the separate predictors impacted the modeled probability of deferral. Vinkenoog et al. (2022) [26] used SHAP values (SHapley Additive exPlanations [29]) for 100 donation records from 2021, to quantify and visualize the impact of every predictor, using the Python package shap. This analysis is repeated for the SVMs for all synthetic data sets. These SHAP values indicate for each of these 100 donors, how much the predictors impacted their probability of Hb deferral, on a scale of −1 to 1. Specifically, the SHAP value pertaining to a particular predictor and donation record approximates how the probability of deferral would differ if the value on this predictor would have been missing, averaged over all possible scenarios in which the value could be missing [29].
2.4. Privacy Evaluation
We compute attribute disclosure risk, using the measures presented in Kroes et al. (2021) and Kroes et al. (2023) [22,23]. We assume a scenario where an attacker has background information on eight out of nine variables. In the scenario, the attacker is interested in the nineth variable, referred to as the sensitive variable. Every variable is iteratively considered to be sensitive. The extent to which the attacker can accurately infer the true value on the sensitive variable, using both their background information and the synthetic data set, is used as a measure of privacy. The attacker is assumed to target (and have information on) one specific donor; the donor of interest.
The attacker identifies all individuals who match the background information. These individuals are referred to as peers. For example, to evaluate privacy for the variable Time, it is assumed that the attacker will search for donors with the same month of donation, age, sex, last ferritin and Hb levels, time of these measurements, and deferral status as the donor of interest. Among these peers, the attacker will assess which sensitive values occur, i.e., the distribution of Time among peers. If this distribution only contains one value, or a very narrow set of values, the attacker is able to draw precise conclusions about the sensitive value of the donor of interest and privacy could be breached.
For unordered variables (Sex and current Hb), we compute the Proportion of Alternatives Considered (PoAC) [22]. This assesses whether (synthetic) peers all have the same sensitive information (in which case the PoAC would equal 1) or whether both values are probable (in which case the PoAC equals 0). The PoAC is either 0 or 1 because both unordered variables are binary; a value of 1 indicates that both sexes or both Hb deferral statuses are probable.
For ordered variables (all seven remaining variables) we use the Expected Deviation (ED) to quantify how far off the distribution of sensitive values among peers is from the true sensitive value of the donor of interest. Similar to the PoAC, a value of 0 indicates that all probable values equal the true sensitive value and privacy can be breached. An important note is that the ED is on the scale of the variable under evaluation. For example, if the average ED (among all donors) equals 5 for age, it means that when an attacker attempts to extract the age of a donor, on average, the inferred age will differ by 5 years from the true age of the donor. For more details on these measures, please refer to Kroes et al. (2023) [23].
The measures can be applied to both original and synthetic data. In the original data, it is straightforward to identify peers of the donor of interest; every donor will have at least one peer (themselves). In the synthetic data, it is not unlikely that the specific combination of background information of the donor of interest will not occur in the data set. This does not mean that it is impossible to generate this combination of values, however. Furthermore, if the combination of values does occur, it is of interest to know whether this is due to chance or due to overfitting by the model [12].
Because the MSPN is a tractable model, the privacy measures can be computed for the model, instead of for a single synthetic data set. For the PoAC we can directly compute the probability of sensitive values, given the background information, using the log_likelihood function from the Python package spflow [28]. To compute the ED, synthetic peers can be generated with conditional sampling, so that the distribution of the sensitive variable among them can be approximated.
We selected the first donation of 8000 donors. For every donor, we compute the PoAC and ED values (depending on whether the variable under consideration was ordered or unordered). If a value is 0, privacy can be breached, whereas values above zero are considered to indicate protection against privacy breaches. The analyses were performed for one MSPN chosen at random.
3. Results
3.1. Utility Results
The distributions of the individual variables for the original and synthetic data are presented in Figure 2 for one synthetic data set, chosen at random. For other synthetic data sets, similar results were obtained (available upon request). A kernel density estimator is used for continuous variables with the pandas.series.plot.density function from the python package pandas with the default settings [30]. From Figure 2, it can be found that the marginal distributions are almost identical, as the lines for the density estimates overlap and the bars are of similar height. This is also the case for non-normal and multimodal variables, such as the time variables. Additionally, the SVMs built with the synthetic data yielded deferral predictions that overlapped for 96% with the deferral predictions that were obtained using the original SVMs.
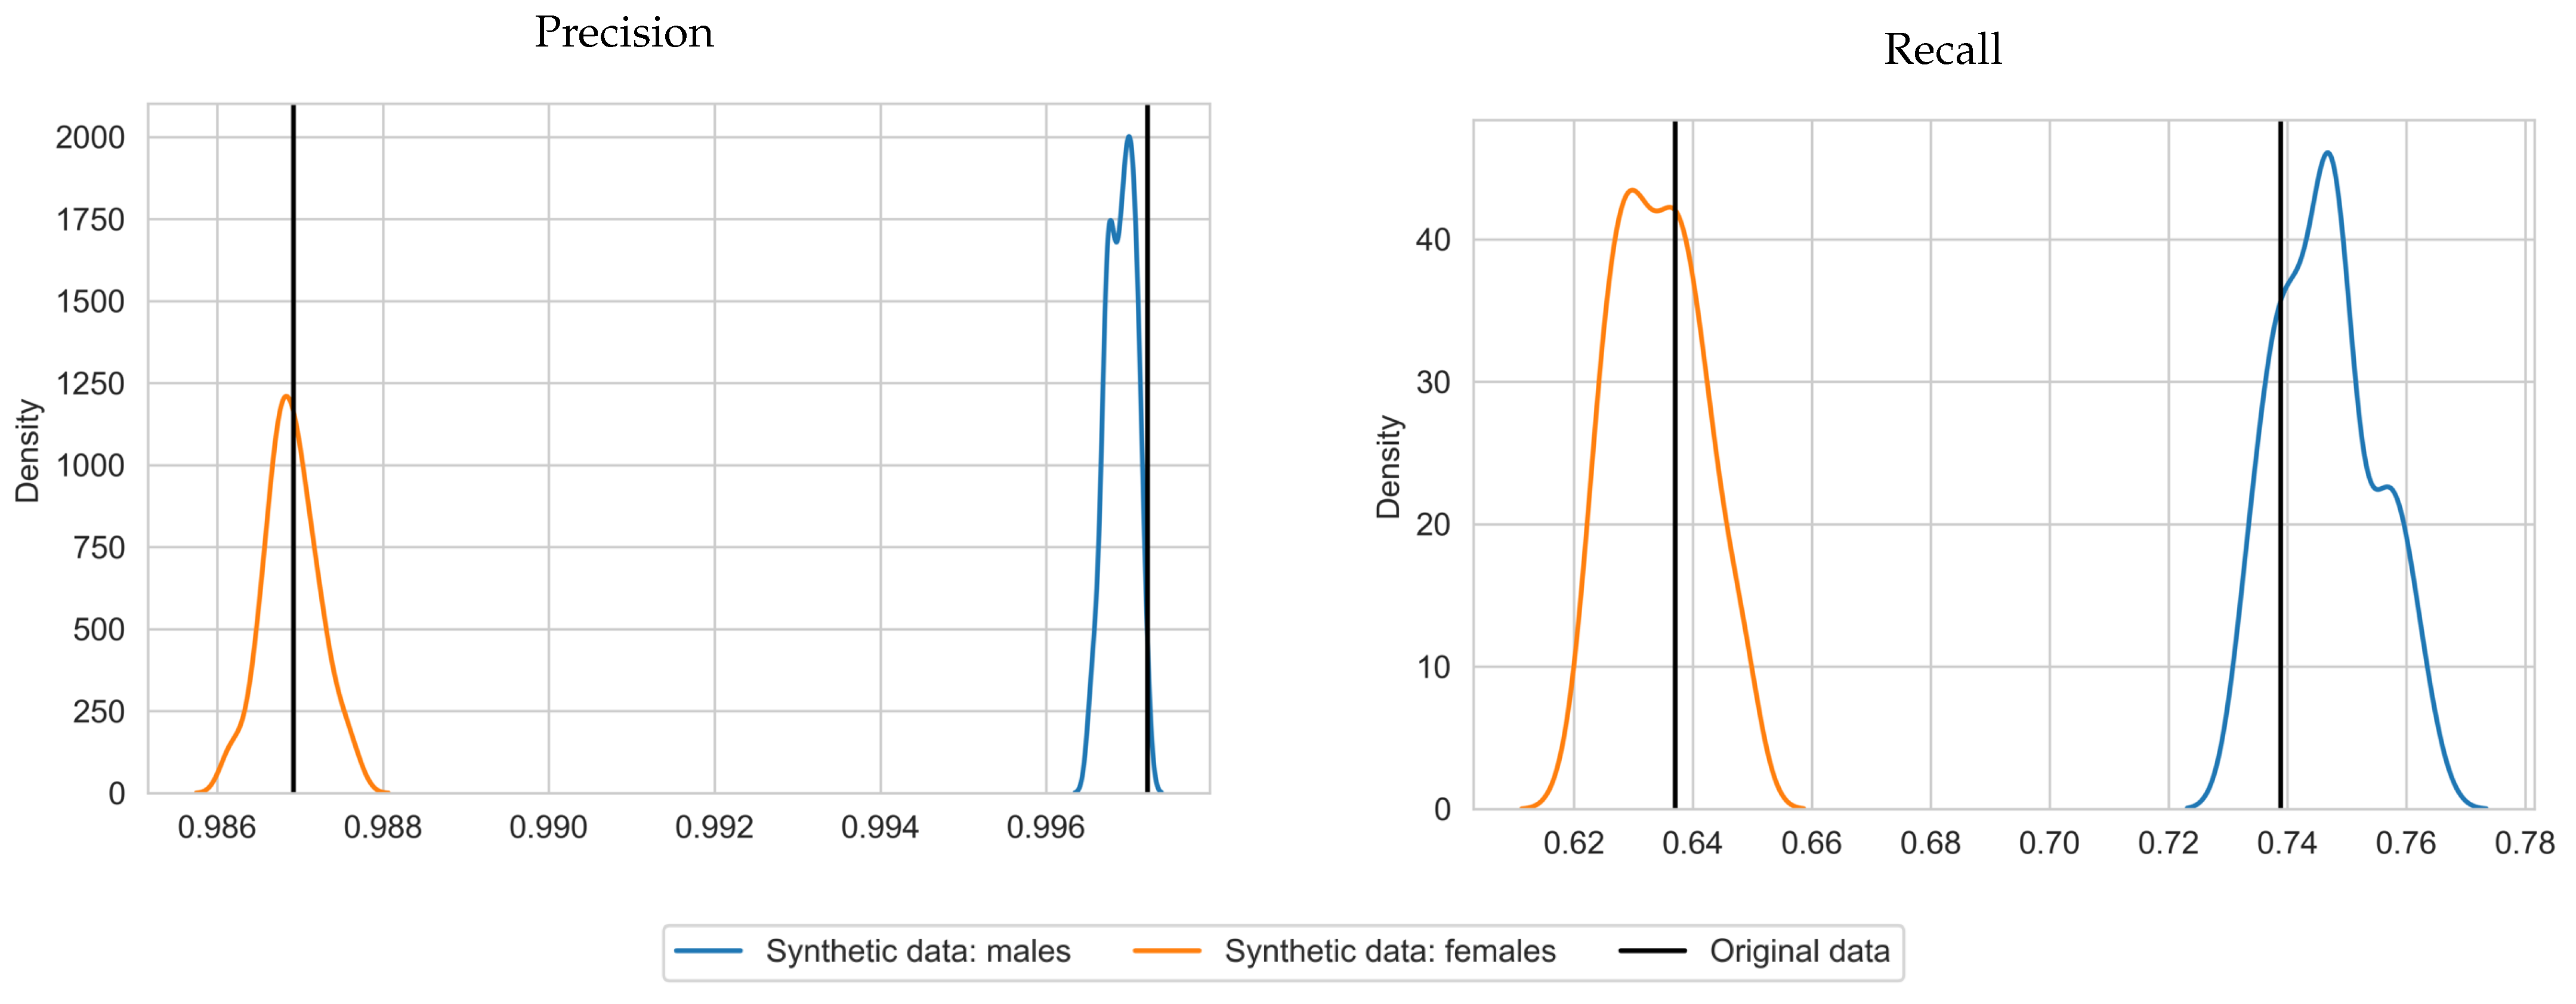
With respect to precision and recall, on average, SVMs trained with synthetic data achieved a precision score of 0.997 and 0.987 and a recall score of 0.746 and 0.634 for males and females, respectively. This is close to the results for the original data (precision of 0.997 and 0.987 and recall scores of 0.739 and 0.637 for males and females, respectively) and in some cases even higher. The standard deviations are 0.008 and 0.007 for the recall scores, for males and females, respectively. The standard deviations for precision were near zero (zero when rounded to 3 decimals). We plotted the precision and recall scores in Figure 3 to depict the shape of the distribution over the repetitions. Plots were generated with seaborn.kdeplot [31] with bandwidth 0.4. This visualizes the similarity between the precision and recall scores per gender and shows that the true scores lie close the middle of the synthetic data scores. An exception is precision for males, for which the scores almost did not deviate from the original precision score. Note that the synthetic data produced similar results for the SVMs trained on different sexes, while the MSPNs are trained for both sexes simultaneously. The classification tables for the original and synthetic data can be found in Table A1 and Table A2.
Average absolute SHAP values for the original and anonymized SVMs are plotted in Figure 4 and Figure 5, for males and females, respectively. These values indicate the variable importance in the SVM predictions for a set of 100 donations from the test data. The SHAP values based on synthetic data look similar to those for the original data. For example, for both males and females, the previous Hb level is clearly the most important predictor of current Hb. Furthermore, variable importance differs between male and female donors, which is reflected by the synthetic data results as well. For example, for females, the time since the last ferritin measurement is more predictive and the order of variable importance for Age, Month and Last Ferritin differs between the sexes as well. For a few variables, the distribution is significantly asymmetric around the original results. In particular, for female donors, the impact of Time to last ferritin tends to be underestimated when using synthetic data.
3.2. Privacy Results
The privacy results are presented in Table 1. Privacy values for the original data were not tabulated because they are identical for every variable. All measures were 0, which indicates that the sensitive value can be inferred for every variable if the values on the other eight variables are known to an attacker. For the MSPN, with which the synthetic data are generated, such attribute inference is more difficult due to the randomness and uncertainty added by the anonymization techniques. For example, for the variable Age, knowing the values on all other eight variables will lead an attacker to infer an age that differs by 15 years on average from the actual case, under the specified attack scenario. Additionally, on average, the last time a donor donated (Time to since previous Hb measurement) will also be off by 65 days and the month of donation by 4 months, on average, although it should be noted that the variable Month is circular.
For Previous Hb the range is smaller at 0.69 mmol/L for males and 0.78 mmol/L for females (see Figure 2 for the full distribution). Overall, it can be seen that none of the continuous values can be inferred exactly by an attacker, even when the values on all remaining eight variables can be used as background information.
For the binary variables, however, attribute inference is possible under the assumed attack scenario for the majority of donors. For these donors, the sex and deferral status can still be inferred if sufficient background information is available. In practice, this means that if the MSPN happens to sample a record in which all eight background variables are equal to a donor’s true values, the nineth variable (in this case either Deferral Status or Sex) will always be equal to the true value for that donor (i.e., the true Deferral Status or Sex).
In order to evaluate whether this is due to properties of the data or due to overfitting by the model, we also computed the privacy values for 4000 donors who donated in 2021, i.e., (real) test donors. These analyses show that for the test donors, who were not used to construct the MSPN, there is still a considerable proportion of individuals for whom deferral status and sex can be inferred from the MSPN (see Table 1). This substantiates the notion that the model has captured relations that apply to the donor population, instead of "memorizing” the specific pool of donors that was used to train the model. Therefore, the probability of an attackers correctly inferring a donor’s Sex or Deferral Status is not larger for donors who were used to train the MSPN than for donors who were not used to train the MSPN (i.e., test donors).
For continuous variables, the attacker’s inference is expected to be “further off” from the true sensitive information for test donors than for training donors. For most variables this difference is small, although for variables that measure differences between donation measurements (Time since last ferritin measurement and Time since last Hb measurement), donors in the training data have a significantly smaller range.
4. Discussion
CBSDG is a synthetic data approach that is unique in providing tractable and interpretable privacy-preservation built into the model. Therefore, it is worthwhile to study its practical potential. In this article, a published blood-transfusion data analysis was replicated with synthetic data to study the practical value of CBSDG. The analyses performed complement the previously published experiments in [23] by considering real data with features on which the method had not yet been evaluated.
Blood-transfusion records were synthesized using data from the Dutch national blood bank. Prediction of Hb of blood-transfusion donors by Vinkenoog et al. (2022) [26] were replicated with the synthetic data. CBSDG produced similar univariate distributions, including multimodal continuous variables and unbalanced binary data. To evaluate the similarity of variable relations, prediction of Hb of blood-transfusion donors by Vinkenoog et al. (2022) [26] were replicated with the synthetic data. The predictions were largely identical to the results with the original data, and precision and recall scores were highly similar as well.
Furthermore, visualization of variable importance depicted that these results with synthetic and original data were alike, also when differentiated between sexes. This indicates that both the predictions themselves and the reasoning for these predictions were comparable. Additionally, variation of precision and recall was low, indicating that the approach consistently performed well across different synthetic data sets. With respect to privacy, an attacker is not expected to be able to infer sensitive values with 100% accuracy, for values on a continuous scale. For categorical values, the probability of correct inference was not larger for donors who were used to generate the synthetic data, than for donors who were not part of the synthetic-data-generation process.
The synthetic data would have led to predominantly the same deferral predictions with minimal to no loss in accuracy. Furthermore, with the synthetic data, similar insights could have been acquired regarding associations between Hb deferral and specific donor characteristics, also when differentiating between male and female donors. This shows that the synthetic data sets have potential to substitute sensitive data in machine learning analyses, which are increasingly being used for blood-transfusion research [32].
Compared to other synthetic data generators, CBSDG has several advantages. First, the model (a restricted MSPN) requires little knowledge from users and no parametric distributions are assumed (as opposed to e.g., [33]), nor were (hyper)parameter settings required, other than the number of clusters. In addition, the way in which clusters yield privacy is explainable, which is an increasingly important factor in the development of privacy-enhancing technologies [34]. This allowed for a tractable privacy analysis that evaluates which relations have been learnt by the model.
The privacy analyses demonstrated that the specified attack scenario would not be successful for continuous variables. For categorical variables, however, attribute information could be inferred by an attacker with sufficient background information. An additional analysis with donors who were not part of the training set yielded similar results for these variables (Deferral Status and Sex). In other words, being part of the training data for synthetic data generation was not associated with a significantly increased risk of leaking sensitive information for categorical variables.
This demonstrates that opportunities for attribute linkage can be explained (at least in part) by properties of the data and do not necessarily result from overfitting by CBSDG. One such property could be the imbalance in Deferral Status, where guessing a negative deferral status is already accurate for 98% of the donors (even for attackers without background information). Furthermore, several variables were highly correlated, e.g., it is well-known that there is a strong relation between sex and ferritin level [35]. Men have a higher ferritin level on average and information on this variable alone could be enough to infer a donor’s sex. This also relates to the low expected deviation for Previous Hb, where an attacker’s guess on a donor’s Hb will be off by ‘only’ 0.69 mmol/L.
Apart from data characteristics there remain other factors that can lead to differences between privacy risks for categorical and continuous values. Categorical variables generally take on fewer unique values, which already increases the probability of correct inference. In addition, with CBSDG, histograms are used to model the continuous distributions within clusters, through which different values are grouped together in histogram bins. This is a form of generalization; an anonymization technique used to increase privacy [24]. For categorical variables, the probability of each value is described separately and privacy is not increased with generalization.
In the privacy analyses, it was assumed that adversaries had information on all eight remaining variables to mimic a strong attacker. This scenario was selected in order to generate generalizable analysis results that can be related to situations with less powerful attackers as well. On the other hand, this may have resulted in a scenario with an unrealistically knowledgeable attacker. For example, donors generally do not know their exact ferritin value, and therefore an attacker is unlikely to have this background information as well.
Nevertheless, there may be a desire to further increase privacy. One solution could be to modify the clustering, such that more dissimilar individuals are combined. Future research is needed to determine how this impacts utility, as clustering more dissimilar individuals may decrease the extent to which correlations are represented. Explicit parameterization of this property (i.e., the similarity of individuals within clusters) would capacitate users in navigating the privacy-utility trade-off more effectively. Furthermore, there are attack scenarios that are not covered by the analysis (such as membership inference attacks) which require further investigation.
Compared to the simulations previously performed by Kroes et al. (2023) [22], an important additional step for practical implementation is data selection. Deciding on which version of the data will be synthesized can be an impactful choice, which may require either experience or guidance by an expert. Essentially, the data set goes through different forms during pre-processing and these can differ in the extent to which they are suitable for synthetic data generation. In general, we recommend synthetizing as few variables as possible, considering that the number of inter-variable associations increase factorially with the number of variables. Moreover, synthesizing more variables creates more opportunities for potential attackers, which may be associated with unnecessary and unjustifiable privacy risks. Naturally, a suitable selection of variables and records remains dependent on the analyses to be performed with the data.
Finally we want to point out that the donation data are well-matched with the cluster-based synthetic data generator, since they contain few variables and a sizable set of records. CBSDG is expected to be less suitable for high-dimensional data, since modeling many variable dependencies would require a large number of clusters. In these cases, the model may leak private information because the number of clusters required is disproportionally high. Similar experiments can be performed with other types of data and (machine learning) analyses to gain more insight into the expected utility of cluster-based generated synthetic data in different applications. Although the performed analysis is not generalizable to all types of data, the performed experiments do show how CBSDG performs for a wider assortment of data types with more thorough utility measures than previously evaluated.
5. Conclusions
The current work demonstrates that CBSDG can reproduce complex characteristics of the data (such as multimodality and skewed binary variables), with an explainable and tractable model. Analysis results obtained from the synthetic data were highly similar to those obtained from the real personal data, even when considering intricate aspects of variable associations. Additionally, CBSDG generates data that induce significant uncertainty for potential attackers in terms of the sensitive information that can be inferred. The performed application of CBSDG with donor data shows its potential for practical implementation.
Author Contributions
Conceptualization, M.P.J. and S.K.S.K.; methodology, S.K.S.K.; software, S.K.S.K.; validation, S.K.S.K.; writing—original draft preparation, S.K.S.K.; writing—review and editing, S.K.S.K., M.P.J., M.v.L. and R.H.H.G.; visualization, S.K.S.K.; supervision, M.P.J., M.v.L. and R.H.H.G.; funding acquisition, M.P.J. All authors have read and agreed to the published version of the manuscript.
Funding
This project is funded by the Sanquin Blood Supply Foundation (PPOC-16-27).
Institutional Review Board Statement
Not applicable.
Informed Consent Statement
Not applicable.
Data Availability Statement
Data available on request only due to privacy and ethical restrictions.
Conflicts of Interest
The authors declare no conflict of interest. The funders had no role in the design of the study; in the collection, analyses, or interpretation of data; in the writing of the manuscript; or in the decision to publish the results.
Abbreviations
The following abbreviations are used in this manuscript:
| CBSDG | Cluster-Based Synthetic Data Generation |
| MSPN | Mixed Sum-Product Network |
| SVM | Support Vector Machine |
| SHAP | SHapley Additive exPlanations |
| Hb | Hemoglobin |
| PoAC | Proportion of Alternatives Considered |
| ED | Expected Deviation |
| mmol/L | millimole per liter |
| m | meters |
Appendix A
We report the classification tables for the original and synthetic data in Table A1 and Table A2. Low Hb is referred to as the positive label, whereas sufficiently high Hb for donation is referred to as a negative label.

Table A1.
Classification table for predictions made with SVMs (one per sex) trained on the original data.
Table A1.
Classification table for predictions made with SVMs (one per sex) trained on the original data.
| Positive True Label | Negative Predicted Label | |
|---|---|---|
| Positive predicted label | 3338 | 970 |
| Negative predicted label | 56,470 | 123,089 |
Table A2.
Classification table for predictions made with 50 sets of SVMs (one per sex), which were each trained on a separate synthetic data set, reported as mean (standard deviation).
Table A2.
Classification table for predictions made with 50 sets of SVMs (one per sex), which were each trained on a separate synthetic data set, reported as mean (standard deviation).
| Positive True Label | Negative Predicted Label | |
|---|---|---|
| Positive predicted label | 3317 (32) | 990 (32) |
| Negative predicted label | 56,082 (1144) | 123,477 (1144) |
References
- Baowaly, M.K.; Lin, C.C.; Liu, C.L.; Chen, K.T. Synthesizing electronic health records using improved generative adversarial networks. J. Am. Med. Inform. Assoc. 2019, 26, 228–241. [Google Scholar] [CrossRef] [PubMed]
- Bellovin, S.M.; Dutta, P.K.; Reitinger, N. Privacy and synthetic datasets. Stan. Tech. L. Rev. 2019, 22, 1. [Google Scholar] [CrossRef]
- Gonzales, A.; Guruswamy, G.; Smith, S.R. Synthetic data in health care: A narrative review. PLoS Digit. Health 2023, 2, e0000082. [Google Scholar] [CrossRef] [PubMed]
- James, S.; Harbron, C.; Branson, J.; Sundler, M. Synthetic data use: Exploring use cases to optimise data utility. Discov. Artif. Intell. 2021, 1, 15. [Google Scholar] [CrossRef]
- Xu, L.; Skoularidou, M.; Cuesta-Infante, A.; Veeramachaneni, K. Modeling tabular data using conditional gan. In Proceedings of the Advances in Neural Information Processing Systems 32, Vancouver, BC, Canada, 8–14 December 2019. [Google Scholar]
- Nowok, B.; Raab, G.M.; Dibben, C. synthpop: Bespoke creation of synthetic data in R. J. Stat. Softw. 2016, 74, 1–26. [Google Scholar] [CrossRef]
- Zhang, J.; Cormode, G.; Procopiuc, C.M.; Srivastava, D.; Xiao, X. Privbayes: Private data release via bayesian networks. ACM Trans. Database Syst. (TODS) 2017, 42, 1–41. [Google Scholar] [CrossRef]
- Hernandez, M.; Epelde, G.; Alberdi, A.; Cilla, R.; Rankin, D. Synthetic data generation for tabular health records: A systematic review. Neurocomputing 2022, 493, 28–45. [Google Scholar] [CrossRef]
- Asuncion, A.; Newman, D. UCI Machine Learning Repository. 2007. Available online: https://archive.ics.uci.edu/ (accessed on 19 January 2023).
- Murtaza, H.; Ahmed, M.; Khan, N.F.; Murtaza, G.; Zafar, S.; Bano, A. Synthetic data generation: State of the art in health care domain. Comput. Sci. Rev. 2023, 48, 100546. [Google Scholar] [CrossRef]
- El Emam, K.; Mosquera, L.; Jonker, E.; Sood, H. Evaluating the utility of synthetic COVID-19 case data. JAMIA Open 2021, 4, ooab012. [Google Scholar] [CrossRef]
- Yeom, S.; Giacomelli, I.; Fredrikson, M.; Jha, S. Privacy risk in machine learning: Analyzing the connection to overfitting. In Proceedings of the 2018 IEEE 31st Computer Security Foundations Symposium (CSF), Oxford, UK, 9–12 July 2018; pp. 268–282. [Google Scholar]
- Dwork, C. Differential privacy: A survey of results. In Proceedings of the International Conference on Theory and Applications of Models of Computation, Xi’an, China, 25–29 April 2008; Springer: Berlin/Heidelberg, Germany, 2008; pp. 1–19. [Google Scholar]
- Abay, N.C.; Zhou, Y.; Kantarcioglu, M.; Thuraisingham, B.; Sweeney, L. Privacy preserving synthetic data release using deep learning. In Proceedings of the Machine Learning and Knowledge Discovery in Databases: European Conference, ECML PKDD 2018, Dublin, Ireland, 10–14 September 2018; Proceedings, Part I 18. Springer: Berlin/Heidelberg, Germany, 2019; pp. 510–526. [Google Scholar]
- Zhang, Z.; Wang, T.; Li, N.; Honorio, J.; Backes, M.; He, S.; Chen, J.; Zhang, Y. {PrivSyn}: Differentially Private Data Synthesis. In Proceedings of the 30th USENIX Security Symposium (USENIX Security 21), Virtual Event, 11–13 August 2021; pp. 929–946. [Google Scholar]
- Gong, M.; Xie, Y.; Pan, K.; Feng, K.; Qin, A.K. A survey on differentially private machine learning. IEEE Comput. Intell. Mag. 2020, 15, 49–64. [Google Scholar] [CrossRef]
- Kohli, N.; Laskowski, P. Epsilon voting: Mechanism design for parameter selection in differential privacy. In Proceedings of the 2018 IEEE Symposium on Privacy-Aware Computing (PAC), Washington, DC, USA, 26–28 September 2018; pp. 19–30. [Google Scholar]
- Cummings, R.; Kaptchuk, G.; Redmiles, E.M. “I need a better description”: An Investigation Into User Expectations For Differential Privacy. In Proceedings of the 2021 ACM SIGSAC Conference on Computer and Communications Security, Virtual Event, Republic of Korea, 15–19 November 2021; pp. 3037–3052. [Google Scholar]
- Stadler, T.; Oprisanu, B.; Troncoso, C. Synthetic data–anonymisation groundhog day. In Proceedings of the 31st USENIX Security Symposium (USENIX Security 22), Boston, MA, USA, 10–12 August 2022; pp. 1451–1468. [Google Scholar]
- Ganev, G.; Oprisanu, B.; De Cristofaro, E. Robin hood and matthew effects: Differential privacy has disparate impact on synthetic data. In Proceedings of the International Conference on Machine Learning PMLR, Baltimore, MD, USA, 17–23 July 2022; pp. 6944–6959. [Google Scholar]
- Zhang, Z.; Yan, C.; Malin, B.A. Membership inference attacks against synthetic health data. J. Biomed. Inform. 2022, 125, 103977. [Google Scholar] [CrossRef] [PubMed]
- Kroes, S.K.; Janssen, M.P.; Groenwold, R.H.; van Leeuwen, M. Evaluating privacy of individuals in medical data. Health Inform. J. 2021, 27, 1460458220983398. [Google Scholar] [CrossRef] [PubMed]
- Kroes, S.K.S.; van Leeuwen, M.; Groenwold, R.H.H.; Janssen, M.P. Generating synthetic mixed discrete-continuous health records with mixed sum-product networks. J. Am. Med. Inform. Assoc. 2023, 30, 16–25. [Google Scholar] [CrossRef]
- Sweeney, L. k-anonymity: A model for protecting privacy. Int. J. Uncertain. Fuzziness Knowl.-Based Syst. 2002, 10, 557–570. [Google Scholar] [CrossRef]
- Machanavajjhala, A.; Kifer, D.; Gehrke, J.; Venkitasubramaniam, M. l-diversity: Privacy beyond k-anonymity. ACM Trans. Knowl. Discov. Data (TKDD) 2007, 1, 3-es. [Google Scholar] [CrossRef]
- Vinkenoog, M.; van Leeuwen, M.; Janssen, M.P. Explainable haemoglobin deferral predictions using machine learning models: Interpretation and consequences for the blood supply. Vox Sang. 2022, 117, 1262–1270. [Google Scholar] [CrossRef]
- Molina, A.; Vergari, A.; Di Mauro, N.; Natarajan, S.; Esposito, F.; Kersting, K. Mixed sum-product networks: A deep architecture for hybrid domains. In Proceedings of the AAAI Conference on Artificial Intelligence, New Orleans, LA, USA, 2–7 February 2018; Volume 32. [Google Scholar]
- Molina, A.; Vergari, A.; Stelzner, K.; Peharz, R.; Subramani, P.; Di Mauro, N.; Poupart, P.; Kersting, K. Spflow: An easy and extensible library for deep probabilistic learning using sum-product networks. arXiv 2019, arXiv:1901.03704. [Google Scholar]
- Lundberg, S.M.; Lee, S.I. A unified approach to interpreting model predictions. In Proceedings of the Advances in Neural Information Processing Systems 30, Long Beach, CA, USA, 4–9 December 2017. [Google Scholar]
- The Pandas Development Team. Pandas-dev/Pandas: Pandas, 2020. Available online: https://zenodo.org/records/10107975 (accessed on 11 November 2022).
- Waskom, M.L. Seaborn: Statistical data visualization. J. Open Source Softw. 2021, 6, 3021. [Google Scholar] [CrossRef]
- Gammon, R.; Rahimi-Levene, N.; So-Osman, C.; Grubovic Rastvorceva, R.; Al-Riyami, A.; Rexer, K.; Hindawi, S.; Vermeulen, M.; Counts, K. Meeting blood demand through use of data modelling and artificial intelligence. Vox Sang. 2022, 117, 67–68. [Google Scholar]
- Kaur, D.; Sobiesk, M.; Patil, S.; Liu, J.; Bhagat, P.; Gupta, A.; Markuzon, N. Application of Bayesian networks to generate synthetic health data. J. Am. Med. Inform. Assoc. 2021, 28, 801–811. [Google Scholar] [CrossRef]
- Hacker, P.; Passoth, J.H. Varieties of AI Explanations Under the Law. From the GDPR to the AIA, and Beyond. In Proceedings of the International Workshop on Extending Explainable AI Beyond Deep Models and Classifiers, Vienna, Austria, 18 July 2020; Springer: Berlin/Heidelberg, Germany, 2020; pp. 343–373. [Google Scholar]
- Rushton, D.H.; Barth, J.H. What is the evidence for gender differences in ferritin and haemoglobin? Crit. Rev. Oncol./Hematol. 2010, 73, 1–9. [Google Scholar] [CrossRef] [PubMed]
Figure 1.
Visualization of utility. CBSDG generates synthetic data with a mixed sum-product network (MSPN). With both the synthetic and training data, a support vector machine (SVM) is trained, with which predictions are made for donors in the test data set (indicated with dashed line). These predictions are compared as a measure of utility. The process is repeated 50 times: 50 MPSNs are generated, resulting in 50 synthetic data sets and 100 corresponding SVMs (one per sex).

Figure 2.
Density plots and histograms per variable for the original data (blue, solid line) and for a synthetic data set, chosen at random (red, dashed line).
Figure 2.
Density plots and histograms per variable for the original data (blue, solid line) and for a synthetic data set, chosen at random (red, dashed line).

Figure 3.
Density plots of precision and recall for Hb deferral predictions, using SVMs based on synthetic data, for 50 repetitions (blue for males, orange for females), with corresponding results for the original data (black vertical lines).
Figure 3.
Density plots of precision and recall for Hb deferral predictions, using SVMs based on synthetic data, for 50 repetitions (blue for males, orange for females), with corresponding results for the original data (black vertical lines).

Figure 4.
Variable importance (average absolute SHAP values) of the model based on the original data (black dot) and over 50 repetitions for synthetic data (violin plots) for males.
Figure 4.
Variable importance (average absolute SHAP values) of the model based on the original data (black dot) and over 50 repetitions for synthetic data (violin plots) for males.

Figure 5.
Variable importance (average absolute SHAP values) of the model based on the original data (black dot) and over 50 repetitions for synthetic data (violin plots) for females.
Figure 5.
Variable importance (average absolute SHAP values) of the model based on the original data (black dot) and over 50 repetitions for synthetic data (violin plots) for females.

Table 1.
Privacy results for the model with which the synthetic data were generated (the MSPN), tested for 8000 training donors and 4000 test donors.
Table 1.
Privacy results for the model with which the synthetic data were generated (the MSPN), tested for 8000 training donors and 4000 test donors.
| Predictor Variable | Privacy Measure | MSPN on Training Donors | MSPN on Test Donors | ||
|---|---|---|---|---|---|
| Mean % | Above 0 | Mean % | Above 0 | ||
| Time (hours) | ED | 3.98 | 100 | 4.34 | 100 |
| Age (years) | ED | 15.38 | 100 | 17.33 | 100 |
| Month | ED | 4.11 | 100 | 4.43 | 100 |
| Last Ferritin | ED | 71.07 | 100 | 75.89 | 100 |
| Time since last ferritin measurement (days) | ED | 152.68 | 100 | 189.91 | 100 |
| Previous Hb | ED | 0.69 | 100 | 0.78 | 100 |
| Time since last Hb measurement (days) | ED | 62.68 | 100 | 91.06 | 100 |
| Deferral Status (0 = deferred, 1 = donated) | PoAC | 0.21 | 21 | 0.22 | 22 |
| Sex (0 = female, 1 = male) | PoAC | 0.43 | 43 | 0.47 | 47 |
Expected deviation (ED) is used for ordered variables and Proportion of Alternatives Considered (PoAC) for unordered variables. A value of 0 implies a potential privacy breach.
Disclaimer/Publisher’s Note: The statements, opinions and data contained in all publications are solely those of the individual author(s) and contributor(s) and not of MDPI and/or the editor(s). MDPI and/or the editor(s) disclaim responsibility for any injury to people or property resulting from any ideas, methods, instructions or products referred to in the content. |
© 2023 by the authors. Licensee MDPI, Basel, Switzerland. This article is an open access article distributed under the terms and conditions of the Creative Commons Attribution (CC BY) license (https://creativecommons.org/licenses/by/4.0/).
Share and Cite
MDPI and ACS Style
Kroes, S.K.S.; van Leeuwen, M.; Groenwold, R.H.H.; Janssen, M.P. Evaluating Cluster-Based Synthetic Data Generation for Blood-Transfusion Analysis. J. Cybersecur. Priv. 2023, 3, 882-894. https://doi.org/10.3390/jcp3040040
AMA Style
Kroes SKS, van Leeuwen M, Groenwold RHH, Janssen MP. Evaluating Cluster-Based Synthetic Data Generation for Blood-Transfusion Analysis. Journal of Cybersecurity and Privacy. 2023; 3(4):882-894. https://doi.org/10.3390/jcp3040040
Chicago/Turabian StyleKroes, Shannon K. S., Matthijs van Leeuwen, Rolf H. H. Groenwold, and Mart P. Janssen. 2023. "Evaluating Cluster-Based Synthetic Data Generation for Blood-Transfusion Analysis" Journal of Cybersecurity and Privacy 3, no. 4: 882-894. https://doi.org/10.3390/jcp3040040