Supervisory Control and Data Acquisition Approach in Node-RED: Application and Discussions


Department of Automation and Applied Informatics, Faculty of Automation and Computers, University Politehnica Timișoara, 300223 Timișoara, Romania
*
Author to whom correspondence should be addressed.
IoT 2020, 1(1), 76-91; https://doi.org/10.3390/iot1010005
Submission received: 23 June 2020
/
Revised: 5 August 2020
/
Accepted: 7 August 2020
/
Published: 10 August 2020
(This article belongs to the Special Issue Industrial IoT as IT and OT Convergence: Challenges and Opportunities)
Abstract
:The Internet of Things (IoT) represents the binder of two worlds, specifically the real one and the digital one: tangible objects become recognizable in the virtual world, having digital matches, thus creating a network that enables the connection in-between the components. With the contemporary evolution of this domain, interconnectivity has become a primary fraction of new research and development directions. The Industrial Internet of Things (IIoT) is a concept that covers the more industrial level of the physical and digital connection and stays behind the Industry 4.0 concept. Supervisory control and data acquisition (SCADA) applications are important in the industry, their core being very present as complex products of big companies, at high prices. The Node-RED environment quickly evolved as one of the most important perspectives in IIoT, able to replace, up to a certain level, classic SCADA applications, bringing benefits to the industry. In this paper, the main focus is to evidence this aspect and to develop an application that will demonstrate the functionality of the concept, making use of protocols such as Modbus TCP (Transmission Control Protocol) for interacting with industrial devices and Message Queuing Telemetry Transport (MQTT) to interact with higher-levels, which provides a publish-subscribe structuring and a low band-width usage. The application uses logging and archiving modules based on InfluxDB database and is conceived to achieve the visual supervisory structure as close as possible to well-known SCADA solutions. The presented work results prove the efficiency of the solution.
1. Introduction
The Internet of Things (IoT) and Industrial Internet of Things (IIoT) concepts express challenges and opportunities regarding connectivity, integrability, interoperability, and information exchange/interoperation between devices and systems [1,2]. IoT/IIoT are links between two environments, namely the physical materialized one and the virtually created universe [3]. IoT is, basically, a synonym for the term “interconnectivity”, as in [4], forming a “net” between the entities involved in this communication system. As taken into account, IoT devices have had a dramatic expansion of usage among the contemporary developments of new technologies. For these reasons, IoT designates a promising enlargement zone for businesses, informational processes, and multiple industries [5], contributing progressively to the actuality of the modern world. Starting from concepts such as cyber-physical systems (CPS) as expressed in [6], the purpose is to gain intelligence as close as possible to the physical level and the fog [7], going up to processing the gained information and augmenting it with artificial intelligence in order to improve the functionality of existing structures [7,8,9]. Finally, the purpose is to react on existing systems and increase the overall efficiency, after testing and analyzing the proposed algorithms on digital twins [10,11].
One of the key issues in connecting the physical and the digital worlds is the interoperability. The physical support is one issue, but modern technologies are providing valuable resources. An important issue is the interfacing. For many years, the industry presented closed, proprietary protocols when considering automation and supervisory control and data acquisition (SCADA) structures. Big companies have grown in this sense to large scales. In this sense, even SCADA applications that are mainly a software structure running on specific hardware, were moved somehow from pure software development that remained only inside the company, to a more closed and configuration type structuring that reached the SCADA integrator. Usually, the whole system, starting from the actioning devices or even from the measuring devices, moving towards programmable logic controllers (PLCs), human–machine interfaces (HMIs), switches, routers and SCADA, was implemented from the same producing company and therefore a particular protocol was used inside the entire system.
The Object Linking and Embedding for Process Control (OPC) concept and later the OPC unified architecture (OPC UA), called open platform communication, opened the world for a different perspective, respectively for IoT and IIoT. Therefore, researches have frequently been preoccupied with integrating OPC UA on every device, or with gateways and wrappers, assuring the interfacing with classic protocols and converting to OPC UA, therefore opening up the systems for Industry 4.0 [12,13,14,15].
OPC UA is an application protocol that, according to the latest specifications, is oriented towards larger and faster data communications. Therefore, other transport level protocols are aimed for now to augment OPC UA, for example User Datagram Protocol (UDP), or the newer protocol on the Open Systems Interconnection (OSI) transport level, Message Queuing Telemetry Transport (MQTT). MQTT and Advanced Message Queuing Protocol (AMQP) are solutions to integrate data to the cloud, having a well-defined publish-subscribe mechanism that can handle big data. The literature is focusing intensively on MQTT [16,17,18]. The industry is also focusing on MQTT, the protocol being implemented on various PLCs. MQTT is lightweight and fast, so it could cover the field level, being a good solution for field data integration. Even SCADA solutions are slowly moving in the MQTT direction. For example, one of the most competitive SCADA environments, Ignition, presents from a third party the MQTT mechanism. The application protocol that covers MQTT in Ignition is Sparkplug, an as yet not very popular protocol, especially in Europe.
But, SCADA, with some exceptions, is generally moving slower. Classic SCADA is expensive and has to assure upgrades from previous versions. In addition, some SCADA systems were controlling entire domains due to specific legacy protocols (e.g., IEC 60870-5-104 in electricity). In the past, the first important issue regarding SCADA was the ability to integrate data, specifically to interface lower level systems, PLCs. Therefore, many drivers were conceived for specific types of SCADA, there being many times the differentiating aspect between them. With the occurrence of centralizing OPC/OPC UA servers, the SCADA solutions moved to classic OPC first and then to OPC UA. After the development of OPC clients, many SCADA systems implemented OPC UA servers to be interoperable from higher levels. Software environments such as Citect were built natively according to OPC. Or, Ignition, an environment that relies much more on high customizing and pure software development, uses OPC/OPC UA and some other legacy protocols (e.g., Modbus TCP, being one of the most used legacy protocols [19], S7, Ethernet/IP, etc.). Regarding MQTT, only a few SCADA systems have been foreseen yet with this mechanism.
Other SCADA features besides communication with the field level and higher levels include data representation, visual development, logging, archiving, alarm management, reporting, mobile module, development style, etc. The data representation in classic SCADA is usually related either to tags or to graphical developments. Due to requirements in optimizing development and maintenance/upgrade times and costs, other types of data representations were proposed for some SCADA systems. An original, object-oriented approach is used in Interactive Graphical SCADA System (IGSS) SCADA, where the physical object is desired to be represented by a digital object. Therefore, a digital object contains atoms that are connected to tags from PLCs. Even the licensing in IGSS is designed on objects. Other object-oriented approaches are focusing on main objects that are containing attributes and methods. These object-oriented approaches are placing the graphical representation later, therefore increasing the efficiency in development.
Databases assure logging and archiving. SCADA is moving towards Structured Query Language (SQL)-based databases (e.g., WinCC, Ignition, Indusoft, etc.), an deven IGSS recently moved to SQLite as an implicit database. There are SCADA software environments with mobile capabilities. The types of mobile supervision associated to SCADA servers are: rudimentary remote desktop types of modules; mobile applications running pattern type of representations (e.g., IGSS); custom developments for mobile applications (e.g., Ignition Perspective). The SCADA development capability for the final integrator is now seen as concurrent and fast development and deployment of solutions, many times web-oriented (e.g., Indusoft, Ignition).
The current paper presents a low-cost, highly customizable, platform-independent, modular, web-based and efficient SCADA approach, based on Node-RED IoT environment. The paper progressively explains the SCADA concept and implementation. The project constructs an IoT network that allows the component parts, both physical and digital, to communicate and transfer information, respectively, and develops the basic SCADA features for an actual and efficient approach of process supervision. In the application, the Modbus TCP and the MQTT protocols are implemented, the InfluxDB time-series database is utilized and the Grafana tool is used to improve database manipulation within the proposed SCADA visual dashboard. The solution is finally tested, obtaining excellent results.
2. Materials and Methods
In this section, the conceptualization of creating an SCADA-IoT architecture based on the Node-RED platform is exposed. A case study inquiring the software architecture, the configuration and implementation of the specific components, as well as the network linking them together, will be interpreted afterwards.
2.1. Concept and Architecture
The concept of IoT expands the already existing vision of traditional SCADA, by embedding diverse material components in information systems linking them to digital representations, providing the ability to collect and transfer data, in real-time, over a multitude of different protocols. As SCADA is built on the main principles of assuring real-time information monitoring and the control of processes, the notion of IoT caters to the interoperation and integration of contemporary modules and services that facilitate data aggregation, as well as archiving historical data in order to ensure analytics of it, which permit a wider understanding regarding the meaning of the acquired information. Mainly, an integrated architecture of SCADA with an IoT platform encompassing a diversified amalgamate of network protocols allows for the achievement of a comprehensible quality of production.
Preliminary to creating an IoT-based SCADA application, ensuring the integrity of the data collected, as well as an efficient streaming mechanism, represent the foundation of it. Since an IoT solution implies the existence of multiple devices and services, acquiring values from them depends upon certain communication protocols that facilitate data transmission. The authors’ perspective for the proposed IoT-based SCADA system is that it has to assure communication protocols and platform independency with respect to the cost issue.
In the sense of the physical support, some of the frequently used communication technologies include: ETHERNET, RS232/RS485, universal serial bus (USB), Wifi, Global System for Mobile Communications (GSM), etc. These options comprise parts of actual solutions urged by the contemporary industries that adopt IoT implementations. Ethernet represents a high-speed and reliable connection method, often utilized in different sectors of industries. It offers a less vulnerable option for disruptions, alongside an inexpensive alternative to other cable mediums. Its popularity was sustained through technological advancements, because of the backward compatibility it provides. RS232 fundamentally constitutes a transferring standard, remarked by its simplicity, frequently used in point-to-point connections, which is resistant to noise. It is not efficient regarding the transmission speed when distances are relatively long, nor price-wise due to its requirement of separate transceiver chips, as well as convertors. In the case of short transmission distances, the most favorable solution would be the Bluetooth Low-Energy protocol, which combines the conventional Bluetooth designation in addition to lower power consumption. The core of the proposed SCADA solution is based on Node-RED. The Node-RED IoT environment is platform-independent and therefore it can run on various operating systems. Various hardware platforms are able to handle Node-RED, including some with preinstalled environments, for instance Raspberry Pi, IoT 2040, etc. Therefore, the physical support assurance is an easy issue with the variety of hardware modules and their networking possibilities.
The important issue is the interfacing with devices, basically to have communication protocols both for the new and old/legacy systems. The automation and industrial world is still full of legacy systems, because of the long-lasting functionality and sometimes the inability of the companies to change the legacy systems from grounds. Therefore, starting from serial protocols as Modbus, Canopen, Profibus, etc., and continuing with Ethernet-based protocols as Modbus TCP, Profinet, Ethernet/IP, etc., the SCADA system has to assure their availability in order to obtain a wide applicability. Node-RED is an open-source, nodes and flows-based environment that is continuously augmented with various nodes. In the beginning, Node-RED was conceived as an IoT environment, but with the occurrence of industrial interfacing, it moved to being an IIoT environment. Many serial and Ethernet-based legacy protocols exist in Node-RED. All of the above-mentioned interfacing nodes vigorously subsist in Node-RED, and the system is continuously growing.
Regarding older SCADA interfacing, classic OPC DA is also available in Node-RED (node-red-contrib-opc-da), assuring basically the ability for Wrapper and Gateway implementations in Node-RED, that allow moving from older protocols towards new and efficient ones, assuring the interoperability of systems (e.g., studies from [13,14]). New protocols from various OSI levels are present in Node-RED. OPC UA has been present for a long time now, evolving constantly and enlarging its possibilities. An OPC UA client can be used to connect to devices for data integration and an OPC UA server is utilized for higher level data integration, or for interoperation with same level devices that extract exposed data. The new Sparkplug B is also present, assuring the connection with other Sparkplug B devices using MQTT transport protocol. Sparkplug B assures connection with Ignition devices (Edge or Vision based devices). MQTT represents a universal transfer protocol that provides a simple and lightweight method of passing messages, its small code footprint constituting a primary advantage, alongside a bandwidth usage that permits remote connections to rapidly exchange data between clients, thus making it an efficient transfer protocol commonly used in IoT applications for high-level entity interaction. An MQTT node is present in Node-RED, allowing Mosquitto-based data communications. In addition, AMQP nodes are present, assuring together with MQTT, the communication to the cloud. The connection to the cloud is also possible (e.g., nodes for Azure, AWS—Amazon Web Services), but Node-RED developed its own cloud version that hosts Node-RED, Front End Node-RED (FRED). Adopting cloud services for IoT-based solutions is a very important aspect of data centralization and management, in order to guarantee the safe, efficient and fast delivery of it. Distinct integrations of cloud-hosted systems, apace with profiling wireless transmission protocols, ensure fair operational costs and minimal requirements of the network.
As an IoT platform generally archives historical data for future analytics, a storage methodology is to be implemented into the infrastructure of the system. In regard to data handling in the IoT sector, choosing a database that offers the right capabilities represents an aspect of high importance, in any given context. These capabilities refer to scalability, portability, efficiency when it comes to writing, compressing and accessing stored data, information security and relative costs of the implementation. Regarding database connection and usage, Node-RED allows connecting to various databases, starting from MSSQL, MySQL, SQLite, PostgreSql, Oracle, etc., and continuing with time-series databases as the newer InfluxDB. Although classic SQL relational databases can be utilized to satisfy the competitive medium of contemporary developments, more optimized options are represented in today’s sector of network solutions. Usually, a time-based storage system is more efficient in regard to depositing and manipulating new data, as it allows for rapid logging and accessing of the data. In Node-RED, being a modular and highly customizable environment, the logging, archiving and reporting, which are very specific to SCADA, can be realized with a complete know-how of a software developer, even on the integrator level. However, tools such as Grafana are also available for easy customizing database manipulation and graphical representations of data within the visual dashboard (also a very important feature in SCADA). Node-RED provides the possibility of developing a dashboard which emulates the monitoring SCADA component.
Thereby, regarding a cost-benefit balance, it would be difficult to identify shortcomings related to classic SCADA systems. Regarding the multiple connectivity options to devices and services, the modern modular approach and scripting, as well as the possibilities of data analyzing and manipulation, are providing many more options than other SCADA systems. Moreover, in the authors’ opinion, Node-RED represents the environment with one of the highest potentials for IoT/IIoT, and follows the proposed conceptual approach with a high rate increase for SCADA solutions. Basically, the entire SCADA project will be exposed through flows that can be exported as .json files. The flow-based guiding concept offers a high technological readiness level (TRL) and allows the easy identification of tags, objects, data vehiculation, etc. Therefore, it can be rapidly accepted by SCADA integrators.
2.2. Case Study
In the process of implementing the Node-RED-based SCADA solution, it is mandatory to select a specific protocol that permits data transfers through the network of components. A primary key is determining the appropriate protocol for the desired result of communication. The advantages and disadvantages of each communication protocol should be taken into consideration, as they differ in their utility, transmission rate and distance. In the IoT context of development, wireless communications are the preliminary solution regarding data transmission. Prior to determining the most suitable protocol for data transference, the background in which it will be employed should be taken into consideration, as some factors such as power usage, network bandwidth and range require different configurations. Due to the fact that scalability is of high importance in the development of a SCADA-IoT integration, refinement of the interoperable network represents a part of the criteria that determines the possibility of adaptability for future directions of expansion, as usage scenarios can be predetermined for a finite number of cases. To satisfy the imposed requirement, IoT platforms should allow for such new integrations at any given time, not affecting the initial integrity of the system, nor inquiring risks. Adaptability solicits a vast diagram of usage scenarios, as numerous devices require different operating abilities. Other facilities that should be granted by a communication network developed in the context of IoT are efficiency, with the aim to employ technologies able to handle the real-time nature of such systems, and security.
The architecture of the implemented functional case-study SCADA system based on Node-RED is depicted in Figure 1. The structure will be presented with regard to its modules and components in the following paragraphs. The chosen protocol was the widely spread Modbus TCP, but it could have been any other protocol. In the case study, the data originate from a PLC (in this case, all the logic and hardware components are being simulated), and is read via Modbus TCP/IP inside the core, which is represented by the Node-RED fraction of the application. Node-RED processes the raw data and provides the insertion of the resulted time series in the database, into the determined measurement. Grafana performs timed queries on the data source provided, ensuring the visualization of metrics. Afterwards, the panels that ensued from the dashboard are imported into the user interface from Node-RED to assure a single useful monitoring medium. The MQTT broker redirects all the published messages to all subscribed clients. Lastly, an important segment is constituted by the two selected clients utilized in favor of testing the communication resulting from the network created by the multiple entities.
In the supervised process within the SCADA solution, the logic on which the application is developed is as follows: two motors can be controlled through a PLC using two digital inputs as the switches that turn them on/off (the off state is set to 0, while on is defined by 1), an analogical input that sets the revving of motor 1 with values in range of 0–100%. Both motors have distinct values at which they are considered damaged: for motor 1, the values are designated to be 0–3, with 0 indicating there is no alert to deal with, whereas values 1–3 mean that there is either an over-current, an over-temperature or both issues. The total number of damage values that were registered for motor 1 is stored in a registry. Motor 2 has a general damage alert set at value 1. With reference to the speed of motor 1, depending on the read percentage, a certain state will be assigned to the registry in question. These states are set from 0–4 in the following format:
- 0—the motor is off
- 1—speed is set to a value comprised in the interval 1–24%
- 2—25–74%
- 3—75–98%
- 4—speed of the motor is set to 99–100%
The previously specified parameters are assigned to the subsequent registries:
- address 40001-tag 1—Revving of motor 1
- address 40002-tag 2—Total number of damage values that were registered for motor 1
- address 40003-tag 3—On/off switch value for motor 1
- address 40004-tag 4—On/off switch value for motor 2
- address 40005-tag 5—Damages that intervened for motor 1
- address 40006-tag 6—Motor 2 general damage
- address 40007-tag 7—State of motor 1
Using the logic described above, a Modbus TCP/IP protocol simulator was used to recreate the required environment for further development of the IoT network. Any application that can simulate the necessary configuration of the Modbus TCP/IP protocol will achieve the imposed requirements. Therefore, it was chosen to continue the implementation using Mod_RSsim, which can successfully accomplish all conditions. The Modbus simulator was used because of the current worldwide issues that did not allow the authors to test and validate the developments until the last moment. However, the developments were also validated in laboratory using Siemens stands based on S7-1214C PLC where a Modbus TCP server was implemented, Scalance switches, Teltonika 4G routers, Siemens motors, frequency converters, encoders, etc.
The accumulation of data collected from the characteristic registries is to be stored in a database. Considering the predicaments promulgated by the IoT domain, InfluxDB was elected by virtue of its capacity to write and access data in a very small amount of time. Instead of the classic database, where the information is stored in tables, InfluxDB approaches a different method of storing data, inside measurements. A measurement consists in a record that has a timestamp which is granted to every series written. As it incorporates continuous queries, as well as a retention policy system, both of which enable the maintenance of data, this database can be utilized at adequate performance, even after a period of time. In this manner, a two hours default retention policy was defined in the database, meaning that stored series will be kept for an interval of two hours. A second retention policy was required for gathering compressed data, the result of a continuous query that calculates the average of fields in the measurement every 30 minutes, which lasts the equivalent of a year, meaning 52 weeks.
In order to enhance the visualization of metrics, Grafana, the open source software capable of analyzing data and creating graphics and alerts that can be embedded, was employed for the purpose of further expanding the possibility of monitoring data in a single interface. Certain settings were called with the aim of encapsulating the visualizations created: it was necessary to allow embedding in Grafana’s settings, as well as anonymous access (since the purpose of this implementation is the usage of protocols and the construction of an IoT network that allows intercommunication, security was not addressed in a detailed manner). Furthermore, to concede the connection from either device to the constituents of the dashboard customized in Grafana, port 3000 was forwarded. To access the series stored inside the database, the data source of the newly created dashboard was set to InfluxDB that runs on the local server, resorting to port 8086, by selecting the corresponding name of the database and the measurement. Moreover, choosing to add a new panel in the desired dashboard in Grafana will allow selecting a visualization method for the retrieved data. Every visualization panel provides a specific set of features that can be modified to meet the necessities of the implied application. In this case, the dashboard consists in seven visualization panels with the following queries: four of the mentioned panels have queries that fetch data from the measurements in regard of setting up a graph that allows monitoring of revving speed and number of occurring damages, two of the panels display the total number of alerts and current revving of motor 1, while the final one reveals alerting rules and current situation for both motors. The creation method was identical for all the panels, excepting the select statements. The only differences consist in the chosen method of visualization, in addition to the exhibited information.
For further developing the project, setting up a MQTT broker comprises a cardinal stage. Hence, the broker will be represented by a Mosquitto broker, since it allows additional extension of the final result. Mosquitto is an open source MQTT broker, suitable for the build-out of this system. As clients utilized for testing purposes, two applications, MQTT.fx for Windows operating system and MQTTClient for iOS, will be put to practical use. The role of the previously mentioned applications is to publish messages in a topic that the broker will redirect to diverse clients which are subscribed to that specific topic.
Since the purpose of this project was to construct a SCADA application, it involved combining a multitude of constituents described former to this paragraph. These elements form a network which facilitates the interconnectivity between the real and the digital world, thus defining the concept behind the meaning of Internet of Things. In order to highlight a central point of the application, Node-RED, a software program developed by IBM, was utilized. This grants the ability to build the ideology of communication between all the components specified above. The main administrator application is divided into two sub-flows and one flow. One sub-flow is used for obtaining data through the Modbus TCP/IP protocol from the registries and the other sub-flow is utilized for importing visual elements from Grafana, as the cardinal purpose of the project is to integrate all components into a single practical interface that enables the interaction of all entities.
As previously mentioned, the first step of the development consists of accessing the registries that contain written data. To do so, an injection node was configured to send a signal that will start the reading cycle every one second. A cycle is represented by a series of actions, as follows: after the input signal, a function node sets up the required options, which will be used by a server flex getter node, afterwards reaching another function node in which the payload is processed for further insertion into the database. The function node that establishes the options contains information such as the input, which will be the payload of the previous node, the function code, which will be 3 in this case, since we are reading holding registers, the starting address of the primary registry (the first tag declared was 40001, the equivalent of it being 0 for setting up the options node) and the number of units that are to be read. All the information listed above provides the node that is connected to the server with the needed preferences for reading the data. The connection to the server is created by adding a new Modbus client in the nodes that require it, with the desired configuration matching the simulator. The port needs to be the same one selected in the simulator, in this context, being 502.
Furthermore, it is necessary to define a dictionary using Javascript programming language so that the data are stored correctly in the measurement. To be able to reach certain values and publish them to a specific topic or make use of them in other contexts (for example, if we need to write a value based on another variable) we declared global variables using the function global.set(). Access to these global variables is granted by the function global.get() and it can be called in function nodes from any flow or sub-flow. After data processing, the information formatted is stored into the InfluxDB database (see Figure 2). The connection to this database is established through a server, by setting its properties in this manner: specify the IP address of the host and the port on which they communicate, followed by the database name.
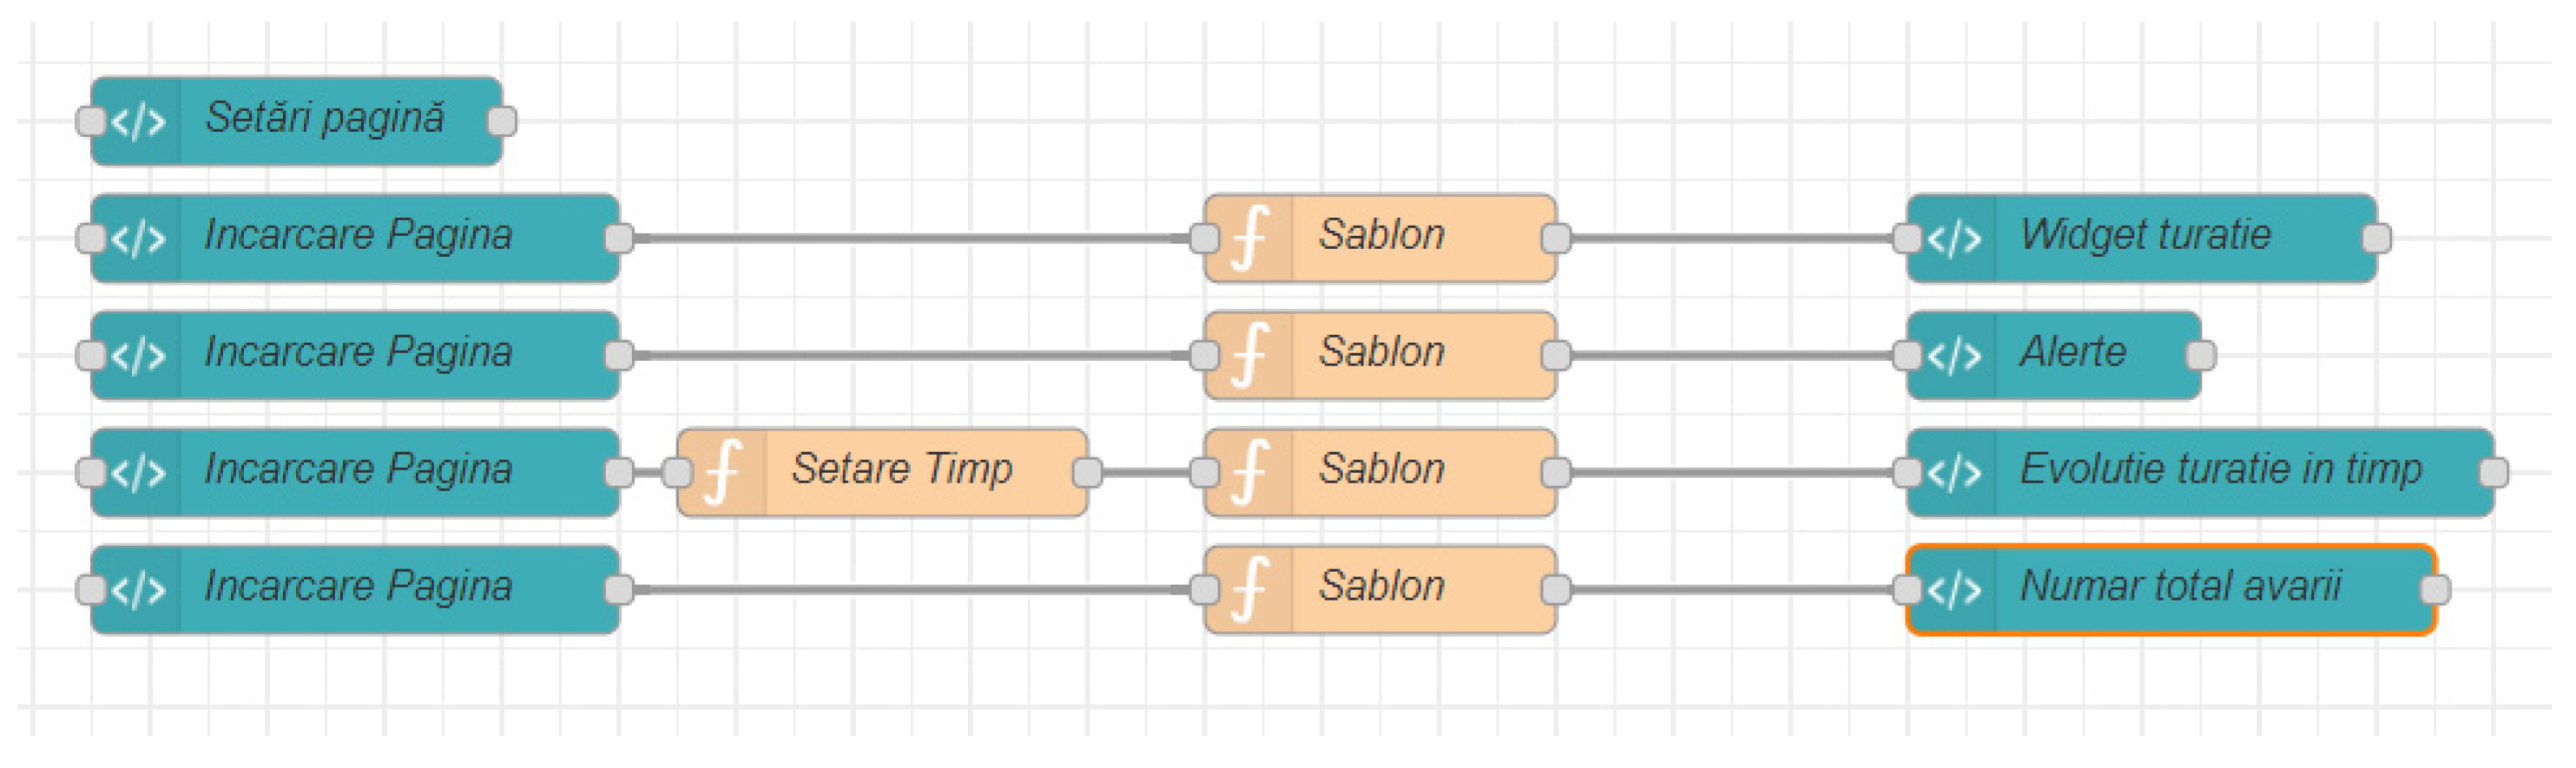
A second step in the finalization of the main component is importing the panels from Grafana into a single dashboard in Node-RED (see Figure 3). To achieve this embedding, the grouping system in the layout tab from Node-RED is used. Every panel was given a tab and positioned in the desiderated location on the interface. The panels are embedded by using a function node. In this node, the payload is represented by the IP address on which the Grafana server runs, the port 3000, a link obtained from individual panels, the refresh time, theme, from and to date which belong to the predefined variable called msg, and the ID of the panel.
These two sub-flows will be integrated into the main flow of the application. This flow (see Figure 4) establishes the main logic behind the complete functionality of the whole system. First and foremost, the elements contained by the dashboard, specifically represented by a slider node, two switch nodes and a non-editable text node, were configured and added to different groups in the desired location on the user interface. These nodes link the visual graphics to the logic implemented behind. Furthermore, to extend the monitoring facility of this application, a Scalable Vector Graphics (SVG) node was utilized which permitted the access to a scalable vector graphics editor. The outcome was animated to enact the current state of the motors, by using the defined properties which have been customized according to the input. To provide a correct set of options, the payload of the messages passed through was descripted in a function node chartering the command in order to update the style for the specified selector in an according manner (a selector consists in the group that is to be modified), as well as the name and value of the attribute, which in this case was fill.
Following the user’s selections, the transmitted values are passed to function nodes that process the read data and publish the results in a MQTT topic through a “mqtt out” node configured to connect to the local broker through the port 1883. The broker manages the published messages and distributes them further to all subscribed clients. The Node-RED context also constitutes a client subscribed to the topics, thus messages are also reaching this part of the network via “mqtt in” nodes. As a final step in this development process, the messages reach a “Modbus-Write” node which allows changing the value at the address of the stated holding register.
3. Results
This section of the paper provides a concise and precise description of the experiments and their consequences, in conjunction with their interpretation and experimental conclusions that can ultimately be drawn.
To test the logic of the implementation and the distribution of the messages through the multiple components, and ultimately verifying the integrity of the data contained in the declared addresses at the explicit holding register, as mentioned before, two MQTT clients were used in conformity with the requirements of the protocol. As a first inquiry, MQTT.fx played the role of the client, explicitly being subscribed to the topic in which it publishes the messages so it assists the process of redistribution by providing an overview of the sent value. The second evaluation brings forward the same testing format, only from the perspective of a mobile user. The end result of the testing situations is to evince the certainty that the data are dispatched correctly and in an integral form within the IoT network.
3.1. Testing using MQTT.fx
The required steps for the first scenario are as follows:
- Accessing the user dashboard on port 1880
- Modifying the turn on/off switches of the motors and visualizing the corresponding value in the holding registers of the simulator
- Adjusting the percentage of the speed from the interface, as well as publishing a message in the delegated topic
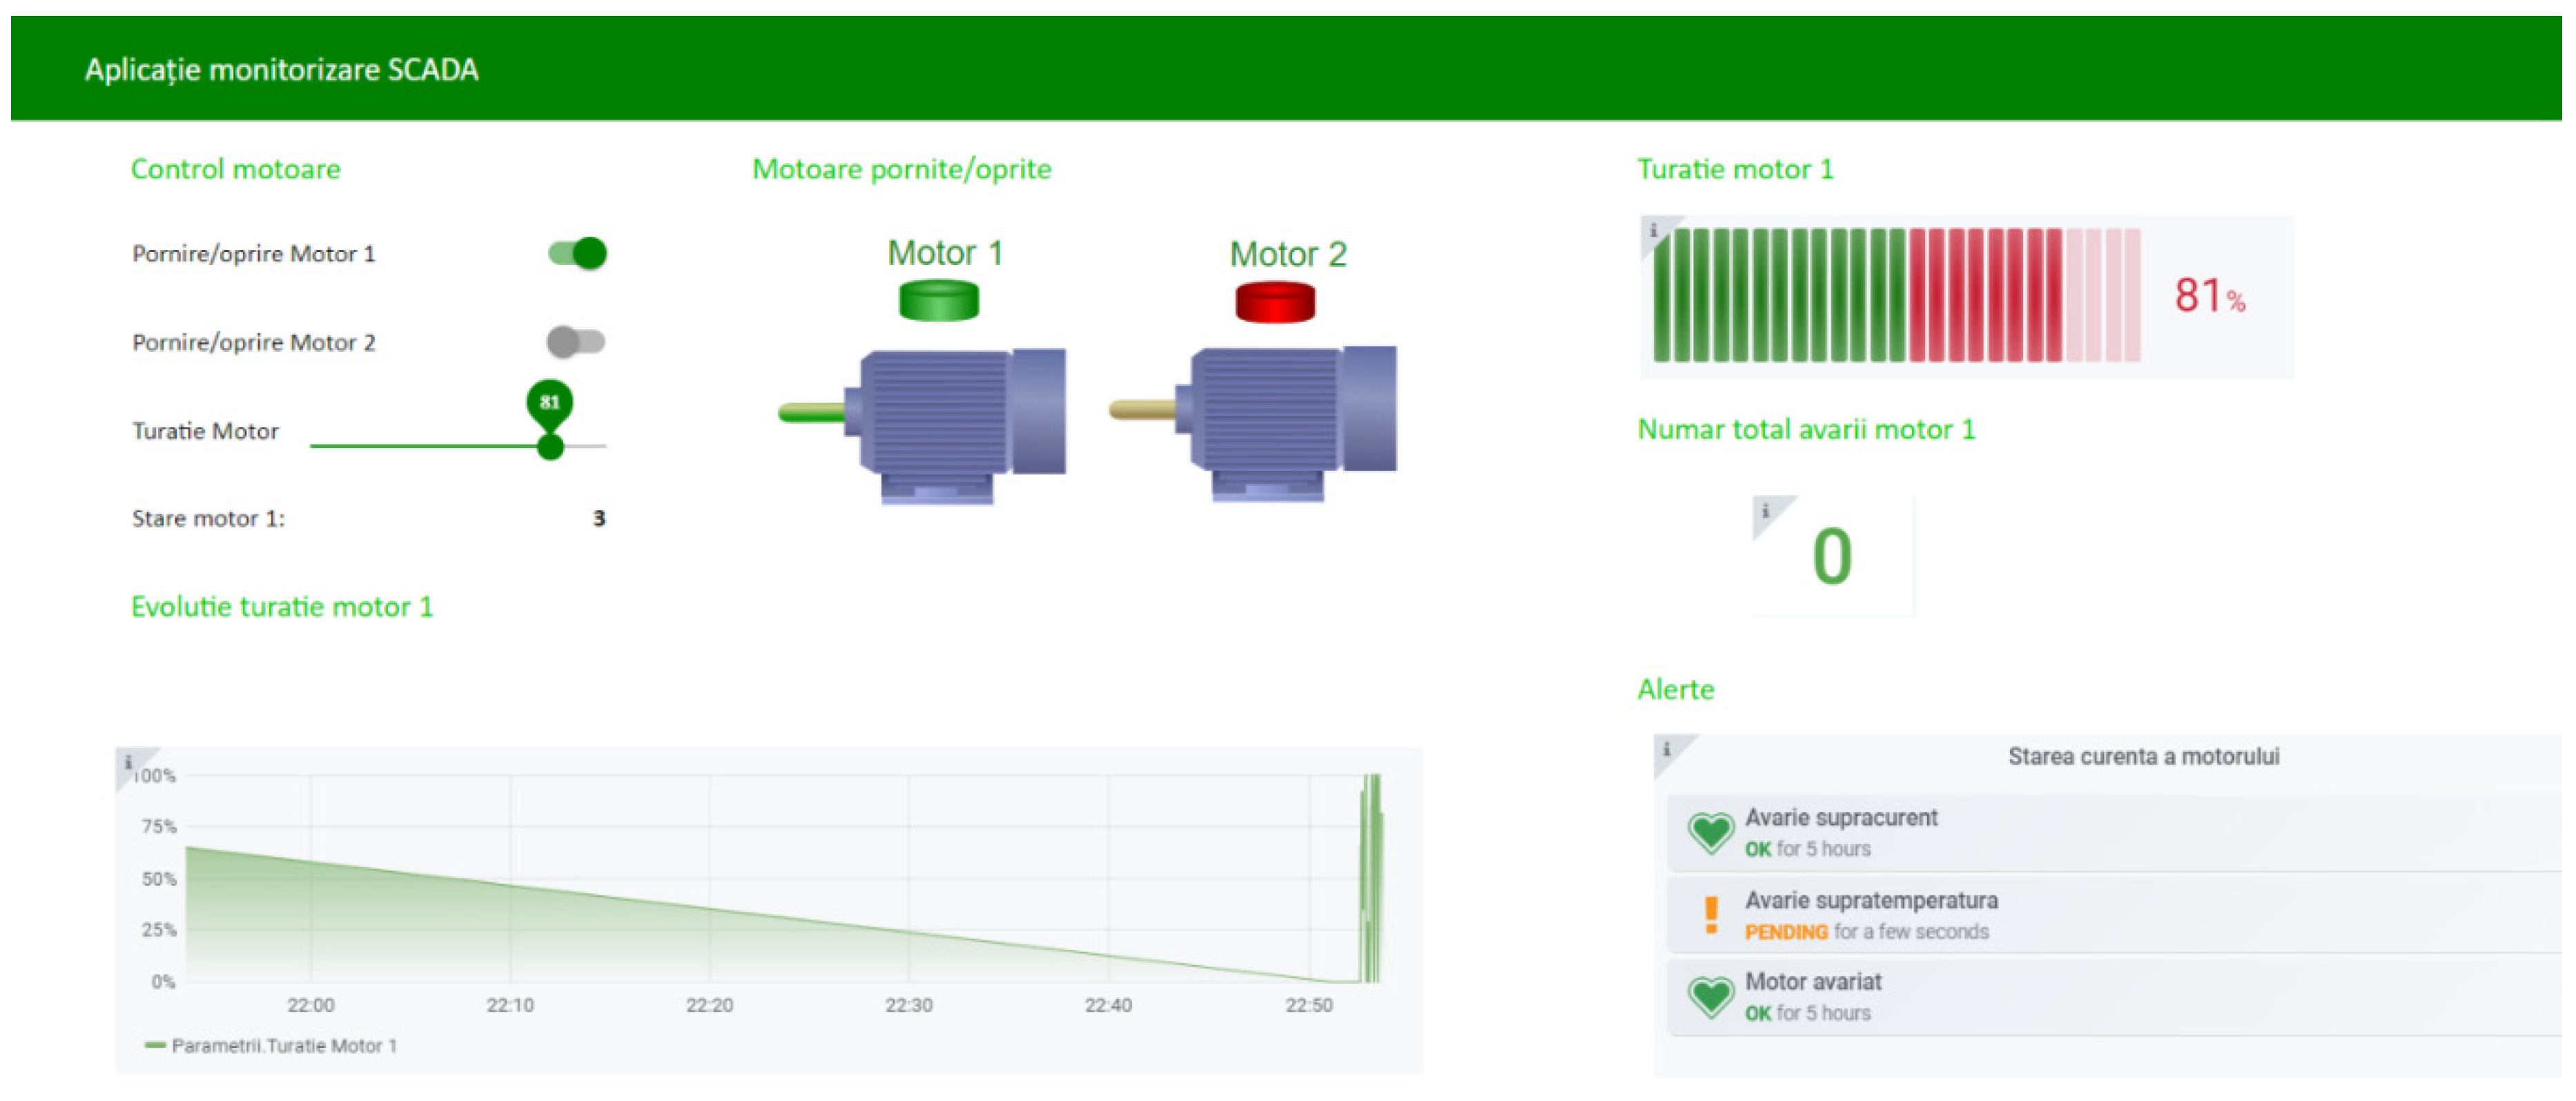
As enacted in Figure 5, it is observable that the running motor is motor 1, its revving is set to 81%, all of these being updated in real-time on the SVG model, alongside the imported panels. The real-time nature of the application allows for a precise monitoring of the information that circulates through the network.
Figure 6 displays the holding registers attributed to the logic of the functioning program and implicitly the value contained by them. At the address 40,001 is the speed of motor 1, 40,003 contains the on state for motor 1 and 40,007 holds the current state of the motor, which is determined accordingly by framing the speed percentage in an interval. The logic for establishing the state is detailed in Section 2 of this paper.
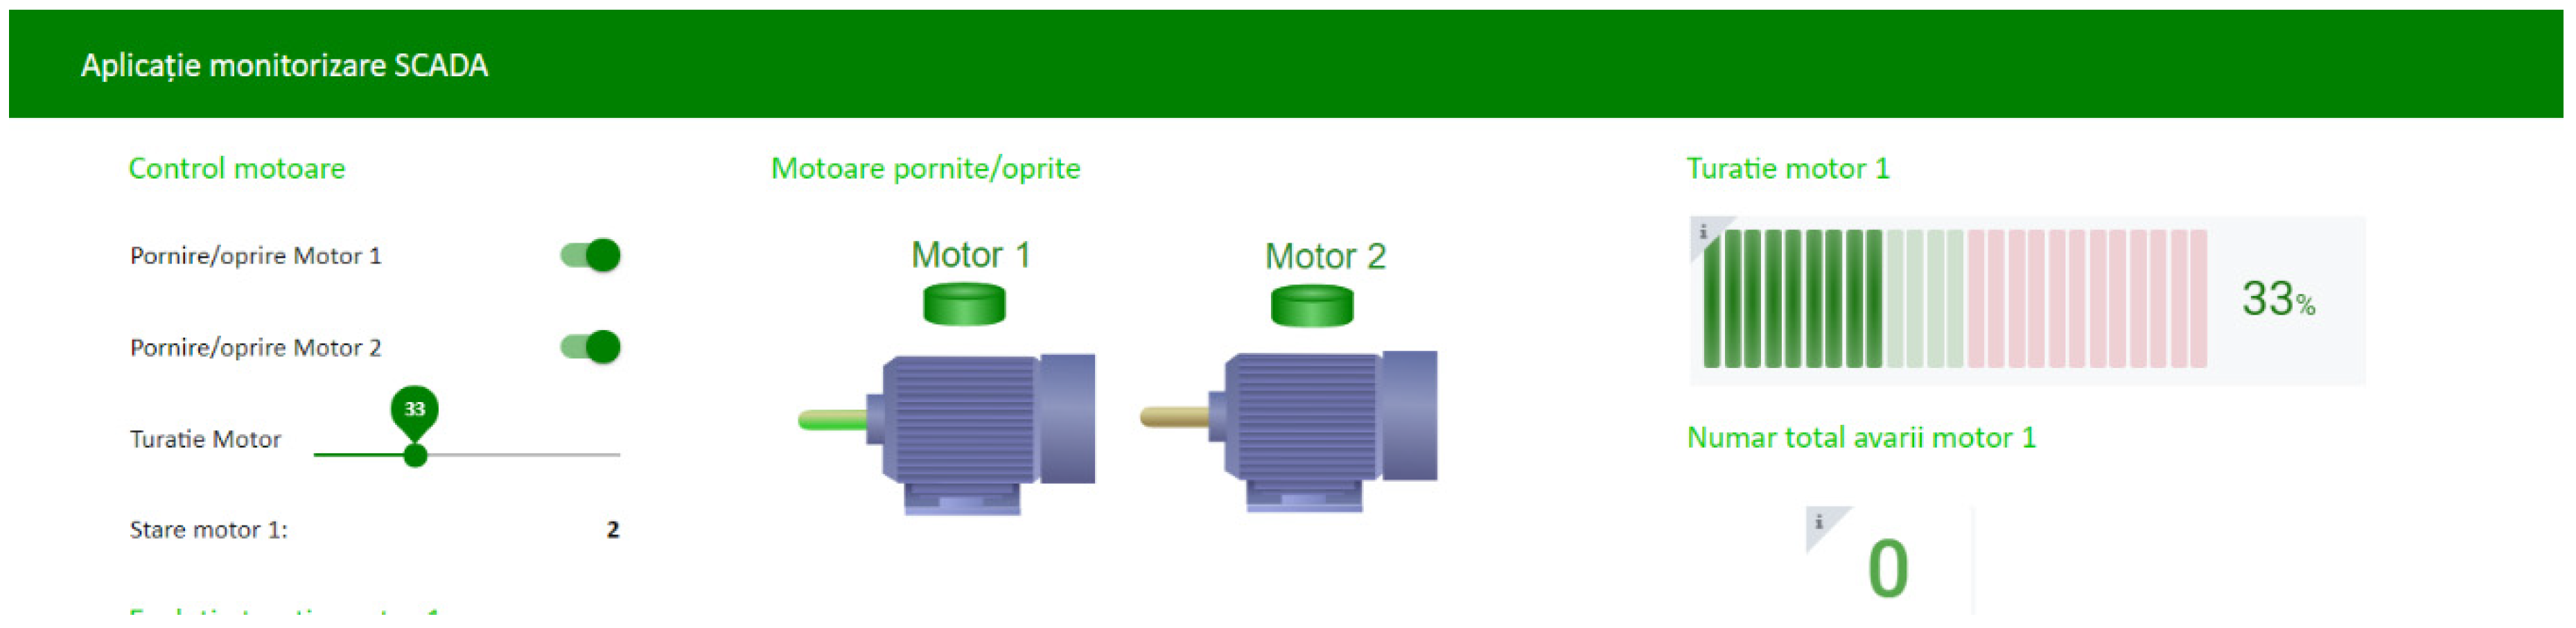
The MQTT.fx application was used to emulate an MQTT client which published the value 33% in the topic elected to represent the revving of motor 1. Since Node-RED is subscribed to this topic through a certain node, it makes this part of the project a client as well, thus the broker provides the messages to it also. As a result of publishing the message (published value 33), the change occurred at the level of the dashboard, as can be observed in Figure 7.
3.2. Accessing the Node-RED Dashboard on a Mobile Device
3.3. Testing Using MQTTClient for iOS
The MQTT Client configuration consists of setting the IP address that belongs to the broker, the port number 1883 and the quality of service (QoS). The desired result is publishing the set message, so it reaches the holding registers and ultimately the dashboard. In Figure 10, we can discern the consequence of publishing the desired message to the specific topic, the broker redirecting the information to the subscribed client, in this case being the Node-RED application, which updates the graphic elements to correspond to the read values.
4. Discussion and Conclusions
The proposed experimental model solution depicts a low-cost, highly customizable, platform-independent, modular, web-based SCADA platform. The SCADA platform is conceived and built based on IIoT/IoT concepts in the Industry 4.0 era. The Node-RED environment allows us to tailor and augment the platform following an open-source and modular vision. The paper depicts the development of SCADA features to efficiently supervise processes, in the context of modern approaches. Modbus TCP and MQTT protocols are implemented to interface the local PLCs and for higher level interfacing, respectively. The InfluxDB time-series database is used. The Grafana tool is used to improve process supervision within the operator dashboard, and together with the generation of animated symbols, the visual experience is lifted towards SCADA standards.
Succeeding the execution of the previously described experiments, the acquired results were in line with the supposed expectations, namely the communication is performed in a brief amount of time, close to instantly, the data being transmitted in an integral and rapid manner between the entities that form the IoT network.
The main concern is represented by fast data transmission in its integrity, both by Modbus TCP/IP and MQTT protocols. Tracing this trivial aspect, the aim was to monitor the necessary time for interception of information.
For testing the rapidity of data transmission through devices that publish messages to the broker, as seen in the experiments before, different values were deployed. These messages had a distinct QoS, meaning the acknowledgement for the traffic created had a disparent outcome when it comes to bandwidth usage. The results are shown in Table 1.
In both publishing cases, since MQTT is a lightweight protocol that facilitates data transmission, we can observe that the bandwidth usage has very low values, ultimately making it suitable for IoT networks. QoS 1 assures that the message is sent at least once and continuously stores and resends it until a PUBACK packet is received, thus being the most consuming out of the three options. QoS 2 establishes a four-part handshake between the sender and the receiver, making it the safest, yet the slowest regarding latency and the quality of service level.
In order to verify the efficiency of the Application Programming Interface (API), which in our case is represented by Grafana, the panels imported in the dashboard of the SCADA application will be inspected to obtain the values for network usage, precisely the size and transmission time for each query.
Table 2 depicts information regarding the imports, more accurately the exact sizes and execution time for the queries and visualization panels implemented in Grafana. As it can be observed, the sizes relative to time determine a ratio that sustains the coherence of the monitoring fragment specific to the final ensemble. Analyzing these acquired values, the access time is satisfactory for the size of the provided graphical element, contributing to the real-time nature of the application, as these queries materialize almost instantly.
The development potential of this actual project is of significant magnitude as multiple implementations can be addressed in different areas of interest for the IoT domain. Since this paper utterly consists of a concept for solving certain requirements of the IoT sphere of development, future new integrations of hardware components are a possible option, further multiplying the functionalities imposed by this SCADA application. The flows will be exposed and continuously extended so that a complete all-around SCADA application will be available. The Node-RED-based SCADA solution will be augmented with various features that are present in appreciated SCADA solutions as Ignition, IGSS, etc.
As the main purpose was to define a specific communication IoT network on which the entities rely, the emphasis was not the security of data transmission. Due to the fact that data authenticity is a key element in this communication process, additionally we can implement a secure authentication based either on a Secure Sockets Layer (SSL) certificate or utilizing a username and password system to ensure the origins of the information. Other extension possibilities include the insertion of artificial intelligence algorithms to provide an intelligent automation of systems and processes, as well as complete integration of the database in a cloud service.
Internet of Things represents a positive impact in the automation field, as its exponential growth marked the utility of interconnectivity and consolidated the ideology of digital transformation. As connected solutions provide the potential to adequately expand the availability of information, they satisfy a set of given requirements that transformed industries, regardless of their focal point, allowing for the widespread application of these new standards and technical specifications.
The Node-RED approach followed through in this paper constitutes an actual solution for the shortcomings of current SCADA systems utilized in the industry. As indicated in Section 3, Node-RED allows for platform-independent SCADA implementation, as it can be integrated on multiple devices, hence providing an efficient monitoring medium that can be accessed remotely. By interconnecting software nodes of the network through the aforementioned lightweight protocol, MQTT, it allows for fast data transmissions and real-time operations that assure low bandwidth usage and power consumption. The communication that occurs between the emulated hardware components and the previously specified IoT platform is executed in a rapid manner, data integrity being granted by the Modbus TCP/IP transfer protocol.
The modules implemented ensure the modular aspect of the final result, by allowing reutilization of the defined elements. The highly customizable characteristic is provided by the capacity of wiring together APIs and online services through a multitude of nodes that permit scripting. The Grafana tool contributes to creating a complex monitoring context, queries being executed periodically on the specified database to acquire newly logged data, facilitating visualization and analytics. Utilization of a time-series-based database compared to a SQL relational one computes a more efficient solution for accessing and logging data.
The open source software and tools maintain a low-cost aspect of the final result. As mentioned in Section 1, a legacy SCADA software that can design industrial applications can reach a costly finality, in spite of the multiple already integrated SCADA features. A usual decent SCADA solution for a medium-size redundant control center implies around 20,000–40,000 Euros only for software licensing, depending on the SCADA software. The vast majority of SCADA solutions depend on a Microsoft platform and are fixed configuration solutions. The Node-RED solution provides a low-cost method of implementing a highly customizable SCADA application, integrated in the IoT domain.
Legacy SCADA software is generally rigid regarding features and development (regardless of Ignition SCADA and very few others). The available reduced size scripting is the only way that the developer can interfere in augmenting some parts of the functionalities in a small manner. The authors encountered SCADA solutions that were significantly slowed down after adding some basic scripting. The scripting is generally viewed as to be avoided. One reason in the traditional view would be that scripting cannot be charged directly to the customer by the big producing companies. Some solutions allow some scripting on the developing screens, so that after some inserted functions, the screen data cannot be followed. Additionally, some traditional SCADA solutions are seeing modularity only as a perspective of licensing. Regarding web-based development and fast web-based deployments, only a few SCADA systems provide this feature, and generally web services are not seen from the perspective known by a programmer.
Traditional SCADA software environments do not provide the ability to implement new modules and they are not open source. This is a very important issue from many perspectives, e.g., OPC UA new specifications implement the publish-subscribe mechanism. The new OPC UA mechanism requires a transport protocol (e.g., UDP, MQTT). No SCADA software allows the generation of a new interface or augmenting a new interface according to needs (e.g., Ignition uses Sparkplug B with MQTT for publish-subscribe, but Sparkplug B is far from being known in Europe). Regarding MQTT protocol, very few SCADA solution are able to interface with MQTT. So, the expanding protocol would not be used in many traditional SCADA systems. The proposed platform is able to generate, unify, augment, any of the available modules, and contains a large variety of nodes (e.g., MQTT, OPC UA, Sparkplug B, etc.).
The databases generally do not provide many options when buying a traditional SCADA solution. There are gradual developments in improving the database connection, but many of the systems come with a native database that in some cases is an old technology. Some systems have recently moved towards SQL-based databases, e.g., the InfluxDB time-series database is not usable in most traditional SCADA software. There are situations where the additional database connection is provided as option, but the authors encountered situations where the non-native database usage derived in exceptions or errors. There are solutions were an SQL-based database is not accessible for external clients, with only the SCADA software being able to read all values. The proposed solution provides connections with various databases, both relational or time-series databases. The data manipulation from databases after logging and archiving implies difficulties in some cases. Due to the imposed forms and fixed data manipulation solutions, available in many traditional SCADA solutions for logging and archiving, the authors encountered many situations where after longer data accumulation, a query to extract a graphical representation is long-lasting. There are no such problems in the current context, where database manipulation and graphical representation are realized using modern and lightweight solutions.
The proposed solution is platform-independent, and therefore it can be implemented on low-cost hardware for smaller systems, and also, the clients can run on mobile devices. Traditional SCADA solutions (with few exceptions) are dependent on Windows platform and most of them do not allow mobile clients as independent developments.
To conclude, the proposed topic conceptualizes the optimization of processes and monitoring mediums through IoT networks, results that can be achieved by interconnecting physical and digital entities in a central main flow that manages the interaction between these devices, by introducing a monitoring SCADA environment that interfaces the interoperability of the components. The aim of this thematic is to provide a future framework for new implementations.
Author Contributions
Conceptualization, I.-V.N. and A.K.; methodology, I.-V.N.; software implementation, I.-V.N.; validation, I.-V.N.; writing—original draft preparation, I.-V.N.; writing—review and editing, A.K.; supervision, A.K. All authors have read and agreed to the published version of the manuscript.
Funding
This research received no external funding.
Conflicts of Interest
The authors declare no conflict of interest.
References
- Sisinni, E.; Saifullah, A.; Han, S.; Jennehag, U.; Gidlund, M. Industrial Internet of Things: Challenges, Opportunities, and Directions. IEEE Trans. Ind. Informatics 2018, 14, 4724–4734. [Google Scholar] [CrossRef]
- Perera, C.; Liu, C.H.; Jayawardena, S.; Chen, M. A Survey on Internet of Things from Industrial Market Perspective. IEEE Access 2014, 2, 1660–1679. [Google Scholar] [CrossRef]
- Porkodi, R.; Bhuvaneswari, V. The Internet of Things (IoT) Applications and Communication Enabling Technology Standards: An Overview. In Proceedings of the 2014 International Conference on Intelligent Computing Applications (ICICA), Coimbatore, India, 6–7 March 2014; pp. 324–329. [Google Scholar] [CrossRef]
- Jindal, F.; Jamar, R.; Churi, P. Future and Challenges of Internet of Things. Int. J. Comput. Sci. Inf. Technol. 2018, 10, 13–25. [Google Scholar] [CrossRef]
- Hassan, Q.F. Internet of Things A to Z: Technologies and Applications; Wiley-IEEE Press: Hoboken, NJ, USA, 2018. [Google Scholar]
- Xu, H.; Yu, W.; Griffith, D.; Golmie, N. A Survey on Industrial Internet of Things: A Cyber-Physical Systems Perspective. IEEE Access 2018, 6, 78238–78259. [Google Scholar] [CrossRef]
- Korodi, A.; Crisan, R.; Nicolae, A.; Silea, I. Industrial Internet of Things and Fog Computing to Reduce Energy Consumption in Drinking Water Facilities. Processes 2020, 8, 282. [Google Scholar] [CrossRef] [Green Version]
- Nicolae, A.; Korodi, A.; Silea, I. Identifying Data Dependencies as First Step to Obtain a Proactive Historian: Test Scenario in the Water Industry 4.0. Water 2019, 11, 1144. [Google Scholar] [CrossRef] [Green Version]
- Bloom, G.; Alsulami, B.; Nwafor, E.; Bertolotti, I.C. Design patterns for the industrial Internet of Things. In Proceedings of the 14th IEEE International Workshop on Factory Communication Systems (WFCS), Imperia, Italy, 13–15 June 2018. [Google Scholar]
- Bader, S.R.; Maleshkova, M. SOLIOT—Decentralized Data Control and Interactions for IoT. Future Internet 2020, 12, 105. [Google Scholar] [CrossRef]
- Sun, S.; Zheng, X.; Villalba-Díez, J.; Ordieres-Meré, J. Data Handling in Industry 4.0: Interoperability Based on Distributed Ledger Technology. Sensors 2020, 20, 3046. [Google Scholar] [CrossRef] [PubMed]
- Korodi, A.; Silea, A. Achieving Interoperability Using Low-Cost Middleware OPC UA Wrapping Structure. Case Study in the Water Industry. In Proceedings of the 15th IEEE International Conference on Industrial Informatics (INDIN), Emden, Germany, 24–26 July 2017; pp. 1223–1228. [Google Scholar]
- Toc, S.I.; Korodi, A. Modbus-OPC UA Wrapper using Node-RED and IoT-2040 with application in the water industry. In Proceedings of the 16th IEEE International Symposium on Intelligent Systems and Informatics (SISY), Subotica, Serbia, 13–15 September 2018. [Google Scholar]
- Godoy, A.J.C.; Pérez, I.G. Integration of Sensor and Actuator Networks and the SCADA System to Promote the Migration of the Legacy Flexible Manufacturing System towards the Industry 4.0 Concept. J. Sens. Actuator Netw. 2018, 7, 23. [Google Scholar] [CrossRef] [Green Version]
- Gutierrez-Guerrero, J.M.; Holgado-Terriza, J.A. Automatic Configuration of OPC UA for Industrial Internet of Things Environments. Electronics 2019, 8, 600. [Google Scholar] [CrossRef] [Green Version]
- Ala-Laurinaho, R.; Autiosalo, J.; Tammi, K. Open Sensor Manager for IIoT. J. Sens. Actuator Netw. 2020, 9, 30. [Google Scholar] [CrossRef]
- Blanco-Novoa, O.; Fraga-Lamas, P.; Vilar-Montesinos, M.A.; Fernández-Caramés, T.M. Creating the Internet of Augmented Things: An Open-Source Framework to Make IoT Devices and Augmented and Mixed Reality Systems Talk to Each Other. Sensors 2020, 20, 3328. [Google Scholar] [CrossRef] [PubMed]
- Ul Mehmood, M.; Ulasyar, A.; Khattak, A.; Imran, K.; Sheh Zad, H.; Nisar, S. Cloud Based IoT Solution for Fault Detection and Localization in Power Distribution Systems. Energies 2020, 13, 2686. [Google Scholar] [CrossRef]
- Jaloudi, S. Communication Protocols of an Industrial Internet of Things Environment: A Comparative Study. Future Internet 2019, 11, 66. [Google Scholar] [CrossRef] [Green Version]
Figure 1.
The architecture of the project proposed as a case study.
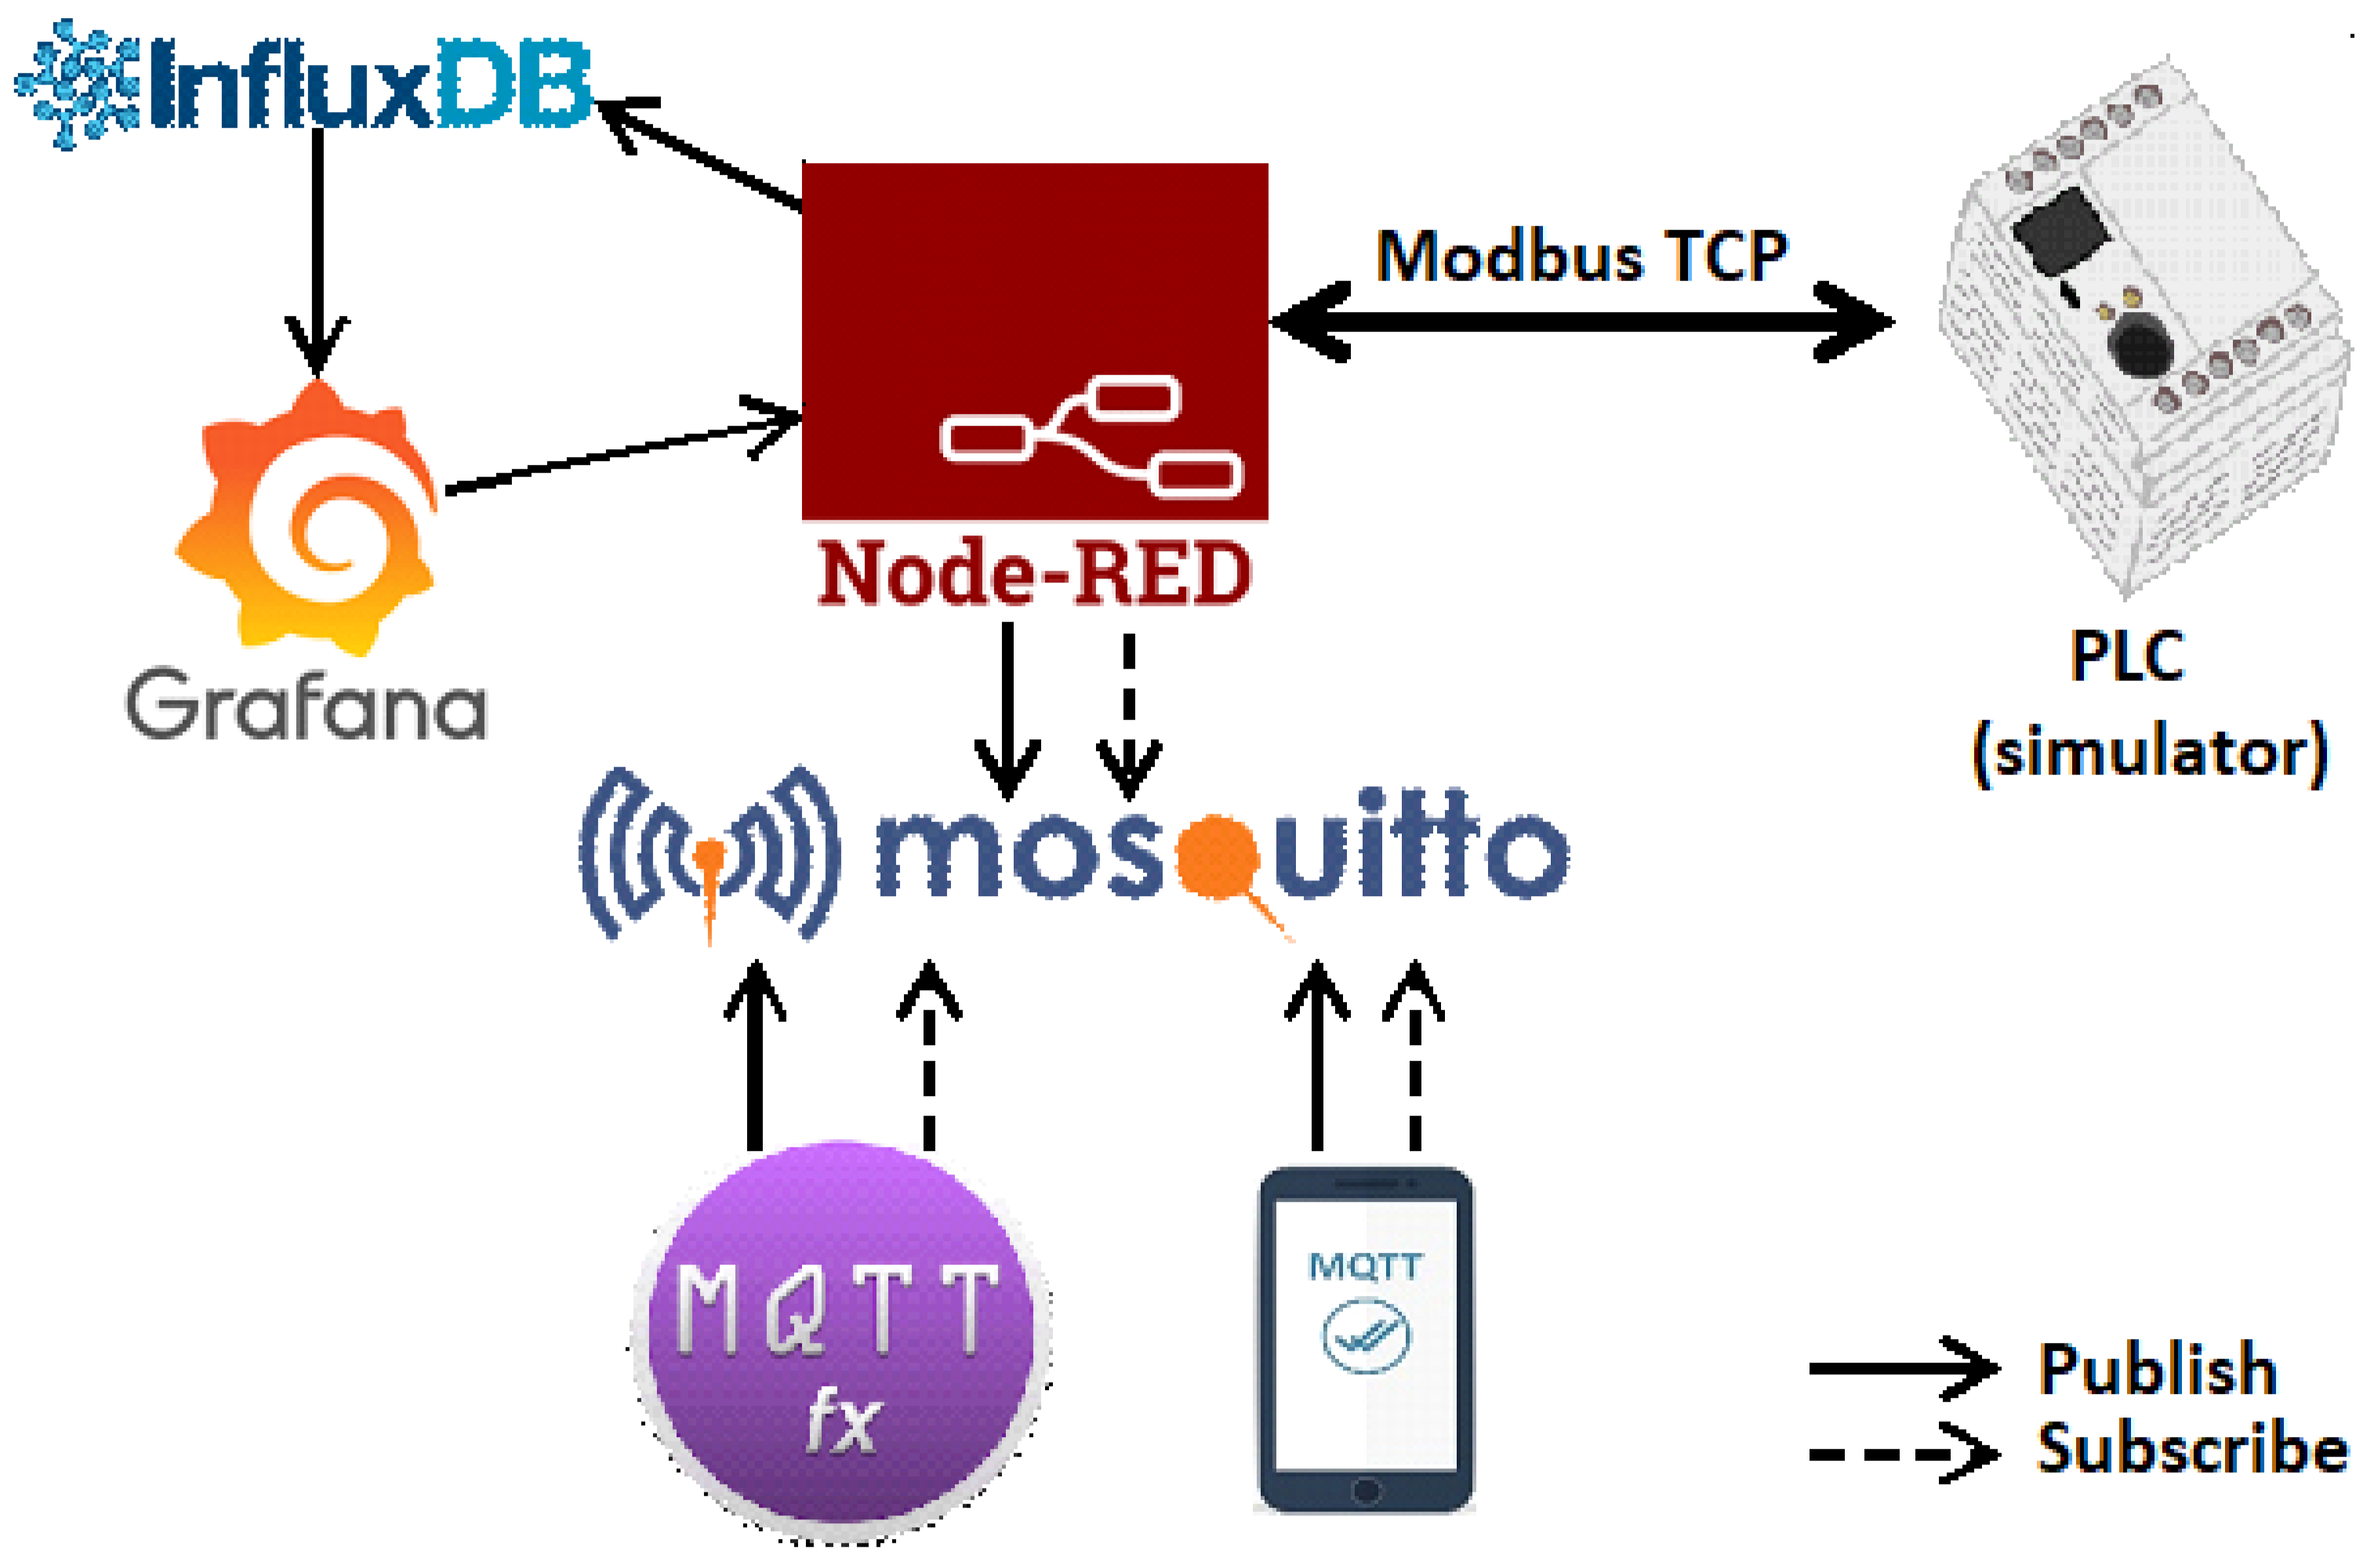
Figure 2.
Sub-flow for reading, processing and inserting data into the database.

Figure 3.
Sub-flow for importing Grafana panels.
Figure 4.
Main flow of the application.

Figure 5.
Completion of the steps mentioned above.

Figure 6.
Holding registers of the Modbus TCP/IP simulator.

Figure 7.
Dashboard after publishing a message through MQTT.fx.

Figure 8.
Accessing the Node-RED application on a mobile device.

Figure 9.
Motor 2 is switched on from a mobile device.

Figure 10.
Dashboard after publishing a message through MQTTClient.


Table 1.
Contains bandwidth usage for quality of service 0, 1 in regard to the test cases mentioned in Section 3.
Table 1.
Contains bandwidth usage for quality of service 0, 1 in regard to the test cases mentioned in Section 3.
| Client | Bandwidth Usage |
|---|---|
| MQTT.fx with QoS 0 | 0.1 mbps |
| MQTTClient iOS with QoS 1 | 0.1 mbps |
Table 2.
Contains main queries executed through the Grafana API and the size of the transmitted data, as well as the necessary conveyance time.
Table 2.
Contains main queries executed through the Grafana API and the size of the transmitted data, as well as the necessary conveyance time.
| Query | Size | Time |
|---|---|---|
| Motor 1 revving graph | 27.3 kB | 45 ms |
| Motor 1 revving widget | 27.3 kB | 63 ms |
| Alerts panel | 1.1 kB | 5 ms |
| Total number of occurring damages | 27.7 kB | 67 ms |
© 2020 by the authors. Licensee MDPI, Basel, Switzerland. This article is an open access article distributed under the terms and conditions of the Creative Commons Attribution (CC BY) license (http://creativecommons.org/licenses/by/4.0/).
Share and Cite
MDPI and ACS Style
Nițulescu, I.-V.; Korodi, A. Supervisory Control and Data Acquisition Approach in Node-RED: Application and Discussions. IoT 2020, 1, 76-91. https://doi.org/10.3390/iot1010005
AMA Style
Nițulescu I-V, Korodi A. Supervisory Control and Data Acquisition Approach in Node-RED: Application and Discussions. IoT. 2020; 1(1):76-91. https://doi.org/10.3390/iot1010005
Chicago/Turabian StyleNițulescu, Ioana-Victoria, and Adrian Korodi. 2020. "Supervisory Control and Data Acquisition Approach in Node-RED: Application and Discussions" IoT 1, no. 1: 76-91. https://doi.org/10.3390/iot1010005