Article

Glycoproteomic and Lipidomic Characterization of Industrially Produced Whey Protein Phospholipid Concentrate with Emphasis on Antimicrobial Xanthine Oxidase, Oxylipins and Small Milk Fat Globules

1
Department of Food Science and Technology, University of California, Davis, One Shields Avenue, Davis, CA 95616, USA
2
Foods for Health Institute, University of California, Davis, One Shields Avenue, Davis, CA 95616, USA
*
Author to whom correspondence should be addressed.
Dairy 2022, 3(2), 277-302; https://doi.org/10.3390/dairy3020022
Submission received: 7 January 2022 / Revised: 22 March 2022 / Accepted: 25 March 2022 / Published: 20 April 2022

Abstract

:
This work investigates the composition of whey protein phospholipid concentrate (WPPC), an underutilized dairy stream, and reveals that it is a source of many bioactive compounds that can benefit the immune system and gut health. Our glycoproteomics approach uncovered that proteins derived from the milk fat globule membrane (MFGM) represent 23% of the total protein relative abundance and identified 85 N-glycans. Released sialic acid, an additional marker of glycosylation, ranged from 1.2 to 2% of the total weight. Xanthine oxidase, a glycosylated marker of MFG bioactivity, was found in high abundance and displayed higher antimicrobial activity than bovine milk, despite its similar fat and solids content. An average MFG diameter of 2.64 ± 0.01 µm was found in liquid WPPC, compared to 4.78 ± 0.13 µm in bovine milk, which likely explains the unusually high presence of glycosylated membrane-bound proteins and phospholipids, whose total fatty acids accounted for 20% of the WPPC total fatty acid pool. Free and bound oxylipins (mainly derived from linoleic acid) were also identified, together with other less abundant anti-inflammatory lipid mediators derived from eicosapentaenoic acid and docosahexaenoic acid. Our study demonstrates that WPPC represents a promising starting material for bioactive compound extraction and a functional vehicle for the delivery of small MFGs.

1. Introduction

Milk is a complex biofluid with a unique composition that makes it optimal for newborn growth and development [1]. Milk contains a diverse set of bioactive components and nutrients with the potential to modulate gut microbial populations, promote healthy gut development, and reduce inflammation linked to dysbiosis [2,3,4]. Among this diverse set of bioactive components and nutrients, milk fat globules (MFGs) act as a unique delivery system for biologically active molecules in the gastrointestinal tract [5,6,7]. MFGs range in size from 0.2 to 15 μm and have an average diameter of ~4 μm, depending on cow breed, lactation time, and season [8,9]. MFGs are naturally occurring lipid droplets consisting of a triglyceride core and a three-layer natural biological membrane, called the milk fat globule membrane (MFGM), which originates from the mammary gland epithelium [10]. The unique macrostructure and biochemical assembly of MFGs distinguish them from simpler plant-derived oils [11]. The MFGM has a complex structure comprised of about 40% lipids (e.g., phospholipids) and 60% proteins (e.g., glycoproteins) [5,12]. MFGM proteins contribute 1–2% of the total protein content in bovine milk [13].
The MFG has several demonstrated health benefits, including supporting brain development, pathogen deflection, modulation of the host immune system, and acting as a potential delivery system for probiotics [14,15,16]. The protective mechanisms associated with the MFG are thought to be related to its membrane’s unique protein and lipid composition. For example, xanthine oxidase, the second most abundant protein component of MFGM [17], exemplifies a complex mechanism for providing antimicrobial protection to mammalian newborns [18,19]. There are several other bioactive proteins embedded in the MFGM, including butyrophilin, glycosylation-dependent cell adhesion molecule 1 (GLYCAM-1), mucin 1 and 15, lactadherin (also known as globule epidermal growth factor 8 protein (MFG-E8; PAS VI/VII)), adipophilin (also known as perilipin 2), fatty acid-binding protein heart, polymeric immunoglobulin receptor, and platelet glycoprotein 4 (also known as cluster of differentiation 36, CD36). The lipid fraction of the MFGM is mainly composed of polar phospholipids.
While the beneficial effects of dairy polar lipids on cardiovascular function were first shown in animal models [20] and clinical trials [21], additional activities in maintaining hepatic function [22,23], protecting against gastrointestinal infection [24], inflammation, and anti-thrombotics [25,26], and preventing tumor growth [27] were also demonstrated. Notably, dietary phospholipid or phospholipid supplements improve cognitive function in aging animals [28] and elderly humans [29,30]. Additional benefits have also been shown in animal models [31] and human studies [32,33] for early brain development. In addition, bioactive lipid mediators derived from lipid oxidation, known as oxylipins, can play a role in regulating in vivo inflammation [34,35].
It is known that some dairy streams contain MFGM, but the content and physical structure of the MFGM is differentially preserved among dairy products [7,36]. For example, cream contains twice as much MFGM as butter per gram of fat, while butter has a relatively low MFGM content, as most of the MFGM is transferred to the buttermilk fraction with the churning process [36]. Cheese whey, the co-product of cheesemaking, is also considered a potential source of MFGM, since it contains some residual fat that is left after the classical centrifugal separation of whey cream from the whey feed. Initially, whey was considered as a waste product, and its accumulation represented a serious environmental problem due to its high organic content and high biochemical oxygen demand (BOD). Because of this, the dairy industry was not allowed to dispose of whey conventionally, and additional treatment steps to reduce the pollution index were required, with unavoidable associated costs [37]. The use of membrane separation processes represented a breakthrough in whey processing and valorization [38]. In particular, ultrafiltration, a pressure-driven membrane separation process, is now a widely-adopted process used commercially to recover whey protein concentrate (WPC). This membrane process enables the recovery of whey proteins and residual fat in the retentate, whereas lactose and minerals are separated in the by-product known as permeate (Figure 1). Consumers’ desire for products with higher-purity whey proteins and lower in fat drove further process improvements from the manufacture of conventional WPC (with protein content in the range of 35–80%) into higher purity protein, namely whey protein isolate (WPI, protein content > 90%). During the manufacturing of WPI, WPC is microfiltered, and this process separates the majority of the whey proteins from the residual fat. As a consequence, there has been a significant accumulation of a co-product known as whey protein phospholipid concentrate (WPPC) [39]. The dramatic increase in WPI production has resulted in parallel accumulation of WPPC and calls for the identification of suitable avenues for its valorization [40].
The dairy industry currently underutilizes WPPC, which represents 14 to 18% of the whey processed, estimating 30–35 × 106 ton/year worldwide [40,41]. This co-product lacks standardization, and it is known under several commercial trade names in the industry, such as PRO-Cream, Salibra® 700, and Whey Cream [40]. Commercial WPPC products vary widely in chemical composition, yet they all contain protein, fat, lactose, and minerals as the main ingredients [40]. The American Dairy Products Institute (ADPI) recently proposed a marketing standard sheet for WPPC, which states that WPPC should contain a minimum of 50% protein (dry basis), consisting primarily of whey protein, and 12% fat dry basis) (ADPI, 2020). Although the gross composition of WPPC is known, a detailed characterization of WPPC remains to be conducted, and the economic and nutritional value has yet to be explored. As the residual fat in the whey accumulates in WPPC during the manufacture of WPI, we hypothesized that WPPC may serve as an ideal source for recovering valuable smaller MFG and thus MFGM. This may represent an opportunity to leveraging MFGM functionality, investigate its broader health implications, and guide the development of innovations that go beyond the traditional vision of dairy components used for nutritional purposes, but that will rather focus on improving human health. The goal of this study is to characterize the composition of bioactive compounds in WPPC through a combination of glycoproteomic and lipidomic analyses.

2. Materials and Methods

2.1. Samples and Chemicals

The whey protein phospholipid concentrate (WPPC) used in this study was kindly supplied by multiple dairy companies, either in powder or liquid form (Joseph Gallo Farms (Atwater, CA, USA), Milk Specialties (Eden Prairie, MN, USA), Glanbia Nutritionals (Fitchburg, WI, USA), Hilmar Ingredients (Hilmar, CA, USA), Leprino Foods (Denver, CO, USA), and Agropur Inc. (Appleton, WI, USA). Each sample was assigned an alphanumeric or numeric code, and the samples with the same number and different letters were from the same producer as 1, 1A, 1B, 2, 3A, 3B, 4A, 4B, 5, 6A, and 6B. Figure 1 presents the overall schematic process for the manufacture of whey protein concentrate and isolate, which results in the accumulation of WPPC. Bovine milk was obtained from the UC Davis dairy farm (Davis, CA, USA) and stored at −20 °C. Xanthine was purchased from Sigma-Aldrich (St. Louis, MO, USA), ethylenediaminetetraacetic acid (EDTA) was from ThermoFisher Scientific Inc., (Waltham, MA, USA), trifluoroacetic acid (TFA) was from Sigma Aldrich (St. Louis, MO, USA), dithiothreitol (DTT) was from ACROS Organics (Morris Plains, NJ, USA), and Bio-Safe Coomassie G-250 stain and Laemmli sample buffer were from Bio-Rad Laboratories (Hercules, CA, USA). Oxylipin standards were obtained from Cayman Chemical (Ann Arbor, MI, USA) or Larodan (Solna, Sweden). Lipid standards were from Nucheck Prep or Avanti Polar Lipids.

2.2. Selection of Samples for Specific Analyses

We first screened the gross composition of WPPC by measuring its total protein, fat, solids as well as protein profile by SDS PAGE and the milk fat globules’ size, to obtain a general understanding of the dataset. Because there were compositional variations in between WPPC samples, representative samples for the liquid and powder samples were selected and used for more in-depth analysis. Specifically, we selected a liquid sample (6B, see Table 1) for the measurement of the MFGM and xanthine oxidase activity before the product was exposed to thermal drying. The selection was based on the idea of performing a direct comparison of liquid WPPC with bovine milk, which has a similar content of fat and total solids, and so we could evaluate the degree to which xanthine oxidase and small MFG are enriched in WPPC production. Subsequently, we performed targeted proteomics on the xanthine oxidase band to confirm its identity, since the molecular weight of xanthine oxidase is similar to that of immunoglobulins (140 kDa and 150 kDa, respectively), and the SDS PAGE alone could not provide a defined identification. Upon confirming that xanthine oxidase was the predominant protein in the gel band, we continued to use sample 6B for the remaining proteomic analyses to identify and measure relative quantities of key MFGM glycosylated proteins in WPPC. Because a direct method to quantify MFGM does not currently exist, we then enzymatically released N-linked glycans from the said proteins and also quantified the total sialic acid as an additional marker of glycosylation. For that analysis, we decided to focus on sample 1 because commercial WPPC is in powder form and has the highest lipid among the powder samples (see Table 1), and therefore a higher milk fat globule membrane content, because glycans are located on the proteins attached to the milk fat globule membrane. Finally, we profiled lipids in sample 1 (see Table 1) because, again, it had the highest fat content, and we wanted to maximize our chances of identifying low abundant compounds, such as oxylipins; specifically, we measured (1) total fatty acids and cholesterol concentrations, (2) fatty acids within various phospholipids and sphingomyelin (SM), and (3) total (i.e., mostly esterified) and free oxylipins.

2.3. Compositional Analysis of Whey Protein Phospholipid Concentrate (WPPC) and Bovine Milk

The dairy companies provided the product specification sheets that included most of the values for total protein, fat, and total solids for the WPPC samples and we measured total protein and fat in raw bovine milk for comparison, according to standard AOAC methods [42]. Measurements were performed in triplicate.

2.4. Identification of Proteins in WPPC and Comparison with WPI by SDS-PAGE

The proteins in all WPPC samples were separated by sodium dodecyl sulfate-polyacrylamide gel electrophoresis (SDS-PAGE). Each sample was normalized to 20 µg of protein and combined with 6.65 µL 4× Laemmli sample buffer and 2.75 µL 1 M dithiothreitol (DTT). Samples were incubated at 95 °C for 5 min. Each sample mixture (20 µL) was then loaded onto a 12% acrylamide gel (12-well comb), and proteins were separated using 200 V. Precision Plus Protein Standard was used as a positive control. Gel was stained with Coomassie blue. All the major protein lanes for the WPPC samples were excised with a razor and placed into microcentrifuge tubes and saved for proteomic analysis. After having analyzed the protein profile of the whole dataset, representative samples for the liquid and powder samples were selected and used for more in-depth analysis.

2.5. In-Gel Digestion and Proteomics

Proteins bands from sample 6B were de-stained and digested with trypsin according to commonly used proteomic protocols [43]. Briefly, each gel piece was de-stained by washing with 50% acetonitrile (ACN) containing 12.5 mM NH4HCO3, followed by a water wash. Gel pieces were dehydrated with acetonitrile and dried in a vacuum centrifuge. Disulfide bonds were cleaved and methylated by adding 100 µL 10 mM DTT to each gel piece and incubating at 55 °C for 45 min, followed by 100 µL 55 mM iodoacetamide with a 30 min room temperature incubation. The gel pieces were further washed with 50% ACN containing 25 mM NH4HCO3, dehydrated with ACN, and dried in a vacuum centrifuge. To digest the proteins into peptides, 150 µL of a solution containing ~20 µg/mL trypsin was added to each gel piece, and the tubes were incubated on ice for 1 h to ensure the enzyme’s access into the gel. The excess enzyme solution was then removed and replaced with 200 µL 25 mM NH4HCO3, and the samples were incubated at 37 °C overnight for protein digestion. The liquid from each sample was transferred to a new tube, and the gel pieces were washed twice with 200 μL 50% ACN containing 1% trifluoroacetic acid (TFA). This peptide-containing solution was dried by centrifugal evaporation, and the resulting peptides were purified by C18 solid-phase extraction, as previously described [44]. Briefly, the C18 microplate was activated with 0.1% TFA in 99.9% ACN and equilibrated with 1% ACN/0.1% TFA in water. The peptides were loaded, washed with 6 column volumes 1% ACN/0.1% TFA in water, and eluted with 80% ACN/0.1% TFA in water. The purified peptide solutions were dried by centrifugal evaporation and re-dissolved in 2% ACN/0.1% TFA in water before analysis. The samples (roughly 3 µg per injection) were separated with a Waters Nano Acquity Ultra-High-Performance Liquid Chromatograph (UHPLC) with a Proxeon nanospray source. The chromatograph employed a 100 µm × 25 mm Magic C18 100 Å 5U guard column and a 75 µm × 150 mm Magic C18 200 Å 3U analytical column. Elution solvents were (A) 0.1% formic acid in water and (B) 100% ACN. A flow rate of 300 nL/min was used with a linear gradient of 5–35% B, 0–50 min; 35–80% B, 50–53 min; 80% B, 53–54 min; 80–5% B, 54–55 min; and 5% B, 55–60 min. After each sample run, the column was washed for 30 min. The eluted peptides were analyzed by an Orbitrap Q Exactive Plus mass spectrometer (ThermoFisher Scientific, Waltham, MA, USA). The data-dependent acquisition was used with 15 tandem (MS/MS) scans following each precursor (MS) scan. Dynamic exclusion was set to 20 s. MS spectra were collected with a resolution of 70,000 and a target of 106 ions or a maximum injection time of 30 milliseconds. For MS/MS spectra, a resolution of 17,500 was used with a target of 5 × 10⁴ ions or a maximum injection time of 50 milliseconds. Fragmentation was performed using higher-energy collision dissociation (HCD) with a normalized exclusion energy (NCE) value of 27. Ions with unassigned charges, charge +1, or charges above 5+ were excluded from fragmentation.

2.6. Proteomics Data Analysis

The raw files from the mass spectrometer were analyzed using the software Proteome Discoverer (ThermoFisher Scientific, Waltham, MA, USA) to identify the proteins from the tandem-MS data. The software referenced a library containing the bovine proteome (downloaded from uniprot.org (accessed on 10 May 2017)). The false discovery rate (FDR) was controlled at 1% for protein and peptide, with match-between-runs and second peptides enabled. The following search parameters were used: precursor and fragment mass tolerance at 10 ppm and 0.02 Da, respectively; fixed modifications (carbamidomethylation of cysteine); and variable modifications (phosphorylation of serine and threonine, oxidation of methionine, and deamidation of asparagine and glutamine). A maximum of two missed tryptic cleavages was allowed. Two or more peptides from a protein were required for protein identification. All protein identifications met a minimum p-value threshold of p < 0.05.

2.7. N-linked Glycans: Release from Glycoproteins and Analysis by Mass Spectrometry

N-linked glycans were harvested in duplicates from sample 1 (Table 1) following the protocol described in Karav et al. [45]. The WPPC powder was dissolved in Milli-Q (18.2 MΩ∙cm) water at a concentration of 40 g/L by thorough vortexing and bath sonication. A 450 µL aliquot of this WPPC solution was mixed with 50 µL 200 mM sodium hydrogen phosphate, pH 5. An endo-β-N-acetylglucosaminidase was acquired from GeneTarget Inc (San Diego, CA, USA) and added at a 1:500 enzyme:protein ratio, and the mixture was incubated overnight at 37 °C. The following morning, 3.5 mL cold ethanol was added to each vial, and the samples were incubated at −20 °C for 2 h. Precipitated proteins were collected by centrifugation at 4000× g for 10 min at 4 °C and the supernatant was dried by centrifugal evaporation. The N-glycans were re-dissolved in 500 µL of water and purified by microplate C18 solid-phase extraction. The microplate wells were activated with acetonitrile (ACN) and equilibrated with water. Samples were loaded, and each well was washed with three column volumes of water. All eluate generated during and after sample loading was collected and further purified by microplate graphitized carbon-solid-phase extraction. Each microplate well was activated with 80% ACN/0.1% trifluoroacetic acid (TFA) and equilibrated with water. Samples were loaded, and each well was washed with six column volumes of water. The N-glycans were then eluted with 3 column volumes of 40% ACN/0.1% TFA, dried by centrifugal evaporation, and re-dissolved in water prior to mass spectrometry analysis. N-glycans were analyzed by nano-liquid chromatographic-chip quadrupole time-of-flight mass spectrometry [45]. N-glycans separation was performed with a 65 min gradient delivered by the nanopump at a flow rate of 0.3 μL/min. The 65 min gradient used the following program: 0% B (0.0 to 2.5 min), 0 to 16% B (2.5 to 20.0 min), 16 to 44% B (20.0 to 30.0 min), 44 to 100% B (30.0 to 35.0 min), and 100% B (35.0 to 45.0 min). The gradient was followed by equilibration at 0% B (45.0 to 65.0 min). Data were acquired within the mass range of 450 to 3000 m/z for N-glycans in the positive ionization mode, with an acquisition rate of 1 spectrum/s for N-glycans. An internal calibrator ion of 922.010 m/z from the tuning mix (ESI-TOF tuning mix G1969-85000; Agilent Technologies) was used for continual mass calibration. For tandem MS analysis, N-glycans were fragmented with nitrogen as the collision gas. Spectra were acquired within the mass range of 100 to 3000 m/z. The collision energies corresponded to voltages (Vcollision) based on the following equation: Vcollision = m/z (1.5/100 Da) V − 3.6 V; the slope and offset of the voltages were set at 1.5/100 Da and −3.6, respectively. Acquisition was controlled by MassHunter workstation data acquisition software (Agilent Technologies, Santa Clara, CA, USA).

2.8. Sialic Acid Quantification

The total concentration of N-acetylneuraminic acid (NeuAc) in sample 1 was measured according to the methods of Hurum and Rohrer [46]. Briefly, the WPPC samples were mixed with 100 mM of sulfuric acid in a 1:1 ratio. The mixture was incubated at 80 °C for 1 h to hydrolyze the glycan-bound NeuAc. The tubes were centrifuged at 2000× g and 5 °C for 10 min to collect the solids, and the supernatants were purified with Dionex OnGuard II A 1 mL solid-phase extraction cartridges (ThermoFisher Scientific, Waltham, MA, USA). The cartridges were washed with 10 mL Milli-Q water prior to sample loading. After loading the samples, the cartridges were washed with an additional 10 mL Milli-Q water, and NeuAc was then eluted with 12 mL 50 mM NaCl. The samples were dried and re-dissolved in Milli-Q water. All samples were measured in duplicate. Total NeuAc was quantified using a high-performance anion-exchange chromatography system with pulsed amperometric detection (Thermo Scientific Dionex ICS-5000+), equipped with an electrochemical cell with a disposable gold working electrode and a pH-Ag/AgCl reference electrode. The chromatographic separation of NeuAc was carried out with a Dionex CarboPac PA20 analytical column (3 × 150 mm, Thermo Scientific) and a Dionex CarboPac PA20 guard column (3 × 30 mm, Thermo Scientific), with a solvent flow of 0.5 mL/min. Eluents consisted of water (A), 200 mM sodium hydroxide in water (B), and 500 mM sodium acetate in water (C). The samples were analyzed using a 20 min gradient with eluent B held isocratic at 50%. Eluent C was increased from 2–40% from 0–15 min, then held constant at 40% from 15–20 min. The column temperatures were 30 °C.

2.9. Determination of Xanthine Oxidase Activity in WPPC and Kinetic Parameters

The activity of xanthine oxidase in sample 6B and raw bovine milk was measured by spectrophotometry on a GENESYS 10S UV-Vis system (ThermoFisher Scientific, Waltham, MA, USA). The rate of oxidation of xanthine to uric acid was measured at 290 nm over 6 min, according to previously published protocols [47,48]. The enzymatic reaction was performed at 37 °C and pH 7.5 in a Tris-HCl buffer solution. Xanthine oxidase activity was determined using a final concentration of 2000 µM xanthine. The enzymatic reaction was terminated by the addition of 20% trichloroacetic acid. With xanthine as a reducing substrate, uric acid production was monitored as described above, by using a molar absorption coefficient (ε) of 1.22 mM−1cm−1. Measurements were performed in triplicate. Steady-state kinetic studies were conducted to determine the Michaelis–Menten kinetic model parameters, Vmax, and Km, for WPPC xanthine oxidase and xanthine oxidoreductase using GraphPad Prism 7.0 software with non-linear plotting techniques [49]. Xanthine oxidase kinetic parameters were determined using final xanthine concentrations of 0, 100, 200, 400, 800, and 1600 uM. Accordingly, the reaction rate (v) of xanthine oxidase and the substrate concentration [S] were determined according to the Michaelis–Menten equation:
v = (kc[Eo][S])/(S + Km)
where [Eo] is the concentration of enzyme, and kc and Km are the catalytic constants of hydrolysis and the Michaelis constant.

2.10. Measuring Fat Globule Size Distribution in WPPC and a Comparison to Bovine Milk

The fat globule size distribution was determined for all the powder and liquid WPPCs, and bovine milk was used as a control. A procedure to determine the MFG size was optimized for both WPPC and bovine milk [8]. Before use, the desired volumes of frozen WPPC and bovine milk samples were gently thawed over ice at 4 °C for 3 days [50]; MFG samples (liquid and powder) were diluted with Milli-Q water in a 1:9 ratio. Diluted samples were treated with 35 mM EDTA (pH 7.0) at a 1:5 volume ratio. EDTA, a calcium chelator, was added to the samples to dissociate casein micelles and eliminate their interference with measurements of the particle size distribution of MFGs. Particle size distribution was measured using a Microtrac S3500 (Microtrac, Montgomeryville, PA, USA), which uses laser light scattering to quantify the particle size. Measurements were conducted at room temperature. Measurements were performed in triplicate. Deionized water with a refractive index of 1.33 was used as a dispersant. The dispersed phase, milk fat, was measured with a refractive index of 1.46 [8].

2.11. Folch Extraction for the Total Lipids

In brief, prior to extraction, sample 1 and a blank (water) were placed on ice. A total of 3 replicates of approximately 100 mg of samples from the same batch was weighed and added to a set of glass tubes pre-cooled on ice. To each glass tube containing samples, 400 µL of cooled solution of 1 mM ethylenediaminetetraacetic acid disodium salt dihydrate (2Na-EDTA, E5134-50 g, Sigma) containing 0.9% potassium chloride (KCl, P217-500, Fisher Scientific) was added, followed by 2.4 mL of chilled mixtures of chloroform (C607-4, Fisher) and methanol (A454-4, Fisher) (2:1, v/v) containing 0.002% butylated hydroxytoluene (BHT, #W218405-SAMPLE-K, Sigma). The mixture was vortexed and centrifuged at 10 min, 2000 rpm, 0 °C (Rotor RORVALL H1000B, Sorvall RT 6000D). The bottom layer was then collected to a new 2nd glass tube. Another 1.6 mL of chilled chloroform was added to the remaining upper layer in the original tube, followed by vortex and centrifugation (10 min, 2000 rpm, 0 °C). The bottom layer was collected into the 2nd glass tube. This combined total lipid extract dissolved in organic solvent was dried under nitrogen, followed by reconstitution in 1 mL of chloroform and methanol (2:1, v/v). This lipid extract was vortexed and transferred into a 2 mL amber vial, which was subject to storage in −80 °C freezer until use.
Minor modification was applied when Folch extraction was prepared for total oxylipin extraction [51]. The samples were placed on dry ice instead of ice during weighting. Additionally, 50 mg of samples were weighed (instead of 100 mg) for the Folch extraction. The resulting Folch extract was resuspended in the 1 mL mixture of chloroform and isopropanol (2:1, v/v) instead of chloroform/methanol.

2.12. Thin-Layer Chromatogram (TLC) Separation of the Major Phospholipid Classes

A portion of the Folch extract amounting to ~1 mg of total lipids was separated by TLC (Silica gel 60 plates, Cat#105721.0001, Millipore Sigma) to fractionate and estimate the abundance of phospholipid species and their respective fatty acids [52]. Phospholipids were separated by TLC into 56 species, including sphingomyelin (SM), choline glycerophospholipids/phosphatidylcholine (PC), phosphatidylserine (PS), phosphatidylinositol (PI), and ethanolamine glycerophospholipids/phosphatidylethanolamine (PE), which appear sequentially from the closest to the furthest distance relative to the baseline of the TLC plate. The TLC plate was first scored into 4 sample lanes (4 cm width) and 3 standard lanes (1 cm width), followed by pre-rinsing the TLC chambers and pre-washing the TLC plate with 100 mL of 21:12 (v/v) chloroform and methanol. The TLC plate was then air-dried in a fume hood for a few minutes and further dried in a vacuum oven maintained at 80 °C overnight. A mixture of 60 mL chloroform, 50 mL methanol, 4 mL water, and 1 mL acetic acid was used to resolve the bands [20]. A total of 2 square thick plot papers (Cat#1703955, Bio-Rad) per TLC chamber were used to assist insolvent equilibration in the TLC chamber for at least 30 min prior to being added to the TLC plates. The TLC plates were loaded with 100 µL volume of each sample containing ~2 mg of lipid in each 4 cm sample lane using a Hamilton syringe (rinsed at least 4 times with 2:1 (v/v) chloroform–methanol mixture before and between samples) and 3–4 drops of pig brain lipid extract as standards containing PE, PI, PS, PC, and SM in the 1 cm standard lane. The TLC plate was then placed into the TLC chamber equilibrated with the mobile phase, and 45 min of elution time was applied. After separation, TLC plate was carefully removed from the chamber and allowed to dry to evaporate the solvent. The TLC plate was sprayed with a solution of 0.02% (w/v) 2′,7′-dichlorofluorescein (Acros, cat# 191530050) in methanol prior to drying and visualization under a UV light. During visualization, the visible bands were identified with a pencil. The marked TLC bands were then scraped individually and transferred into the labeled test tubes, which were pre-spiked with 0.1 mg 22:3n-3 ethyl ester internal standard. In each test tube, 0.4 mL of toluene was added. The samples were then stored at −80 °C prior to further methylation.

2.13. Derivatization of Total Lipids and TLC-Separated Lipid Fractions

A portion of the Folch total lipid extract (50 µL from ~100 mg WPLC) and the TLC-separated lipid fractions were transesterified with methanolic HCl and subjected to GC-FID analysis to capture the fatty acids and cholesterol. For the total lipids, 50 µL of the Folch extract was added to a test tube pre-spiked with 0.1 mg 22:3 n-3 ethyl ester and 0.05 mg 5-alpha cholestane, followed by the addition of 0.4 mL of toluene. As pointed out above, the TLC-separated lipid fractions were only spiked with 0.1 mg 22:3 n-3 ethyl ester and 0.4 mL pf toluene (because they did not contain cholesterol). To each sample (total lipid and phospholipids), 3 mL of methanol followed by 600 µL of methanolic HCl (37% concentrated HCl in methanol (92:8, v/v)) were added. The samples were then vortexed and placed into the heating block at 90 °C for 60 min [53]. After the reaction, the samples were cooled to room temperature for 4–5 min, and 1 mL of hexane and 1 mL of distilled water were added. The samples were vortexed and phase separation of the hexane layer from the aqueous layer was achieved by allowing the samples to sit at room temperature for 15 min. The upper hexane layer was transferred into a 2 mL tube and mixed with 450 µL water. After vortexing and centrifugation (15,871× g, 2 min at room temperature) (FA-45-24-11 motor), the upper hexane layer was transferred into a new 1.5 mL tube and dried under nitrogen. The derivatized fatty acid extract was re-suspended in 100 µL of hexane. The samples were stored in a −80 °C freezer until GC-FID analysis.

2.14. GC Analysis of Fatty Acid Methyl Ester (FAME)

The GC-FID analysis of the derivatized FAME was performed on a Perkin Elmer Clarus 500 instrument controlled by TotalChrom Navigator software. FAME separation was achieved on a DB-FFAP column (30 m × 0.25 mm inner diameter, 0.25 μm film thickness). The total run time per sample was 65 min. The injection volume was 1 μL and a 10:1 split ratio was applied. The injector temperature was set to 285 °C. The oven temperature program was as follows: the oven was set to 80 °C for 2 min, followed by 1 °C/min ramp to 185 °C, then 6 °C/min ramp to 249 °C, and a prolonged hold for 42 min at 249 °C. The detector temperature was set to 300 °C. Helium was used as the carrier gas; the flow rate was 1.3 mL/min. Fatty acids were quantitated by proportional comparison of the GC peak areas to that of the 22:3n-3 ethyl ester internal standard.

2.15. Extraction of Free Oxylipins from the WPPC Samples

Free oxylipins were extracted, as previously reported [51,54]. The powder samples were placed on dry ice and triplicates of approximately 50 mg of samples were weighed. The samples were mixed with 10 µL of oxylipin surrogate spike solution containing 2 µM d11-11(12)-EpETrE; d11-14,15-DiHETrE; d4-6-keto-PGF1α; d4-9-HODE; d4-LTB4, d4-PGE2; d4-TXB2, d6-20-HETE; and d8-5-HETE in methanol, followed by 600 µL methanol-water (1:4, v/v) containing 0.002% BHT, 250 µM EDTA, and 0.01% acetic acid to precipitate the proteins. The samples were vortexed and centrifuged (10 min, 13,000 rpm/15,871× g, FA-45-24-11 motor, 0 °C). The supernatant was loaded onto 100 mg tC18 Sep-Pak solid-phase extraction (SPE) columns (Waters Corp, Milford, MA, USA) that had been pre-washed with 750 µL of methanol twice and equilibrated with 750 µL 20% methanol twice. The column containing the sample supernatant was washed with 750 µL 20% methanol twice, followed by 750 µL of hexane twice. Free oxylipins were then eluted from the column into polypropylene tubes using 2 aliquots of 1 mL methanol. The extracts were dried under nitrogen and reconstituted in 100 µL LC-MS/MS grade methanol. The samples were vortexed, placed on wet ice for 15 min, and centrifuged through Durapore centrifugal filter (0.1 µm, Millipore) for 2 min at 13,000 rpm (15,871× g, FA-45-24-11 motor), 0 °C. The filtrate was stored in a 150 µL glass insert fitted in a 2 mL autosampler vial and stored in −80 °C until mass-spectrometry analysis.

2.16. Liberation of the Free Oxylipins from Total Oxylipins from the Folch Extract

Total oxylipins consisting of both bound (i.e., esterified) and free oxylipins were measured as reported [54]. An aliquot of 100 µL Folch extract dissolved in chloroform:isopropanol (2:1, v/v) was dried under nitrogen and spiked with a (1) 10 µL methanol–water (1:1, v/v) solution of antioxidant mixture containing 0.2 mg/mL BHT, EDTA and triphenylphosphine (TPP); (2) 10 µL oxylipin surrogate standard containing 2 uM d11-11(12)-EpETrE, d11-14,15-DiHETrE, d4-6-keto-PGF1α, d4-9-HODE, d4-LTB4, d4-PGE2, d4-TXB2, d6-20-HETE and d8-5-HETE in methanol; (3) 200 µL of methanol containing 0.1% BHT and 0.1% acetic acid; and 4) 200 µL of 0.4 M sodium hydroxide in methanol-water (1:1, v/v). The mixture was heated at 60 °C for 30 min, followed by 5 min of cooling at room temperature. After hydrolysis, acetic acid (25 μL) and water (1575 μL) were added to the reaction mixture. The mixture was loaded onto a 60 mg Waters Oasis HLB 3cc SPE column (Waters, Milford, MA, USA) pre-rinsed with 1 column volume of ethyl acetate and 2 column volumes of methanol, and pre-conditioned with 2 column volumes of SPE buffer composed of 5% methanol and 0.1% acetic acid. After loading the samples, the SPE column was rinsed twice with the SPE buffer. The SPE column was dried with light vacuum for 20 min, and the oxylipins were eluted with 0.5 mL of methanol followed by 1.5 mL ethyl acetate. The eluents were dried under nitrogen, reconstituted in 100 μL of methanol, vortexed, sat on wet ice for 15 min, pipetted into Durapore centrifugal filter (0.1 μm, Millipore), and centrifuged for 2 min (13,000 rpm/15,871× g, FA-45-24-11 motor, 0 °C). The filtrates were transferred into 150 μL glass inserts in 2 mL LCMS vials and stored at −80 °C freezer until they were analyzed by mass-spectrometry.

2.17. UPLC-MS/MS Analysis of the Free and Total Oxylipins

The UPLC-MS/MS analysis of oxylipins was performed on an Agilent 1290 Infinity UPLC system coupled with an Agilent 6460 Triple Quadrupole mass-spectrometer (MS) (Agilent Technologies, Santa Clara, CA, USA). Oxylipin separation was achieved using a ZORBAX RRHD Eclipse Plus 95Å C18 column (2.1 × 150 mm, 1.8 µm, Cat#959759-902, Agilent). Mobile phases consisted of A) 0.1% acetic acid in Milli-Q water and B) acetonitrile–methanol solution (80:15, v/v) containing 0.1% acetic acid. The following gradient was used to separate the oxylipins: mobile phase A was set to (1) 65% A at a flow rate 0.25 mL/min at 2 min, (2) 15% A at a flow rate of 0.25 mL/min at 12 min, (3) 0% A at flow rate of 0.4 mL/min at 15.1 min, (4) 65% A at flow rate of 0.4 mL/min at 17.1 min, and (5) 65% A at flow rate of 0.3 mL/min at 19.0 min. The total run time was 20 min. During the analysis, the auto-sampler was kept at 4 °C and the column at 45 °C.

3. Results and Discussion

3.1. Compositional Analysis of Whey Protein Phospholipid Concentrate (WPPC) and a Comparison to Bovine Milk

The average total solids, protein, and fat content in the liquid and powder whey protein phospholipid concentrate (WPPC) provided by several dairy manufacturers are reported in Table 1.
The values in Table 1 comply with the standard of identity published by the American Dairy Products Institute, which state that WPPC composition should consist of, on a dry basis, a minimum of 12% fat, minimum of 50% protein, a maximum of 8% ash, maximum of 6% moisture, and a pH between 5.7 and 7.5 [55]. One recent study by Levin et al. analyzed the moisture, fat, protein, lactose, ash, and pH of WPPC powders from four suppliers, including two lots produced six months apart by each supplier [56]. Fat, protein, ash, moisture, lactose, and pH values varied significantly between lots, and ranged from 10.85% to 38.11%, from 50.26% to 69.97%, from 1.88% to 4.08%, from 1.90% to 4.78%, from 1.01% to 10.72%, and from 5.10 to 6.46, respectively. There are two main observations reported by that prior study, which are also relevant to the present work: (i) significant differences were observed between lots in all WPPC composition categories and pH values, and (ii) the greatest variations were observed in the fat and protein content. These differences were not surprising since no standardization is performed on WPPC by the industry. These findings demonstrated that WPPC composition was highly variable between suppliers and lots, and it begs for more in-depth proteomic and lipidomic analysis to obtain a complete overview of the various proteins and lipids in WPPC in order to promote its valorization.

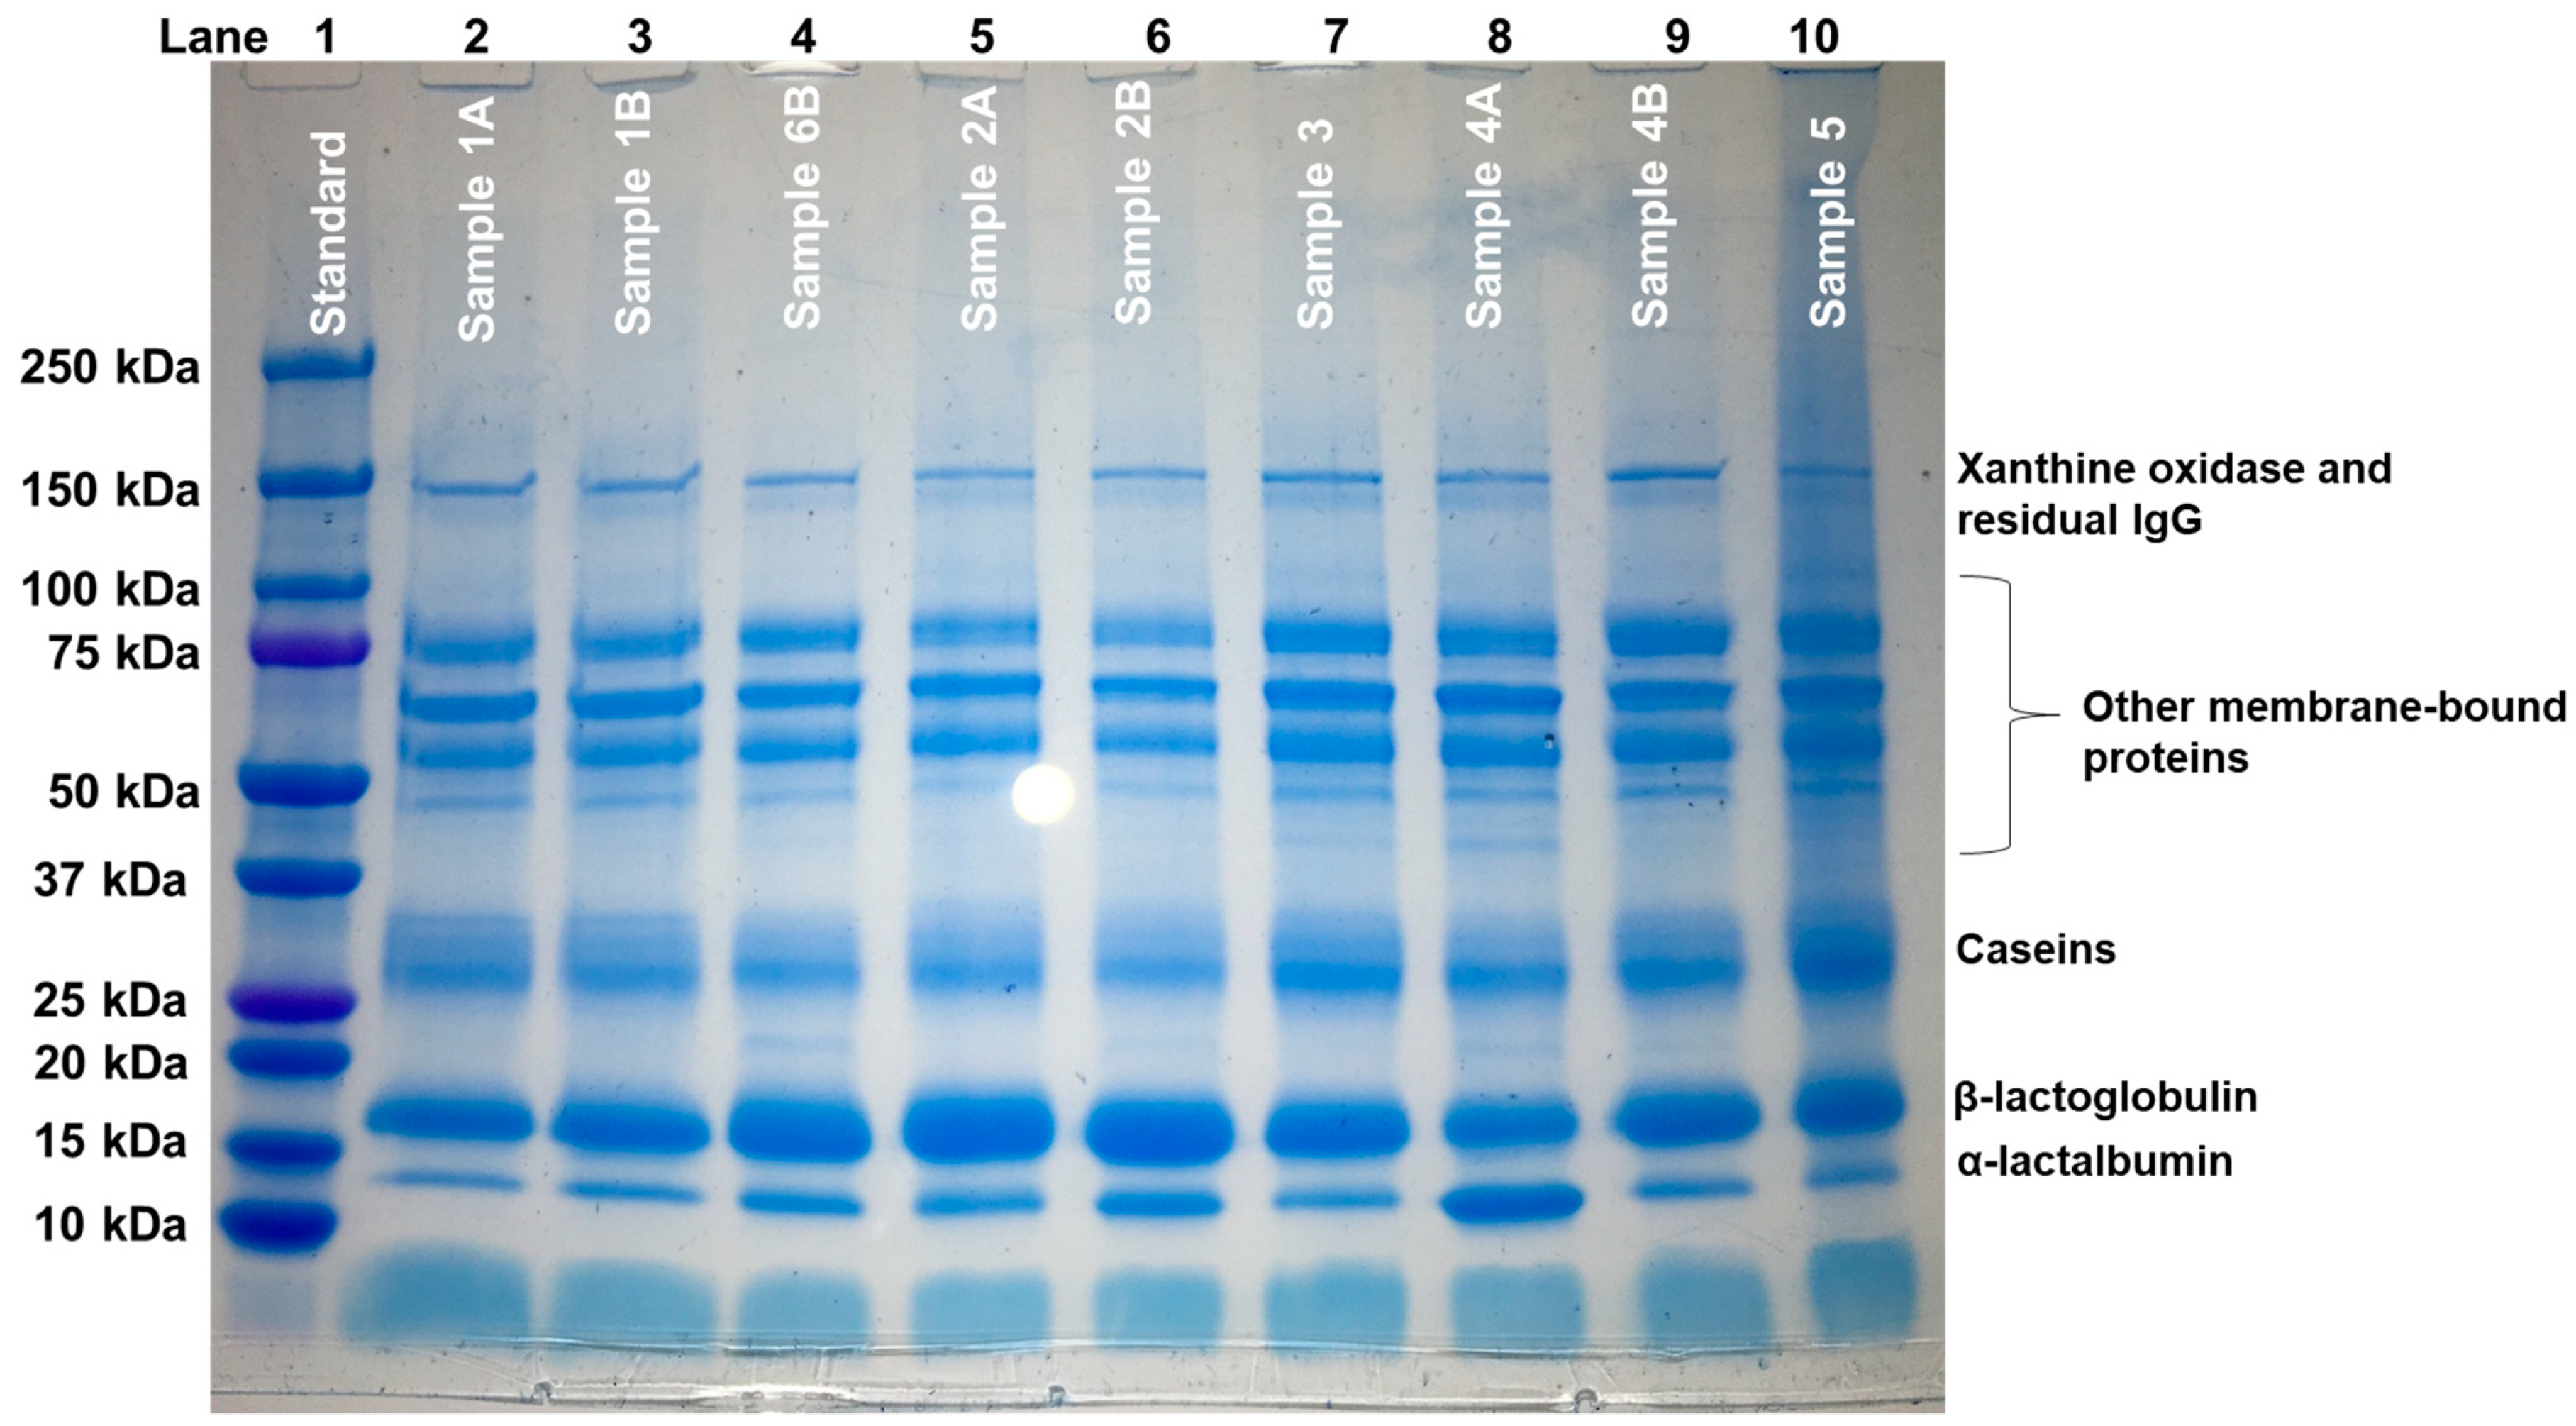
3.2. Identification of Proteins in WPPC by SDS-PAGE

The visual inspection of SDS-PAGE revealed the presence of many proteins in all WPPC samples (Figure 2). It is apparent that these WPPC samples all contain proteins derived from MFG, such as xanthine oxidase and other membrane-bound proteins, and milk proteins, such as, β-lactoglobulin, α-lactalbumin, and caseins. There was some variation in the relative amounts of some proteins, such as α-lactalbumin, across the dataset. Although samples 4A and 4B originated from the same manufacturer, we observed that sample 4B contained a higher portion of α-lactalbumin than sample 4A. β-lactoglobulin was the most abundant protein in samples 6A, 2A, and 2B.
Since the molecular weight of xanthine oxidase is similar to that of immunoglobulins (140 kDa and 150 kDa, respectively), we purchased and analyzed standards of each protein by SDS-PAGE, using IgG as a representative immunoglobulin. The gel-band patterns indicated that IgG was separated into its heavy and light chains during sample preparation by reducing agents, at approximately 23 kDa and 53 kDa on the gel, confirming that any IgG in the WPPC sample did not have a substantial contribution to the protein bands observed near 140 kDa. This suggested that, indeed, xanthine oxidase was the predominant protein at that molecular weight in WPPC (Figure S1).

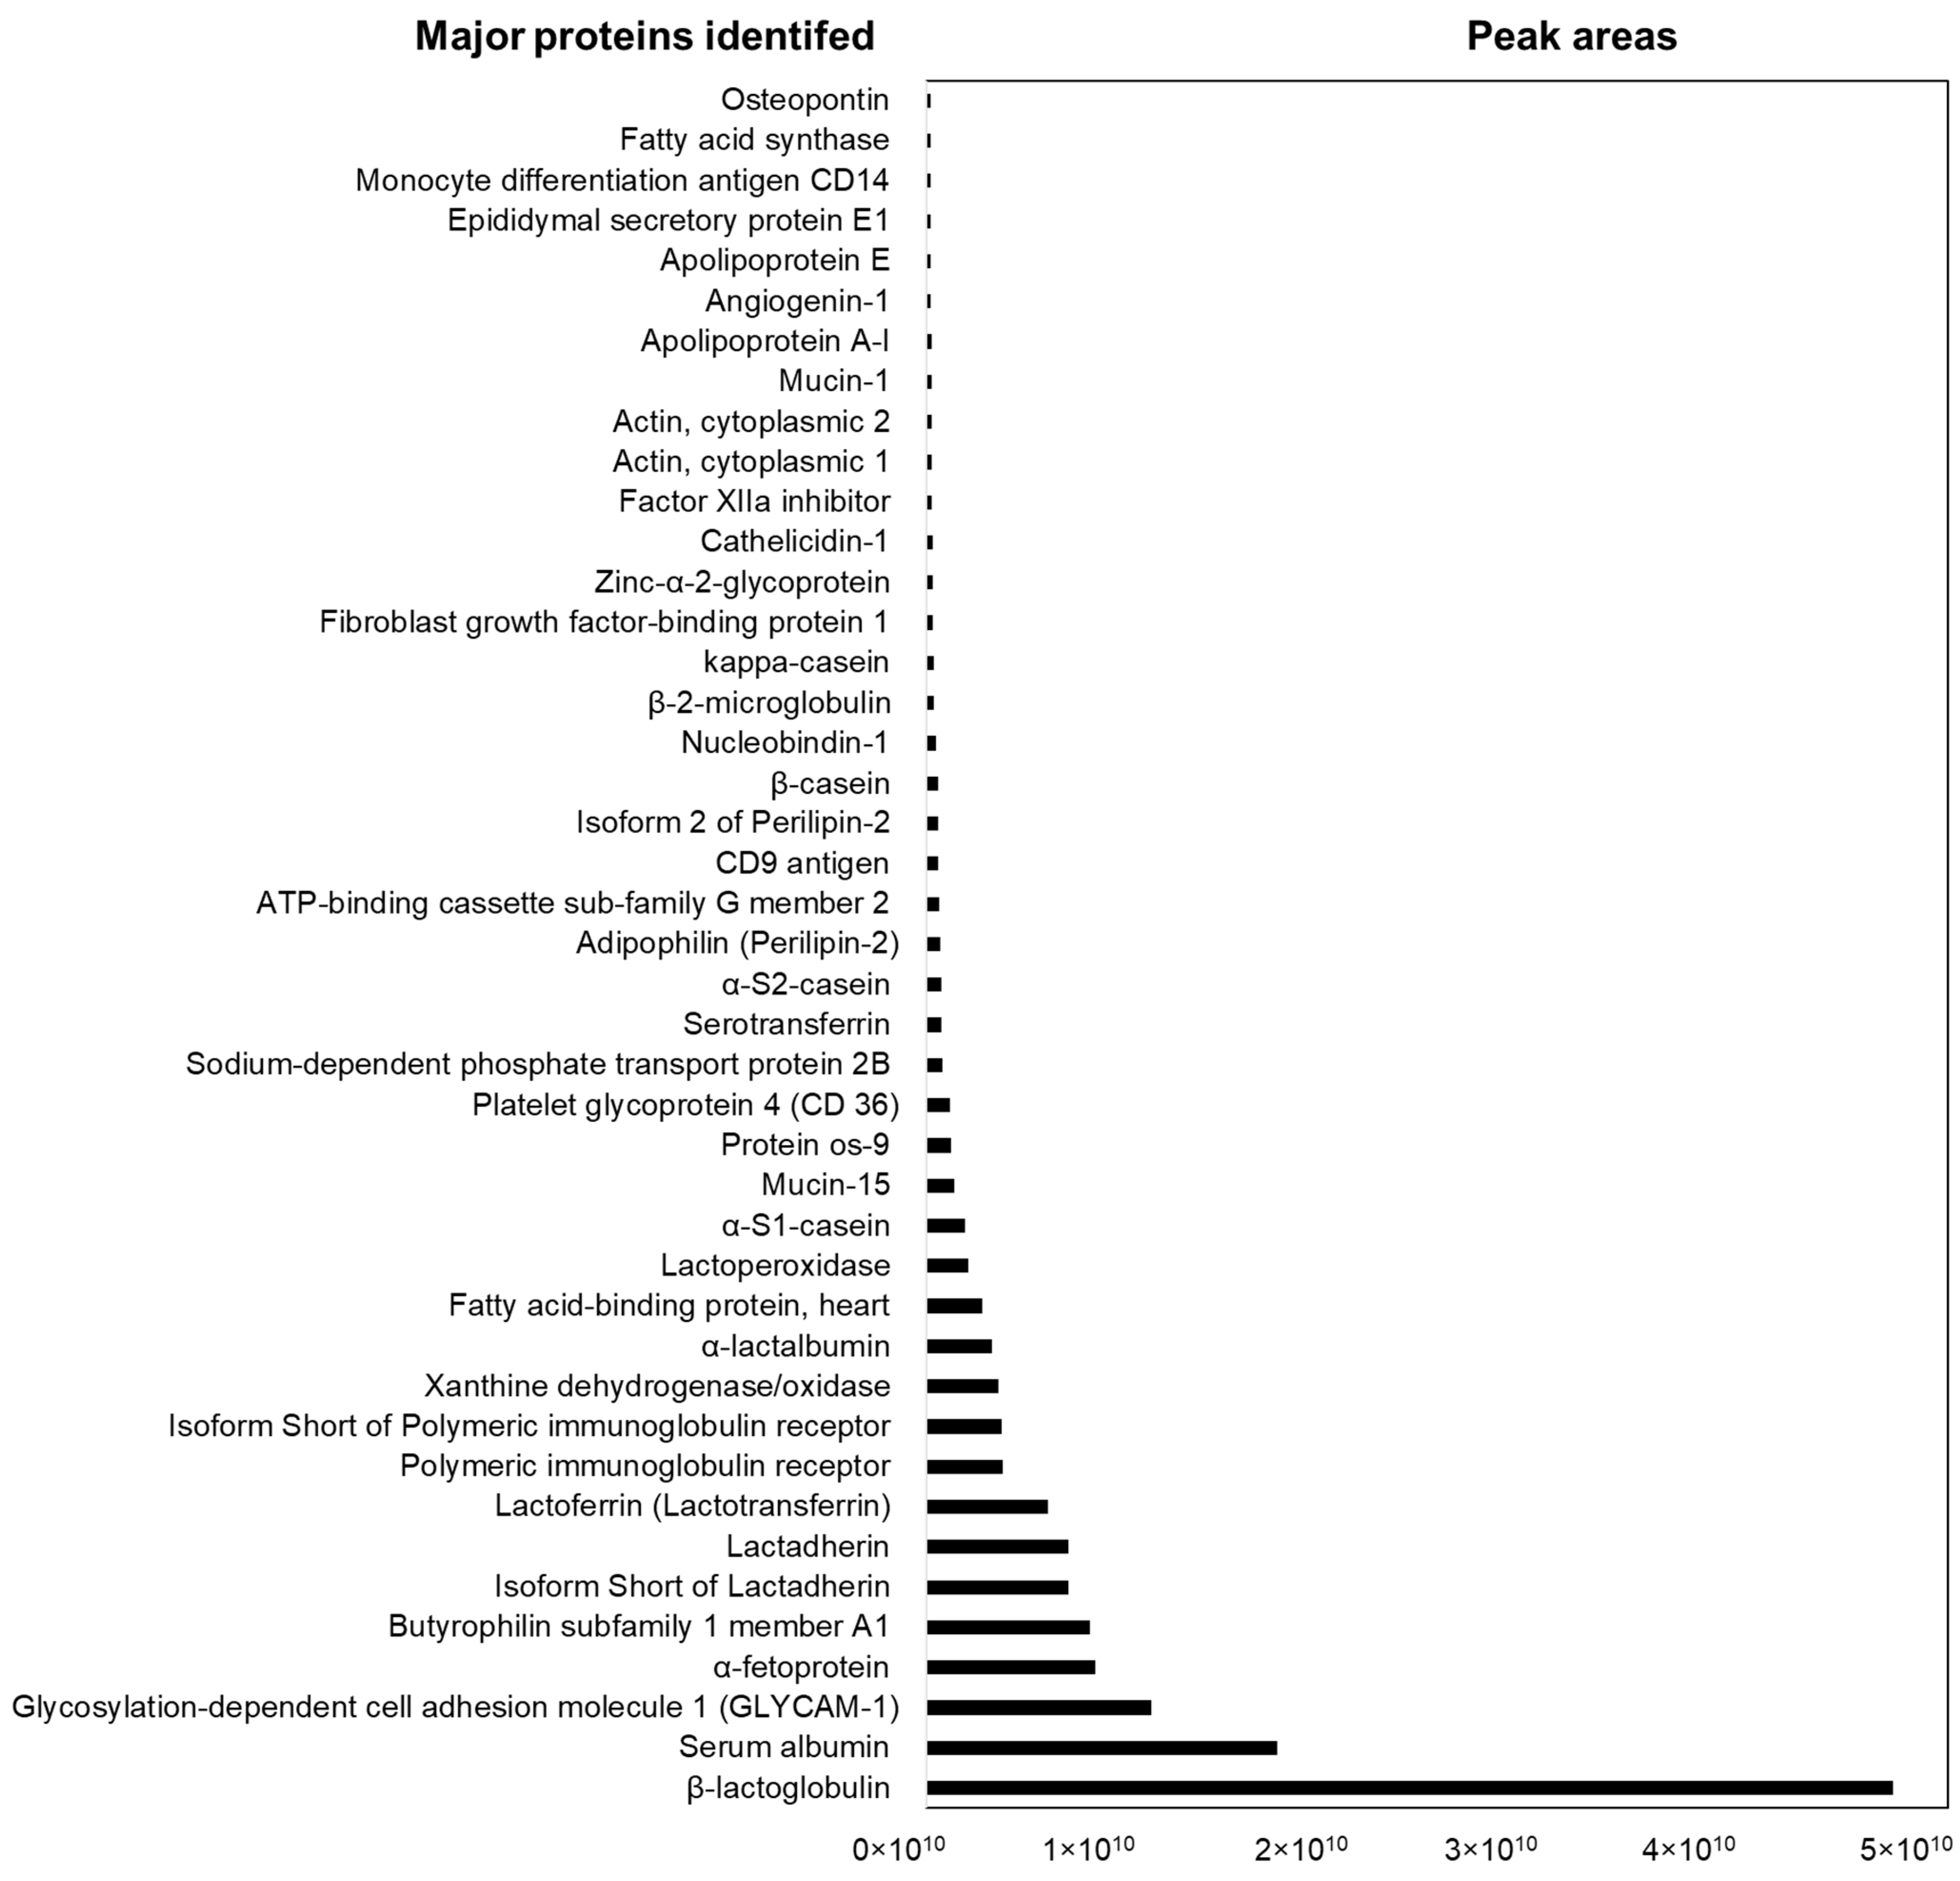
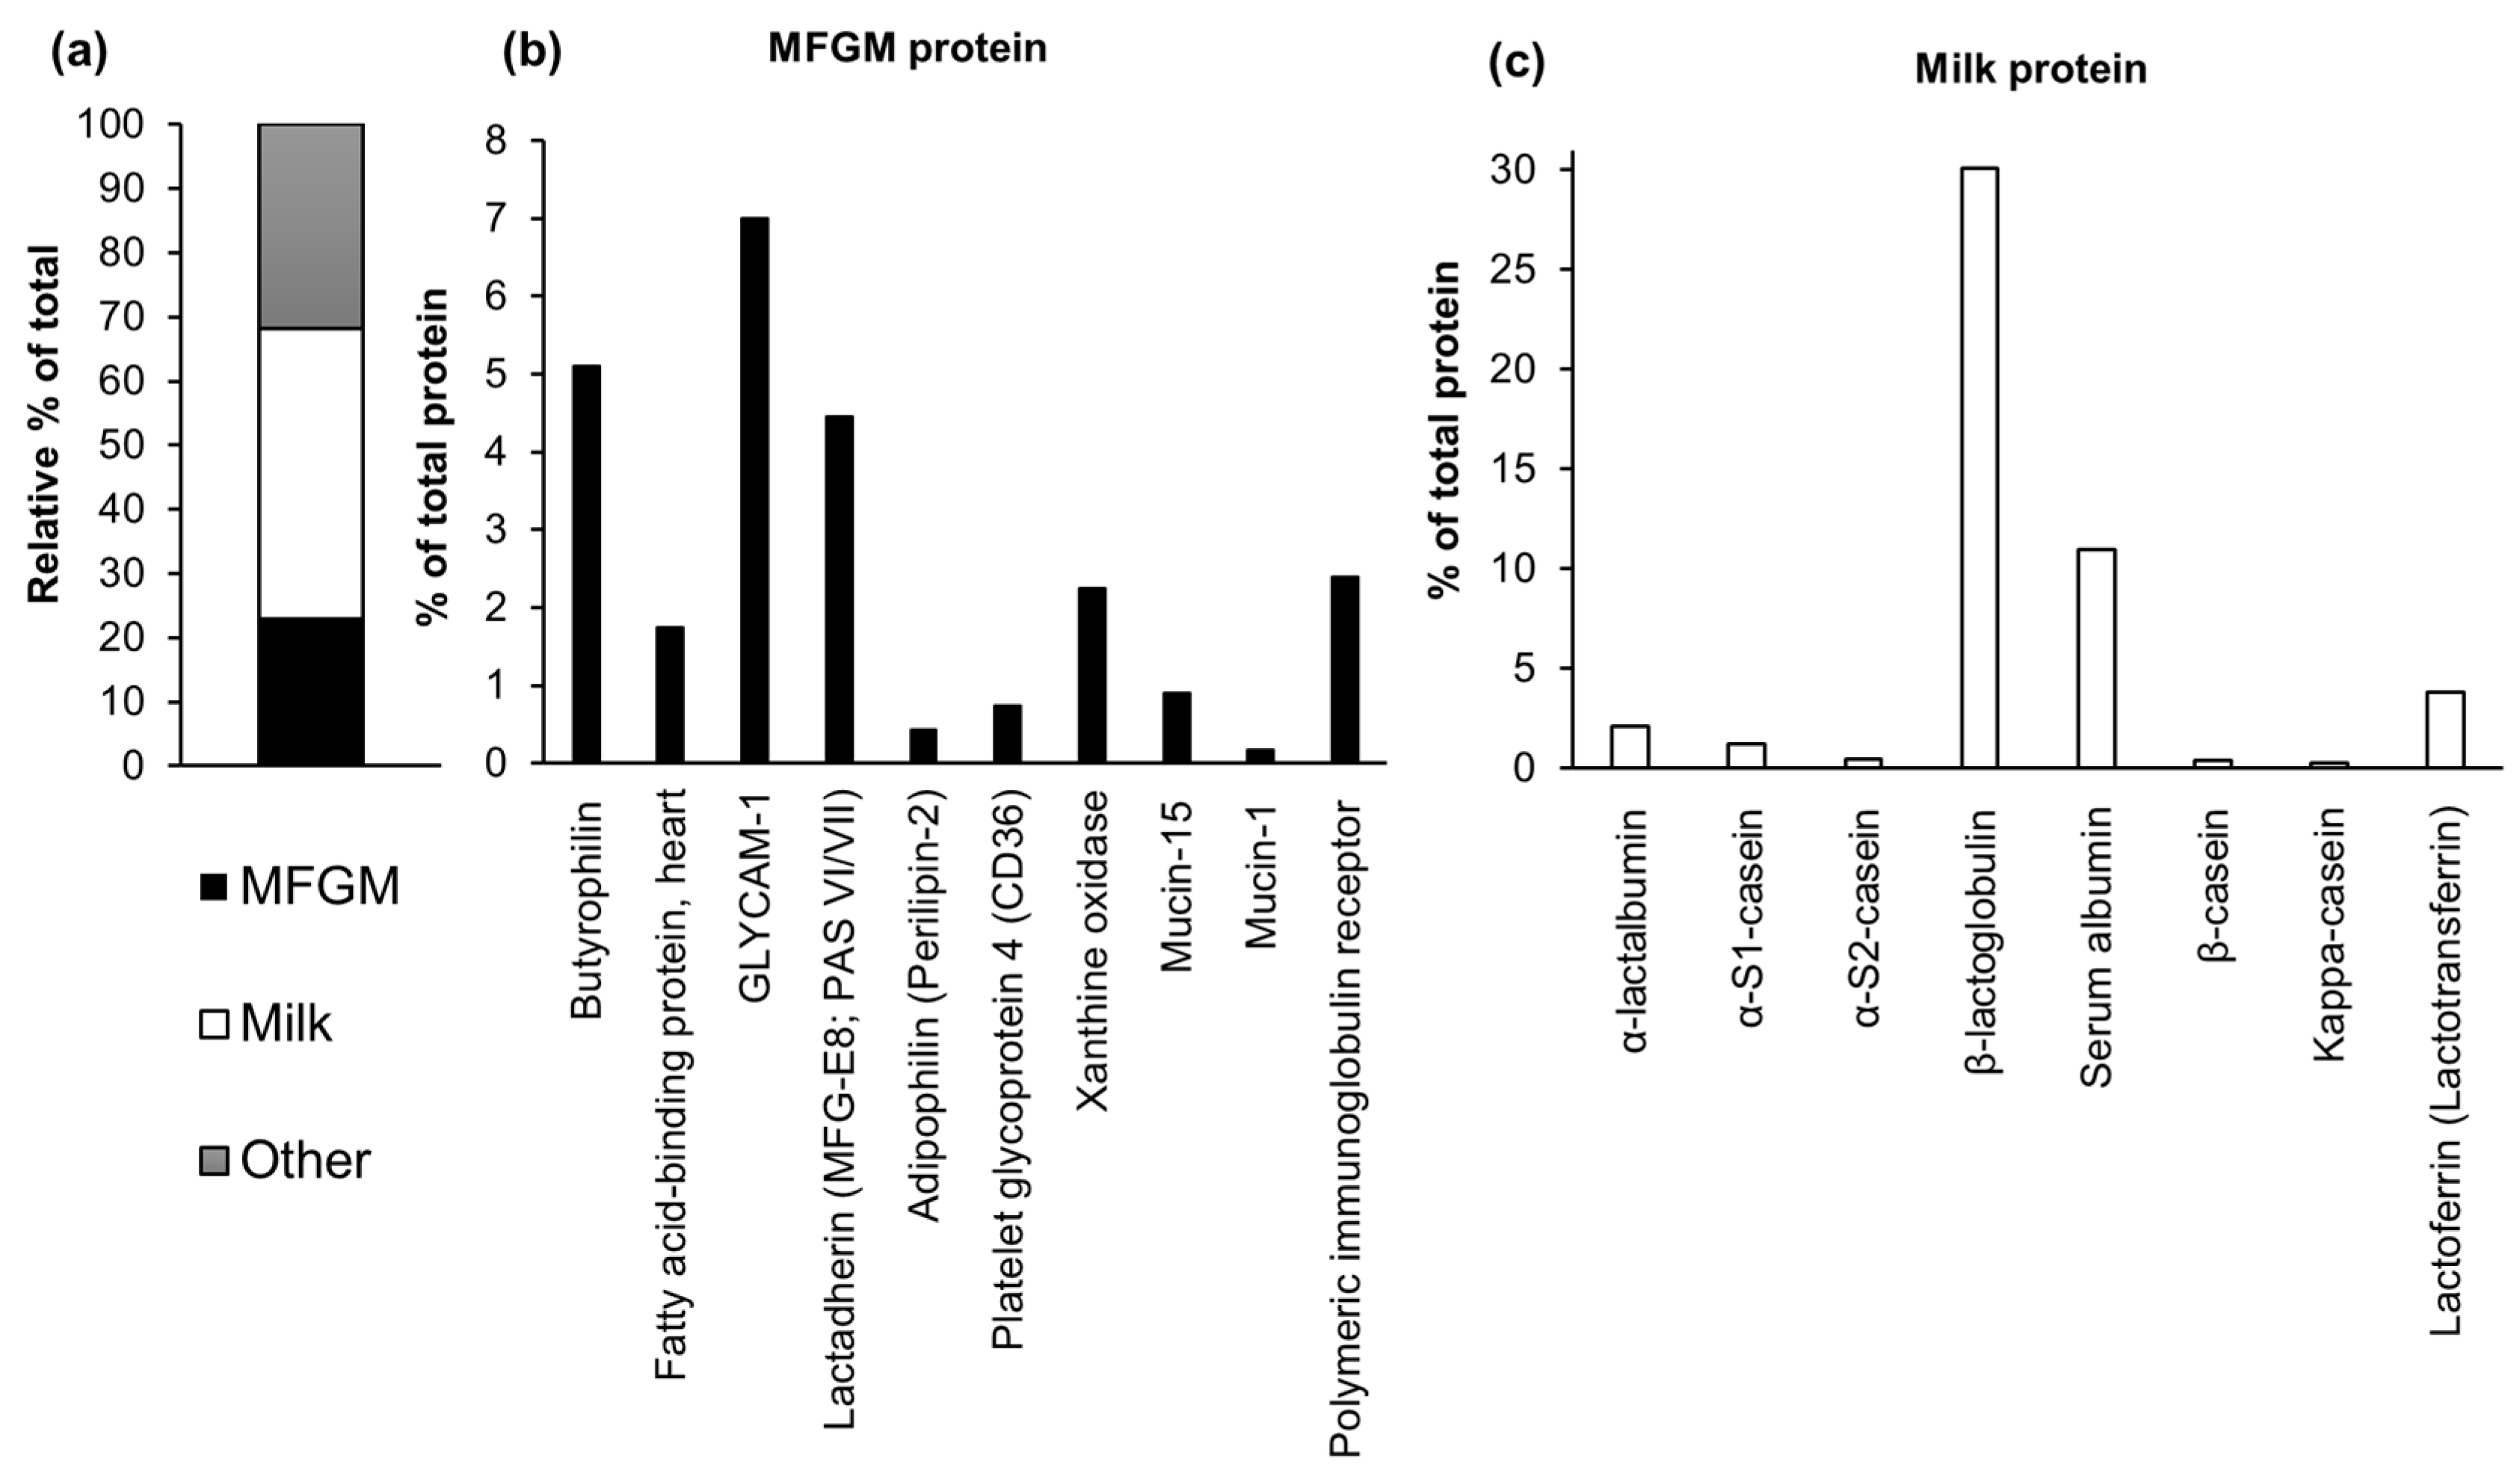
3.3. Proteomic Analysis

Nearly 180 milk proteins were identified, many of which are known to be glycosylated (e.g., lactoferrin (N-linked), immunoglobulins (N-linked), and mucin (O-linked)) (see Table S2 for the full protein list). Figure 3 presents the relative abundance of the major proteins in WPPC, listed in decreasing order.
Not surprisingly, β-lactoglobulin had the highest relative abundance among all the proteins identified, followed by serum albumin (Figure 3). In whey, which is the starting material for WPPC production, β-lactoglobulin and serum albumin are the most abundant proteins, making up 65% and 10–15%, of the total protein, so it is expected to also find them highly represented in WPPC. It was surprising to observe Lactoferrin (lactotransferrin) in the top 10 most abundant proteins, as lactoferrin is generally only found at the trace level in bovine milk and whey. Lactoferrin is a multifunctional protein and a key component in innate immunity [58].
Following thermal treatment, both whey proteins and caseins as well as MFGM proteins are susceptible to thermally induced lactosylation. Those lactosylated milk proteins have been shown to increasingly incorporate into fat globules following processing, which could explain the higher abundance of β-lactoglobulin in WPPC enriched in MFGM [59].
Interestingly, the relative abundance of glycosylation-dependent adhesion molecule-1 (GLYCAM-1), previously described as a milk glycoprotein associated with MFGM [56], was highest in MFGM proteome in WPPC. It is known that during milk expression in the mammary gland, glycosylated proteins, such as butyrophilin, ADPH (also known as perilipin 2), and xanthine oxidase are necessary for the budding and release of lipid globules from the apical surface and formation of the MFGM. Xanthine oxidase is required for the fusion of the apical plasma membrane onto the fat globules through structural interactions with butyrophilin and ADPH [60,61,62]. Until recently, xanthine oxidase was only considered to have a structural function in the milk fat globule membrane. However, recent research has shown that both human and bovine milk xanthine oxidase produce antimicrobial metabolites, reactive oxygen species, notably H2O2 [18,19], and reactive nitrogen species in the gut [63].
Other abundant glycosylated membrane proteins in WPPC included the milk fat globule epidermal growth factor 8 protein (MFG-E8; PAS VI/VII, also known as lactadherin), which prevents symptomatic rotavirus infection in breast-fed infants [64,65]. The polymeric immunoglobulin receptor is a highly glycosylated type I transmembrane protein, previously identified as being present in bovine MFGM [12]. It was found in WPPC in relatively high abundance. It mediates transcytosis to transport polymeric IgA and IgM across mucosal epithelial cells by binding polymeric IgA and IgM at the basolateral surface of epithelial cells [66] and also functions as an innate immune factor [67]. Mucin, a primary MFGM protein, is highly glycosylated and when expressed on mucosal epithelial cells, it is known to inhibit binding of S-fimbriated Escherichia coli in the oral cavity [68,69]. In WPPC, we identified mucin-1 and mucin-15 in low-to-moderate abundance (Figure 3).
Noteworthy non-glycosylated MFGM proteins included fatty acid-binding protein-heart, which contributes to the intracellular transport of long-chain fatty acids and their acyl-CoA esters [70].
All four caseins (αs1-casein, αs2-casein, β-casein, and κ-casein [71]) were identified in WPPC in moderate to low abundances relative to the total proteome (Figure 3), as expected for a product that is generated starting from cheese whey.
It is important to note that particular sample preparation and enrichment procedures may influence the depth to which the sample proteome is profiled. For example, a recent study investigated the composition of commercial sources of MFGM samples (commercial whey-based Lacprodan MFGM-10, as well as five cream-based fractions, a standard formula, and a premium formula containing whey-based MFGM) through proteomic (EASY-nLC UHPLC Q Exactive Plus Orbitrap) analyses [72]. That study implemented the use of ultrasonication to release protein sequences from the MFGM, followed by a trypsin digestion that employed a suspension trapping technique (S-Trap). Therefore, the proteomic analysis of whey-based Lacprodan MFGM-10 fractions and whey-based MFGM containing formula revealed a more comprehensive proteome, identifying over 500 proteins [72]. However, this list included many uncharacterized proteins as well as proteins not associated with lactation. Yet, such a detailed extraction was beyond the scope of the present study, which employed conventional methods to unravel the overall composition and activity of the major compounds in an undervalorized dairy stream.
To facilitate the comparison with the literature, in Figure 4a, we visually present the overall composition of WPPC by grouping protein into three classes: MFGM proteins, milk-derived proteins (casein and whey), and other proteins. Figure 4b,c detail the breakdown of each group of proteins. Based on the obtained abundance values, we determined that WPPC contains approximately 23% MFGM proteins, 45% milk proteins, and 31.76% other proteins (Figure 4a). These findings are relevant to valorizing WPPC, because others reported MFGM proteins representing only 1–2% of the total protein fraction in milk [73], making WPPC a more desirable starting material for MFGM isolation. Historically, MFGM has not been included in infant formulas and only a handful of manufacturers nowadays supplement it in their products, although many individual components of MFG membrane, such as glycoconjugates (glycoproteins and glycolipids), are thought to have antimicrobial, anti-inflammatory, and prebiotic functions in the gut [71]. In WPPC, the most abundant MFGM protein was glycosylation-dependent cell adhesion molecule 1 (GLYCAM-1, at 7% abundance), followed by butyrophilin (5%), lactadherin (4.45%), xanthine oxidase (2.25%), and fatty acid-binding protein heart with an abundance of less than 2% (Figure 4b).
In examining milk proteins in WPPC, β-lactoglobulin (30%) was still the predominant protein, whereas caseins (αs1-casein 1.22%, αs2-casein 0.48%, β-casein 0.36 %, and κ-casein 0.24%) were found in low abundance (Figure 4c and Table 2). Serum albumin was the second most abundant milk protein (11%) in WPPC, followed by lactoferrin (3.80%). Lactoferrin concentration in bovine milk ranges from 0.03–0.4% and in bovine colostrum is 0.2% by volume [74,75]. The discovery of such a large quantity of lactoferrin in WPPC is promising for the translation of this bioactive molecule into functional foods, given its role in iron transfer and immunity.
In view of these results, we compared the relative protein quantities in WPPC with the recent literature (Table 2) for whey and cream-based MFGM samples, as well as with infant formula (standard formula (SF) and a premium formula containing whey-based MFGM). All samples contained an abundance of milk-derived proteins (casein and whey), from 45.42% to 68.5%, and among those, SF had the highest milk protein (68.5%). WPPC and premium infants formula PF had the highest lactoferrin abundance among the values reported in the literature, with MFGM-10 and cream-based MFGM samples having lactoferrin levels lower than 0.1%.
WPPC and cream-based MFGM samples (PL-20 (Lacprodan PL-20), PBC-50 (Bovine Serum Concentrate), BSP2 (Bovine Serum Product), PLC1 (Phospholipid Concentrate), and SM2 (Sweet Buttermilk Powder)) contained a higher abundance of MFGM proteins than the whey-based fraction (MFGM-10 (Lacprodan MFGM-10)) (approx. 23–26% vs. 10.71%, Table 2), and infant formula SF had the lowest (2.85%). WPPC and cream-based MFGM samples (PL-20, PBC-50, BSP2, PLC1, and, SM2) had a similar abundance of MFGM proteins, such as GLYCAM-1, butyrophilin, lactadherin, and xanthine oxidase; however, MFGM-10 had the lowest levels of almost all MFGM proteins. This result is surprising because WPPC also originated from whey and yet had a higher protein abundance than MFGM-10. WPPC and cream-based samples had the highest xanthine oxidase abundance among the values reported in the literature, with MFGM-10 and formulas having xanthine oxidase levels lower than 0.1% (Table 2). These findings highlight that the origin of MFGM fractions can significantly affect protein composition and may further explain the variance among commercial MFGM samples.

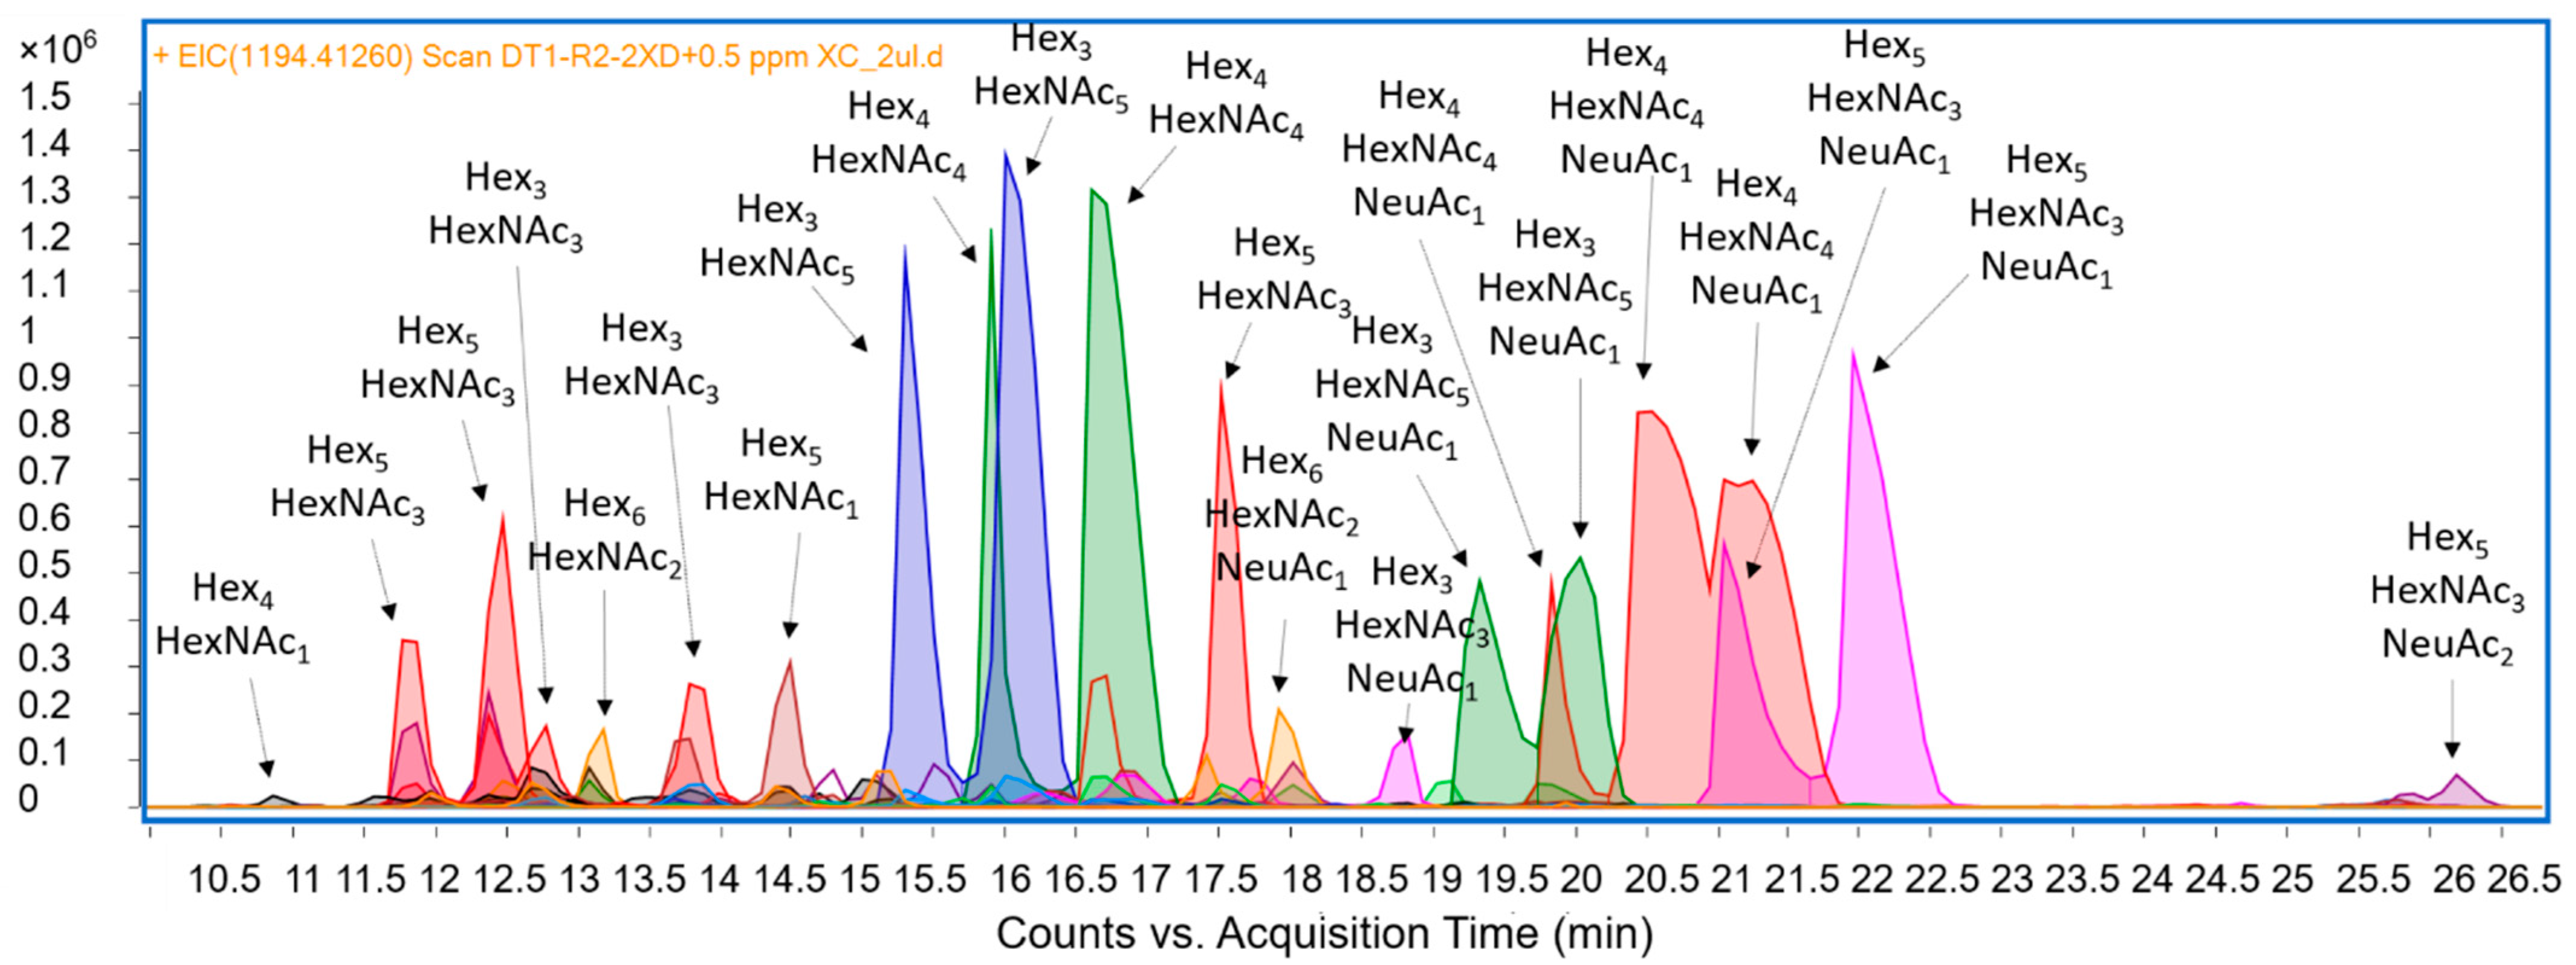
3.4. N-Linked Glycans (N-Glycans)

N-linked glycans are covalently bound to an asparagine residue of protein with the consensus sequence of “asparagine-X-serine/threonine” with X representing any amino acid besides proline [76], which would hinder the linkage due to its bulky nature. N-linked glycans were released from WPPC using an endo-β-N-acetylglucosaminidase. 85 N-glycan compositions were identified from the tandem-mass spectrometry data. These glycans span in mass from 700 to 2100 Da and are made of 4 to 10 monosaccharide units. The relative N-glycan abundances varied substantially by structure, as illustrated in Figure 5. N-Glycans play important biological roles in cell-to-cell interactions, protection against pathogens, as well as in proper protein folding and stability [77], and are thus interesting targets for novel ingredient development. The release of N-glycans with structural similarity to human milk oligosaccharides (HMOs) provides an attractive alternative for the recovery of glycans, which have been shown to support the growth of key members of the gastrointestinal microbiome, such as very specific beneficial strains of Bifidobacterium [45]. We previously demonstrated that N-glycans released from bovine milk glycoproteins supported the rapid growth of Bifidobacterium longum subsp. infantis (B. infantis), a species that also grows well on HMOs, but did not support the growth of Bifidobacterium animalis subsp. lactis (B. lactis), a species that lacks the enzymatic ability to degrade and utilize HMOs [45].

3.5. Sialic Acid

We measured N-acetylneuraminic acid (Neu5Ac) and N-glycolylneuraminic (Neu5Gc), the major sialic acid compounds found on dairy glycoproteins. The concentration of Neu5Ac was 1.51% ± 0.02% by weight, and Neu5Gc represented less than 0.1% of the sample by weight. In bovine milk, the concentrations of Neu5Gc have been shown to vary according to the stage of lactation, with higher concentrations early in lactation, while, in human milk, the only form of sialic is Neu5Ac [78]. Thus, the dominance of Neu5Ac is likely due to the presence of gangliosides in the MFGM fractions, and thanks to this higher proportion, WPPC more closely mimics human-milk composition than bovine colostrum/milk. A recent study compared the sialic acid quantities in whey-based and cream-based fractions, and reported that the commercial product MFGM-10 sample had the highest percentage of both compounds (2.52 %; 0.13%); conversely, sweet buttermilk powder (SM2) had the lowest percentage (0.66%; 0.01%) [72]. Cream-based MFGM samples (PL-20 (Lacprodan PL-20), PBC-50 (Bovine Serum Concentrate), BSP2 (Bovine Serum Product), PLC1 (Phospholipid Concentrate), and SM2 (Sweet Buttermilk Powder)) contained similar sialic acid Neu5Ac (1.12%, 1.13%, 1.04%, and 1.22%). Among all samples, Neu5Ac was more abundant than Neu5GC [72].

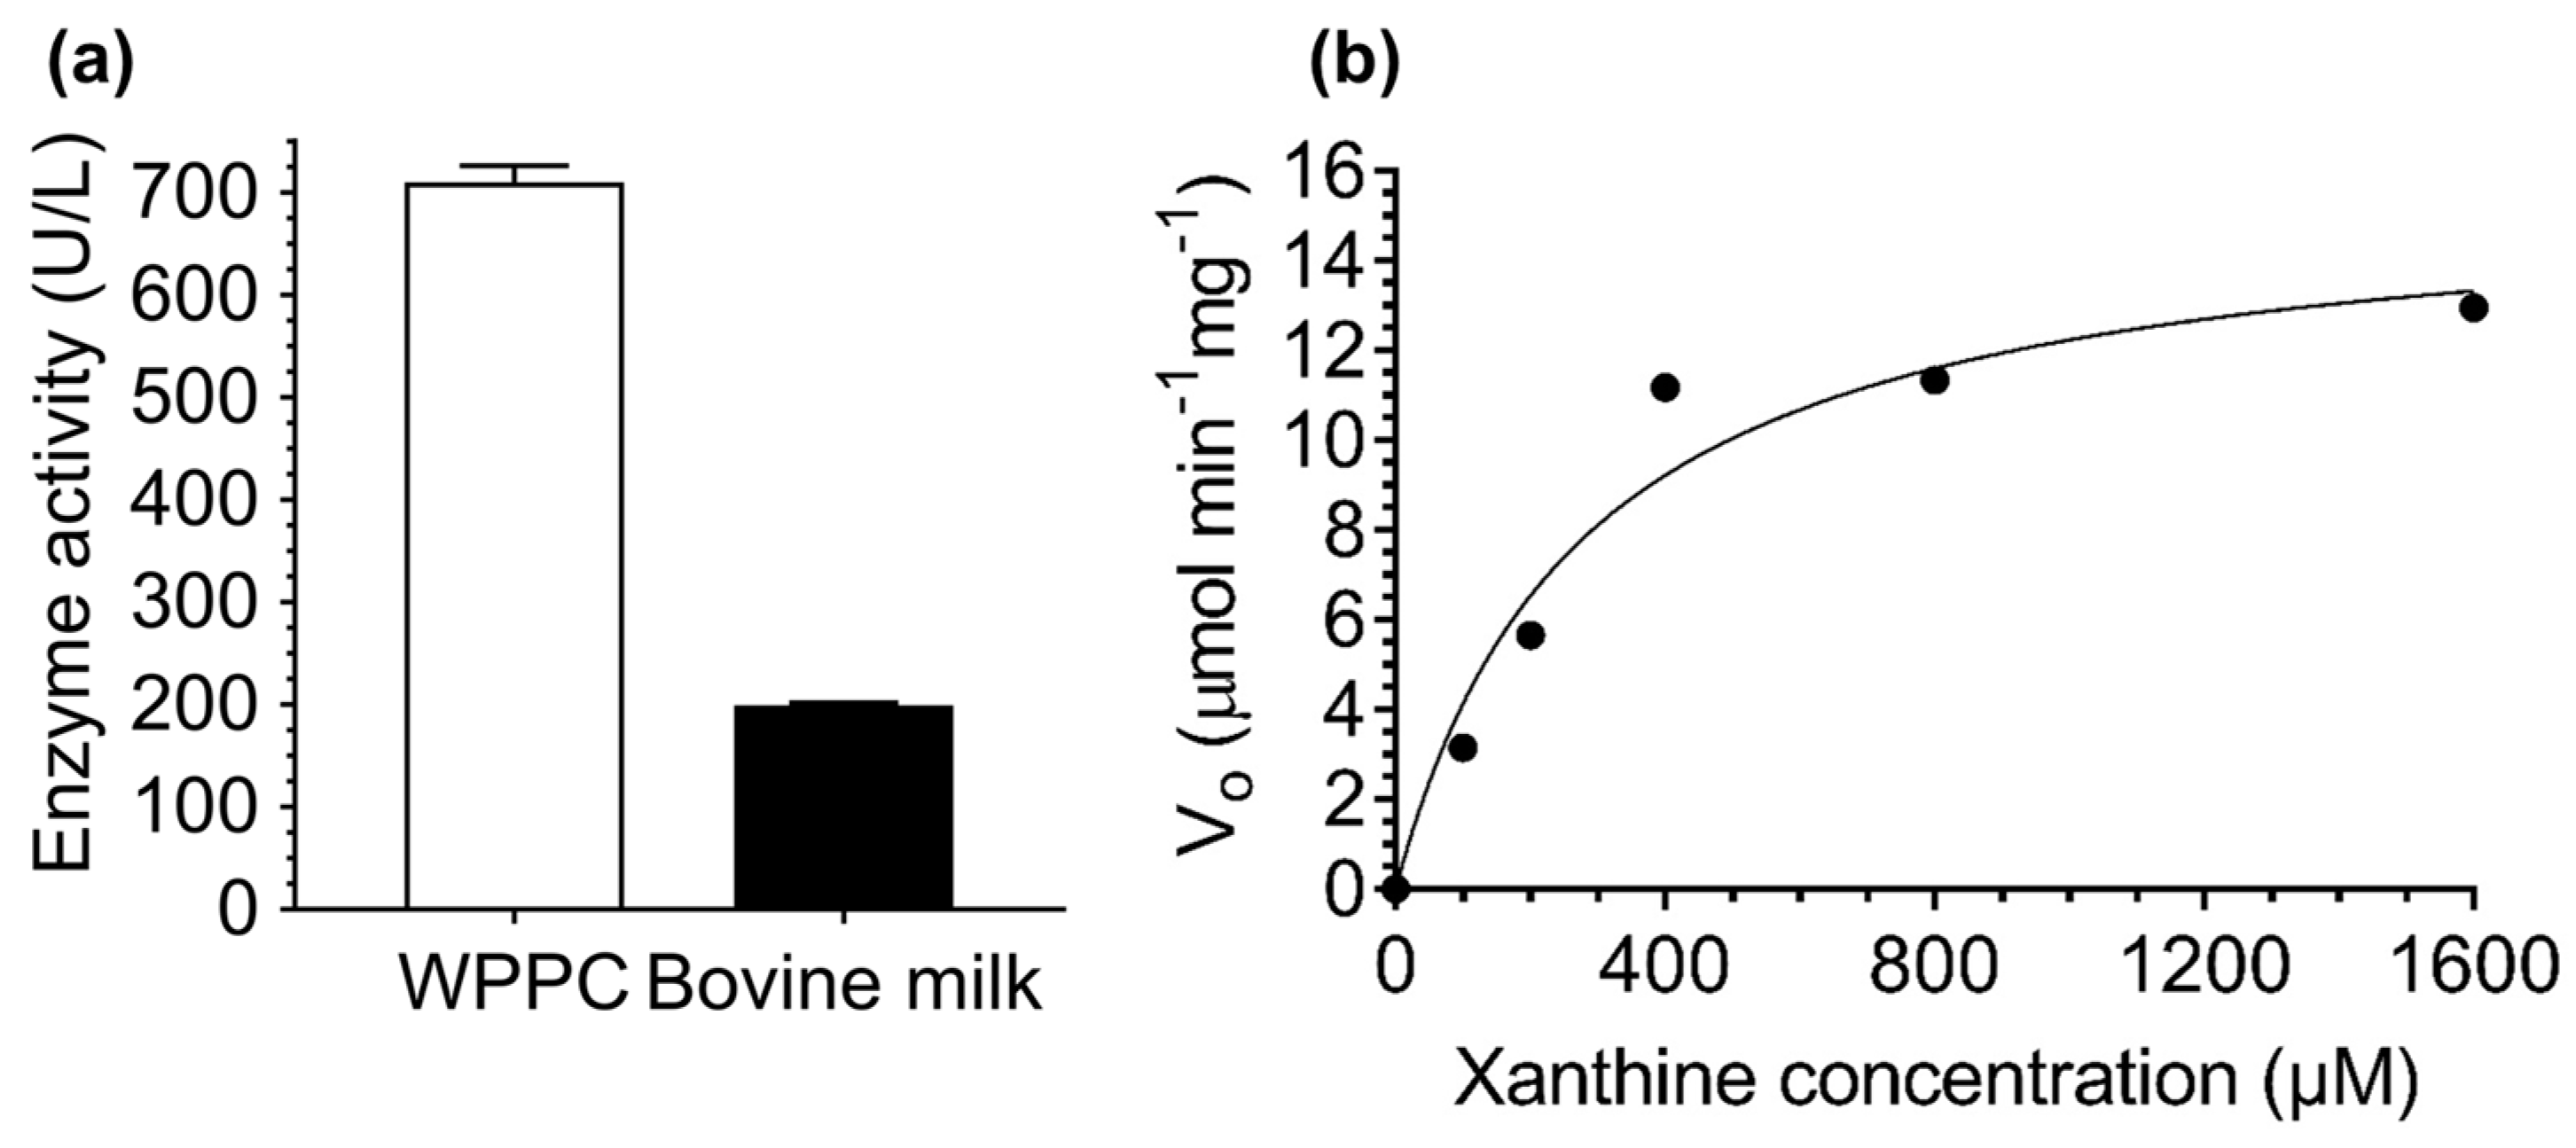
3.6. Determination of Xanthine Oxidase Activity and Kinetic Parameters in WPPC and a Comparison to Bovine Milk

Intrigued by the identification of xanthine oxidase as one of the abundant proteins in the WPPC, we assessed this enzyme’s activity by measuring the rate of oxidation of xanthine to uric acid in WPPC and compared it to bovine milk. Xanthine oxidase activity was 3.5× higher in WPPC than in bovine milk (Figure 6).
Xanthine oxidase works in combination with the lactoperoxidase system to produce reactive oxygen and nitrogen species that serve as antimicrobials in situ, thus protecting the mammary gland against mastitis and the offspring against bacterial infections [79,80,81,82]. A recent study demonstrated that when human milk interacts with infant saliva, the amount of H2O2 produced during nursing inhibits opportunistic pathogens’ growth. Infant saliva contains hypoxanthine and xanthine, which are substrates for xanthine oxidase activity. During nursing, the interaction between breast milk and infant saliva enables the production of antimicrobial reactive oxygen species, thus influencing the early oral microbiota and possibly the infant’s gut [18]. We recently showed that the bovine milk xanthine oxidase antimicrobial mechanism operates similarly to human milk [19].
Michaelis–Menten parameters (Km—denotes the affinity of the enzyme to the substrate, and Vmax—the maximum velocity of the reaction) were obtained by fitting the data to the Michaelis–Menten model. The direct plot was created by plotting the reaction rate (v) against the initial substrate concentration (S). Kinetic experiments revealed Km values of 267.2 μM and Vmax values of 21.64 μmol/min/mg for xanthine oxidase in WPPC (Figure 6). These results demonstrate that xanthine oxidase in WPPC has a high apparent affinity and activity for its substrate (xanthine), which is indicative of its antimicrobial activity. This work demonstrated the presence and remarkable activity of xanthine oxidase in WPPC, and revealed that WPPC should be considered a candidate for a variety of novel applications for human nutrition.

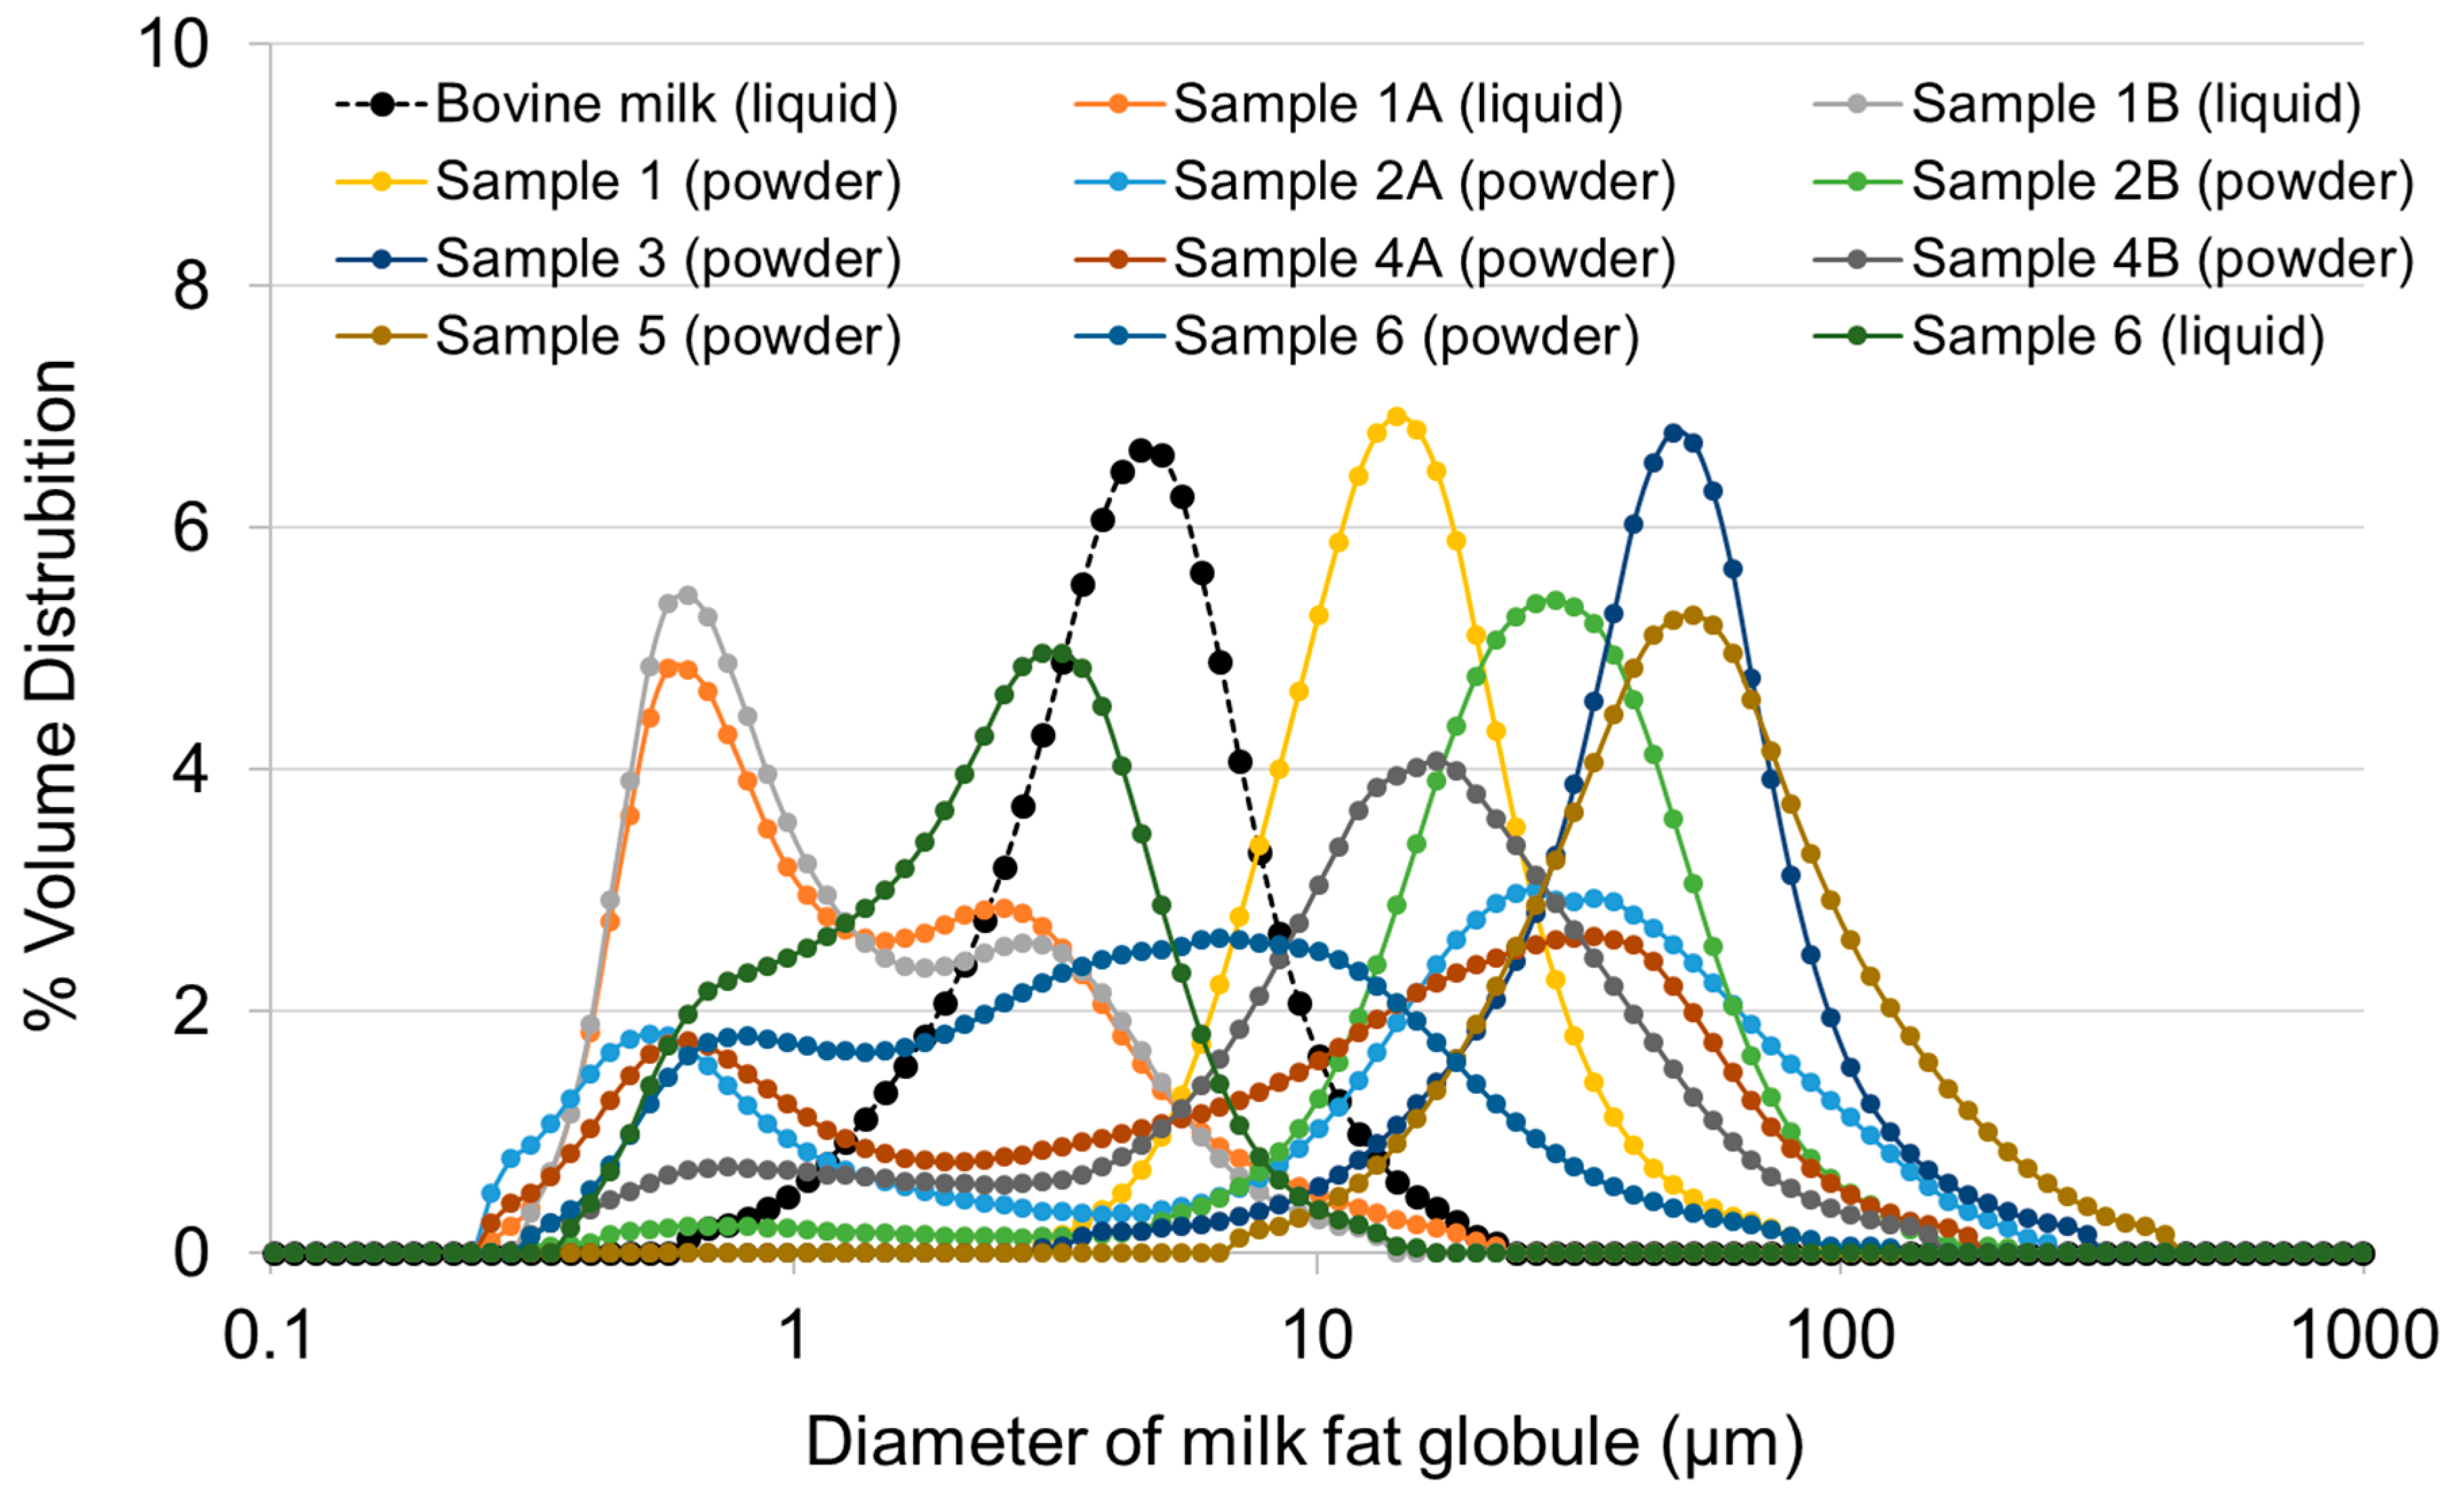
3.7. Measuring the Fat Globule Size in WPPC
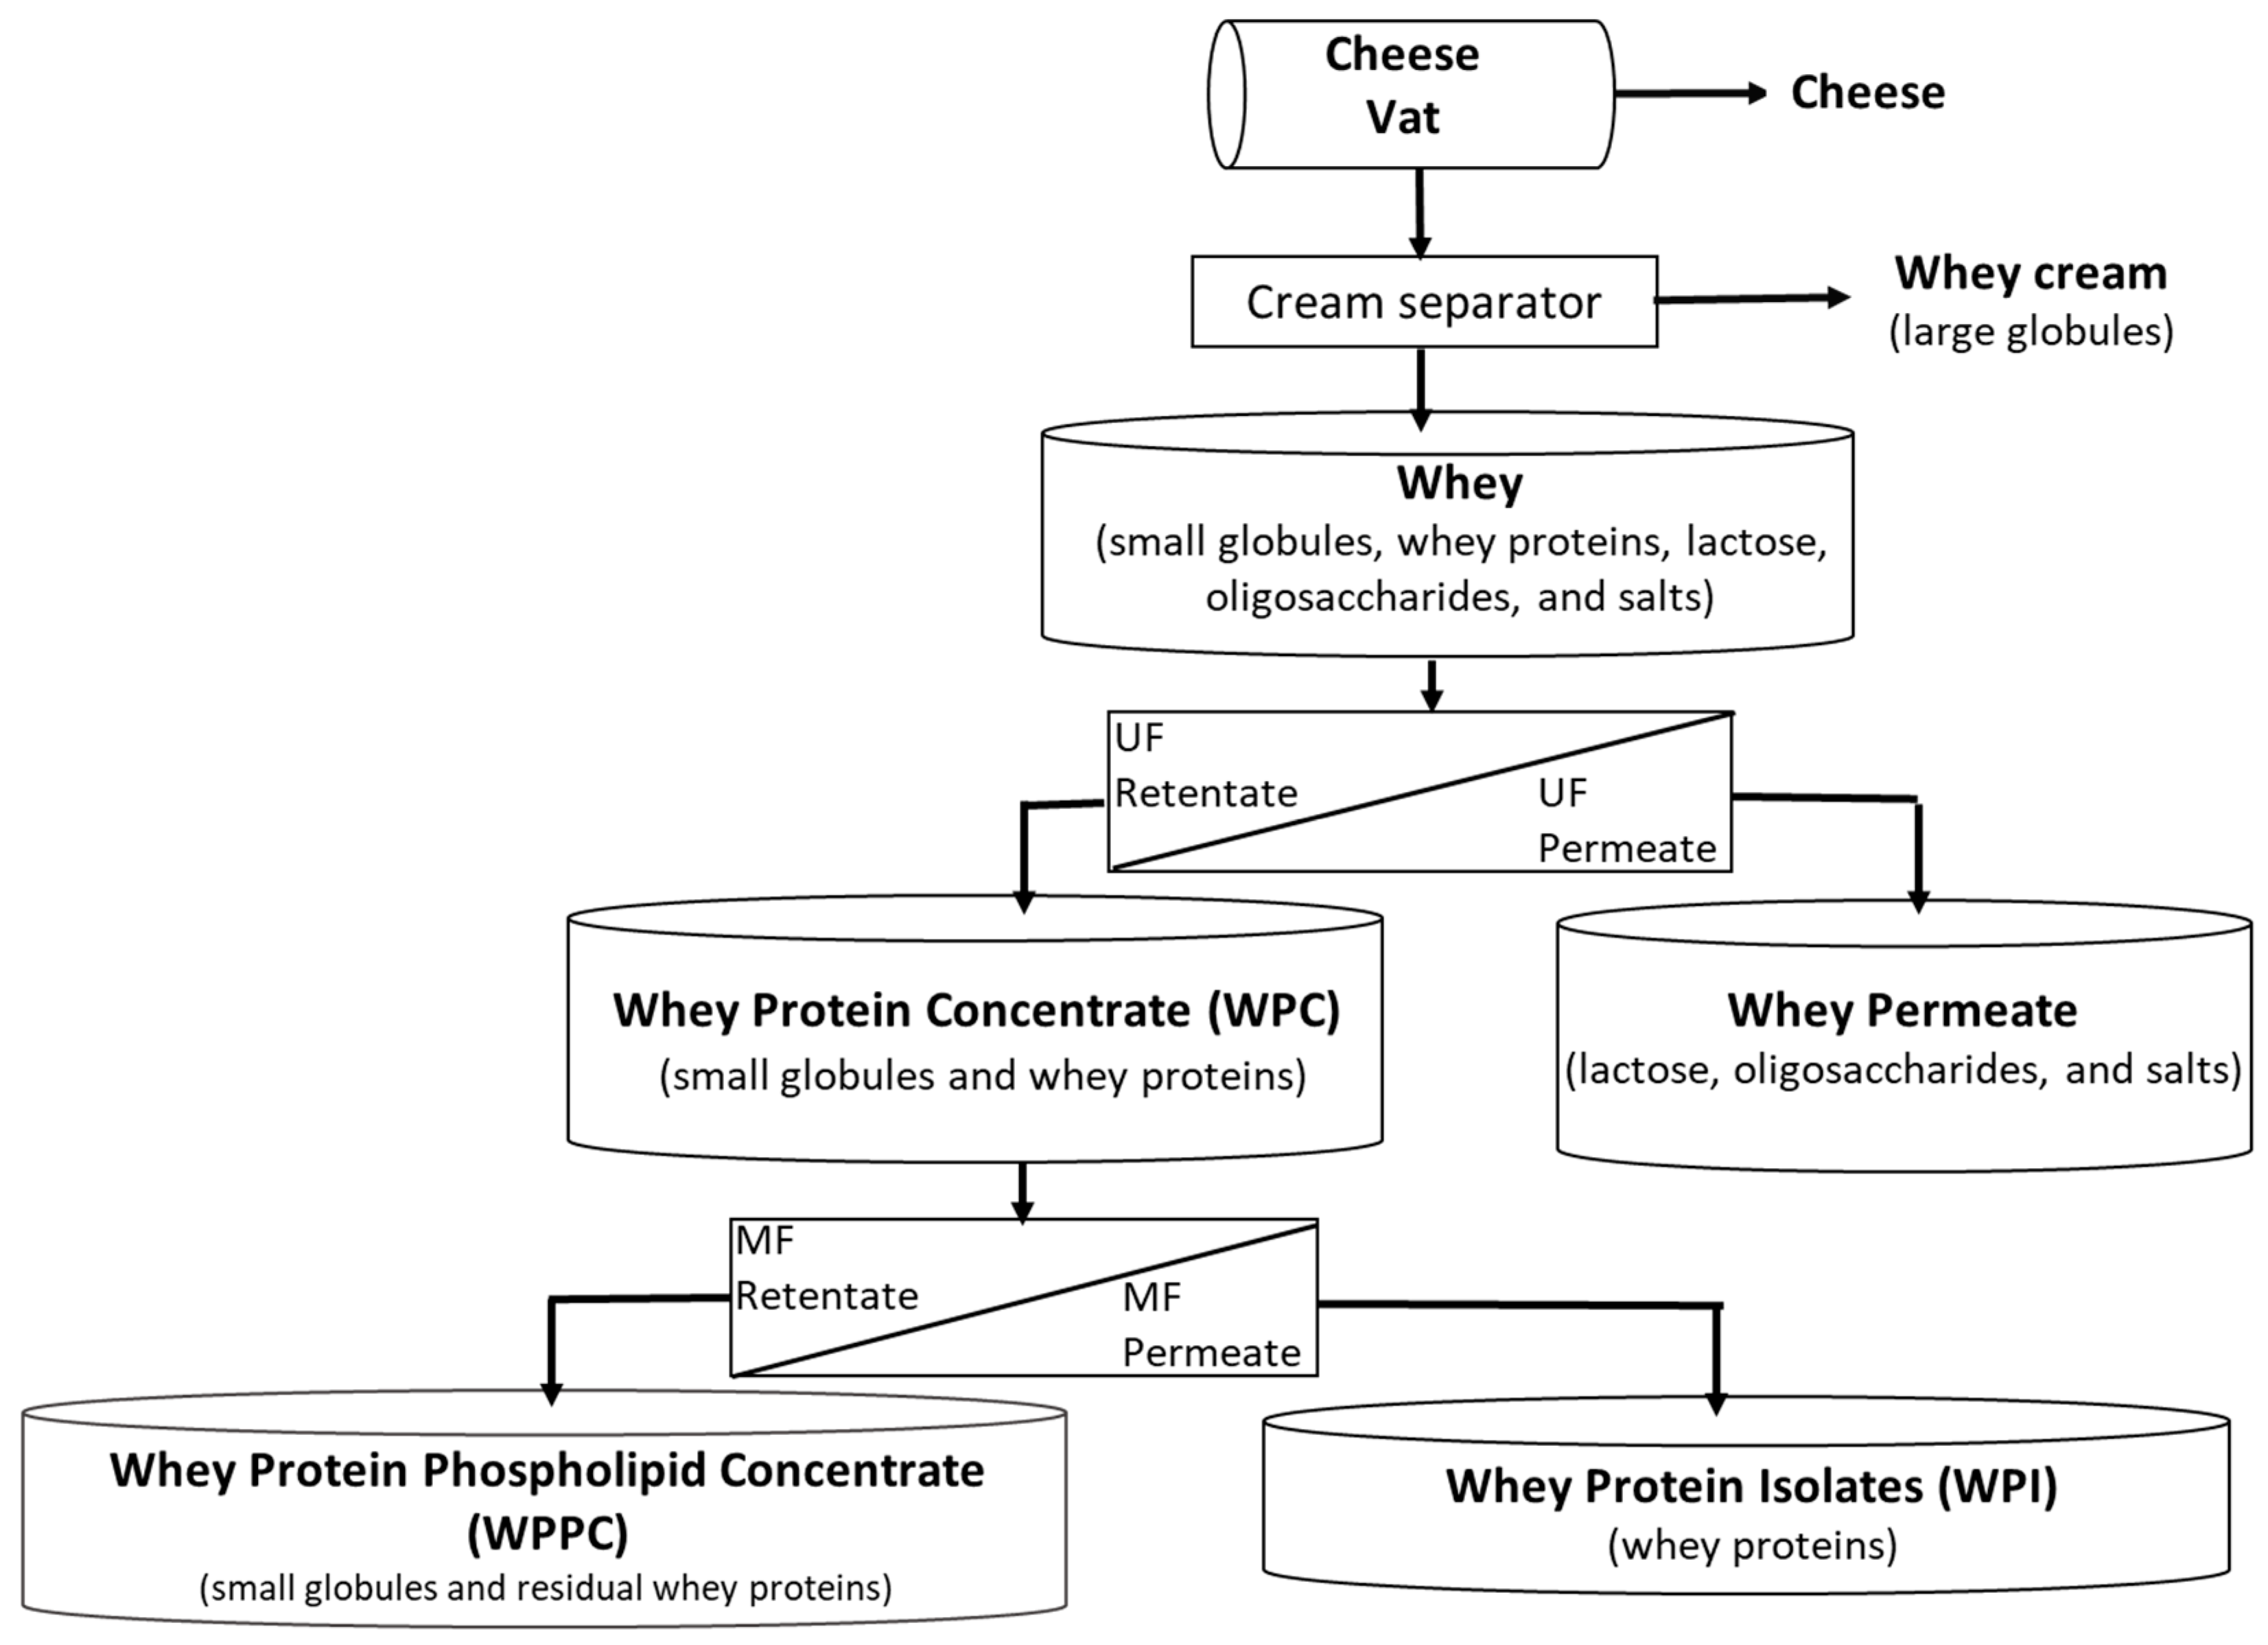
The process of WPPC production consists of three steps (Figure 1):
(i)
A centrifugal cream separator, which fractionates MFG by density, and removes the larger, less-dense MFG from the whey. The resulting whey contains 0.4 to 0.5% residual fat (small MFG);
(ii)
Ultrafiltration, 10 KDa cut off, separates whey proteins and small MFG from smaller molecules, such as lactose, oligosaccharides, and salts;
(iii)
Microfiltration with a 0.1 um pore size was used to produce highly purified whey protein WPI (permeate) by the dairy industry. As a result, there is a significant accumulation of small MFG and residual whey proteins in the microfiltration retentate.
Because large MFG had already been removed in step (i), we hypothesized that the microfiltration retentate (or WPPC) would contain smaller MFGs. Therefore, we measured the size of the MFG in liquid WPPC and compared it with bovine milk. The mean diameter of the MFGs was much smaller in liquid WPPC (2.09 ± 0.10, 1.75 ± 0.02, and 2.64 ± 0.01 µm) (Table S1) than in bovine milk (4.04 ± 0.04 µm) (Table S1). This result is consistent with our findings that the SDS-PAGE band corresponding to xanthine oxidase was visibly more intense in WPPC than in bovine milk, suggesting that WPPC is a source of smaller MFGs, and that the small MFGs had a higher density of membrane protein, such as xanthine oxidase, compared to the dairy products containing larger MFGs. This is an important finding that could have potential implications for developing functional foods or nutraceuticals from WPPC. The mean diameter of MFGs from all WPPC samples is shown in Table S1. Particle sizes ranged from 1.75–66.00 μm. Sample 1B (liquid) had the smallest mean diameter (1.75 ± 0.02), while the powder samples (e.g., sample 5) had the highest mean diameter (66.00 ± 0.92). When comparing the mean diameter of MFGs in liquid samples and powder samples from the same producer, we observed an increase in mean diameter from 1.75 μm to 15.85 μm in powder samples from manufacturer 1, and 2.64 μm to 8.14 μm in powder samples from manufacturer 6 (Table S1). This difference is likely attributed to the formation of aggregates with whey proteins and residual caseins caused by spray drying. The drying process is known to cause a range of structural and physicochemical modifications, which influence the reconstitution and absorption of milk proteins, resulting in increased MFG sizes [83].
We also compared the fat globule size distributions obtained from all WPPC samples with raw bovine milk samples (Figure 7), in which the size distribution of MFGs was plotted as volume distribution percent versus the diameter of MFG (μm). Liquid WPPC samples displayed two peaks, indicating that they contain both small and large MFGs, while bovine milk only displayed on peak, albeit with a larger size.
The size of fat globules may influence MFG biological activities [80]. For example, a prior comparison of the protein composition of small (3.3 ± 1.2 µm) and large (7.6 ± 0.9 µm) MFG fractions obtained by the centrifugation of bovine milk revealed that the smaller MFG contained a higher abundance of platelet glycoprotein 4 (CD36) and mucins (MUC1, MUC15, and MUC16) [84].
The separation of milk fat globules as a function of their size requires the use of efficient technological processes. Most of the research for the fractionation of MFG size focuses on the density and size-based fractionation, and shear processing. For example, a microfiltration membrane with various pore sizes was used to fractionate whole milk (average diameter of 4.2 μm) into streams of smaller and larger MFGs with size ranges of 0.9–3.3 μm and 5–7.5 μm, respectively [85]. However, this method is not commercially viable due to membrane fouling. A recent study demonstrated the size-based fractionation of native milk fat globules by two-stage centrifugal separation, and this double separation method was able to create streams as small as 1.35 μm and as large as 4.28 μm without affecting the droplet integrity [86]. However, the method has not been explored at the industrial scale.

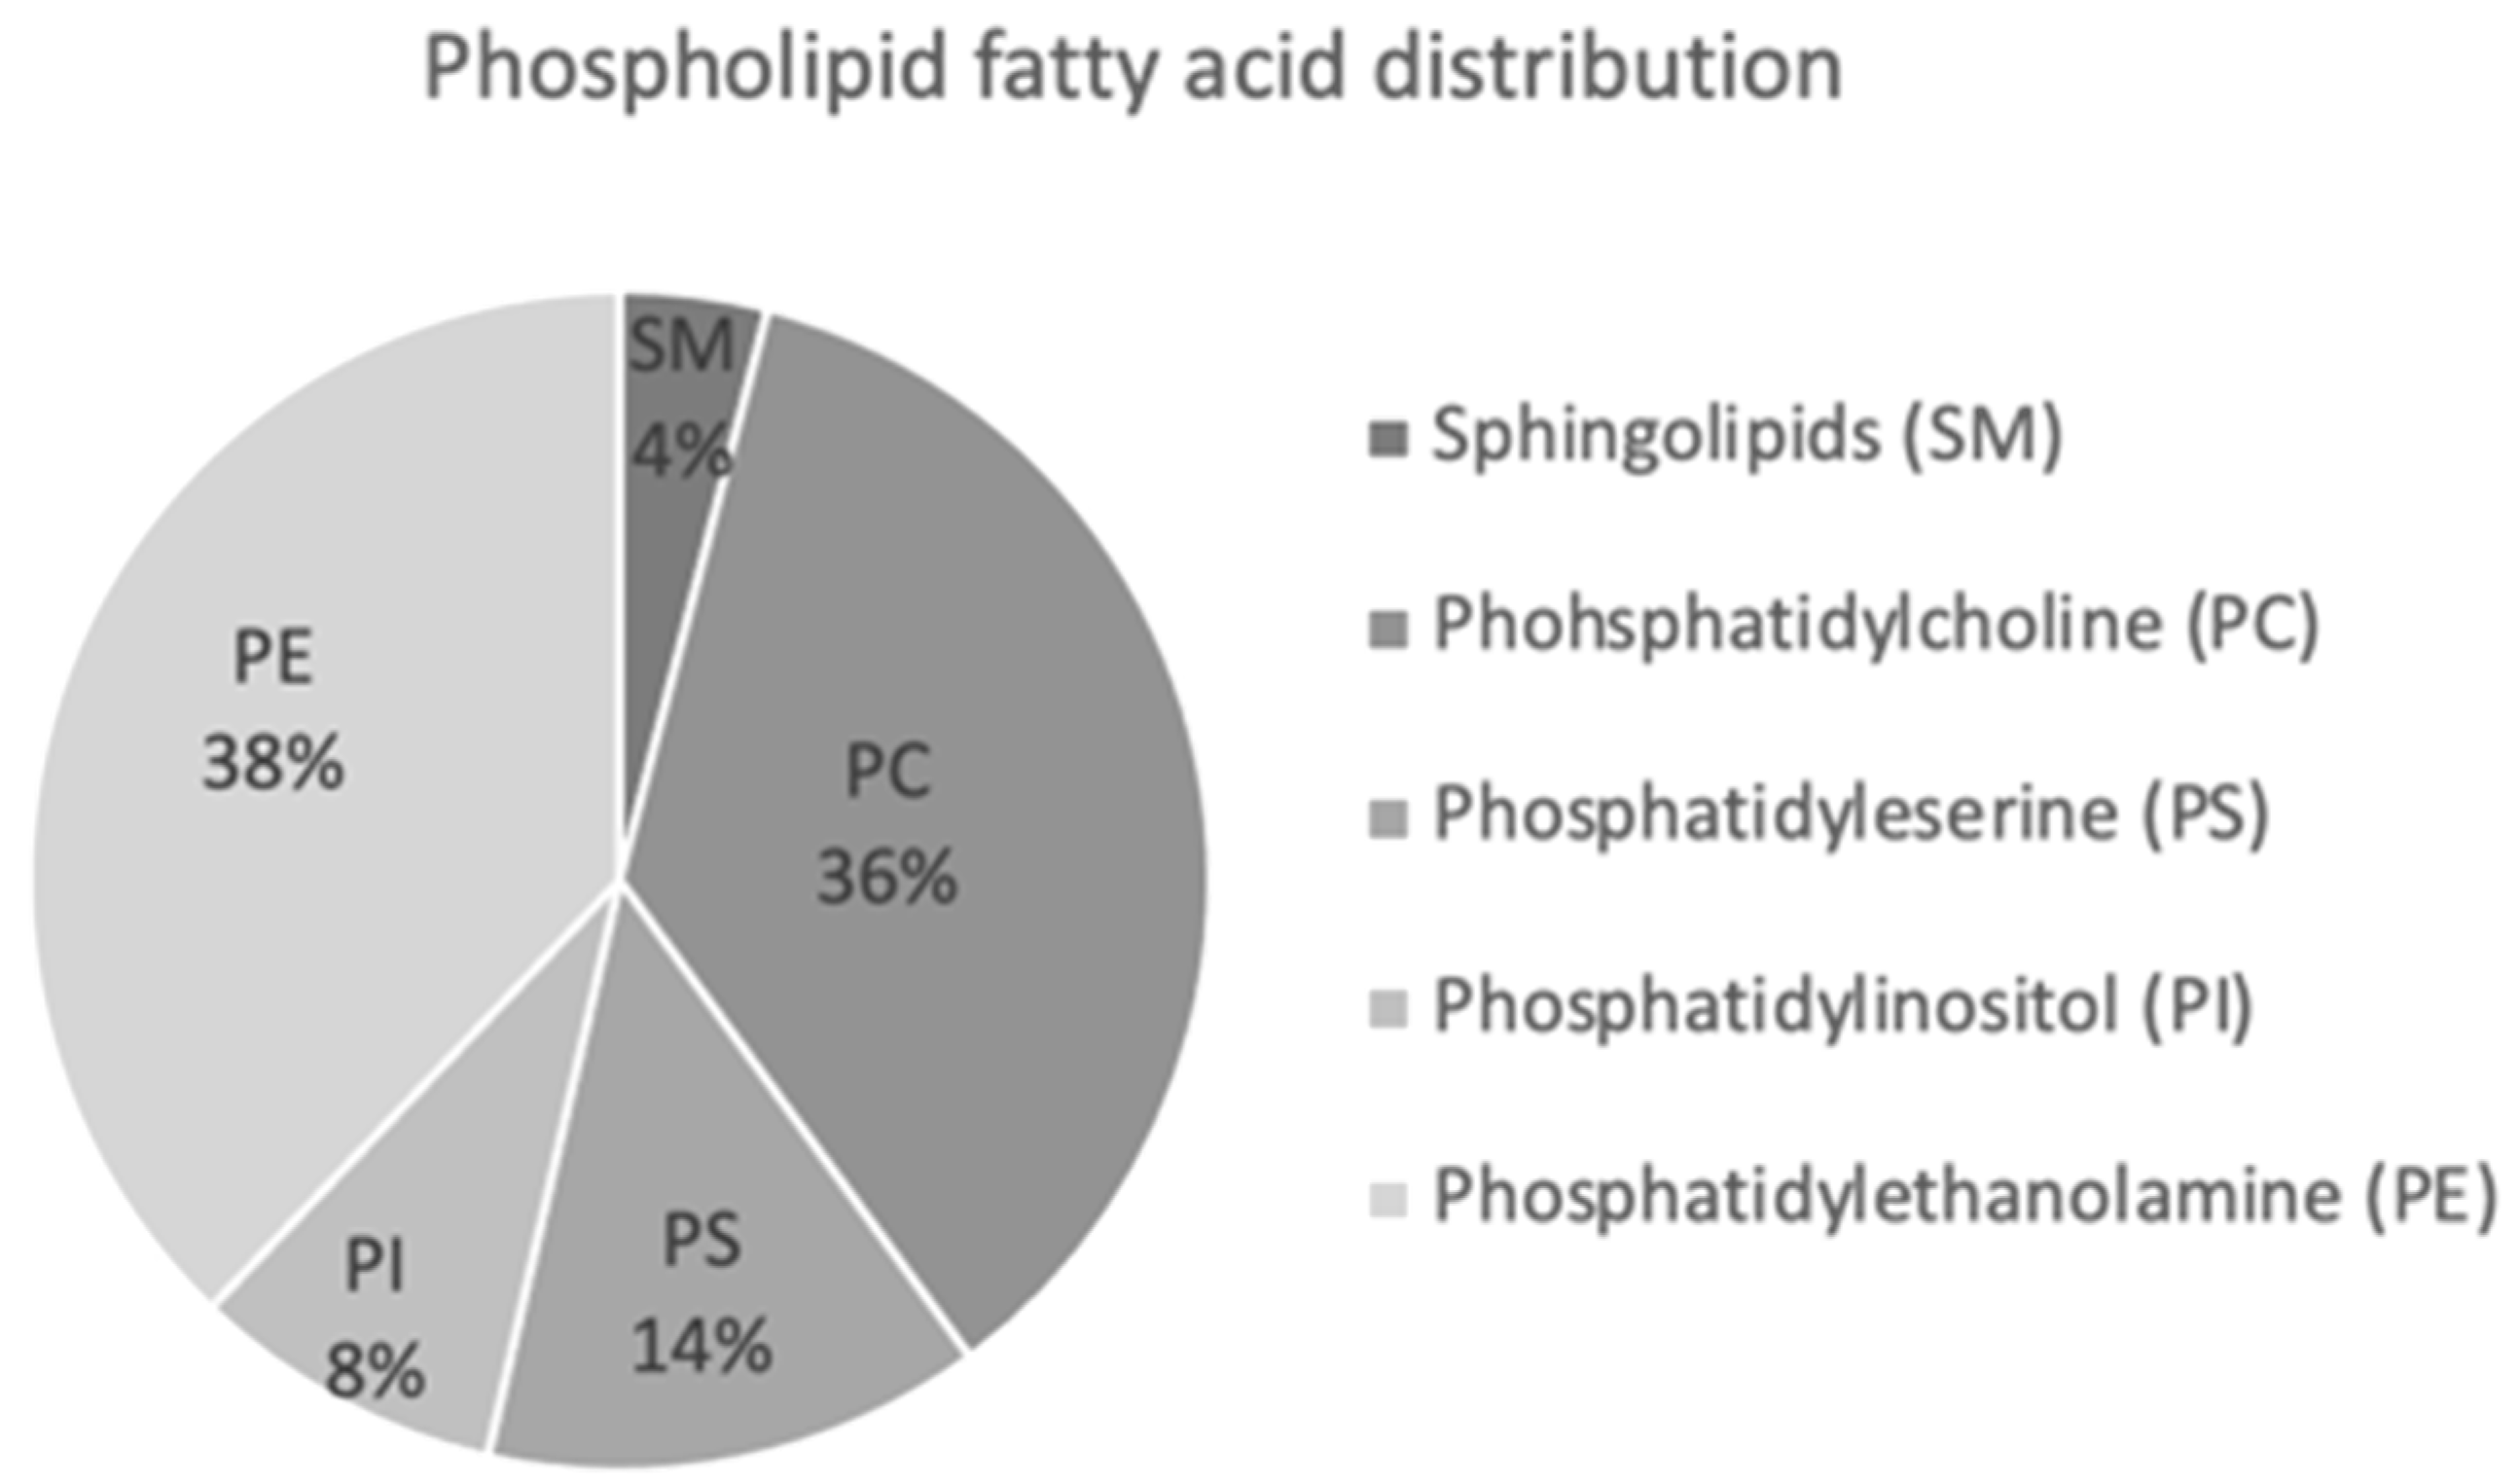
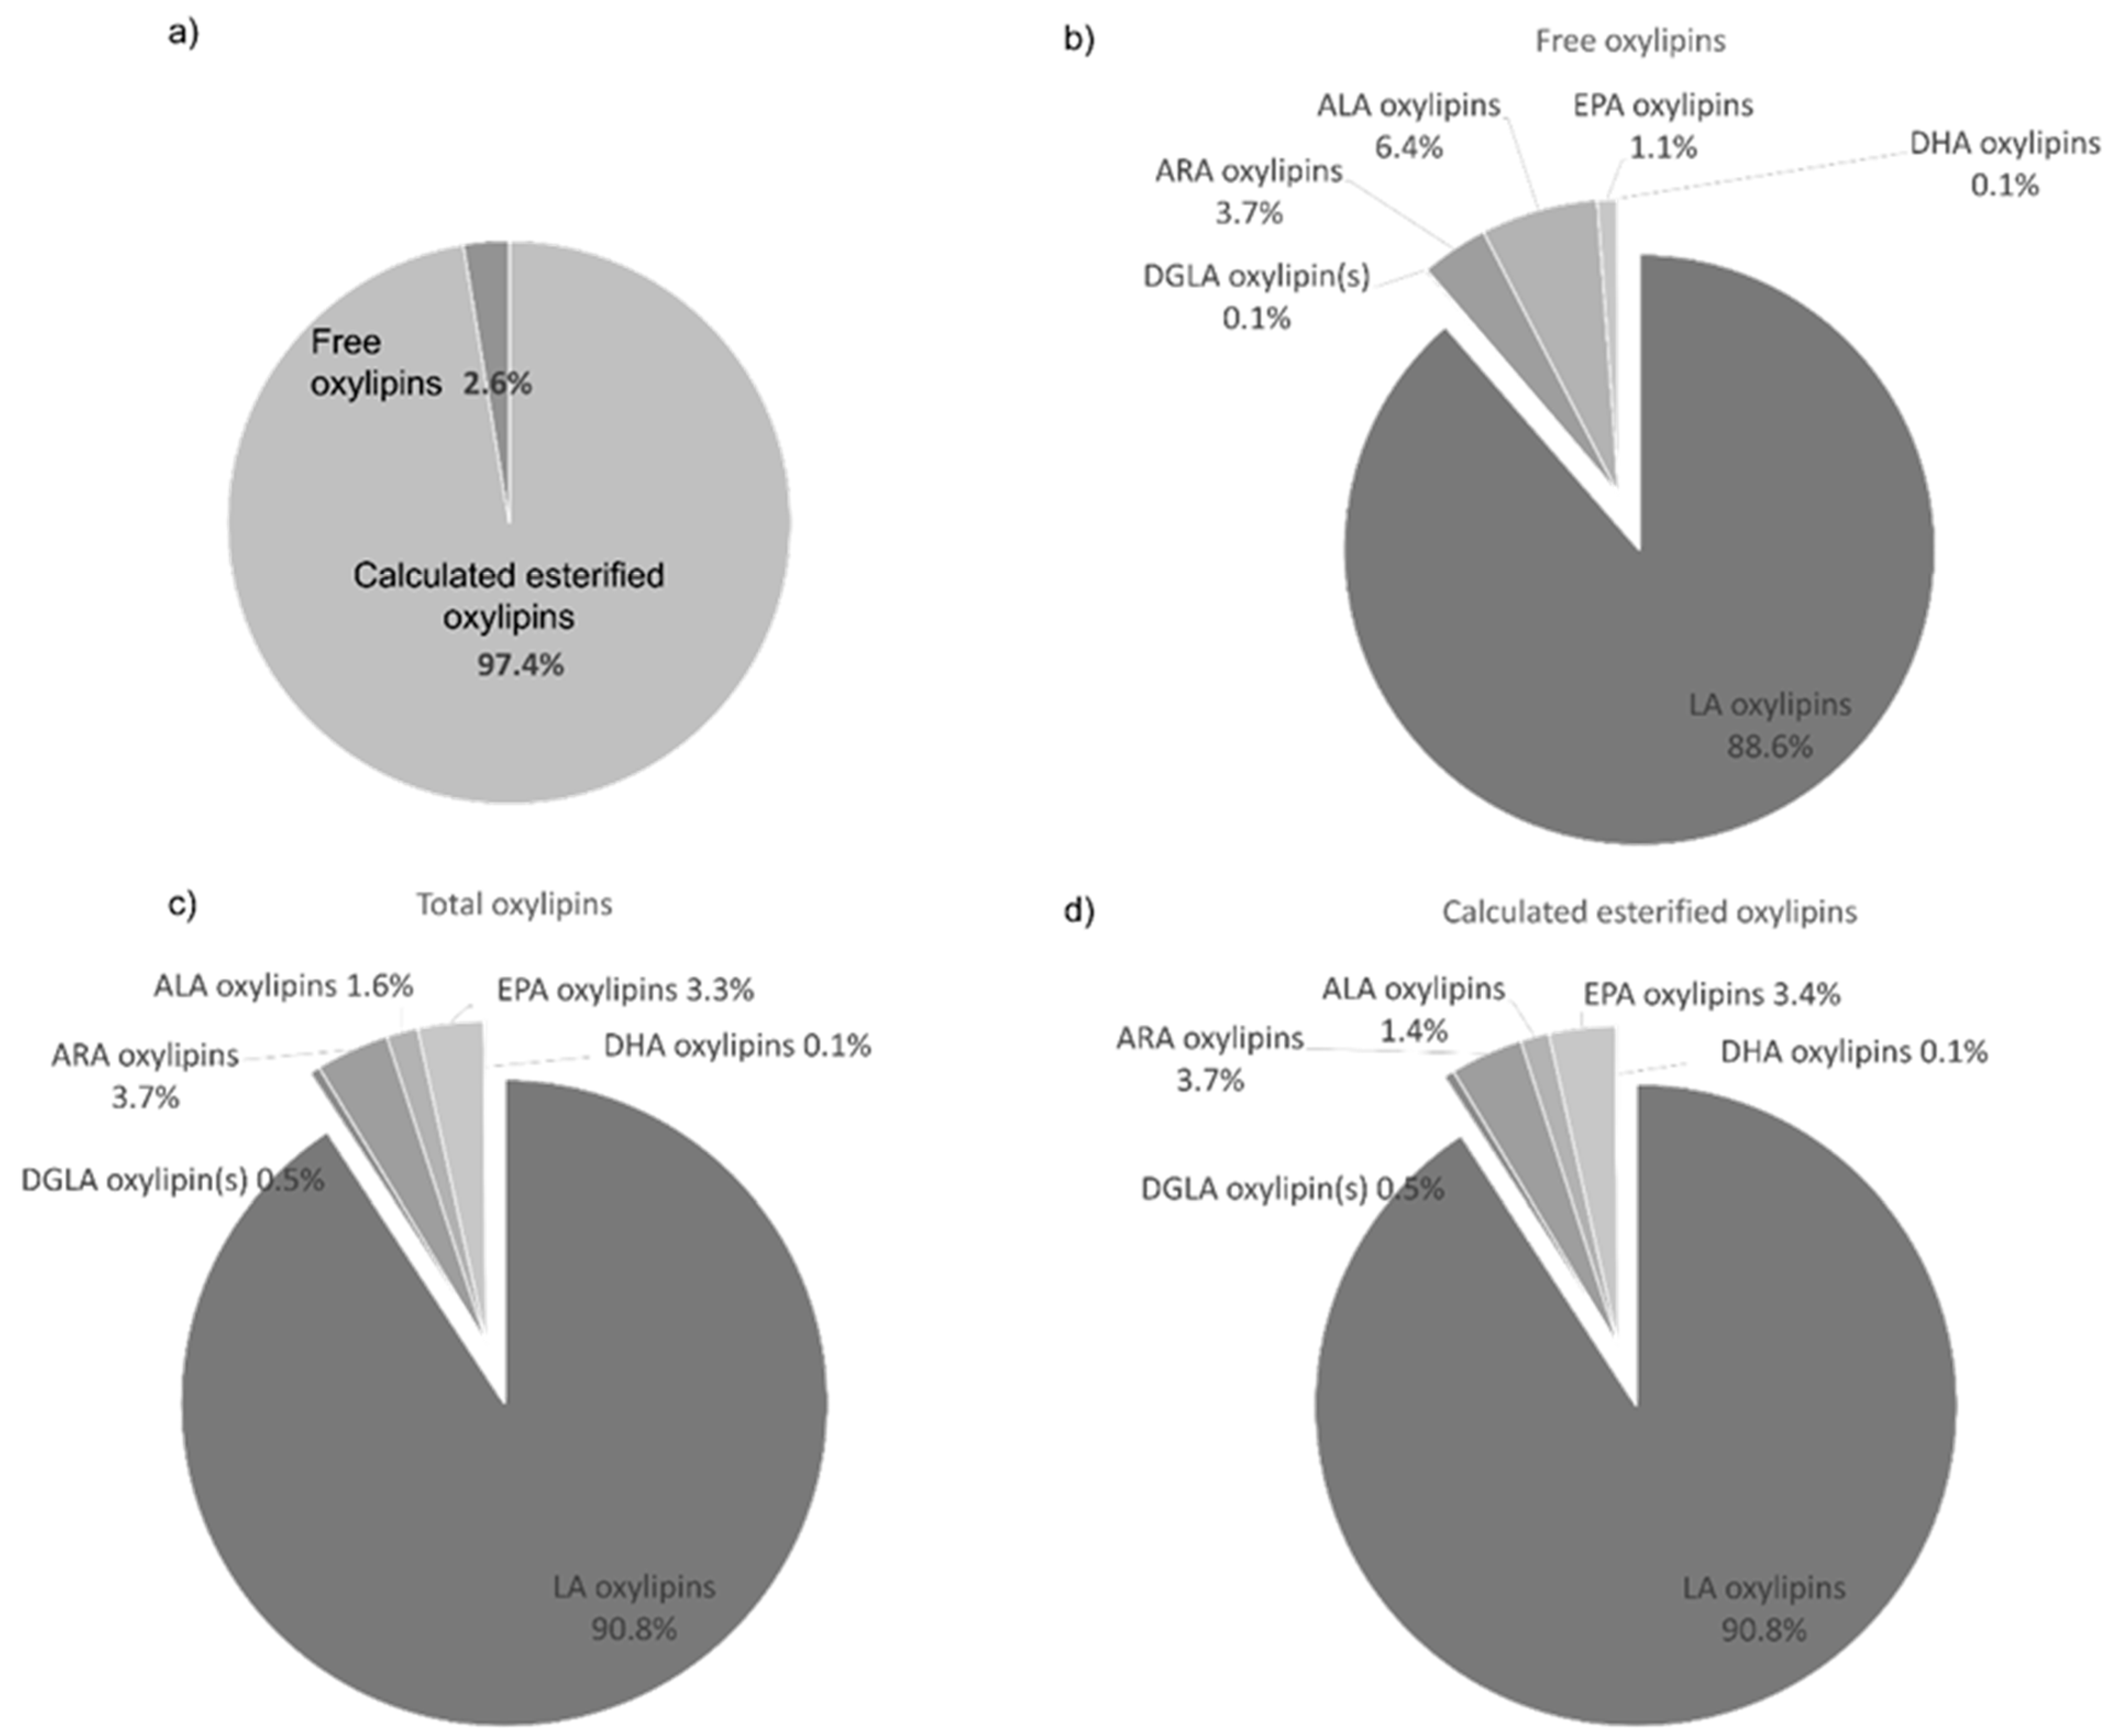
3.8. Lipidomic Analysis

Cholesterol was detected at a concentration of 6.77 mg/g. Total fatty acid concentrations (in the total lipid extract) were 123.9 mg/g. This suggests that fatty acids make up the majority of lipids in WPPC. The fatty acid data per lipid fraction are presented in Table 3 and Table S3. Several fatty acids were detected within the total fatty acid pool. The most abundant were myristate (14:0), palmitate (16:0), stearate (18:0), and oleate (18:1n-9), which constituted 10.8, 36.1, 11.7, and 24.8 percent of the total fatty acids. Polyunsaturated fatty acids (PUFAs) were also detected, the main one being linoleic acid (18:2n-6; LNA) at 5%. Other fatty acids, including alpha-linolenic acid (18:3n-3, ALA), arachidonic acid (20:4n-6, ARA), eicosapentaenoic acid (20:5n-3, EPA), and docosahexaenoic acid (22:6n-3, DHA) were present at 0.1–0.5% of total fatty acids.
PC and PE were the most abundant phospholipids in the sample (a concentration of ~9 mg/g each as of their fatty acid content) (Table 3, Table S3 and Figure 8). PS and PI were less abundant, at 2.1–3.3 mg/g, followed by sphingolipids (SLs) containing sphingomyelin (SM) at 1.0 mg/g as of their fatty acid content. These phospholipids accounted for 20% of the total fatty acids measured in WPPC total lipid extracts, suggesting that other lipid species are likely present (e.g., triglycerides).
Because the WPPC fraction is high in lipids, we explored fatty acids within each fraction. The major fatty acids in the total fatty acid fraction was reflected in PC, PS PI, PE (e.g., palmitate and others), and SM, but to varying degrees. For instance, palmitate was much more enriched in PC (43%), compared to PE (13.6%), PI (10.2%), and PS (4.4%) (Table 3 and Table S3).
The total oxylipins (i.e., free + esterified) and free oxylipins were measured in WPPC. As shown in Table 4 and Figure 9, most oxylipins were concentrated in the total compared to the free pool. This suggests that the majority of oxylipins in WPPC are bound. The bound pool is thought to represent a delivery system for free bioactive oxylipins during digestion [87]. The findings are consistent with our prior study showing that in bovine milk, up to 95% of oxylipins are bound [51]. The majority of oxylipins detected in both the total and free pool were derived from linoleic acid. However, many oxylipins derived from eicosapentaenoic acid and docosahexaenoic acid were observed. This is important because these omega-3 derived oxylipins are highly bioactive and anti-inflammatory. Their presence in the WPPC suggests that this fraction could be used as a natural source of anti-inflammatory oxylipins.

4. Conclusions

This study investigated the composition of WPPC obtained from several commercial dairy manufacturers, with particular emphasis on the bioactive components. By employing glycoproteomic and lipidomic techniques, we demonstrated that WPPC contained relatively higher levels of bioactive glycosylated proteins, including MFGM proteins, which represented 23% of the total protein, and that phospholipids accounted for 20% of the total fatty acid pool in WPPC, which also contained many anti-inflammatory oxylipins derived from EPA and DHA in both the free and bound forms. Of relevance, xanthine oxidase, an antimicrobial enzyme, was found in relatively high abundance. The activity of xanthine oxidase was 3.5 times higher in WPPC, compared to bovine milk. We also demonstrated, for the first time to our knowledge, the presence of small (2.64 ± 0.01 µm) MFGs in WPPC and offered a comprehensive view of this co-product as a vehicle to provide a more functional ensemble of components, such as small MFGs and glycoproteins. Since smaller globules are expected to contain more antimicrobial glycoproteins and have increased surface area to provide a decoy effect for pathogens, future studies should aim to elucidate the impact of small MFGs and MFGM components on human health. WPPC is readily available and can serve as a source of functional compounds for novel product development to improve human health and pursue innovations beyond the traditional vision of dairy components used for nutritional purposes. Overall, the possibility of harvesting value from novel by-products, which are rapidly accumulating in different branches of the dairy industry, can ensure their efficient use and aid the suitability of the industry. However, since this work and others [56] have pointed out that the composition of WPPC is rather variable between suppliers and lots, (which can be caused by multiple factors, including the time of year, animal diets, genetics, and the processing itself), standardization in the dairy industry might become necessary to provide consistency in the overall composition and ensure successful applications.

Supplementary Materials

The following supporting information can be downloaded at: https://www.mdpi.com/article/10.3390/dairy3020022/s1, Figure S1: SDS-PAGE of whey protein phospholipid concentrate (WPPC) (sample 6B) and raw bovine milk; Table S1: Comparison of the volume mean diameter and size range of the fat globule population measured from all WPPC samples; Table S2: Proteins identified in whey protein phospholipid concentrate (WPPC); Table S3: Fatty acid composition per lipid fraction (%) for sample 1.

Author Contributions

Conceptualization, D.B., G.O. and A.Y.T.; methodology, D.B., A.Y.T., G.O., N.L., M.B., R.C.R., S.S., Y.-P.H., and B.P.; writing—original draft preparation, G.O. and N.L.; writing—review and editing, D.B., G.O., N.L., R.C.R., M.B., Y.-P.H., and A.Y.T.; funding acquisition, D.B. All authors have read and agreed to the published version of the manuscript.

Funding

This research was funded by the National Dairy Council and the California Dairy Research Foundation and the U.S. Department of Agriculture, project CA-D-FST-2187-H.

Institutional Review Board Statement

Not applicable.

Informed Consent Statement

Not applicable.

Data Availability Statement

All of the data is provided in the article or supplementary material.

Acknowledgments

The authors would like to acknowledge Nitin Nitin and Rewa Rai in the UCD Food Science Department for their technical assistance with the particle size analyses.

Conflicts of Interest

The authors declare no conflict of interest. The funders had no role in the design of the study; in the collection, analyses, or interpretation of data; in the writing of the manuscript, or in the decision to publish the results.

References

  1. Hinde, K.; German, J.B. Food in an Evolutionary Context: Insights from Mother’s Milk. J. Sci. Food Agric. 2012, 92, 2219–2223. [Google Scholar] [CrossRef] [PubMed] [Green Version]
  2. Barile, D.; Tao, N.; Lebrilla, C.B.; Coisson, J.-D.; Arlorio, M.; German, J.B. Permeate from Cheese Whey Ultrafiltration Is a Source of Milk Oligosaccharides. Int. Dairy J. 2009, 19, 524–530. [Google Scholar] [CrossRef] [Green Version]
  3. Charbonneau, M.R.; O’Donnell, D.; Blanton, L.V.; Totten, S.M.; Davis, J.C.C.; Barratt, M.J.; Cheng, J.; Guruge, J.; Talcott, M.; Bain, J.R.; et al. Sialylated Milk Oligosaccharides Promote Microbiota-Dependent Growth in Models of Infant Undernutrition. Cell 2016, 164, 859–871. [Google Scholar] [CrossRef] [PubMed] [Green Version]
  4. Pennisi, E. Gut Microbes May Help Malnourished Children. Science 2019, 365, 109. [Google Scholar] [CrossRef] [PubMed]
  5. Dewettinck, K.; Rombaut, R.; Thienpont, N.; Le, T.T.; Messens, K.; Van Camp, J. Nutritional and Technological Aspects of Milk Fat Globule Membrane Material. Int. Dairy J. 2008, 18, 436–457. [Google Scholar] [CrossRef]
  6. Lee, H.; Padhi, E.; Hasegawa, Y.; Larke, J.; Parenti, M.; Wang, A.; Hernell, O.; Lönnerdal, B.; Slupsky, C. Compositional Dynamics of the Milk Fat Globule and Its Role in Infant Development. Front. Pediatr. 2018, 6, 313. [Google Scholar] [CrossRef] [Green Version]
  7. Fontecha, J.; Brink, L.; Wu, S.; Pouliot, Y.; Visioli, F.; Jiménez-Flores, R. Sources, Production, and Clinical Treatments of Milk Fat Globule Membrane for Infant Nutrition and Well-Being. Nutrients 2020, 12, 1607. [Google Scholar] [CrossRef]
  8. Michalski, M.-C.; Briard, V.; Michel, F. Optical Parameters of Milk Fat Globules for Laser Light Scattering Measurements. Le Lait 2001, 81, 787–796. [Google Scholar] [CrossRef]
  9. Wiking, L.; Stagsted, J.; Björck, L.; Nielsen, J.H. Milk Fat Globule Size Is Affected by Fat Production in Dairy Cows. Int. Dairy J. 2004, 14, 909–913. [Google Scholar] [CrossRef]
  10. Heid, H.W.; Keenan, T.W. Intracellular Origin and Secretion of Milk Fat Globules. Eur. J. Cell Biol. 2005, 84, 245–258. [Google Scholar] [CrossRef]
  11. Argov, N.; Lemay, D.G.; German, J.B. Milk Fat Globule Structure and Function: Nanoscience Comes to Milk Production. Trends Food Sci. Technol. 2008, 19, 617–623. [Google Scholar] [CrossRef] [PubMed] [Green Version]
  12. Fong, B.Y.; Norris, C.S.; MacGibbon, A.K.H. Protein and Lipid Composition of Bovine Milk-Fat-Globule Membrane. Int. Dairy J. 2007, 17, 275–288. [Google Scholar] [CrossRef]
  13. Riccio, P. The Proteins of the Milk Fat Globule Membrane in the Balance. Trends Food Sci. Technol. 2004, 15, 458–461. [Google Scholar] [CrossRef]
  14. Brink, L.R.; Lönnerdal, B. The Role of Milk Fat Globule Membranes in Behavior and Cognitive Function Using a Suckling Rat Pup Supplementation Model. J. Nutr. Biochem. 2018, 58, 131–137. [Google Scholar] [CrossRef]
  15. Favre, L.; Bosco, N.; Roggero, I.S.; Corthésy, B.; Benyacoub, J. Combination of Milk Fat Globule Membranes and Probiotics to Potentiate Neonatal Immune Maturation and Early Life Protection. Pediatr. Res. 2011, 70, 439. [Google Scholar] [CrossRef] [Green Version]
  16. Zhang, L.; Chichlowski, M.; Gross, G.; Holle, M.J.; lbarra-Sánchez, L.A.; Wang, S.; Miller, M.J. Milk Fat Globule Membrane Protects Lactobacillus Rhamnosus GG from Bile Stress by Regulating Exopolysaccharide Production and Biofilm Formation. J. Agric. Food Chem. 2020, 68, 6646–6655. [Google Scholar] [CrossRef]
  17. Mather, I.H. A Review and Proposed Nomenclature for Major Proteins of the Milk-Fat Globule Membrane. J. Dairy Sci. 2000, 83, 203–247. [Google Scholar] [CrossRef]
  18. Al-Shehri, S.S.; Knox, C.L.; Liley, H.G.; Cowley, D.M.; Wright, J.R.; Henman, M.G.; Hewavitharana, A.K.; Charles, B.G.; Shaw, P.N.; Sweeney, E.L.; et al. Breastmilk-Saliva Interactions Boost Innate Immunity by Regulating the Oral Microbiome in Early Infancy. PLoS ONE 2015, 10, e0135047. [Google Scholar] [CrossRef] [Green Version]
  19. Ozturk, G.; Shah, I.M.; Mills, D.A.; German, J.B.; de Moura Bell, J.M.L.N. The Antimicrobial Activity of Bovine Milk Xanthine Oxidase. Int. Dairy J. 2020, 102, 104581. [Google Scholar] [CrossRef]
  20. Navab, M.; Hama, S.; Hough, G.; Fogelman, A.M. Oral Synthetic Phospholipid (DMPC) Raises High-Density Lipoprotein Cholesterol Levels, Improves High-Density Lipoprotein Function, and Markedly Reduces Atherosclerosis in Apolipoprotein E-Null Mice. Circulation 2003, 108, 1735–1739. [Google Scholar] [CrossRef] [Green Version]
  21. Vors, C.; Joumard-Cubizolles, L.; Lecomte, M.; Combe, E.; Ouchchane, L.; Drai, J.; Raynal, K.; Joffre, F.; Meiller, L.; Barz, M.L.; et al. Milk Polar Lipids Reduce Lipid Cardiovascular Risk Factors in Overweight Postmenopausal Women: Towards a Gut Sphingomyelin-Cholesterol Interplay. Gut 2020, 69, 487–501. [Google Scholar] [CrossRef] [PubMed] [Green Version]
  22. Kamili, A.; Wat, E.; Chung, R.W.; Tandy, S.; Weir, J.M.; Meikle, P.J.; Cohn, J.S. Hepatic Accumulation of Intestinal Cholesterol Is Decreased and Fecal Cholesterol Excretion Is Increased in Mice Fed a High-Fat Diet Supplemented with Milk Phospholipids. Nutr. Metab. 2010, 7, 90. [Google Scholar] [CrossRef] [PubMed] [Green Version]
  23. Wat, E.; Tandy, S.; Kapera, E.; Kamili, A.; Chung, R.W.S.; Brown, A.; Rowney, M.; Cohn, J.S. Dietary Phospholipid-Rich Dairy Milk Extract Reduces Hepatomegaly, Hepatic Steatosis and Hyperlipidemia in Mice Fed a High-Fat Diet. Atherosclerosis 2009, 205, 144–150. [Google Scholar] [CrossRef]
  24. Wang, X.; Kong, X.; Qin, Y.; Zhu, X.; Qu, D.; Han, J. Milk Phospholipid Supplementation Mediates Colonization Resistance of Mice against Salmonella Infection in Association with Modification of Gut Microbiota. Food Funct. 2020, 11, 6078–6090. [Google Scholar] [CrossRef] [PubMed]
  25. Snow, D.R.; Ward, R.E.; Olsen, A.; Jimenez-Flores, R.; Hintze, K.J. Membrane-Rich Milk Fat Diet Provides Protection against Gastrointestinal Leakiness in Mice Treated with Lipopolysaccharide. J. Dairy Sci. 2011, 94, 2201–2212. [Google Scholar] [CrossRef] [PubMed] [Green Version]
  26. Lordan, R.; Zabetakis, I. Invited Review: The Anti-Inflammatory Properties of Dairy Lipids. J. Dairy Sci. 2017, 100, 4197–4212. [Google Scholar] [CrossRef] [PubMed]
  27. Zhang, P.; Li, B.; Gao, S.; Duan, R.-D. Dietary Sphingomyelin Inhibits Colonic Tumorigenesis with an Up-Regulation of Alkaline Sphingomyelinase Expression in ICR Mice. Anticancer Res. 2008, 28, 3631–3635. [Google Scholar]
  28. Pepeu, G.; Pepeu, I.M.; Amaducci, L. A Review of Phosphatidylserine Pharmacological and Clinical Effects. Is Phosphatidylserine a Drug for the Ageing Brain? Pharmacol. Res. 1996, 33, 73–80. [Google Scholar] [CrossRef]
  29. Cenacchi, T.; Bertoldin, T.; Farina, C.; Fiori, M.G.; Crepaldi, G. Cognitive Decline in the Elderly: A Double-Blind, Placebo-Controlled Multicenter Study on Efficacy of Phosphatidylserine Administration. Aging Milan Italy 1993, 5, 123–133. [Google Scholar] [CrossRef]
  30. Tomé-Carneiro, J.; Carmen Crespo, M.; Burgos-Ramos, E.; Tomas-Zapico, C.; García-Serrano, A.; Castro-Gómez, P.; Venero, C.; Pereda-Pérez, I.; Baliyan, S.; Valencia, A.; et al. Buttermilk and Krill Oil Phospholipids Improve Hippocampal Insulin Resistance and Synaptic Signaling in Aged Rats. Mol. Neurobiol. 2018, 55, 7285–7296. [Google Scholar] [CrossRef]
  31. Brink, L.R.; Gueniot, J.P.; Lönnerdal, B. Effects of Milk Fat Globule Membrane and Its Various Components on Neurologic Development in a Postnatal Growth Restriction Rat Model. J. Nutr. Biochem. 2019, 69, 163–171. [Google Scholar] [CrossRef] [PubMed]
  32. Tanaka, K.; Hosozawa, M.; Kudo, N.; Yoshikawa, N.; Hisata, K.; Shoji, H.; Shinohara, K.; Shimizu, T. The Pilot Study: Sphingomyelin-Fortified Milk Has a Positive Association with the Neurobehavioural Development of Very Low Birth Weight Infants during Infancy, Randomized Control Trial. Brain Dev. 2013, 35, 45–52. [Google Scholar] [CrossRef] [PubMed]
  33. Timby, N.; Domellöf, E.; Hernell, O.; Lönnerdal, B.; Domellöf, M. Neurodevelopment, Nutrition, and Growth until 12 Mo of Age in Infants Fed a Low-Energy, Low-Protein Formula Supplemented with Bovine Milk Fat Globule Membranes: A Randomized Controlled Trial. Am. J. Clin. Nutr. 2014, 99, 860–868. [Google Scholar] [CrossRef] [PubMed] [Green Version]
  34. Higgs, G.A.; Salmon, J.A.; Spayne, J.A. The Inflammatory Effects of Hydroperoxy and Hydroxy Acid Products of Arachidonate Lipoxygenase in Rabbit Skin. Br. J. Pharmacol. 1981, 74, 429–433. [Google Scholar] [CrossRef] [Green Version]
  35. Tian, Y.; Gou, J.; Zhang, H.; Lu, J.; Jin, Z.; Jia, S.; Bai, L. The Anti-Inflammatory Effects of 15-HETE on Osteoarthritis during Treadmill Exercise. Life Sci. 2021, 273, 119260. [Google Scholar] [CrossRef] [PubMed]
  36. Rosqvist, F.; Smedman, A.; Lindmark-Månsson, H.; Paulsson, M.; Petrus, P.; Straniero, S.; Rudling, M.; Dahlman, I.; Risérus, U. Potential Role of Milk Fat Globule Membrane in Modulating Plasma Lipoproteins, Gene Expression, and Cholesterol Metabolism in Humans: A Randomized Study. Am. J. Clin. Nutr. 2015, 102, 20–30. [Google Scholar] [CrossRef] [PubMed] [Green Version]
  37. Pesta, G.; Meyer-Pittroff, R.; Russ, W. Utilization of Whey. In Utilization of By-Products and Treatment of Waste in the Food Industry; Oreopoulou, V., Russ, W., Eds.; Springer: New York, NY, USA, 2007; pp. 193–207. ISBN 978-0-387-33511-7. [Google Scholar]
  38. Saxena, A.; Tripathi, B.P.; Kumar, M.; Shahi, V.K. Membrane-Based Techniques for the Separation and Purification of Proteins: An Overview. Adv. Colloid Interface Sci. 2009, 145, 1–22. [Google Scholar] [CrossRef]
  39. Bylund, G. Whey Processing. In Dairy Processing Handbook; Tetra Pak Processing Systems AB: Lund, Sweden, 2015. [Google Scholar]
  40. Burrington, K.J.; Schoenfuss, T.; Sonia, P. Technical Report: Coproducts of Milk and Whey Processing. Think USA Dairy by the U.S. Dairy Export Council. Available online: https://www.thinkusadairy.org/resources-and-insights/resources-and-insights/application-and-technical-materials/technical-report-coproducts-of-milk-and-whey-processing (accessed on 7 February 2022).
  41. Mollea, C.; Marmo, L.; Bosco, F. Valorisation of Cheese Whey, a By-Product from the Dairy Industry; IntechOpen: London, UK, 2013; ISBN 978-953-51-0911-2. [Google Scholar]
  42. Horwitz, W.; AOAC International. Official Methods of Analysis of AOAC International; AOAC International: Rockville, MA, USA, 2003. [Google Scholar]
  43. Gundry, R.L.; White, M.Y.; Murray, C.I.; Kane, L.A.; Fu, Q.; Stanley, B.A.; Van Eyk, J.E. Preparation of Proteins and Peptides for Mass Spectrometry Analysis in a Bottom-up Proteomics Workflow. In Current Protocols in Molecular Biology; Ausubel, F.M., Brent, R., Kingston, R.E., Moore, D.D., Seidman, J.G., Smith, J.A., Struhl, K., Eds.; John Wiley & Sons, Inc.: Hoboken, NJ, USA, 2009; ISBN 978-0-471-14272-0. [Google Scholar]
  44. Dallas, D.C.; Guerrero, A.; Khaldi, N.; Castillo, P.A.; Martin, W.F.; Smilowitz, J.T.; Bevins, C.L.; Barile, D.; German, J.B.; Lebrilla, C.B. Extensive in Vivo Human Milk Peptidomics Reveals Specific Proteolysis Yielding Protective Antimicrobial Peptides. J. Proteome Res. 2013, 12, 2295–2304. [Google Scholar] [CrossRef] [Green Version]
  45. Karav, S.; Le Parc, A.; Leite Nobrega de Moura Bell, J.M.; Frese, S.A.; Kirmiz, N.; Block, D.E.; Barile, D.; Mills, D.A. Oligosaccharides Released from Milk Glycoproteins Are Selective Growth Substrates for Infant-Associated Bifidobacteria. Appl. Environ. Microbiol. 2016, 82, 3622–3630. [Google Scholar] [CrossRef] [Green Version]
  46. Hurum, D.C.; Rohrer, J.S. Determination of Sialic Acids in Infant Formula by Chromatographic Methods: A Comparison of High-Performance Anion-Exchange Chromatography with Pulsed Amperometric Detection and Ultra-High-Performance Liquid Chromatography Methods. J. Dairy Sci. 2012, 95, 1152–1161. [Google Scholar] [CrossRef]
  47. Cerbulis, J.; Farrell, H.M. Xanthine Oxidase Activity in Dairy Products. J. Dairy Sci. 1977, 60, 170–176. [Google Scholar] [CrossRef]
  48. Avis, P.G.; Bergel, F.; Bray, R.C.; Shooter, K.V. A Crystalline Material with Xanthine Oxidase Activity. Nature 1954, 173, 1230–1231. [Google Scholar] [CrossRef] [PubMed]
  49. Michaelis, L.; Menten, M.L.; Johnson, K.A.; Goody, R.S. The Original Michaelis Constant: Translation of the 1913 Michaelis-Menten Paper. Biochemistry 2011, 50, 8264–8269. [Google Scholar] [CrossRef] [PubMed] [Green Version]
  50. Alshehab, M.; Reis, M.G.; Day, L.; Nitin, N. Milk Fat Globules, a Novel Carrier for Delivery of Exogenous Cholecalciferol. Food Res. Int. Ott. Ont 2019, 126, 108579. [Google Scholar] [CrossRef] [PubMed]
  51. Teixeira, B.F.; Dias, F.F.G.; Vieira, T.M.F.d.; Bell, J.M.L.N.d.; Taha, A.Y. Method Optimization of Oxylipin Hydrolysis in Nonprocessed Bovine Milk Indicates That the Majority of Oxylipins Are Esterified. J. Food Sci. 2021, 86, 1791–1801. [Google Scholar] [CrossRef] [PubMed]
  52. Taha, A.Y.; Cheon, Y.; Ma, K.; Rapoport, S.I.; Rao, J.S. Altered Fatty Acid Concentrations in Prefrontal Cortex of Schizophrenic Patients. J. Psychiatr. Res. 2013, 47, 636–643. [Google Scholar] [CrossRef] [PubMed] [Green Version]
  53. Ichihara, K.; Fukubayashi, Y. Preparation of Fatty Acid Methyl Esters for Gas-Liquid Chromatography. J. Lipid Res. 2010, 51, 635–640. [Google Scholar] [CrossRef] [Green Version]
  54. Shen, Q.; Zhang, Z.; Emami, S.; Chen, J.; Leite Nobrega de Moura Bell, J.M.; Taha, A.Y. Triacylglycerols Are Preferentially Oxidized over Free Fatty Acids in Heated Soybean Oil. NPJ Sci. Food 2021, 5, 7. [Google Scholar] [CrossRef]
  55. ADPI Product Standards. Available online: https://www.adpi.org/DairyProducts/ADPIProductStandards/tabid/398/Default.aspx (accessed on 3 January 2022).
  56. Levin, M.A.; Burrington, K.J.; Hartel, R.W. Composition and Functionality of Whey Protein Phospholipid Concentrate and Delactosed Permeate. J. Dairy Sci. 2016, 99, 6937–6947. [Google Scholar] [CrossRef]
  57. Swaminathan, A.V.; Molitor, M.S.; Burrington, K.J.; Otter, D.; Lucey, J.A. A Study of Various Chemical Pretreatments to Fractionate Lipids from Whey Protein Phospholipid Concentrate. J. Dairy Sci. 2021, 104, 12249–12262. [Google Scholar] [CrossRef]
  58. Siqueiros-Cendón, T.; Arévalo-Gallegos, S.; Iglesias-Figueroa, B.F.; García-Montoya, I.A.; Salazar-Martínez, J.; Rascón-Cruz, Q. Immunomodulatory Effects of Lactoferrin. Acta Pharmacol. Sin. 2014, 35, 557–566. [Google Scholar] [CrossRef] [PubMed]
  59. Arena, S.; Renzone, G.; Novi, G.; Scaloni, A. Redox Proteomics of Fat Globules Unveils Broad Protein Lactosylation and Compositional Changes in Milk Samples Subjected to Various Technological Procedures. J. Proteom. 2011, 74, 2453–2475. [Google Scholar] [CrossRef] [PubMed]
  60. Vorbach, C. The Housekeeping Gene Xanthine Oxidoreductase Is Necessary for Milk Fat Droplet Enveloping and Secretion: Gene Sharing in the Lactating Mammary Gland. Genes Dev. 2002, 16, 3223–3235. [Google Scholar] [CrossRef] [PubMed] [Green Version]
  61. Ogg, S.L.; Weldon, A.K.; Dobbie, L.; Smith, A.J.H.; Mather, I.H. Expression of Butyrophilin (Btn1a1) in Lactating Mammary Gland Is Essential for the Regulated Secretion of Milk-Lipid Droplets. Proc. Natl. Acad. Sci. USA 2004, 101, 10084–10089. [Google Scholar] [CrossRef] [PubMed] [Green Version]
  62. Monks, J.; Dzieciatkowska, M.; Bales, E.S.; Orlicky, D.J.; Wright, R.M.; McManaman, J.L. Xanthine Oxidoreductase Mediates Membrane Docking of Milk-Fat Droplets but Is Not Essential for Apocrine Lipid Secretion: Xanthine Oxidoreductase and Milk Fat Secretion. J. Physiol. 2016, 594, 5899–5921. [Google Scholar] [CrossRef]
  63. Hancock, J.T.; Salisbury, V.; Ovejero-Boglione, M.C.; Cherry, R.; Hoare, C.; Eisenthal, R.; Harrison, R. Antimicrobial Properties of Milk: Dependence on Presence of Xanthine Oxidase and Nitrite. Antimicrob. Agents Chemother. 2002, 46, 3308–3310. [Google Scholar] [CrossRef] [Green Version]
  64. Newburg, D.S.; Peterson, J.A.; Ruiz-Palacios, G.M.; Matson, D.O.; Morrow, A.L.; Shults, J.; Guerrero, M.d.L.; Chaturvedi, P.; Newburg, S.O.; Scallan, C.D.; et al. Role of Human-Milk Lactadherin in Protectoin against Symptomatic Rotavirus Infection. Lancet 1998, 351, 1160–1164. [Google Scholar] [CrossRef]
  65. Raymond, A.; Ensslin, M.A.; Shur, B.D. SED1/MFG-E8: A Bi-Motif Protein That Orchestrates Diverse Cellular Interactions. J. Cell. Biochem. 2009, 106, 957–966. [Google Scholar] [CrossRef] [Green Version]
  66. Brandtzaeg, P.; Prydz, H. Direct Evidence for an Integrated Function of J Chain and Secretory Component in Epithelial Transport of Immunoglobulins. Nature 1984, 311, 71–73. [Google Scholar] [CrossRef]
  67. Kaetzel, C.S. The Polymeric Immunoglobulin Receptor: Bridging Innate and Adaptive Immune Responses at Mucosal Surfaces. Immunol. Rev. 2005, 206, 83–99. [Google Scholar] [CrossRef]
  68. Pallesen, L.T.; Pedersen, L.R.L.; Petersen, T.E.; Rasmussen, J.T. Characterization of Carbohydrate Structures of Bovine MUC15 and Distribution of the Mucin in Bovine Milk. J. Dairy Sci. 2007, 90, 3143–3152. [Google Scholar] [CrossRef] [PubMed]
  69. Sando, L.; Pearson, R.; Gray, C.; Parker, P.; Hawken, R.; Thomson, P.C.; Meadows, J.R.S.; Kongsuwan, K.; Smith, S.; Tellam, R.L. Bovine Muc1 Is a Highly Polymorphic Gene Encoding an Extensively Glycosylated Mucin That Binds Bacteria. J. Dairy Sci. 2009, 92, 5276–5291. [Google Scholar] [CrossRef] [PubMed] [Green Version]
  70. Peeters, R.A.; Veerkamp, J.H.; Demel, R.A. Are Fatty Acid-Binding Proteins Involved in Fatty Acid Transfer? Biochim. Biophys. Acta BBA Lipids Lipid Metab. 1989, 1002, 8–13. [Google Scholar] [CrossRef]
  71. Bhat, M.Y.; Dar, T.A.; Singh, L.R. Casein Proteins: Structural and Functional Aspects. In Milk Proteins—From Structure to Biological Properties and Health Aspects; Gigli, I., Ed.; IntechOpen: London, UK, 2016; ISBN 978-953-51-2536-5. [Google Scholar]
  72. Brink, L.R.; Herren, A.W.; McMillen, S.; Fraser, K.; Agnew, M.; Roy, N.; Lönnerdal, B. Omics Analysis Reveals Variations among Commercial Sources of Bovine Milk Fat Globule Membrane. J. Dairy Sci. 2020, 103, 3002–3016. [Google Scholar] [CrossRef] [Green Version]
  73. Liao, Y.; Alvarado, R.; Phinney, B.; Lönnerdal, B. Proteomic Characterization of Human Milk Fat Globule Membrane Proteins during a 12 Month Lactation Period. J. Proteome Res. 2011, 10, 3530–3541. [Google Scholar] [CrossRef]
  74. Tsuji, S.; Hirata, Y.; Mukai, F.; Ohtagaki, S. Comparison of Lactoferrin Content in Colostrum Between Different Cattle Breeds. J. Dairy Sci. 1990, 73, 125–128. [Google Scholar] [CrossRef]
  75. Cheng, J.B.; Wang, J.Q.; Bu, D.P.; Liu, G.L.; Zhang, C.G.; Wei, H.Y.; Zhou, L.Y.; Wang, J.Z. Factors Affecting the Lactoferrin Concentration in Bovine Milk. J. Dairy Sci. 2008, 91, 970–976. [Google Scholar] [CrossRef]
  76. Varki, A.; Cummings, R.D.; Esko, J.D.; Freeze, H.H.; Stanley, P.; Bertozzi, C.R.; Hart, G.W.; Etzler, M.E. (Eds.) Essentials of Glycobiology, 2nd ed.; Cold Spring Harbor Laboratory Press: Cold Spring Harbor, NY, USA, 2009; ISBN 978-0-87969-770-9. [Google Scholar]
  77. Varki, A.; Lowe, J.B. Biological Roles of Glycans. In Essentials of Glycobiology; Varki, A., Cummings, R.D., Esko, J.D., Freeze, H.H., Stanley, P., Bertozzi, C.R., Hart, G.W., Etzler, M.E., Eds.; Cold Spring Harbor Laboratory Press: Cold Spring Harbor, NY, USA, 2009; ISBN 978-0-87969-770-9. [Google Scholar]
  78. Wu, X.; Jackson, R.T.; Khan, S.A.; Ahuja, J.; Pehrsson, P.R. Human Milk Nutrient Composition in the United States: Current Knowledge, Challenges, and Research Needs. Curr. Dev. Nutr. 2018, 2, nzy025. [Google Scholar] [CrossRef] [Green Version]
  79. Björck, L.; Claesson, O. Xanthine Oxidase as a Source of Hydrogen Peroxide for the Lactoperoxidase System in Milk. J. Dairy Sci. 1979, 62, 1211–1215. [Google Scholar] [CrossRef]
  80. Stevens, C.R.; Millar, T.M.; Clinch, J.G.; Kanczler, J.M.; Bodamyali, T.; Blake, D.R. Antibacterial Properties of Xanthine Oxidase in Human Milk. Lancet Lond. Engl. 2000, 356, 829–830. [Google Scholar] [CrossRef]
  81. Millar, T.M.; Kanczler, J.M.; Bodamyali, T.; Blake, D.R.; Stevens, C.R. Xanthine Oxidase Is a Peroxynitrite Synthase: Newly Identified Roles for a Very Old Enzyme. Redox Rep. 2002, 7, 65–70. [Google Scholar] [CrossRef]
  82. Harrison, R. Milk Xanthine Oxidase: Properties and Physiological Roles. Int. Dairy J. 2006, 16, 546–554. [Google Scholar] [CrossRef]
  83. Yao, Y.; Zhao, G.; Yan, Y.; Chen, C.; Sun, C.; Zou, X.; Jin, Q.; Wang, X. Effects of Freeze Drying and Spray Drying on the Microstructure and Composition of Milk Fat Globules. RSC Adv. 2016, 6, 2520–2529. [Google Scholar] [CrossRef]
  84. Lu, J.; Argov-Argaman, N.; Anggrek, J.; Boeren, S.; van Hooijdonk, T.; Vervoort, J.; Hettinga, K.A. The Protein and Lipid Composition of the Membrane of Milk Fat Globules Depends on Their Size. J. Dairy Sci. 2016, 99, 4726–4738. [Google Scholar] [CrossRef] [PubMed] [Green Version]
  85. Michalski, M.C.; Leconte, N.; Briard-Bion, V.; Fauquant, J.; Maubois, J.L.; Goudédranche, H. Microfiltration of Raw Whole Milk to Select Fractions with Different Fat Globule Size Distributions: Process Optimization and Analysis. J. Dairy Sci. 2006, 89, 3778–3790. [Google Scholar] [CrossRef] [Green Version]
  86. Dhungana, P.; Truong, T.; Palmer, M.; Bansal, N.; Bhandari, B. Size-Based Fractionation of Native Milk Fat Globules by Two-Stage Centrifugal Separation. Innov. Food Sci. Emerg. Technol. 2017, 41, 235–243. [Google Scholar] [CrossRef] [Green Version]
  87. Gan, J.; Zhang, Z.; Kurudimov, K.; German, J.B.; Taha, A.Y. Distribution of Free and Esterified Oxylipins in Cream, Cell, and Skim Fractions of Human Milk. Lipids 2020, 55, 661–670. [Google Scholar] [CrossRef]
Figure 1. Manufacture of whey protein concentrate and isolate, which results in the accumulation of whey protein phospholipid concentrate (WPPC). Figure adapted from [40].
Dairy 03 00022 g001
Figure 2. SDS-PAGE profile of whey protein phospholipid concentrate (WPPC) from different manufacturers. Lane 1: standard; Lane 2: sample 1A; Lane 3: sample 1B; Lane 4: sample 6B; Lane 5: sample 2A; Lane 6: sample 2B; Lane 7: sample 3; Lane 8: sample 4A; Lane 9: sample 4B; and Lane 10: sample 5. Annotation based on [57] with the exception of xanthine oxidase and IgG.
Dairy 03 00022 g002
Figure 3. Relative abundance of major proteins identified in WPPC by proteomics.
Dairy 03 00022 g003
Figure 4. (a) Proteomics of whey protein phospholipid concentrate (WPPC), in which various protein abundances are expressed as a relative percentage of total protein. Proteins are divided into three groups: “MFGM proteins”, “milk proteins”, and “other proteins”. (b) Relative percentages of the milk fat globule membrane (MFGM) proteins in whey protein phospholipid concentrate (WPPC). (c) Relative percentages of milk proteins in whey protein phospholipid concentrate (WPPC).
Dairy 03 00022 g004
Figure 5. Overlaid extracted ion chromatograms of the most abundant WPPC N-glycans. The N-glycans are denoted by their monosaccharide compositions. Hex: hexose; HexNAc: N-acetylhexosamine; and NeuAc: N-acetylneuraminic acid.
Dairy 03 00022 g005
Figure 6. (a) Xanthine oxidase activity of whey protein phospholipid concentrate (WPPC) (sample 6B) and bovine milk, and (b) Michaelis–Menten kinetics of whey protein phospholipid concentrate (WPPC) xanthine oxidase for uric acid generation. For the graph, the corresponding fits (solid lines) Km, and Vmax data were obtained using the Michaelis–Menten equation.
Dairy 03 00022 g006
Figure 7. Size distribution of all liquid and powder WPPC samples from the data set and comparison with fresh raw bovine milk.
Dairy 03 00022 g007
Figure 8. Phospholipid fraction distribution (calculated based on fatty acid composition per each fraction).
Dairy 03 00022 g008
Figure 9. Pie charts listing the percentage distribution of (a) free vs. calculated esterified oxylipins (i.e., the difference between total and free oxylipins), (b) free oxylipins, (c) total oxylipins, and (d) calculated esterified oxylipins derived from various fatty acid precursors, including from linoleic acid (LNA), dihomo-gamma-linolenic (DGLA), arachidonic acid (ARA), α-linolenic acid (ALA), eicosapentaenoic acid (EPA), and docosahexaenoic acid (DHA).
Dairy 03 00022 g009
Table 1. Comparison between %solids, %protein, and %fat of the fat globule population measured from all WPPC samples.
Sample DescriptionTotal Solids (%)Protein (%)Fat (%)
Sample 1A (liquid)20.4765.46 *27.25 *
Sample 1B (liquid)21.5662.15 *28.10 *
Sample 1 (powder)-62.724.4
Sample 2A (powder)->72-
Sample 2B (powder)->73-
Sample 3 (powder)-75.0918.11
Sample 4A (powder)-76.1913.08
Sample 4B (powder)-69.3916.45
Sample 5 (powder)-67.61-
Sample 6A (powder)-52.6313.08
Sample 6B (liquid)13.4063.4320.20
Bovine milk (liquid)1324.92 *26.92 *
* % Fat and protein values were converted to dry basis values.
Table 2. Comparative protein results in each sample expressed as the relative percentage of total and relative percentages of the milk fat globule membrane (MFGM), milk, other protein results.
This StudyBrink et al. (2020)
Whey BasedFormulaCream Based
WPPCMFGM-10PFSFPL-20BPC-50BSP2PLC1SM2
MFGM proteins22.8110.715.062.852425.7323.3323.9326.39
Butyrophilin 5.111.651.140.14.995.75.425.445.2
Fatty acid-binding protein1.752.351.351.032.604.2644.543.18
GLYCAM-17.003.942.171.327.163.883.644.527.74
Lactadherin 4.451.360.10.15.424.934.214.244.26
Adipophilin (Perilipin-2)0.440.10.10.12.33.632.943.113.13
Platelet glycoprotein 4 (CD36)0.741.210.10.10.11.051.150.11.09
Xanthine oxidase2.250.10.10.11.432.281.971.981.79
Mucin-15 0.90--------
Mucin-1 0.18--------
Milk proteins45.4255.6461.6468.556.550.5851.3952.452.34
α-lactalbumin 2.070.11.42.651.051.121.20.11.4
α-S1-casein 1.220.18.2012.239.809.459.9010.459.07
α-S2-casein 0.480.18.2411.9211.6010.6411.2414.510.22
β-lactoglobulin 30.1146.2913.6214.1415.3010.0713.6410.6910.91
Serum albumin 10.957.104.584.171.971.702.231.512.03
β-casein 0.360.115.0524.2716.5817.512.9813.7918.51
Kappa-casein 0.240.10.10.10.10.10.11.260.1
Lactoferrin (Lactotransferrin)3.801.7510.451.810.10.11.10.10.1
Other proteins31.3233.6533.328.6519.576.3125.2823.6721.27
Milk fat globule membrane. Mucin-15, Mucin-1, and serum albumin values were not reported in the reference paper [70]. GLYCAM-1: glycosylation-dependent cell adhesion molecule 1; WPPC: whey protein phospholipid concentrate; MFGM -10: lacprodan MFGM-10; PF: premium formula; SF: standard formula; PL-20: lac-prodan PL-20; PBC-5: bovine serum concentrate; BSP2: bovine serum product; PLC1: phospholipid concentrate; and SM2: sweet buttermilk powder.
Table 3. Fatty acid amount per lipid fraction (mg/g) in sample 1.
Lipid FractionTotal Fatty AcidsSMPCPSPIPE
Sum of Fatty acids123.91 ± 6.910.97 ± 0.138.65 ± 0.703.30 ± 0.182.07 ± 0.329.25 ± 0.23
C8:00.212 ± 0.029NDNDNDND0.003 ± 0.006
C10:01.413 ± 0.138NDNDNDNDND
C11:00.065 ± 0.004NDNDNDNDND
C12:03.286 ± 0.177NDNDNDNDND
C13:00.460 ± 0.062NDNDNDND0.095 ± 0.165
C14:013.341 ± 0.781ND0.802 ± 0.099NDND0.074 ± 0.065
C14:11.010 ± 0.055NDNDND0.042 ± 0.072ND
C15:01.641 ± 0.086ND0.108 ± 0.095NDNDND
C16:044.722 ± 2.4730.182 ± 0.1593.702 ± 0.3310.144 ± 0.1250.211 ± 0.0301.242 ± 0.028
C16:11.897 ± 0.1080.349 ± 0.0340.291 ± 0.0910.357 ± 0.0850.360 ± 0.0870.340 ± 0.032
C17:00.820 ± 0.041NDNDNDNDND
C18:014.493 ± 0.778ND0.798 ± 0.0691.326 ± 0.0970.748 ± 0.0921.168 ± 0.030
C18:1cis+trans30.723 ± 1.655ND2.155 ± 0.1441.039 ± 0.0810.551 ± 0.0544.259 ± 0.159
C18:2 n66.213 ± 0.335ND0.796 ± 0.0550.433 ± 0.0430.155 ± 0.0181.565 ± 0.076
C18:3 n60.049 ± 0.003NDNDNDND0.033 ± 0.058
C18:3 n30.674 ± 0.036NDNDNDND0.034 ± 0.059
C20:00.263 ± 0.029NDNDNDNDND
C20:1 n90.222 ± 0.096NDNDNDNDND
C20:2 n60.057 ± 0.004NDNDNDNDND
C20:3 n60.498 ± 0.027NDNDNDND0.076 ± 0.066
C20:4 n60.559 ± 0.029NDNDNDND0.155 ± 0.007
C20:3 n30.011 ± 0.003NDNDNDND0.010 ± 0.018
C20:5 n30.119 ± 0.005NDNDNDNDND
C22:00.343 ± 0.0420.233 ± 0.017NDNDNDND
C22:1 n90.023 ± 0.004NDNDNDNDND
C22:2 n60.187 ± 0.007NDNDNDNDND
C22:5 n60.051 ± 0.021NDNDNDND0.059 ± 0.103
C22:5 n30.276 ± 0.017NDNDNDND0.013 ± 0.023
C22:6n30.255 ± 0.0360.209 ± 0.017NDNDNDND
C24:10.029 ± 0.002NDNDNDNDND
cholesterol6.768 ± 0.101NDNDNDNDND
ND: Not detected.
Table 4. Total (i.e., free + esterified) and free oxylipin concentration, nmol/g in sample 1. The samples were analyzed in triplicates and an unpaired t-test (two-tailed, two-sample equal variance (homoscedastic)) was used to compare the total versus free oxylipins. Fatty acid amount per lipid fraction (mg/g).
PrecursorsAbbreviationsCompound NamesTotal Oxylipins (n = 5)Free Oxylipins (n = 5)p Value
Ave ± StdAve ± Std(t-Test)
LA9,12,13-TriHOME9,12,13-trihydroxyoctadecamonoenoic acid57.305 ± 5.5310.120 ± 0.009 1.30 × 10⁻⁸
9,10,13-TriHOME9,10,13-trihydroxyoctadecamonoenoic acid19.147 ± 2.1230.034 ± 0.002 3.87 × 10⁻⁸
12,13-DiHOME12,13-dihydroxyoctadecamonoenoic acid2.220 ± 0.2050.391 ± 0.0465.06 × 10−8
9,10-DiHOME9,10-dihydroxyoctadecamonoenoic acid3.566 ± 0.3310.498 ± 0.0593.49 × 10−8
13-HODE13-hydroxyoctadecadienoic acid85.360 ± 5.5933.246 ± 0.3698.22 × 10−10
9-HODE9-hydroxyoctadecadienoic acid21.644 ± 2.2071.522 ± 0.1813.59 × 10−8
13-oxo-ODE13-oxo-octadecadienoic acid1.246 ± 0.2090.045 ± 0.0051.26 × 10−6
9-oxo-ODE9-oxo-octadecadienoic acid1.360 ± 0.2010.067 ± 0.0085.39 × 10−7
12(13)-EpOME12(13)-epoxyoctadecamonoenoic acid23.227 ± 5.0870.087 ± 0.0507.47 × 10−6
9(10)-EpOME9(10)-epoxyoctadecamonoenoic acid31.945 ± 7.6700.262 ± 0.1501.53 × 10−5
DGLA15(S)-HETrE15(S)-hydroxyeicosatrienoic acid1.436 ± 0.1070.010 ± 0.0011.75 × 10−9
ARATXB2Tromboxane B20.021 ± 0.0040.001 ± 0.002.70 × 10−6
6-trans-LTB46-trans-leukotriene B40.029 ± 0.0010.001 ± 0.005.74 × 10−11
14,15-DiHETrE14,15-dihydroxyeicosatrienoic acid0.028 ± 0.0040.002 ± 0.002.15 × 10−7
11,12-DiHETrE11,12-dihydroxyeicosatrienoic acid0.028 ± 0.0040.002 ± 0.007.24 × 10−7
8,9-DiHETrE8,9-dihydroxyeicosatrienoic acid0.007 ± 0.0040.001 ± 0.0014.36 × 10−3
20-HETE20-hydroxyeicosatetraenoic acid0.590 ± 0.1170.009 ± 0.0033.82 × 10−6
5,6-DiHETrE5,6-dihydroxyeicosatrienoic acid0.402 ± 0.0380.001 ± 0.001.20 × 10−8
15-HETE15-hydroxyeicosatetraenoic acid1.050 ± 0.130.062 ± 0.0061.45 × 10−7
11-HETE11-hydroxyeicosatetraenoic acid0.282 ± 0.0440.030 ± 0.0031.34 × 10−6
15-oxo-ETE15-oxo-eicosatetraenoic acid0.007 ± 0.0020.006 ± 0.0011.58 × 10−1
8-HETE8-hydroxyeicosatetraenoic acid0.085 ± 0.0050.029 ± 0.0033.05 × 10−8
12-HETE12-hydroxyeicosatetraenoic acid0.116 ± 0.0110.015 ± 0.0023.96 × 10−8
9-HETE9-hydroxyeicosatetraenoic acid0.392 ± 0.0430.005 ± 0.0024.19 × 10−8
12-oxo-ETE12-oxo-eicosatetraenoic acid0.004 ± 0.0010.001 ± 0.001.21 × 10−3
5-HETE5-hydroxyeicosatetraenoic acid1.614 ± 0.1470.064 ± 0.0071.12 × 10−8
14(15)-EpETrE14(15)-epoxyeicosatrienoic acid1.406 ± 0.2480.001 ± 0.0011.40 × 10−6
5-oxo-ETE5-oxo-eicosatetraenoic acid0.048 ± 0.0110.014 ± 0.0052.84 × 10−4
11(12)-EpETrE11(12)-epoxyeicosatrienoic acid1.236 ± 0.2800.002 ± 0.0019.56 × 10−6
8(9)-EpETrE8(9)-epoxyeicosatrienoic acid1.740 ± 0.1310.013 ± 0.0091.99 × 10−9
5(6)-EpETrE5(6)-epoxyeicosatrienoic acid0.909 ± 0.1770.002 ± 0.0013.01 × 10−6
ALA9-HOTrE9-hydroxyoctadecatrienoic acid1.877 ± 0.2140.151 ± 0.0149.50 × 10−8
13-HOTrE13-hydroxyoctadecatrienoic acid2.381 ± 0.2220.302 ± 0.0242.97 × 10−8
EPA8,15-DiHETE8,15-dihydroxyeicosatetraenoic acid0.159 ± 0.0280.003 ± 0.0011.77 × 10−6
5,15-DiHETE5,15-dihydroxyeicosatetraenoic acid0.032 ± 0.0020.001 ± 0.0002.72 × 10−9
5,6-DiHETE5,6-dihydroxyeicosatetraenoic acid4.228 ± 0.6840.039 ± 0.068.00 × 10−7
17,18-DiHETE17,18-dihydroxyeicosatetraenoic acid0.079 ± 0.0300.007 ± 0.0017.53 × 10−4
14,15-DiHETE14,15-dihydroxyeicosatetraenoic acid0.018 ± 0.0070.004 ± 0.0022.59 × 10−3
11,12-DiHETE11,12-dihydroxy-5Z,8Z,14Z,17Z-eicosatetraenoic acid0.007 ± 0.0010.001 ± 0.0006.34 × 10−6
15-HEPE15-hydroxyeicosapentaenoic acid0.096 ± 0.0130.001 ± 0.0001.71 × 10−7
8-HEPE8-hydroxyeicosapentaenoic acid0.055 ± 0.0090.006 ± 0.0023.46 × 10−6
12-HEPE12-hydroxyeicosapentaenoic acid0.066 ± 0.0070.003 ± 0.0013.27 × 10−8
5-HEPE5-hydroxyeicosapentaenoic acid1.454 ± 0.0700.012 ± 0.0015.64 × 10−11
17(18)-EpETE17(18)-epoxyeicosateteaenoic acid2.368 ± 0.8680.000 ± 0.002.91 × 10−4
14(15)-EpETE14(15)-epoxyeicosatetraenoic acid0.127 ± 0.0450.001 ± 0.0012.28 × 10−4
11(12)-EpETE11(12)-epoxyeicosateteaenoic acid0.102 ± 0.0190.000 ± 0.0002.45 × 10−6
8(9)-EpETE8(9)-epoxyeicosateteaenoic acid0.207 ± 0.0590.000 ± 0.0005.03 × 10−5
DHA19(20)-DiHDPA(±)19,20-dihydroxy−4Z,7Z,10Z,13Z,16Z-docosapentaenoic acid0.001 ± 0.0010.000 ± 0.0009.44 × 10−2
16(17)-DiHDPA(±)16,17-dihydroxy-4Z,7Z,10Z,13Z,19Z-docosapentaenoic acid0.002 ± 0.0010.000 ± 0.0001.88 × 10−4
17-HDoHE17-hydroxydocosahexaenoic acid0.154 ± 0.0790.000 ± 0.0002.34 × 10−3
19(20)-EpDPE19(20)-epoxydocosapentaenoic acid0.082 ± 0.0310.002 ± 0.0024.85 × 10−4
16(17)-EpDPE16(17)-epoxydocosapentaenoic acid0.015 ± 0.0100.000 ± 0.0001.38 × 10−3
13(14)-EpDPE13(14)-epoxydocosapentaenoic acid0.025 ± 0.0070.001 ± 0.0014.27 × 10−5
10(11)-EpDPE10(11)-epoxydocosapentaenoic acid0.045 ± 0.0120.001 ± 0.0013.86 × 10−5
7(8)-EpDPE7(8)-epoxydocosapentaenoic acid0.047 ± 0.0270.000 ± 0.0004.83 × 10−3
Publisher’s Note: MDPI stays neutral with regard to jurisdictional claims in published maps and institutional affiliations.

