
pH, the Fundamentals for Milk and Dairy Processing: A Review

1
Food Chemistry and Technology Department, Teagasc Food Research Centre, Moorepark, Fermoy, Co., P61 C996 Cork, Ireland
2
School of Food and Nutritional Sciences, University College Cork, T12 YN60 Cork, Ireland
*
Author to whom correspondence should be addressed.
Dairy 2023, 4(3), 395-409; https://doi.org/10.3390/dairy4030026
Submission received: 12 May 2023
/
Revised: 16 June 2023
/
Accepted: 20 June 2023
/
Published: 25 June 2023
(This article belongs to the Section Milk Processing)
Abstract
:The ability to measure and capture real-time unit operational data has significant benefits during dairy processing, whether it is the basics, such as measuring temperature, pressure, and flow rates, or more recent developments in the case of in-line viscosity and product-compositional measurements. This rapid data collection has helped increase profitability by reducing energy costs, minimizing product loss, and allowing automated control. Advances in technology have allowed for in-line measurements of the composition and some physical attributes such as particle size and viscosity; however, an attribute that spans both compositional and physical attributes is pH, directly influenced by composition but also environments, such as temperature and dry matter content. pH is measured for a plethora of reasons, such as a measure of milk quality (microbial spoilage), acidification of casein, cheese production, maintaining optimum conditions during protein hydrolysis, etc. However, very little is published on the fundamentals of pH and pH measurement in dairy processing; rather, it is usually a cause-and-effect phenomenon. This review visits one of the oldest analytical considerations in the dairy industry and re-examines how it is affected by product composition and processing conditions.
Keywords:
pH; hydrogen ion concentration; measurement; in-situ; in-line; temperature; milk products; dairy processing1. Introduction
One of the most critical control parameters within the food, pharmaceutical, cosmetic, electrochemical, paper, and textile industries, to name a few, is the monitoring and measurement of pH [1,2,3]. In the dairy industry, pH is often the first indication of microbiological spoilage but is more often manipulated to create and produce an array of dairy products, including cheese, acid casein/whey, yogurt, fermented beverages, and protein hydrolysates. There are several attributes associated with fluids, such as density, pressure, compressibility, and viscosity, all of which are affected by environmental conditions and compositional attributes. A biological fluid such as milk is defined by the aforementioned properties; however, dairy processing compounds the complexity to which milk properties are subject. Water, the main constituent of bovine milk (~87%, w/w), contains both dissolved and suspended components, all designed to act as a source of hydration and nutrient delivery for the neonate. pH is a dynamic parameter that changes constantly during milk processing, whether due to temperature, pressure, dry matter content/water removal, or microbial activity. For the most part, pH can only be measured in an aqueous medium (continuous phase comprised of water) and so cannot be measured in pure oils or alcohols. In the dairy industry, pH is usually adjusted or controlled by the addition of mineral acids and bases or through the addition of microbial cultures.
Since pH has been used universally in food physics and chemistry for well over a century, not much thought is given to its actual meaning, but rather pH is only associated with a certain outcome or desired product. Therefore, this review covers the fundamental understanding of pH, its measurement, and how it changes during milk processing, emphasizing the interrelationships between dry matter content, minerals, and temperature. The review also offers insights into some of the new developments in pH data collection of specific relevance to the dairy industry.
2. Understanding pH
The quantitative determination of pH is perhaps one of the oldest and most commonly used analytical methods in the dairy industry. The term “pH” is an abbreviation of the power of hydrogen or potential of hydrogen introduced by the Danish scientist Søren Peder Lauritz Sørensen in the early 20th century. pH is defined as a measure of the hydrogen ion activity, an ‘effective concentration’ in an aqueous solution representing the moles of hydrogen ion (H+) per liter of solution for dilute systems at a given temperature. Mathematically, pH and pOH (power of hydroxide ion) are defined as the negative logarithm to the base 10 of H+ or OH− ion concentrations at 25 °C ((1)–(3)).
As mentioned previously, pH is, for the most part, measured in aqueous solutions and is based on the dissociation of water (H2O) into equal concentrations of hydrogen and hydroxyl (OH−) ions (4).
The dissociation constant for this reaction is expressed as Kw and is the auto-ionization or auto-dissociation to form H+ and OH− ions, equal to 10−14 at 25 °C (5). This relationship may be expressed as:
[H+][OH−] = Kw = 10−14
Since the concentration of H+ and OH− ions are equal in pure water, it is referred to as pH neutral, giving an equal concentration of H+ and OH− ions (i.e., 10−7 mol/L). Therefore, to simplify the use of H+ and OH− ion concentration, pH may be defined as the negative logarithm of ((6) and (7))
Therefore, a convenient scale for pH was developed based on the dissociation of water (H2O) and ranged from 0 to 14 (Table 1). However, it must be mentioned that at high concentrations, acids and bases can expand outside the typical pH scale of 0–14 (further details provided in Section 2.4).
In nature, the description of a singular atomic hydrogen ion (H+) is not entirely accurate. Free H+ ions are extremely reactive and therefore remain free for an exceptionally short period in aqueous solutions. The proton (H+) cannot exist alone in water, as this form of hydrogen has one proton and only one electron; therefore, the electric field near the singular proton is exceptionally strong, and so the proton is hydrated, forming a hydronium ion (H3O+), see Section 2.1. Thus, the use of the term hydrogen ion does not refer to the atomic H+ ion but to its hydrated form [4] (8). In most cases, the hydronium ion is further solvated by water molecules in clusters such as and [5].
2.1. The Hydrogen Ion
Hydrogen, with an atomic number of 1, is the simplest of all atoms containing a single proton and a single electron [6], while the simplest molecule is H2, a molecular analog of atomic hydrogen consisting of two protons and one electron. Hydrogen is the most abundant element in the universe, comprising ~75% of all matter. Hydrogen ions are the foundation of all aqueous acid-base reactions and are involved in countless biological functions, catalysis reactions, and protonation. Despite its importance in natural sciences, it is near impossible to measure H+ ions due to their highly reactive nature. This reactivity makes it one of the most essential elements in nature.
The term hydrogen ion refers to the hydrogen ion present in aqueous solutions, in which it exists as the combined molecule . Hydrogen has three known isotopes observed in nature, existing as either protium, deuterium, or tritium. The protium form is the most common isotope comprising 99.98% of all hydrogen, which consists of only one single proton and electron [7]. Deuterium makes up only 0.0026–0.0184% of all hydrogen that exists on Earth and consists of one electron, and within its nucleus contains one proton and one neutron [8]. Water enriched in molecules that contain deuterium is known as heavy water and is used in nuclear reactors as a coolant [9,10]. Tritium, the radioactive isotope of hydrogen, contains one proton and two neutrons in its nucleus. An insignificant amount of tritium occurs naturally due to its interaction with atmospheric gases.
The pH scale defines the acidity or basicity of a “dilute aqueous solution, in which the solvent is water,” and the hydrogen ions can move about freely in the solution. Therefore, it is strictly applicable and correlated to the “hydrogen ion activity” and not to other ions that might exist in the solution. If measurements are to be performed in non-aqueous liquid and aqueous–organic mixed solvents, the traditional pH measurement loses its ability to respond to H+ ions due to the dehydration of the electrode and consequent signal drifting [11]. Measurement of hydrogen in non-aqueous solvents can be conducted with electrodes that contain a non-aqueous filling solution (i.e., saturated lithium chloride in ethanol for non-polar solvents or acetic acid for polar solvents).
2.2. Acid—Base Reactions
The transfer of hydrogen ions in an acid–base reaction is referred to as proton transfer (9). The acid is the H+ donor, and the base is the H+ acceptor. Ka and Kb are correlated through the ionic constant of water (Kw) (10). Under the same conditions, weak acids have a higher pH value than strong acids.
Acids and bases are classified based on their ionization level in an aqueous solution, where ionization is a measure of the tendency of an atom to resist the loss of electrons. Weak acids (e.g., acetic acid, phosphoric acid, and hydrofluoric acid) and bases (e.g., ammonia, sodium bicarbonate) do not fully ionize in water compared to strong acids (e.g., hydrochloric acid, nitric acid, perchloric acid) and bases (e.g., sodium hydroxide, potassium hydroxide); therefore, the equilibrium constant becomes a critical parameter in order to calculate the pH [12,13]. The equilibrium constant values of some commonly used acids in dairy science can be seen in Table 2.
The ability of acids to become deprotonated (donating a hydrogen ion) at a particular pH value is determined by their H+ dissociation constant () [14]. pH, , and are closely related, where the and values are a quantitative measure of the acid and base strength ((11)–(13)), both representing the pH value required for the system to be able to donate or accept a proton.
pKa = −log[Ka]
pKb = −log[Kb]
pKa + pKb = 14
The pKa and pKb values are described by the Henderson–Hasselbalch Equations (14) and (15).
Polyprotic acids and bases are able to donate or accept more than one proton per molecule [15]. Phosphoric acid is classified as a polyprotic acid and has three ionization stages and therefore has three equilibrium constants described as Ka1, Ka2, and Ka3 (16).
2.3. The pH–Temperature Relationship
Temperature is known to have a strong effect on the chemical equilibrium and concomitantly affects the equilibrium constant (K). The equilibrium constant depends on temperature, ionic strength, and the dielectric constant of the solvent. Increasing the temperature of the system results in increased molecular vibration, ion activity, and decreased propensity for hydrogen bond formation (i.e., more free H+ ions). Studies have applied mathematical modeling in order to calculate the temperature dependence of the pKa values [18,19].
In thermodynamics, the equilibrium constant is related to the rate of the free energy change of the reaction in relation to temperature, which is represented by Van ’t Hoff’s Equation (17). R represents the gas constant, and represents the enthalpy change, which can be calculated from the change in Gibb’s free energy by calculating the difference between the enthalpy and entropy [20]. By integrating Van ’t Hoff’s Equation (18), one can obtain the temperature dependence of the (19).
Therefore, measuring pH, essentially a measure of the hydrogen ion activity, is only relevant when combined with the temperature at which it was measured.
2.4. Hydrogen Ion Activity and pH in Non-Aqueous Solutions
For most applications, hydrogen ion concentration (molality: mol/kg solvent) is used without specifically mentioning ion activity. Hydrogen ion activity is defined by both the concentration of hydrogen ions and the activity coefficient , as shown in (20).
For dilute solutions, the hydrogen ion activity and hydrogen ion concentration () are almost equal, but this is not the case in concentrated systems or high ionic environments, as the activity coefficient changes depending on the ionic strength, temperature, dielectric constant, ion charge, ion size, and solvent density [21]. Therefore, one must know the ionic strength of the solution, which is determined as follows:
where is the concentration of each ion present (in moles per liter) and represents its charge. The influence of salts present in a solution of which the pH value is measured is called the salt effect. This salt effect is denoted by the symbol and is defined as:
where is the ionic strength of the system and is defined as shown in Equation (21). For aqueous solutions at 25 °C, and .
In addition, it is worth mentioning that strong acids and bases do not fully dissociate in water at high concentrations. This is applicable during wet chemistry methods or for cleaning/sterilization-in-place (CIP and SIP) procedures within the dairy industry. For example, the pH of 12 M HCl (concentrated hydrochloric acid) is calculated to be –log (12) = −1.08, although most glass pH probes are incapable of accurately measuring this ion concentration. Furthermore, 12 M HCl may not fully dissociate in aqueous solutions, and therefore, the absolute pH may be higher than the pH theoretically calculated from acid molarity.
The definition of pH and its measurement is well-developed for aqueous solutions; however, the determination of pH in non-aqueous solutions is less defined. Numerous functions, theories, and calculations have been developed over the years to indicate the acidity/basicity of non-aqueous or strongly acidic solutions [22]. Himmel et al. [22] proposed a unified Brønsted acidity scale following on from initial studies by Ugo et al. [23] and Katritzky et al. [24], who investigated acid–base equilibria in organic solvents. This was based on the absolute chemical potential of protons in any medium, which allows us to directly compare acidities in different media and give a thermodynamically meaningful definition of super-acidity. Himmel et al. [22] established a new unified Brønsted acidity scale at 1 bar and 298.15 K. Following the origin of the unified acidity scale, the scale has been extended for several solvent–water mixtures. Several studies [25,26,27,28] have investigated the new concept of a unified pH scale in non-aqueous, non-hydrogen bond donor solvents, such as in ethanol, methanol, acetonitrile, and also when mixed with water and saline solutions. Recently, a large European research group [29] developed and validated reliable and universally applicable measurement procedures for determining absolute pH. In dairy processing, the measurement of absolute pH may find relevance in systems with high alcohol content, such as in cream liqueurs, where the ethanol content can be as high as 20% (v/v) in the finished product. However, this may be higher during production where the ethanol content can be as high as 50% (v/v) prior to oil and sugar addition [30].
3. Measuring pH
3.1. Measurement Approaches and Types of Probes
There is a large range of approaches available for measuring pH, ranging from easy, inexpensive methods such as colorimetric analysis to glass and titanium probes capable of withstanding severe environmental conditions. Colorimetric methods, using indicator reagents or pH test strips, were widely used prior to the development of the metal electrode and potentiometric/electrochemical measurements of pH using glass electrodes [31,32,33]. Measurements conducted using indicator reagents (e.g., phenolphthalein, ethyl red, methyl red) provide rapid, reproducible, and inexpensive measurements [34]; however, the measurements obtained are usually only approximate values [35]. Colorimetric pH methods are prone to inaccuracies when used in milk systems, as measurements can be influenced by the concentration and type of protein and their isoelectric point [33]. Therefore, most laboratory pH meters used today are potentiometric sensors consisting of single combination electrodes, also known as ion-sensitive membranes, which can be prepared as either solid, liquid, or specific to the analyte [36]. They operate based on the electrical potential difference (∆φ) principle between the interface (liquid, solid, or other specific type) and analyte, with an ideal Nernstian response [36,37]. Based on the Nernst Equation (24), R is the gas constant, T is the absolute temperature, F is the Faraday constant, and concentrations (ci) are noted in terms of H+ ion activity of inner and outer solutions (ai) [20].
Glass membrane electrodes are classified as solid electrodes responsive to changes in H+ activity and may consist of a combined reference and pH electrode. Compared to colorimetric methods, commercially available glass electrodes give a good linear response in the pH range 2 to 9, with a short pH response time up to pH 14, give good reproducibility, and are durable [38,39]. Glass probes are most suited to laboratory use and given their brittle nature and relatively small operation temperature range, there are limitations when used in the food, beverage and biomedical industry [31]. However, with developing technology, there are several new and innovative designs such as microelectrodes [40,41], disposable electrode tubes [42,43] and needle-type pH electrodes, gel-filled electrodes, solid-state electrodes, ion selective electrodes (ISE), and epoxy body electrodes. Hashimoto et al. [44] recently developed a novel metal-oxide-coated stainless steel pH sensor with a pH sensitivity of 88–100%, pH repeatability of 0.1–0.6 pH units, and an initial pH response time of ~1 s which is significantly shorter than commercial glass electrodes (typical response time of 14 s).
3.2. Monitoring pH
3.2.1. Off-Line and At-Line Measurements
Off-line analysis is commonly used for most analytical methods and particularly for pH measurements, whereby a sub-sample or aliquot of product is removed from the production process and analyzed independently of the manufacturing process. A disadvantage of off-line analysis is the inevitable time delay, which may allow significant changes to occur between sampling and pH analysis, such as fluctuations in temperature, pressure, microbial contamination, or time-related changes in mineral equilibrium (e.g., calcium phosphate ⇌ ionic calcium).
At-line analysis is similar to off-line measurements; the sample is removed from the process but is measured close to the manufacturing line (Figure 1). There is little time delay between sampling and analyses, although changes may still occur to the sample, similar to off-line where temperature and other environmental factors may change. For most applications, at-line analysis offers a suitable compromise where in-situ measurements of pH are not feasible.
3.2.2. On-Line Measurements
On-line measurement for pH might prove most feasible, whereby the sample is diverted from the manufacturing process as a bypass stream and may be returned to the process if need be. The sample is automatically measured in the bypass line by the pH probe. On-line instruments may be defined as a process analytical tool (PAT), allowing for real-time capture of process and product qualtiy and giving the flexibility to make in-process changes when needed. The advantages of this approach are that product can be diverted to the sensor or can be closed off for a straight-through process.
3.2.3. In-Line/In-Situ Measurements
In-line or in-situ measurements take place directly in the process and monitor product properties in real-time (Figure 1), such as dissolved CO2, conductivity, pH, temperature, etc. [45,46,47]. In-situ pH monitoring is ubiquitous in the dairy industry for applications such as cheese and yogurt manufacture, monitoring fermentation properties within bioreactors, and particularly in cases of large-scale protein hydrolysis where pH may have to be maintained or controlled for optimum enzyme activity. However, where in-situ pH measurement becomes more difficult is during high-temperature heat treatment, particularly during thermal processing in excess of 90 °C. Essentially, the dairy industry uses off-line and at-line measurements for capturing pH data of milk and milk derivatives, with the general exception of specific fermentation processes which make use of in-situ pH analysis, although this usually takes place at relatively low temperatures. In-situ probes should be of sanitary design, i.e., European Hygienic Engineering Design Group (EHEDG) standards or 3A design, without moving parts or seals 34. These in-situ sensors should also be compatible with repeated cleaning-in-place or sterilization-in-place regimes, while extended periods at high temperatures should not affect the sensor‘s performance. Regular calibration is also required using appropriate buffering solutions.
4. Industrial Applications of In-Line pH Measurement under Challenging Environmental Conditions
In-line pH sensors, designed for continuous data measurement, have been used in the biotech and pharmaceutical industries for a number of years [48,49,50]. However, there are a limited number of electrode systems capable of providing in-situ pH measurements at temperatures greater than 100 °C and at pressures greater than saturated water pressure. Advances in probe technology have recently allowed relatively inexpensive glass probes to be developed. Recently, Aydogdu et al. published two studies examining the pH of skim milk, milk permeate [51], and milk protein solutions [52] under relatively high temperatures (i.e., 120 °C and 140 °C) using a static batch type system and a continuous method where the probe was inserted in the holding section of a tubular heat exchanger. While the aforementioned studies were a first for dairy products, the pharmaceutical and geothermal industries have been measuring pH under challenging environmental conditions such as high temperature and pressure for a number of years. A report by Sanjuan et al. [53] highlighted a number of probe types and listed their capabilities and disadvantages when operating under harsh geothermal conditions. These geothermal conditions are far more severe than almost anything experienced in the dairy industry, with pH measurements required at temperatures up to ~500 °C and pressures up to 50 MPa, such as those in geothermal vents and hydrothermal fluids.
One of the most robust probes for measuring pH is the solid-state yttria-stabilized zirconia (YSZ) ceramic probe combined with an Ag-AgCI reference electrode allowing in-situ pH to be measured under the most severe environmental conditions. The pH electrode assembly is located at the tip of the sensor and housed in a titanium casing. Several studies have used variations of the YSZ probe. An early study by Inda et al. [54] showed that the YSZ probe followed an almost Nernstian response to potential as a function of pH and gave a stable pH reading within 30 s, as opposed to other probes, which can take significantly longer. At the same time, Jung and Yeon [55] designed a loop system using stainless steel coated in titanium and a YSZ probe to measure the pH of coolants in pressurized water reactors and were capable of accurately measuring pH at 280 °C. A comprehensive study by Truche et al. [56] measured the pH in-situ of NaCl hydrothermal solutions at temperatures up to 280 °C and 150 bar. The pH probe was an oxygen-ion conducting ceramic sensor coupled to an Ag/AgCl reference electrode. An additional custom-made water-cooled jacket was fitted around the external extremity of the reference probes to keep the Ag/AgCl couple at room temperature and to stabilize the reference potential. Accurate pH measurements require that the potential of the reference electrode remains constant. These authors stated that room temperature measurements could not be extrapolated to experimental conditions by numerical simulations when dealing with complex and extreme systems such as those occurring in the Earth’s crust or geothermal wells. Similarly, Aydogdu [51] made a similar statement for milk and milk permeates where capturing pH data from 25 up to 80 °C was not representative of pH at 140 °C when quantified by extrapolation. Limitations of YSZ sensors have been highlighted in recent years, especially dealing with sensor durability when exposed to high temperatures [57], but for the most part, this is within environments of extremes well beyond those used in dairy processing.
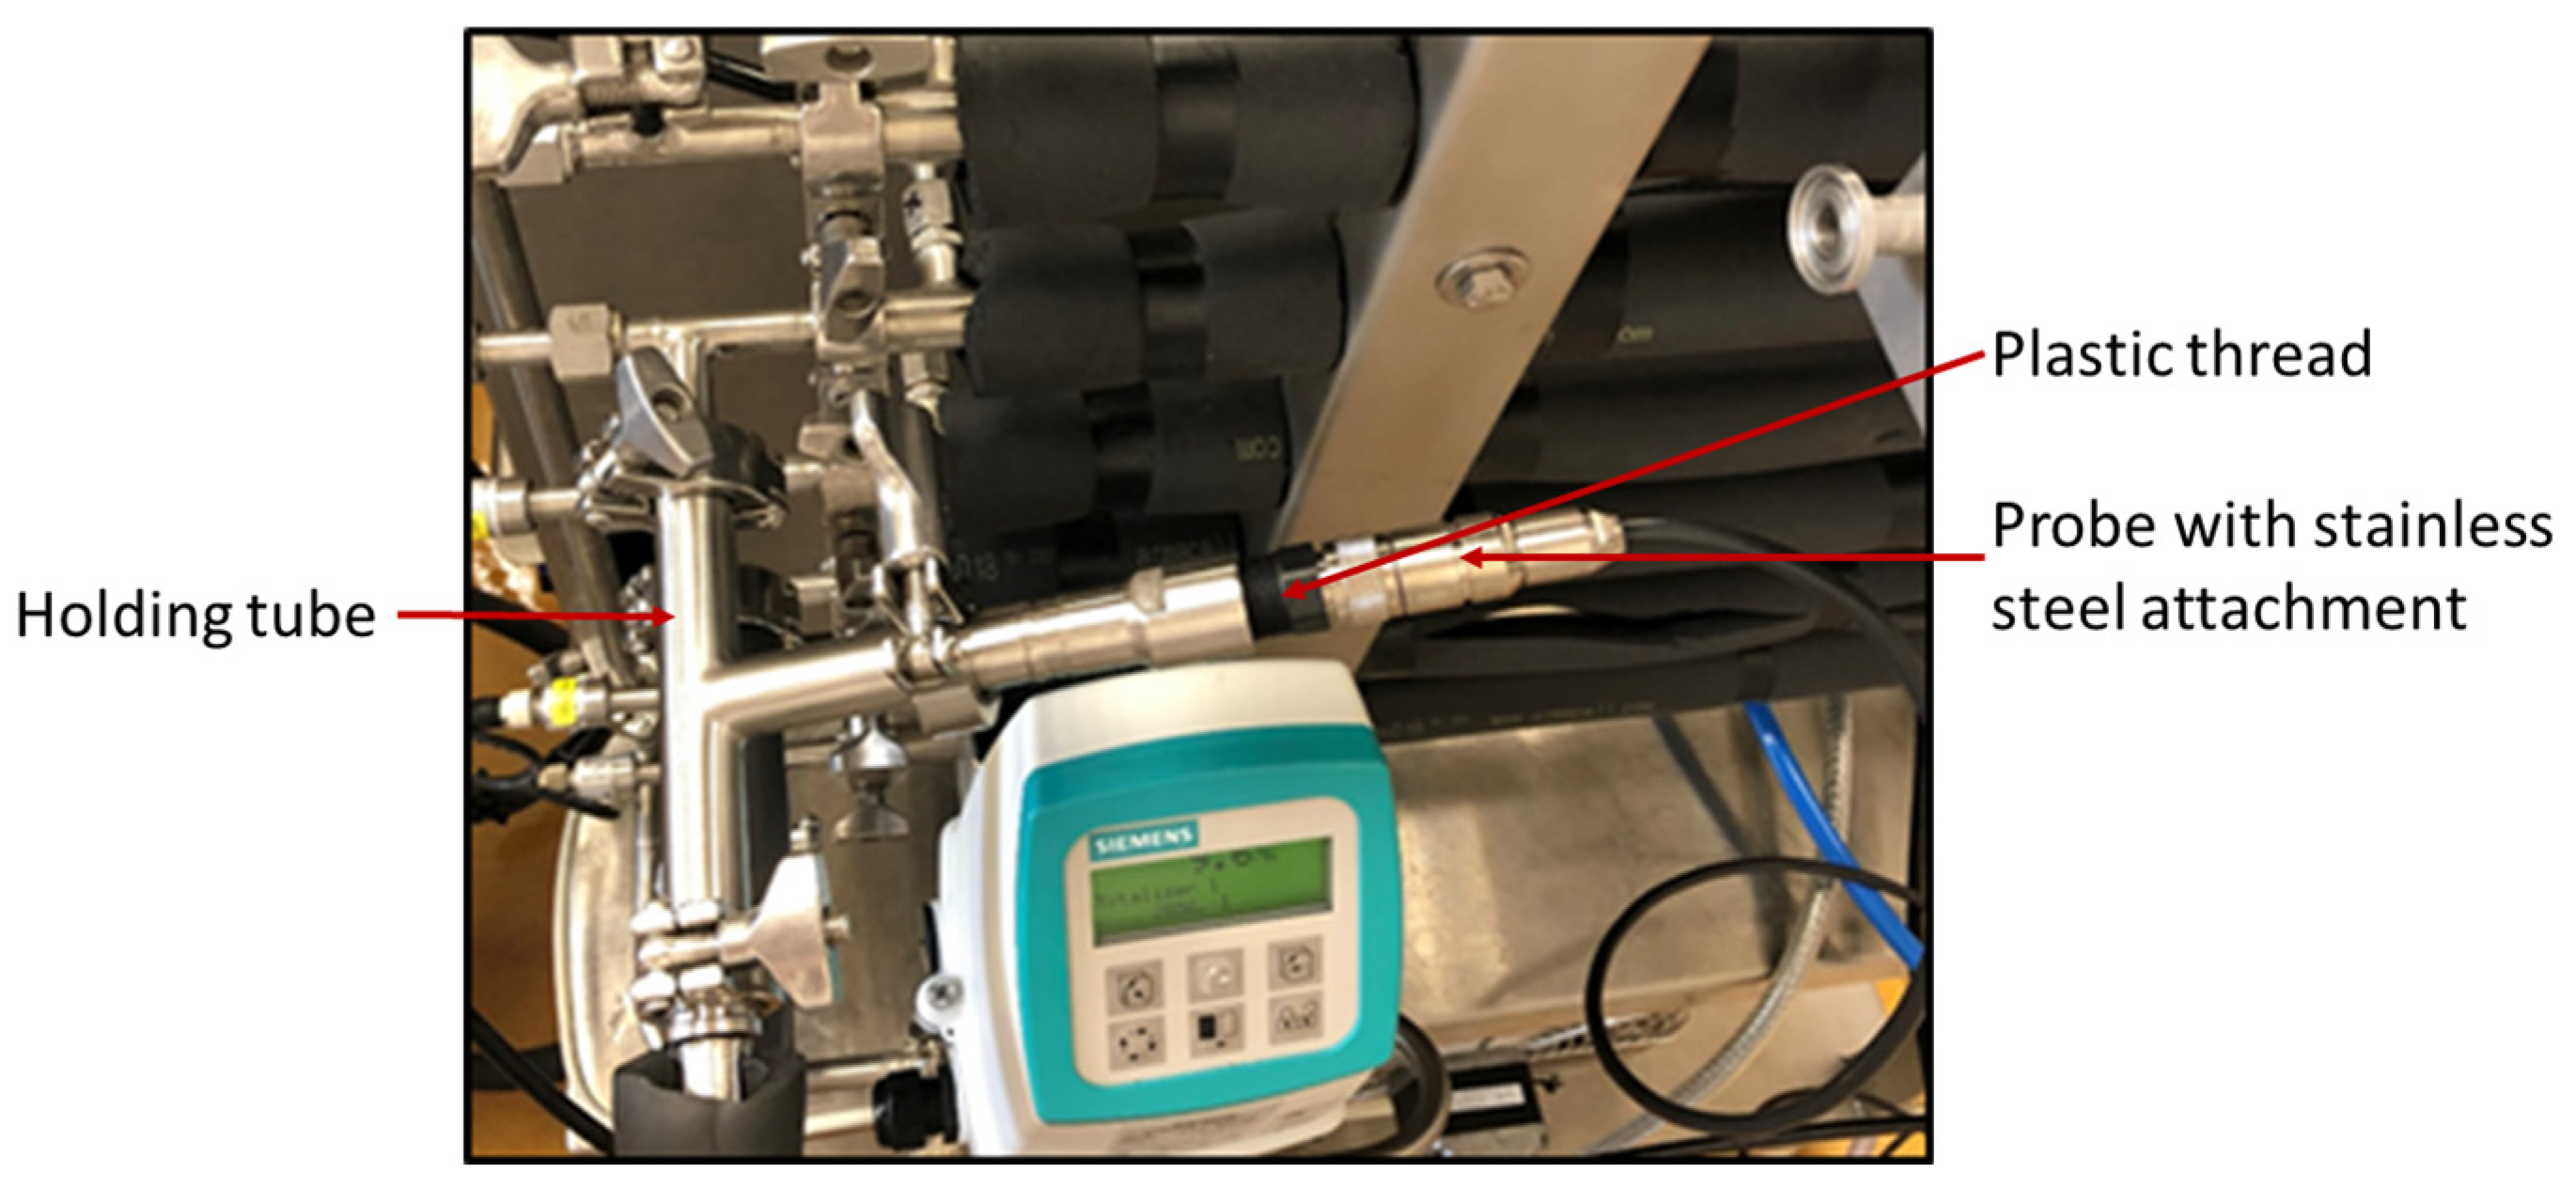
This probe may be relevant to the dairy industry for UHT processing systems where temperatures in excess of 140 °C can be reached, although the product is usually only held for a short period (≤5 s). This type of pH probe may also find more practical applications in high-temperature processing with extended holding times, such as in the use of in-container sterilization, where time–temperature combinations are in the region of 121 °C for >15 min. Previous studies by Aydogdu [51,52], while practical, relatively cheap, and ideal for laboratory applications up to 140 °C, are not suitable for in-line measurements during industrial processing due to the use of a glass housing for the probe (Figure 2). There are, however, more commercially available probes capable of withstanding temperatures up to 130 °C comprised of titanium or ceramic housing and may be an option for pilot–plant applications where run times are relatively short. These probes may also be used during cleaning- or sterilization-in-place for processing equipment. Implementation of analytic tools and smart sensors for real-time monitoring would enable consistent and accurate pH measurements and allow process optimization for maximum efficiency and quality.
Considerations for Choosing the Right Probe
There are many commercial suppliers offering a range of probes capable of measuring pH at high temperatures, and it is often a case of weighing up the conditions of use, i.e., temperature, pressure, accuracy, durability to corrosion, physical abrasion, length of time spent under such conditions and ultimately cost.
5. pH in Dairy Systems
The pH of milk is mainly influenced by the amino acid profile, temperature, and mineral composition. Other milk components such as lactose, lactose breakdown products, and microorganisms all play a role in milk pH but may be considered either secondary or external factors. However, one means of assessing the influence of the entire milk ecosystem on pH is by examining buffering capacity. The method involves adding a known volume of acid or base and monitoring the subsequent pH change. Van Slyke [58] defined the buffering capacity as ((25) and (26)):
where is the number of moles of a strong base and the number of moles of strong acid.
Upreti et al. [14] stated that a total of 36 chemical species were relevant for modeling the buffering capacity of bovine milk and listed them as non-protein substances such as cations (i.e., Na+, K+, Ca2+, Mg2+), anions (i.e., phosphate, citrate, and lactate), metal ion complexes and insoluble calcium phosphate, as well as protein-bound amino acids. The association of ions with proteins, particularly caseins, occurs via electrostatic interactions between phosphoserine residues on the proteins and positively charged free ions, although phosphoserine groups mainly bind with colloidal calcium phosphate. Minerals represent a relatively small fraction of milk compared to fat, protein, lactose, and water; however, they play a vital role in the stability and configuration of casein micelles and concomitantly on the physicochemical and functional properties of dairy products [59]. The six major minerals in milk include Ca, Mg, K, Na, P, and Cl, which are found as complex minerals or free ions and are in a constant state of dynamic equilibrium. This dynamic equilibrium is affected by numerous environmental conditions such as pH, temperature, and solids concentration [60]. Aside from the environmental conditions that effect the mineral balance, it is the protein content, and specifically the micellar casein concentration that distinguishes the distribution between the soluble and insoluble mineral fraction. Soluble milk minerals are present as free ions or associated with counter ions and distributed throughout the aqueous phase, compared to insoluble minerals mainly associated with the micellar casein fraction (e.g., micellar calcium phosphate) [16,17,61]. Approximately one-third of calcium (~9.0 mM), two-thirds of magnesium (~3.0 mM), half of the inorganic phosphate (~11.0 mM), and almost 90% of citrate (~8.0 mM) are found in the aqueous phase, while the remaining minerals are associated with the phosphorylated residues of caseins and form micellar calcium phosphate [60,62].
5.1. Effects of Solids Content and Temperature on Milk pH during Dairy Processing
The removal of water in milk systems equates to an increase in the solute-to-solvent ratio, with a concomitant increase in the ionic strength of the solution. As shown in Section 2.4, the increase in ionic strength directly influences the hydrogen ion activity and, consequently, the pH. Therefore, during evaporation, the pH of milk decreases, and ionic strength increases, causing a reduction in the activity coefficient of soluble calcium and phosphate [63]. Aside from the increase in ionic strength, the concentration of milk often coincides with an increase in viscosity that can affect pH measurement, as the electric potential between the sample and reference can be hindered. This becomes particularly relevant in highly viscous products such as processed cheese. Concurrently heat treatment often occurs simultaneously with evaporation, and as a result, there are multiple factors to be considered when measuring the pH of milk concentrates. As described in Section 3.1, the pH–temperature relationship is described by the Nernst equation and is important for milk systems, which may be subject to thermal conditions ranging from refrigeration at 4 °C, during milk intake and storage, up to ultra-high temperatures (≥140 °C).
Thermal treatment of milk is common practice in the dairy industry in order to inactivate microorganisms, maximize shelf life [64], and alter product functionality (e.g., low, medium, and high heat-treated milk) [65,66]. Studies have shown that milk subjected to heat treatment result in changes in the pH and mineral equilibrium, which is correlated to the extent and severity of the heat treatment [67,68,69,70,71]. Heat treatment of milk at temperatures greater than 90 °C is known to cause irreversible changes to both protein and mineral properties, such as precipitation of calcium phosphate, denaturation and aggregation of whey proteins, casein de-phosphorylation, and release of non-protein nitrogen compounds [57,72]. However, at temperatures less than 90 °C, the shift in the mineral equilibrium from soluble to insoluble is considered to be largely reversible after cooling [73,74]. At ~25 °C, ~66% of the calcium and ~50% of the phosphate in milk are found to be associated with the micellar casein fraction (colloidal calcium phosphate). Increasing the temperature of milk causes a decrease in the soluble contents of both calcium and phosphate with a concomitant release of hydrogen, resulting in a decrease in pH [17,75]. This would mean a shift in equilibrium from left to right in Equation (27) below.
An early study by Brule et al. [76] investigated the effect of heat treatment intensity on the protein-free aqueous phase of milk. In their study, milk permeate (obtained by ultrafiltration of skim milk at 20 °C) was heated to 30 °C, 60 °C, or 90 °C. Results showed that heat treatment significantly affected the precipitation of either mono-calcium phosphate or tri-calcium phosphate based on temperature and initial pH of the permeate. Increased temperature resulted in increased precipitation of calcium and phosphorus and a greater decrease in the pH as a result of hydrogen ion release. These authors suggested that the precipitation of calcium and phosphorus decreased by decreasing the initial pH of the permeate. At pH 6.6, approximately 40% of the calcium and 26% of the phosphorus was precipitated; however, when the pH was adjusted to more acidic values, such as pH 6.0, almost no precipitation was observed. A review by Fox [77] on heat coagulation of milk stated that heat-induced changes are mainly a result of heat-induced acidity, as continuous neutralization delays coagulation indefinitely, regardless of all other heat-induced changes that occur.
5.2. Addition of Salts
The addition of salts to milk and dairy products occurs for numerous reasons, often added as processing aids for binding free ions or added as mineral fortification to meet nutritional requirements. Thus, there is a plethora of research articles and reviews already published focusing on this subject. Primarily covering the addition of ethylenediaminetetraacetic acid (EDTA), citrates, phosphates, etc., to milk systems in order to increase heat stability, particularly in infant formula manufacture, or for protein standardization in milk through the addition of milk permeate [78,79,80,81,82,83,84,85], all of which significantly affect pH depending on concentration and type of mineral addition. Ion sequestrants, such as citrates and phosphates, are well known to influence protein stability and mineral equilibrium and can concomitantly affect pH [84,86,87]. Sequestrants are often added to high-protein dairy concentrates on enhancing their subsequent rehydration and solubility properties after spray drying [86,88]. This is achieved by binding free divalent ions and calcium from colloidal calcium phosphate, which results in swelling and even dissociation at certain levels of the casein micelle. McCarthy et al. [88] showed significant changes in the pH of milk protein solutions with the addition of salt type and concentration, with trisodium citrate increasing pH, whereas sodium dihydrogen phosphate caused a significant decrease in pH. Therefore, there was not only an effect from sequestering ions but also from the protonation or deprotonation of amino acids affecting protein electrostatic charge. Sequestrants are often referred to as emulsifying salts in the area of processed cheese manufacture, where they are added to hydrate the protein from cheese and allow hydrated proteins to sufficiently emulsify the melted fat during the cooking process, which usually takes place at temperatures between 80 °C and 100 °C [89]. pH is adjusted to between pH 5.7 and 6.0 using either citric acid, lactic acid, or sodium hydroxide at a dry matter content of ~50% (w/w). However, as shown by Guinee and O’Callaghan [90], pH adjustment is often performed off-line (Section 3.2.1), where subsamples were cooled, pH adjusted, and re-measured after 24 h. Given the influence of pH on the texture and microstructure of processed cheese, in-situ pH monitoring during cooking and shearing could be particularly valuable, where hydrogen ion activity will differ significantly at high temperature in addition to the ion binding capacity of emulsifying salts.
6. Conclusions
Hydrogen ion concentration defines most chemical reactions, influencing the biological and physical properties of systems. From its inception in the early 20th century, the measurement of pH has remained a barometer for chemical processes. However, it is apparent that the significant level of pH monitoring in the dairy industry is usually performed at-line or off-line with a significant lack of in-situ measurements taking place. However, advances in pH measurement have increased steadily with more rapid and accurate probes available. This review has highlighted these probes are able to withstand high pressure and temperatures and that the dairy industry could potentially avail of them. Processed cheese and infant formula applications are ideal examples of where high solids (~50%, w/w, dry matter), high-temperature processing, and the sequestering of monovalent and divalent ions is performed and where real-time in-situ monitoring of pH could provide greater in process control and product quality. Aside from the dairy industry, examining potential technologies from other industries, such as the geothermal sector, has allowed dairy scientists to examine pH in milk-based systems under challenging conditions, highlighting the benefit of using cross-sector technology.
Author Contributions
Conceptualization, N.A.M., J.A.O. and T.A.; funding acquisition, N.A.M.; project administration, J.A.O. and N.A.M.; supervision, J.A.O. and N.A.M.; methodology, N.A.M., T.A. and J.A.O.; writing—original draft; T.A.; writing—review and editing, T.A., J.A.O. and N.A.M. All authors have read and agreed to the published version of the manuscript.
Funding
This research was funded by the Teagasc Agriculture and Food Development Authority under the Walsh Fellowship Program (MDDT0184).
Conflicts of Interest
The authors declare no conflict of interest.
References
- Karastogianni, S.; Girousi, S.; Sotiropoulos, S. pH: Principles and Measurement. In Encyclopedia of Food and Health; Caballero, B., Finglas, P.M., Toldrá, F., Eds.; Academic Press: Oxford, UK, 2016; pp. 333–338. [Google Scholar]
- Salvo, P.; Melai, B.; Calisi, N.; Paoletti, C.; Bellagambi, F.; Kirchhain, A.; Trivella, M.G.; Fuoco, R.; Di Francesco, F. Graphene-based devices for measuring pH. Sens. Actuators B Chem. 2018, 256, 976–991. [Google Scholar] [CrossRef]
- Orouji, A.; Abbasi-Moayed, S.; Ghasemi, F.; Hormozi-Nezhad, M.R. A wide-range pH indicator based on colorimetric patterns of gold@ silver nanorods. Sens. Actuators B Chem. 2022, 358, 131479. [Google Scholar] [CrossRef]
- Martinsen, O.G.; Grimnes, S. Bioimpedance and Bioelectricity Basics; Academic Press: Cambridge, MA, USA, 2011. [Google Scholar]
- Calio, P.B.; Li, C.; Voth, G.A. Resolving the structural debate for the hydrated excess proton in water. J. Am. Chem. Soc. 2021, 143, 18672–18683. [Google Scholar] [CrossRef] [PubMed]
- Yang, J. Deuterium: Discovery and Applications in Organic Chemistry; Elsevier: Amsterdam, The Netherlands, 2016. [Google Scholar]
- Bleam, W. Chapter 1—Element Abundance. In Soil and Environmental Chemistry, 2nd ed.; Bleam, W., Ed.; Academic Press: Cambridge, MA, USA, 2017; pp. 1–38. [Google Scholar]
- Katz, J.J. Deuterium and Tritium. In Kirk-Othmer Encyclopedia of Chemical Technology; John Wiley & Sons: New York, NY, USA, 1998. [Google Scholar]
- Iglesias, F.C.; Barber, D.H. Heavy Water Reactor Fuel Design and Performance. In Encyclopedia of Materials: Science and Technology; Buschow, K.H.J., Cahn, R.W., Flemings, M.C., Ilschner, B., Kramer, E.J., Mahajan, S., Veyssière, P., Eds.; Elsevier: Oxford, UK, 2001; pp. 3741–3745. [Google Scholar]
- Carroll, J. Chapter 1—Introduction. In Natural Gas Hydrates, 4th ed.; Carroll, J., Ed.; Gulf Professional Publishing: Boston, MA, USA, 2020; pp. 1–26. [Google Scholar]
- Rondinini, S. pH measurements in non-aqueous and aqueous–organic solvents–definition of standard procedures. Anal. Bioanal. Chem. 2002, 374, 813–816. [Google Scholar] [CrossRef]
- Streng, W.H.; Hsi, S.K.; Helms, P.E.; Tan, H.G.H. General treatment of pH–solubility profiles of weak acids and bases and the effects of different acids on the solubility of a weak base. J. Pharm. Sci. 1984, 73, 1679–1684. [Google Scholar] [CrossRef]
- Butler, J.N. Ionic Equilibrium: Solubility and pH Calculations; John Wiley & Sons: Hoboken, NJ, USA, 1998. [Google Scholar]
- Upreti, P.; Bühlmann, P.; Metzger, L.E. Influence of Calcium and Phosphorus, Lactose, and Salt-to-Moisture Ratio on Cheddar Cheese Quality: pH Buffering Properties of Cheese. J. Dairy Sci. 2006, 89, 938–950. [Google Scholar] [CrossRef] [Green Version]
- Khan, S.; Sayed, M.; Sohail, M.; Shah, L.A.; Raja, M.A. Advanced oxidation and reduction processes. Adv. Water Purif. Tech. 2019, 135–164. [Google Scholar] [CrossRef]
- Holt, C. The milk salts and their interaction with casein. Adv. Dairy Chem. 1997, 3, 233–256. [Google Scholar]
- Lucey, J.; Horne, D. Milk salts: Technological significance. In Advanced Dairy Chemistry; McSweeney, P.F.P., Ed.; Springer: New York, NY, USA, 2009; pp. 351–389. [Google Scholar]
- Ayyampalayam, S.N. Modeling the Temperature Dependance of pKa and Integration of Chemical Process Models Using SPARC. Ph.D. Thesis, University of Georgia, Athens, GA, USA, 2004. [Google Scholar]
- Reijenga, J.; Van Hoof, A.; Van Loon, A.; Teunissen, B. Development of methods for the determination of pKa values. Anal. Chem. Insights 2013, 8, S12304. [Google Scholar] [CrossRef] [Green Version]
- ISO 8968-4:2016; Milk and Milk Products–Determination of Nitrogen Content–Part 4: Determination of Protein and Non-Protein Nitrogen Content and True Protein Content Calculation (Reference Method). ISO: Geneva, Switzerland, 2016.
- Bolan, N.S.; Kandaswamy, K. pH. In Encyclopedia of Soils in the Environment; Hillel, D., Ed.; Elsevier: Oxford, UK, 2005; pp. 196–202. [Google Scholar]
- Himmel, D.; Goll, S.K.; Leito, I.; Krossing, I. A Unified pH Scale for All Phases. Angew. Chem. Int. Ed. 2010, 49, 6885–6888. [Google Scholar] [CrossRef]
- Ugo, P.; Daniele, S.; Mazzocchin, G.-A.; Bontempelli, G. Acid-base equilibria in organic solvents: Part 3. An Absolute pH Scale from Proton Basicity Evaluated by Cyclic Voltammetry. Anal. Chim. Acta 1988, 208, 207–217. [Google Scholar] [CrossRef]
- Katritzky, A.R.; Fara, D.C.; Yang, H.; Tämm, K.; Tamm, T.; Karelson, M. Quantitative measures of solvent polarity. Chem. Rev. 2004, 104, 175–198. [Google Scholar] [CrossRef]
- Kahlert, H.; Leito, I. Generalization of Acid-Base Diagrams Based on the Unified pH-Scale. ChemPhysChem 2019, 20, 1779–1785. [Google Scholar] [CrossRef] [Green Version]
- Deleebeeck, L.; Snedden, A.; Nagy, D.; Szilágyi Nagyné, Z.; Roziková, M.; Vičarová, M.; Heering, A.; Bastkowski, F.; Leito, I.; Quendera, R.; et al. Unified pH Measurements of Ethanol, Methanol, and Acetonitrile, and Their Mixtures with Water. Sensors 2021, 21, 3935. [Google Scholar] [CrossRef]
- Lainela, S.; Leito, I.; Heering, A.; Capitaine, G.; Anes, B.; Camões, F.; Stoica, D. Toward Unified pH of Saline Solutions. Water 2021, 13, 2522. [Google Scholar] [CrossRef]
- Heering, A.; Bastkowski, F.; Seitz, S. Glass electrode half-cells for measuring unified pH in ethanol–water mixtures. J. Sens. Sens. Syst. 2020, 9, 383–389. [Google Scholar]
- Radtke, V.; Stoica, D.; Leito, I.; Camões, F.; Krossing, I.; Anes, B.; Roziková, M.; Deleebeeck, L.; Veltzé, S.; Näykki, T.; et al. A unified pH scale for all solvents: Part I—Intention and reasoning (IUPAC Technical Report). Pure Appl. Chem. 2021, 93, 1049–1060. [Google Scholar] [CrossRef]
- Erxleben, S.W.; Pelan, E.; Wolf, B. Effect of ethanol on the stability of sodium caseinate stabilised emulsions. Food Hydrocoll. 2021, 121, 107058. [Google Scholar] [CrossRef]
- Yuqing, M.; Jianrong, C.; Keming, F. New technology for the detection of pH. J. Biochem. Biophys. Methods 2005, 63, 1–9. [Google Scholar] [CrossRef]
- Galster, H. pH Measurement; VCH (Verlagsgesellschaft): New York, NY, USA, 1991. [Google Scholar]
- Webster, D. pH—Principles and measurement. In Encyclopedia of Food Sciences and Nutrition, 2nd ed.; Caballero, B., Ed.; Academic Press: Oxford, UK, 2003; pp. 4501–4507. [Google Scholar]
- Johnson, E.; King, J. The determination of the acidity of milk. Analyst 1951, 76, 504–509. [Google Scholar] [CrossRef]
- Allan, D.; Heacock, H. Determining the accuracy of colorimetric pH testing compared to potentiometric methods. BCIT Environ. Public Health J. 2017. [Google Scholar] [CrossRef]
- Herber, S.; Olthuis, W.; Bergveld, P.; Berg, A. Exploitation of a pH-sensitive hydrogel for CO2 detection. In Proceedings of the Eurosensors XVII, European Conference on Solid-State Transducers, Guimaraes, Portugal, 21–14 September 2003; pp. 21–24. [Google Scholar]
- Horváth, V.; Horvai, G. ION-SELECTIVE ELECTRODES | Solid-State. In Encyclopedia of Analytical Science, 2nd ed.; Worsfold, P., Townshend, A., Poole, C., Eds.; Elsevier: Oxford, UK, 2005; pp. 502–508. [Google Scholar]
- Kohler, H.-H.; Haider, C.; Woelki, S. Selectivity and dynamic behavior of glass electrodes. Adv. Colloid Interface Sci. 2005, 114, 281–290. [Google Scholar] [CrossRef] [PubMed]
- Hashimoto, T.; Kitabayashi, H.; Ito, K.; Nasu, H.; Ishihara, A.; Nishio, Y. Effect of heat-treatment on the pH sensitivity of stainless-steel electrodes as pH sensors. Heliyon 2019, 5, e01239. [Google Scholar] [CrossRef] [PubMed] [Green Version]
- Huang, X.-R.; Ren, Q.-Q.; Yuan, X.-J.; Wen, W.; Chen, W.; Zhan, D.-P. Iridium oxide based coaxial pH ultramicroelectrode. Electrochem. Commun. 2014, 40, 35–37. [Google Scholar] [CrossRef]
- Yamamoto, K.; Shi, G.; Zhou, T.; Xu, F.; Zhu, M.; Liu, M.; Kato, T.; Jin, J.-Y.; Jin, L. Solid-state pH ultramicrosensor based on a tungstic oxide film fabricated on a tungsten nanoelectrode and its application to the study of endothelial cells. Anal. Chim. Acta 2003, 480, 109–117. [Google Scholar] [CrossRef]
- Nyein, H.Y.Y.; Gao, W.; Shahpar, Z.; Emaminejad, S.; Challa, S.; Chen, K.; Fahad, H.M.; Tai, L.-C.; Ota, H.; Davis, R.W. A wearable electrochemical platform for noninvasive simultaneous monitoring of Ca2+ and pH. ACS Nano 2016, 10, 7216–7224. [Google Scholar] [CrossRef] [Green Version]
- Guinovart, T.; Valdés-Ramírez, G.; Windmiller, J.R.; Andrade, F.J.; Wang, J. Bandage-based wearable potentiometric sensor for monitoring wound pH. Electroanalysis 2014, 26, 1345–1353. [Google Scholar] [CrossRef]
- Hashimoto, T.; Miwa, M.; Nasu, H.; Ishihara, A.; Nishio, Y. pH sensors using 3d-block metal oxide-coated stainless steel electrodes. Electrochim. Acta 2016, 220, 699–704. [Google Scholar] [CrossRef] [Green Version]
- Munir, M.T.; Wilson, D.I.; Depree, N.; Boiarkina, I.; Prince-Pike, A.; Young, B.R. Real-time product release and process control challenges in the dairy milk powder industry. Curr. Opin. Food Sci. 2017, 17, 25–29. [Google Scholar] [CrossRef]
- Tajammal Munir, M.; Yu, W.; Young, B.R.; Wilson, D.I. The current status of process analytical technologies in the dairy industry. Trends Food Sci. Technol. 2015, 43, 205–218. [Google Scholar] [CrossRef]
- O’Shea, N.; O’Callaghan, T.F.; Tobin, J.T. The application of process analytical technologies (PAT) to the dairy industry for real time product characterization—Process viscometry. Innov. Food Sci. Emerg. Technol. 2019, 55, 48–56. [Google Scholar] [CrossRef]
- Bychkov, A.Y.; Bénézeth, P.; Pokrovsky, O.S.; Shvarov, Y.V.; Castillo, A.; Schott, J. Experimental determination of calcite solubility and the stability of aqueous Ca– and Na–carbonate and –bicarbonate complexes at 100–160 °C and 1–50 bar pCO2 using in-situ pH measurements. Geochim. Cosmochim. Acta 2020, 290, 352–365. [Google Scholar] [CrossRef]
- Palmer, D.A.; Bénézeth, P.; Wesolowski, D.J. Aqueous high-temperature solubility studies. I. The solubility of boehmite as functions of ionic strength (to 5 molal, NaCl), temperature (100–290 °C), and pH as determined by in-situ measurements. Geochim. Cosmochim. Acta 2001, 65, 2081–2095. [Google Scholar] [CrossRef]
- Wen, K.; Hu, C.; Wu, W.; Shvedova, K.; Born, S.C.; Takizawa, B.; Mascia, S. Proof-of-Concept Design of an In-Line pH Neutralization System with Coarse and Fine Adjustments for the Continuous Manufacturing of Pharmaceuticals. Org. Process Res. Dev. 2021, 25, 1853–1861. [Google Scholar] [CrossRef]
- Aydogdu, T.; O’Mahony, J.A.; Huppertz, T.; Magan, J.B.; McCarthy, N.A. Measuring pH of skim milk and milk permeate at ultra-high temperatures at laboratory and pilot scale. Int. Dairy J. 2023, 139, 105565. [Google Scholar] [CrossRef]
- Aydogdu, T.; O’Mahony, J.A.; McCarthy, N.A. Measurement of pH at high temperature in milk protein solutions. Int. Dairy J. 2022, 131, 105383. [Google Scholar] [CrossRef]
- Sanjuan, B.; Béchu, E.; Braibant, G.; Lebert, F. High Temperature-High Pressure Rated Sensors and Tools Useful for Geothermal Purposes. Bibliographical Review; Final Report, BRGM/RP-57342-FR; BRGM: Orléans, France, 2009; 44p.
- Inda, Y.; Yamashita, K.; Umegaki, T.; Greenblatt, M. High temperature pH sensitivities of stabilized zirconia films and ceria ceramics. Solid State Ion. 1996, 86, 1121–1124. [Google Scholar] [CrossRef]
- Jung, Y.-J.; Yeon, J.-W. Fabrication and evaluation of a new high-temperature pH sensor for use in PWR nuclear power plants. Bull. Korean Chem. Soc. 2010, 31, 2939–2942. [Google Scholar] [CrossRef] [Green Version]
- Truche, L.; Bazarkina, E.F.; Berger, G.; Caumon, M.-C.; Bessaque, G.; Dubessy, J. Direct measurement of CO2 solubility and pH in NaCl hydrothermal solutions by combining in-situ potentiometry and Raman spectroscopy up to 280 °C and 150 bar. Geochim. Cosmochim. Acta 2016, 177, 238–253. [Google Scholar] [CrossRef]
- Van Dijk, H.J.M.; Hersevoort, A. The properties of casein micelles. V: The determination of heat-induced calcium phosphate precipitations in milk. Ned. Melk Zuiveltijdschr. 1992, 46, 69–76. [Google Scholar]
- Van Slyke, D.D. On the measurement of buffer values and on the relationship of buffer value to the dissociation constant of the buffer and the concentration and reaction of the buffer solution. J. Biol. Chem. 1922, 52, 525–570. [Google Scholar] [CrossRef]
- Yadav, M.; Singh, V. Studies on calcium and phosphorus content of buffalo milk. I. Variation due to stage of lactation. Milchwissenschaft 1970, 25, 529–531. [Google Scholar]
- Gaucheron, F. The minerals of milk. Reprod. Nutr. Dev. 2005, 45, 473–483. [Google Scholar] [CrossRef] [PubMed]
- Nieuwenhuijse, H.; Huppertz, T. Heat-induced changes in milk salts: A review. Int. Dairy J. 2021, 126, 105220. [Google Scholar] [CrossRef]
- Kelleher, C.M.; Aydogdu, T.; Murphy, K.M.; O’Mahony, J.A.; Kelly, A.L.; O’Callaghan, D.J.; McCarthy, N.A. The effect of protein profile and preheating on denaturation of whey proteins and development of viscosity in milk protein beverages during heat treatment. Int. J. Dairy Technol. 2020, 73, 494–501. [Google Scholar] [CrossRef]
- Aydogdu, T.; Ho, Q.T.; Ahrné, L.; O’Mahony, J.A.; McCarthy, N.A. The influence of milk minerals and lactose on heat stability and age-thickening of milk protein concentrate systems. Int. Dairy J. 2021, 118, 105037. [Google Scholar] [CrossRef]
- Dash, K.K.; Fayaz, U.; Dar, A.H.; Shams, R.; Manzoor, S.; Sundarsingh, A.; Deka, P.; Khan, S.A. A comprehensive review on heat treatments and related impact on the quality and microbial safety of milk and milk-based products. Food Chem. Adv. 2022, 1, 100041. [Google Scholar] [CrossRef]
- Raikos, V. Effect of heat treatment on milk protein functionality at emulsion interfaces. A review. Food Hydrocoll. 2010, 24, 259–265. [Google Scholar] [CrossRef]
- McCarthy, N.A.; Magan, J.B.; Kelleher, C.M.; Kelly, A.L.; O’Mahony, J.A.; Murphy, E.G. Heat treatment of milk: Effect on concentrate viscosity, powder manufacture and end-product functionality. Int. Dairy J. 2022, 128, 105289. [Google Scholar] [CrossRef]
- Boiani, M.; Fenelon, M.; FitzGerald, R.J.; Kelly, P.M. Use of 31P NMR and FTIR to investigate key milk mineral equilibria and their interactions with micellar casein during heat treatment. Int. Dairy J. 2018, 81, 12–18. [Google Scholar] [CrossRef] [Green Version]
- Havea, P.; Singh, H.; Creamer, L.K. Heat-induced aggregation of whey proteins: Comparison of cheese WPC with acid WPC and relevance of mineral composition. J. Agric. Food Chem. 2002, 50, 4674–4681. [Google Scholar] [CrossRef]
- Pouliot, Y.; Boulet, M.; Paquin, P. Observations on the heat-induced salt balance changes in milk I. Effect of heating time between 4 and 90 °C. J. Dairy Res. 1989, 56, 185–192. [Google Scholar] [CrossRef]
- Sauer, A.; Moraru, C.I. Heat stability of micellar casein concentrates as affected by temperature and pH. J. Dairy Sci. 2012, 95, 6339–6350. [Google Scholar] [CrossRef] [Green Version]
- Schiffer, S.; Scheidler, E.; Kiefer, T.; Kulozik, U. Effect of Temperature, Added Calcium and pH on the Equilibrium of Caseins between Micellar State and Milk Serum. Foods 2021, 10, 822. [Google Scholar] [CrossRef]
- Morr, C.V. Effect of Heat upon Size and Composition of Proteins Sedimented from Normal and Concentrated Skimmilk1. J. Dairy Sci. 1965, 48, 29–33. [Google Scholar] [CrossRef]
- Pouliot, Y.; Boulet, M.; Paquin, P. Observations on the heat-induced salt balance changes in milk II. Reversibility on cooling. J. Dairy Res. 1989, 56, 193–199. [Google Scholar] [CrossRef]
- Wahlgren, N.M.; Dejmek, P.; Drakenberg, T. A 43Ca and 31P NMR study of the calcium and phosphate equilibria in heated milk solutions. J. Dairy Res. 1990, 57, 355–364. [Google Scholar] [CrossRef]
- Schmitt, M.; Saulnier, F.; Malhautier, L.; Linden, G. Effect of temperature on the salt balance of milk studied by capillary ion electrophoresis. J. Chromatogr. A 1993, 640, 419–424. [Google Scholar] [CrossRef]
- Brule, G.; Real del Sol, E.; Fauquant, J.; Fiaud, C. Mineral Salts Stability in Aqueous Phase of Milk: Influence of Heat Treatments. J. Dairy Sci. 1978, 61, 1225–1232. [Google Scholar] [CrossRef]
- Fox, P. Heat-induced changes in milk preceding coagulation. J. Dairy Sci. 1981, 64, 2127–2137. [Google Scholar] [CrossRef]
- Le Ray, C.; Maubois, J.-L.; Gaucheron, F.; Brulé, G.; Pronnier, P.; Garnier, F. Heat stability of reconstituted casein micelle dispersions: Changes induced by salt addition. Le Lait 1998, 78, 375–390. [Google Scholar] [CrossRef] [Green Version]
- Augustin, M.-A.; Clarke, P.T. Effects of added salts on the heat stability of recombined concentrated milk. J. Dairy Res. 1990, 57, 213–226. [Google Scholar] [CrossRef]
- Sweetsur, A.W.M.; Muir, D.D. The use of permitted additives and heat-treatment to optimize the heat-stability of skim milk and concentrated skim milk. Int. J. Dairy Technol. 1980, 33, 101–105. [Google Scholar] [CrossRef]
- Wang, C.; Zhu, Y.; Wang, J. Comparative study on the heat stability of goat milk and cow milk. Indian J. Anim. Res. 2016, 50, 610–613. [Google Scholar] [CrossRef]
- Singh, J.; Dean, A.; Prakash, S.; Bhandari, B.; Bansal, N. Ultra high temperature stability of milk protein concentrate: Effect of mineral salts addition. J. Food Eng. 2021, 300, 110503. [Google Scholar] [CrossRef]
- Crowley, S.V.; Kelly, A.L.; O’Mahony, J.A. Fortification of reconstituted skim milk powder with different calcium salts: Impact of physicochemical changes on stability to processing. Int. J. Dairy Technol. 2014, 67, 474–482. [Google Scholar] [CrossRef]
- Renhe, I.R.T.; Indris, L.M.; Corredig, M. Effect of calcium chelators on heat stability and heat-induced changes of milk microfiltered concentrates. Int. Dairy J. 2018, 82, 4–10. [Google Scholar] [CrossRef]
- Karlsson, M.A.; Lundh, Å.; Innings, F.; Höjer, A.; Wikström, M.; Langton, M. The effect of calcium, citrate, and urea on the stability of ultra-high temperature treated milk: A full factorial designed study. Foods 2019, 8, 418. [Google Scholar] [CrossRef] [Green Version]
- de Kort, E.; Minor, M.; Snoeren, T.; van Hooijdonk, T.; van der Linden, E. Effect of calcium chelators on physical changes in casein micelles in concentrated micellar casein solutions. Int. Dairy J. 2011, 21, 907–913. [Google Scholar] [CrossRef]
- de Kort, E.; Minor, M.; Snoeren, T.; van Hooijdonk, T.; van der Linden, E. Effect of calcium chelators on heat coagulation and heat-induced changes of concentrated micellar casein solutions: The role of calcium-ion activity and micellar integrity. Int. Dairy J. 2012, 26, 112–119. [Google Scholar] [CrossRef]
- McCarthy, N.A.; Power, O.; Wijayanti, H.B.; Kelly, P.M.; Mao, L.; Fenelon, M.A. Effects of calcium chelating agents on the solubility of milk protein concentrate. Int. J. Dairy Technol. 2017, 70, 415–423. [Google Scholar] [CrossRef]
- Chen, L.; Liu, H. Effect of emulsifying salts on the physicochemical properties of processed cheese made from Mozzarella. J. Dairy Sci. 2012, 95, 4823–4830. [Google Scholar] [CrossRef]
- Guinee, T.; O’Callaghan, D. Effect of increasing the protein-to-fat ratio and reducing fat content on the chemical and physical properties of processed cheese product. J. Dairy Sci. 2013, 96, 6830–6839. [Google Scholar] [CrossRef] [Green Version]
Figure 1.
Schematic representation of off-line, at-line, on-line, and in-line approaches to measuring pH in dairy processing.
Figure 1.
Schematic representation of off-line, at-line, on-line, and in-line approaches to measuring pH in dairy processing.

Figure 2.
Image of an in-line pH probe inserted within the holding tube of a tubular heat exchanger [51].
Figure 2.
Image of an in-line pH probe inserted within the holding tube of a tubular heat exchanger [51].

Table 1.
The pH scale based on H+ and OH− concentration.
| pH | H+ Concentration (mol/L) | OH− Concentration (mol/L) | |
|---|---|---|---|
| Acidic | 0 | 1.0 | 0.00000000000001 |
| 1 | 0.1 | 0.0000000000001 | |
| 2 | 0.01 | 0.000000000001 | |
| 3 | 0.001 | 0.00000000001 | |
| 4 | 0.0001 | 0.0000000001 | |
| 5 | 0.00001 | 0.000000001 | |
| 6 | 0.000001 | 0.00000001 | |
| Neutral | 7 | 0.0000001 | 0.0000001 |
| Alkaline | 8 | 0.00000001 | 0.000001 |
| 9 | 0.000000001 | 0.00001 | |
| 10 | 0.0000000001 | 0.0001 | |
| 11 | 0.00000000001 | 0.001 | |
| 12 | 0.000000000001 | 0.01 | |
| 13 | 0.0000000000001 | 0.1 | |
| 14 | 0.00000000000001 | 1.0 |
Table 2.
Equilibrium constant values of some strong and weak acids commonly used in dairy processing.
Table 2.
Equilibrium constant values of some strong and weak acids commonly used in dairy processing.
| Acid | Chemical Formula | pKa1 | pKa2 | pKa3 | |
|---|---|---|---|---|---|
| Strong acid | Hydrochloric Acid | HCl | −7.0 | - | - |
| Weak acids | Phosphoric Acid | H3PO4 | 2.1 | 7.1 | 12.4 |
| Citric Acid | HOC(CO2H)(CH2CO2H)2 | 3.1 | 4.8 | 6.4 | |
| Lactic Acid | CH3CH(OH)COOH | 3.9 | - | - | |
| Acetic Acid | CH3COOH | 4.8 | - | - | |
Disclaimer/Publisher’s Note: The statements, opinions and data contained in all publications are solely those of the individual author(s) and contributor(s) and not of MDPI and/or the editor(s). MDPI and/or the editor(s) disclaim responsibility for any injury to people or property resulting from any ideas, methods, instructions or products referred to in the content. |
© 2023 by the authors. Licensee MDPI, Basel, Switzerland. This article is an open access article distributed under the terms and conditions of the Creative Commons Attribution (CC BY) license (https://creativecommons.org/licenses/by/4.0/).
Share and Cite
MDPI and ACS Style
Aydogdu, T.; O’Mahony, J.A.; McCarthy, N.A. pH, the Fundamentals for Milk and Dairy Processing: A Review. Dairy 2023, 4, 395-409. https://doi.org/10.3390/dairy4030026
AMA Style
Aydogdu T, O’Mahony JA, McCarthy NA. pH, the Fundamentals for Milk and Dairy Processing: A Review. Dairy. 2023; 4(3):395-409. https://doi.org/10.3390/dairy4030026
Chicago/Turabian StyleAydogdu, Tugce, James A. O’Mahony, and Noel A. McCarthy. 2023. "pH, the Fundamentals for Milk and Dairy Processing: A Review" Dairy 4, no. 3: 395-409. https://doi.org/10.3390/dairy4030026