

High Protein—Low Viscosity? How to Tailor Rheological Properties of Fermented Concentrated Milk Products

1
Department of Soft Matter Science and Dairy Technology, Institute of Food Science and Biotechnology, University of Hohenheim, Garbenstr. 21, 70599 Stuttgart, Germany
2
Zifo Technologies GmbH, Tengstr. 27, 80798 Munich, Germany
3
Department of Food Science and Biotechnology, Oregon State University, 3051 SE Campus Way, Corvallis, OR 97331, USA
*
Author to whom correspondence should be addressed.
Dairy 2023, 4(4), 594-605; https://doi.org/10.3390/dairy4040041
Submission received: 19 September 2023
/
Revised: 2 November 2023
/
Accepted: 8 November 2023
/
Published: 10 November 2023
(This article belongs to the Special Issue Tailoring Physical Properties of Fermented Dairy Products)
Abstract
:The rheological properties, e.g., viscosity and yield stress, of fermented concentrated milk products (protein content > 8%) are strongly dependent on their volume fraction. Post-treatment with high-power ultrasound can reduce the volume fraction of these products and, hence, lead to reduced crowding effects and thus lower viscosities and yield stress. Besides that, the particle size distribution (span) should stay unaltered. Increasing the energy input during the sonication of fat-free fresh cheese with a protein content of 8.9 ± 0.4% decreased the volume fraction below the limit for concentrated products (ϕ = 0.4), while the particle size also decreased. This led to a narrowed span and, hence, the viscosity should have increased; however, the results showed that viscosity and yield stress were decreasing. Consequently, the influence of the span was neglectable for concentrated fermented milk products with volume fractions below the concentrated area. Furthermore, the sonicated samples showed no syneresis over a storage time of two weeks. The sonicated samples reached similar rheological properties to commercial stirred yogurt, which demonstrated the suitability of high-power ultrasound as a post-treatment to tailor the rheological properties of high-protein fermented milk products.
1. Introduction
For athletes, high-protein products can be beneficial for specific sports nutrition and calorie-restricted diets, due to a faster satiating effect of protein compared to fat and carbohydrates [1,2,3,4,5]. Smoothness and viscosity, among other attributes, are important for a high preference for protein-enriched products. However, high protein contents above 8% and low fat contents lead to a more viscous and firm appearance of the product, sometimes even with a sandy and grainy perception [5,6]. These products are not just less favored by the overall customers, but also problematic for dysphagia patients, who cannot consume these products and are reportedly prone to malnutrition due to a limited variety of suitable foods [1,7,8,9].
An example of protein-rich products is the group of fermented milk products, which can be referred to as microgel dispersions. Milk protein-based microgel dispersions consist of soft, gel-like microgel particles that are composed of cross-linked milk proteins. An increased firmness can be achieved by increasing the protein content of the products using several different methods. This group, namely, concentrated yogurts (greek-style) and quarg-like products, contains protein contents above 8% and can be referred to as concentrated microgel dispersions [10,11,12,13].
The issue with concentrated microgel dispersions is the increasing volume fraction ϕ with rising protein contents. Looking at those concentrated microgel dispersions (ϕ > 0.4), the flowability of the microgel particles is impeded due to crowding effects (sticking, friction) occurring between the neighboring microgel particles with rising volume fractions ϕ. Hence, a rising volume fraction ϕ leads to increased apparent viscosities η’ and yield stresses τ0 [14,15,16,17,18]. For dilute microgel dispersions (ϕ < 0.05), e.g., yogurt, crowding effects can be neglected because the microgel particles rarely come into contact with each other. Still, viscosity is dependent on the volume fraction ϕ, which can be decreased by mechanically treating the microgel dispersion, which breaks down the microgel particles. The bound serum gets released, and thereby, the volume fraction ϕ is reduced, e.g., production of stirred yogurt [19]. However, when shearing concentrated microgel dispersions to reduce their viscosity, the opposite effect can be observed, even though the volume fraction is decreased due to similar particle breakdown effects as for dilute microgel dispersions. This is because, in parallel, the particle size distribution (PSD) is altered to a narrower distribution, meaning that the particles are more similar in size, increasing the viscosity of the microgel dispersion at a constant volume fraction ϕ [20,21].
In order to reduce the apparent viscosity η’ of concentrated microgel dispersions, either yogurt or microparticulated whey protein can be added [22]. When, e.g., adding yogurt to quarg, concentrated and diluted microgel dispersions are mixed, the PSD becomes wider and the volume fraction ϕ decreases, while the protein content is lowered.
In comparison, when microparticulated whey protein with a similar protein content to the concentrated microgel dispersion is added, the volume fraction ϕ stays unchanged, while the PSD can be modified to a wider distribution, resulting in a lower apparent viscosity η’ [22]. The disadvantage of this method is the limited viscosity reduction based on altering the PSD for higher volume fractions ϕ. In order to further reduce the apparent viscosity, the volume fraction has to be reduced below 0.4 [23].
In previously published studies, the volume fraction was either calculated from the viscosity [24,25] or assumed by the change in particle size. Decreasing particle sizes are often associated with lowering the volume fraction; however, reducing the particle sizes can lead to an increase in viscosity, as explained above. Hence, changes in the particle size cannot be directly correlated to the volume fraction and taken as an explanation for reduced viscosities, making measurements of the volume fraction necessary.
Körzendörfer and Hinrichs [26] and Körzendörfer et al. [27] proposed high-power ultrasound to reduce the viscosity of concentrated fermented milk products. High-power ultrasound uses a frequency of 20–100 kHz and reaches intensities >10 W cm−2, thereby forming cavitation bubbles when the local pressure falls below the saturated vapor pressure. These bubbles then pulsate over several compression and rarefaction cycles and collapse violently creating local pressures of up to 200 MPa and temperatures between 2000 and 5000 K. The implosion of the bubble leads to shear stress and shock waves traveling through the medium, leading mainly to physical effects such as shearing and rising temperature but also chemical effects, e.g., radical formation within the implosion spot. This phenomenon is called transient cavitation [28,29,30,31,32].
The study investigated the influence of different energy inputs using high-power ultrasound on the volume fraction, particle size, and rheological properties. We hypothesized that viscosity values would decrease due to a reduction of volume fraction, while not significantly altering the particle size distribution width (span) during the treatment with high-power ultrasound.
2. Materials and Methods
2.1. Materials
For the experiments, fat-free fresh cheese was provided by Karwendel-Werke Huber GmbH & Co. KG (Buchloe, Germany), which was stored at 7 °C until the ultrasound treatment the following day. Six batches of fresh cheese with a protein content of 8.9 ± 0.4% (w/w), a dry matter of 14.3 ± 0.3% (w/w), and a pH of 4.4 ± 0.1 were sonicated. The pH was determined before starting the ultrasound treatment, and samples for dry matter and protein content were directly frozen and measured the week after.
2.2. High-Intensity Ultrasound System
2.2.1. Set-Up
For the high-power ultrasound treatment, a continuous system was set up (Figure 1). Before filling the US-system with fresh cheese, the ultrasound device was calibrated against air. Afterward, the product was taken from the fridge (7 °C) and filled into the feed tank. Using the screw spindle pump (HYGHSPIN, Jung Process Systems GmbH, Kummerfeld, Germany), the fresh cheese was continuously pumped through the ultrasound system at a flow rate of 84 L h−1, tempered using the double pipe heat exchanger (effective cooling area of 0.4 m2) to 15 °C, and the system pressure of 0.15 MPa was set using the air-operated pinch valve (Series VMC with threaded spigot according to DIN 11851, AKO Armaturen & Separationstechnik GmbH, Trebur-Astheim, Germany).
Before entering the flow cell of the ultrasound unit, the temperature (PT100-0G5) and pressure (PS7D) were measured. The ultrasound unit consisted of a flow cell (V = 0.57 L) with an embedded sonotrode (CS4d40L2, Hielscher Ultrasonics GmbH, Teltow, Germany) and a generator with an acoustic transducer (UIP2000hdT, Hielscher Ultrasonics GmbH, Teltow, Germany), with a total power of 2 kW. The generator creates electrical energy which is then transformed into mechanical energy in the acoustic transducer. Via the sonotrode, the generated mechanical energy is transmitted into the medium, which had a calculated residence time of 24.4 s in the flow cell. The ultrasound unit is controlled from a Web-Surface of the connected PC, where the net power, amplitude, temperature, and pressure are displayed over the treatment time. From the net power P, the specific energy input WSpec was calculated (Section 2.2.2).
In Figure 2a, the temperature and pressure sensors and the air-operated pinch valve, before and after the ultrasound unit, respectively, are schematically shown, and in Figure 2b, these parts can be seen in the pilot plant set-up. The product passes the sensors and then enters the flow cell from the bottom. Inside the flow cell, the product is directly pumped past the sonotrode, which transfers the mechanical energy into the medium by vibrating at a fixed frequency of 20 kHz, and then, the product leaves the flow cell at the top (Figure 2c).
The amplitude was set to 29, 43, 57, 71, 86, and 100%, respectively, whereby 100% equals an amplitude for the sonotrode of 35 µm from peak-to-peak (p-p). The set amplitude (10.15 to 35 µm) describes the oscillatory range of the sonotrode in µm from p-p and, hence, directly regulates the energy input WSpec at a constant temperature, pressure, and frequency. The dimensions of the sonotrode are shown in Figure 2d. The two rings at the middle and bottom end are the irradiation zones of the sonotrode and have an effective surface area (transmission of ultrasound) of 25 cm2 and a diameter of 4 cm. The sonotrode has a length of 23.5 cm, whereof 16.5 cm are embedded in the flow cell.
After sonication, the particle size was measured inline by focused-beam reflectance measurement (FBRM, ParticleTrack G600B, Mettler Toledo, Columbus, OH, USA). The fresh cheese was continuously pumped through the system and for each amplitude, samples were taken after a run time of 4 min and filled in 100 mL glass jars, sealed, and cooled in an ice bath for 15 min to prevent thermo-induced effects. The sampling containers were stored in the fridge at 7 °C until the analyses (Section 2.3) were conducted.
2.2.2. Energy Input
Specific energy input WSpec during continuous sonication was calculated from the transferred net power P and volume flow using Equation (1) [33]:
For each batch, a reference sample was taken. The reference sample was pumped through the system one time under the same conditions as used for the following high-power ultrasound treatment, but without sonication (WSpec = 0 MJ m−3). The US-System was calibrated against air before usage, so the net power P used for calculation refers to the power transferred into the media.
Using Equation (2), the energy intensity WIntensity was calculated with the transferred net power P and effect surface A (transmission area of the sonotrode), and it is especially used to evaluate sonications performed as batch processes:
2.3. Analyses
2.3.1. Dry Matter and Protein Content
The dry matter content was determined according to the sea sand method [34]. The nitrogen content was measured with the Dumas method [35] using a nitrogen analyzer (Dumatherm DT N, Gerhardt, Königswinter, Germany). Total protein content was subsequently calculated using a conversion factor of 6.38. All samples were measured in triplicate.
2.3.2. Particle Size Measurement
The particle size of the samples was measured via static light scattering (LS 13 320, Beckman Coulter Inc., Brea, CA, USA), allowing a measuring range of 0.01 to 2000 µm. Based on the Mie theory, particle sizes are calculated. Prior to the measurement, deionized water was added to 3 g of the sample until a total weight of 50 g was reached. The dispersion was then stirred at 350 min−1 for 15 min using a magnetic stirrer (Telesystem 15 Variomag, Thermo Fisher Scientific Inc., Waltham, MA, USA). Afterward, 200–250 µL of the sample was added to the measurement chamber to reach an obscuration of 3 to 7% and a maximum Polarization Intensity Differential Scattering (PIDS) of 50%. The imaginary refractive index for the particles was set at 0.00, and the solvent and real refractive indices for the medium (water) and particles of 1.33 and 1.57, respectively, were used.
As representative particle sizes, the d10,3 and d90,3 were evaluated, corresponding to the volume-weighted percentiles containing 10% and 90%, respectively, of all particles being smaller than this size. The particle size distribution width (span) was calculated using Equation (3):
span = d90,3 − d10,3
All measurements were performed at room temperature (18–20 °C) in triplicate 4–14 days after the sonication.
2.3.3. Volume Fraction
The sample’s volume fraction was determined via static light scattering and the addition of standard particles, according to the method published by Heck et al. [36]. For the standard particle solution, 1.5 g of uncoated poly(methyl methylacrylate) (PMMA) particles with a nominal size d4,3 of 60 µm (manufacture specifications, CA60, Microbeads AS, Skedsmokorset, Norway) were mixed with deionized water to a total weight of 50 g and stirred at 350 min−1 for 10 min. The preparation of the sample dispersion was the same as described in Section 2.3.2.
A calibration line was created by mixing 700 µL of the sample dispersion with 150, 175, 200, 225, and 250 µL of standard solution in a 1.5 mL Eppendorf tube (Safe-Lock Tubes 1.5 mL, Eppendorf AG, Hamburg, Germany) and gently shaking the tube before adding 250 µL of the mixture into the measurement chamber of the LS 13 320. The resulting peaks from the obtained data were fitted using a modified Excel spreadsheet, based on that from Tom O’Haver (https://terpconnect.umd.edu/~toh/spectrum/CurveFittingC.html, accessed on 9 June 2023) [36]. Based on the ratio of the peak areas, the volume fraction was calculated for the sample due to the known volume of the added standard particles.
All measurements were performed at room temperature (18–20 °C) in triplicate 4–14 days after sonication.
2.3.4. Rheology
A stress-controlled rheometer (AR 2000, TA Instruments, New Castle, DE, USA) with a concentric cylinder cup and bob system (DIN 53019, cup radius = 15.0 mm, bob radius = 14.0 mm) was used. Flow curves were determined via rotational measurements. First, 17 to 18 g of each sample was transferred into the cup. The sample was cooled to 10 °C and equilibrated for 7 min. The shear rate was linearly increased from 0 to 500 s−1 within 3 min and held at 500 s−1 for another 3 min. After, the shear rate was decreased linearly to 0 s−1 over 3 min. The apparent viscosity was calculated at a shear rate of 100 s−1 (η’10 °C, 100 s−1) from the upward ramp, because shear rates in the range of 50–100 s−1 correlate to in-mouth viscosity [37].
The yield stress was evaluated using an amplitude sweep (oscillatory measurement). Again, 17 to 18 g were transferred into the cup and equilibrated at 10 °C for 7 min. The deformation was increased logarithmically from 0.0001 to 10 (ten points per decade) at a fixed frequency of 1 rad s−1. The yield stress (τ0, 10 °C) was taken as the oscillatory stress at the intersection of storage and loss moduli. Both measurements were performed in duplicate within 4–14 days.
2.4. Statistical Analysis
For all analyses, significant differences were identified by an analysis of variance (ANOVA) with subsequent Tukey‘s post hoc test with α = 0.05 (p < 0.05) using OriginPro (OriginLab Corporation, Northampton, MA, USA).
3. Results and Discussion
3.1. Volume Fraction, Particle Size, and Span
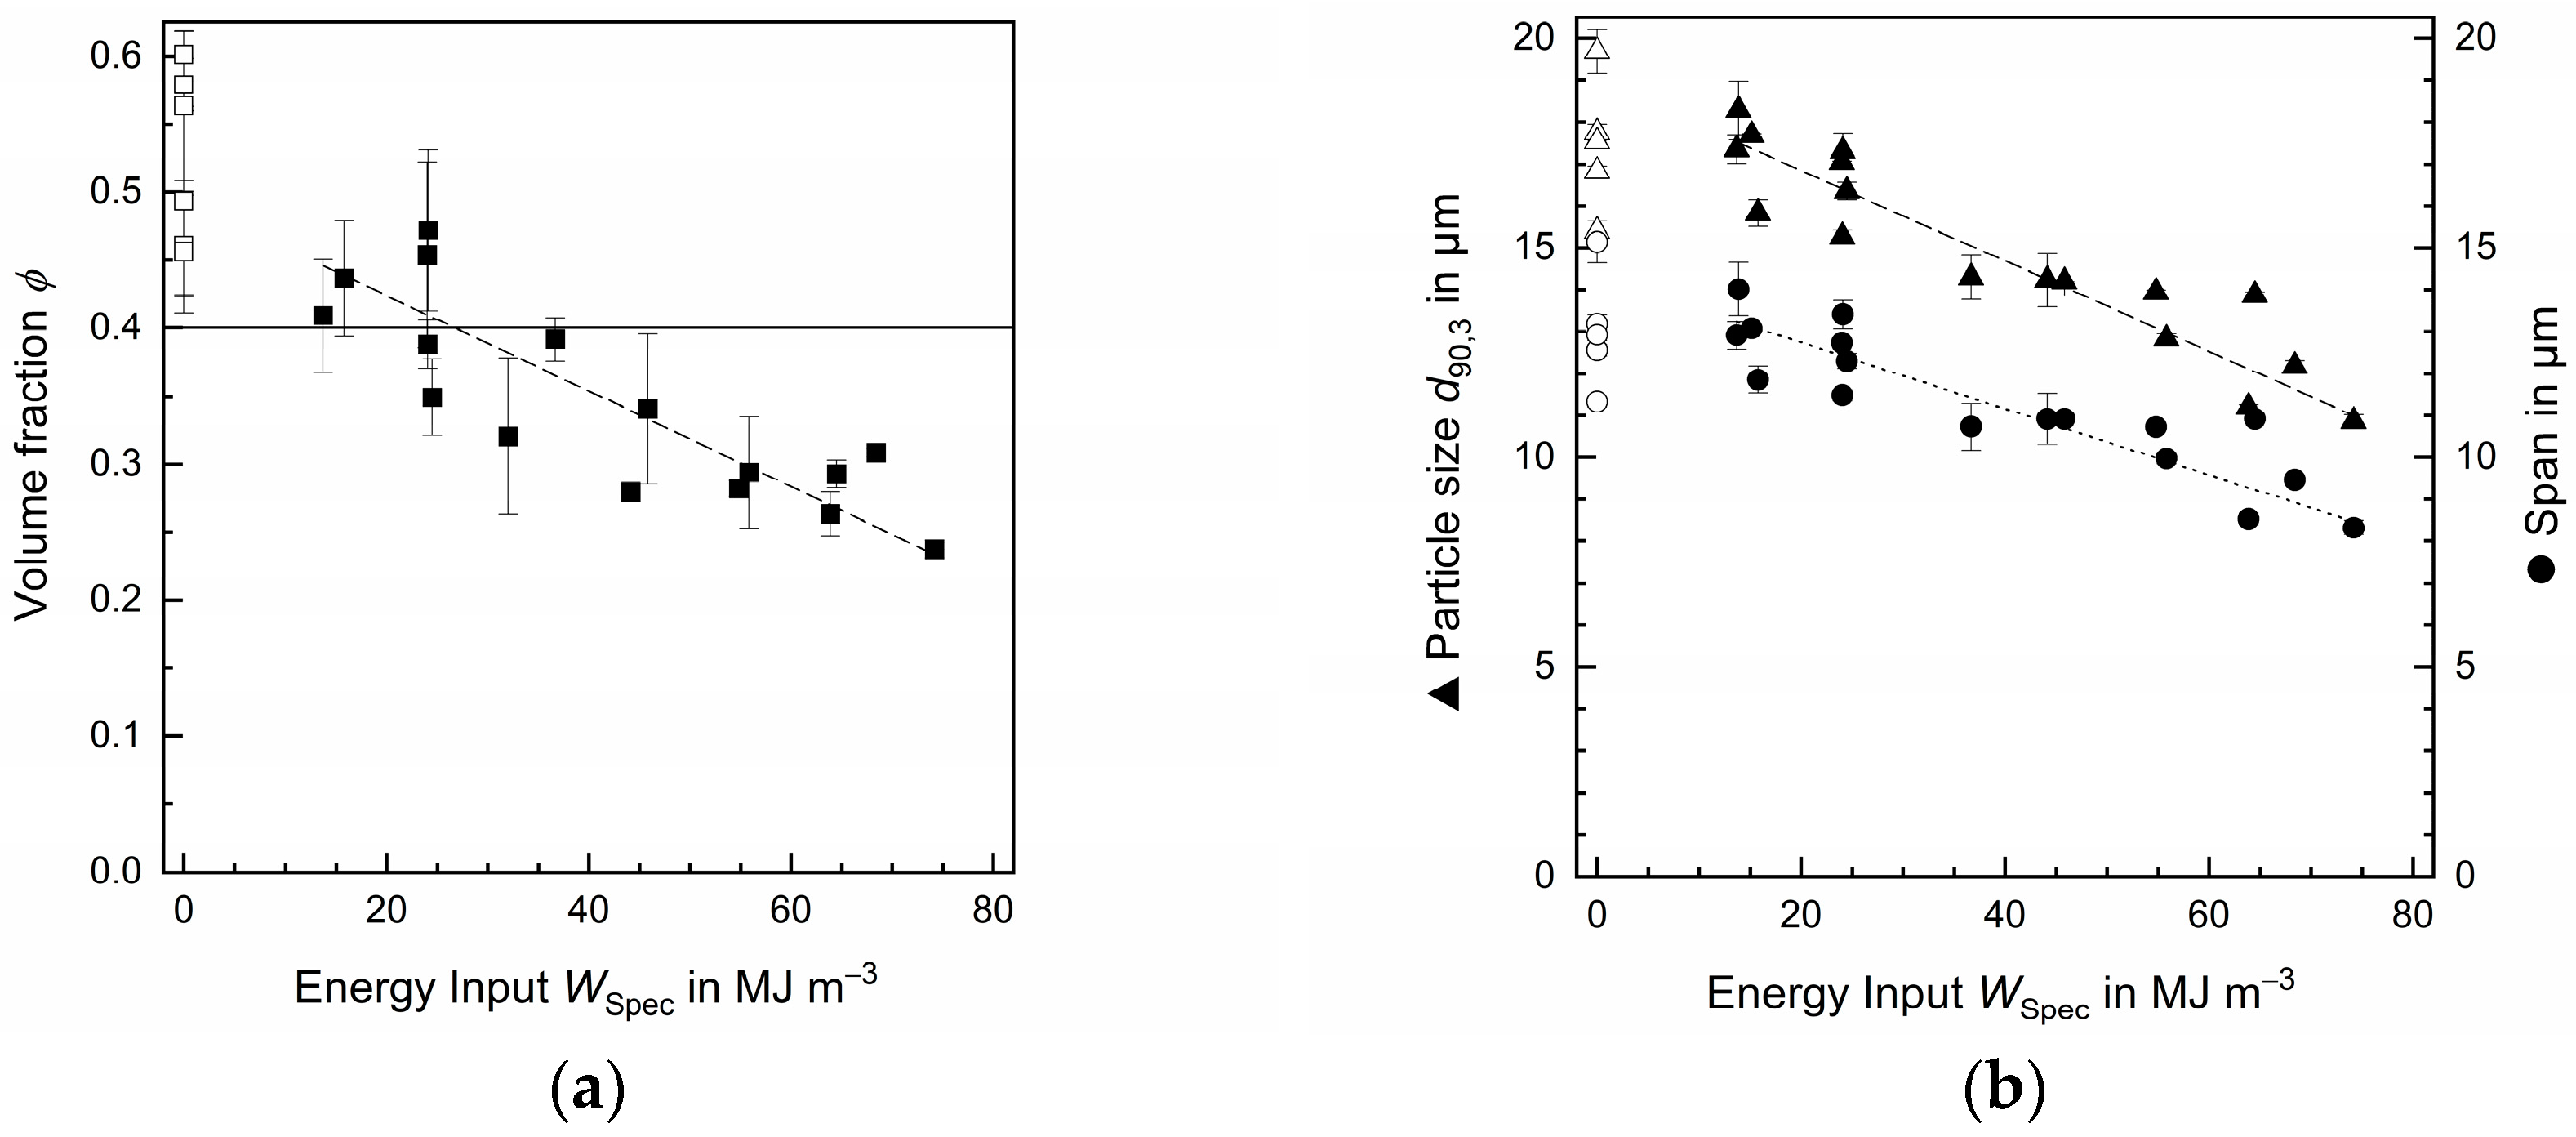
The sonicated samples were analyzed regarding their volume fraction ϕ, particle size d90,3, and span, and the results are displayed in Figure 3. The volume fraction ϕ decreased with increasing energy input WSpec (Figure 3a). The reference samples had a volume fraction ϕ of 0.53 ± 0.06 and, hence, can be classified as concentrated microgel dispersions. The line at ϕ = 0.4 corresponds to the limit between concentrated microgel dispersions (ϕ > 0.4) and not-concentrated (i.e., dilute) microgel dispersions (ϕ < 0.4) [16,36] and was passed for WSpec ≈ 27 MJ m−3 (calculated intersection of limit and regression line). For an increasing energy input, the volume fraction was further decreased to 0.24 ± 0.01 (WSpec ≈ 74 MJ m−3), which is a reduction of about 55%.
No significant reduction was observed until WSpec > 28 MJ m−3 for particle size d90,3 and WSpec > 29 MJ m−3 for the span, respectively (Figure 3b). Afterward, similar behavior of particle size d90,3 and span, as for the volume fraction, was seen for increasing energy input.
This is in accordance with the literature, where several authors reported the decrease in particle size and narrowing of the span for whey protein isolate and whey protein concentrate when increasing the energy input of the sonication by prolonging the treatment time [38], using higher power input [39,40] or using lower frequencies, e.g., 20 kHz instead of 40 kHz [41]. The (microgel) particles become agitated by the cavitation-induced shock waves and collide, resulting in the breakage into smaller aggregates [39]. The consequent release of serum then reduces the volume fraction of the microgel dispersion, which is in accordance with the results of this study (Figure 3a) and the literature [19,26,27,42].
Due to the small irradiation range of the ultrasonic waves of 2–3 cm from the transmission surface of the sonotrode, the energy intensity WIntensity should be considered. It describes the irradiation intensity directly at the transmission area of the sonotrode in W cm−2 and should be taken into account when comparing ultrasound treatments. This applies especially to batch processes [39]. Körzendörfer et al. [27] reported a slight decrease in particle size d10,3 and a slight increase in d90,3, when applying sonication (20 kHz) with an energy intensity of 15 W cm−2 during the fermentation of yogurt (10% (w/w) protein), while CLSM pictures indicated lowered volume fractions. Körzendörfer and Hinrichs [26] used ultrasound with 20 kHz and an energy intensity of 23 W cm−2 (WSpec ≈ 1.9 MJ m−3) as a post-treatment for yogurt with 10% (w/w) protein. In this case, sonication decreased particle size d90,3 by 4.5% and span by 4.1% [26].
The energy intensity in this study ranged from 14 ± 1 W cm−2 to 62 ± 3 W cm−2 and reached a reduction of 5.2% and 4% for particle size d90,3 and span, respectively, for similar energy intensities (WIntensity ≈ 23 ± 1 W cm−2, WSpec ≈ 25 ± 1 MJ m−3).
In the previously mentioned studies, all experiments were performed as batch processes (maximum of 200 W and an effective surface of 1.3 cm2) [26,27], while in this study, a continuous process was used with a maximum power of 2 kW with an effective surface of 25 cm2, reaching a comparably high reduction of the parameters as a result of stronger physical cavitation-induced effects such as shear forces and shock waves. Additionally, continuous treatment led to a more uniform treatment, while sonications performed as batch processes are heterogenous in specific energy input and distribution but reach similar energy intensities due to smaller effective surfaces. This explains alike reductions for the parameters compared to the continuous treatment.
The reference samples particle size d90,3 of 17.4 ± 1.6 µm was lowered to 10.9 ± 0.2 µm for WSpec ≈ 74 MJ m−3 during ultrasound treatment. For the span, initially, a distribution width of 13.0 ± 1.4 µm was measured, which was reduced to 8.3 ± 0.2 µm throughout sonication (WSpec ≈ 74 MJ m−3) (Figure 3b). Summarizing, the particle size d90,3 and span were lowered by 6.5 µm (37%) and 4.7 µm (36%), respectively, hence indicated a narrowing of the PSD.
Comparing the results within Figure 3a,b at similar energy inputs and reference samples, relatively high deviations can be seen, which is mainly attributed to the missing standardization of the ordered product and natural fluctuations of the raw product.
3.2. Rheology
The rheological properties of the sonicated samples were evaluated using the apparent viscosity η’100 s−1, 10 °C (Figure 4a) and yield stress τ0, 10 °C (Figure 4b). For apparent viscosity, a linear decrease was detected with increasing energy input. Starting at 2.1 ± 0.2 Pa s for the reference samples, sonication decreased the apparent viscosity by 86% to 0.3 ± 0.0 Pa s (WSpec ≈ 74 MJ m−3). No significant differences were found between the rheological values for samples measured on different days (between 4 and 14 days after treatment); however, a trend of rebodying was found, i.e., a reversal of the lowered rheological values.
When the span becomes narrower as seen in Figure 3b, a respective increase in apparent viscosity was reported in the literature [23,43]. In the previous Section 3.1, it was also shown that ultrasound treatment reduced the particle size of larger particles (d90,3) to a larger extent than small particle sizes (d10,3). Due to the decrease in the span, a viscosity increase is expected. However, due to the simultaneous decrease in volume fraction, the ultrasound treatment was able to reduce the apparent viscosity of the samples with a rising energy input despite a lower span. This is in accordance with the study of Iida et al. [44], who showed the ability of high-power ultrasound (batch, US-water bath) to reduce the apparent viscosity of highly viscous systems such as 10% (w/w) starch solutions from 2000 to 20 mPa s in 30 min, while a decrease in molecular weight was observed (100 W, 450 MJ m−3).
Apparent viscosity values of the sonicated fresh cheese started to change significantly for WSpec > 25 MJ m−3, which is the same as observed for particle size d90,3 and span (Section 3.1.). Significant changes (p < 0.05) were seen when the volume fraction dropped below 0.4 and left the concentrated area, showing the importance of reducing the volume fraction out of the concentrated area to minimize crowding effects [17] (Figure 3a). Other authors also showed the viscosity-decreasing effect of high-power ultrasound (batch) for concentrated dairy products, e.g., concentrated yogurt (10% (w/w) protein) [26,27]. The sonication during fermentation (WIntensity = 15 W cm−2) led to a disruption of gel formation with more compact and denser microgel particles, but that also decreased the volume fraction. Consequently, the apparent viscosity of the sonicated concentrated yogurt was lowered by 40% compared to the control sample [27]. Other studies showed the formation of large particles due to sonication during the fermentation of stirred yogurt (3.4% (w/w) protein), which led to an increased grainy perception. These gels became softer when sonicated, but also showed increased syneresis due to disruption and disturbance during gel formation [45,46].
Körzendörfer and Hinrichs [26] and Körzendörfer et al. [27] highlighted the potential of a post-treatment with high-power ultrasound to modify the flow properties of (concentrated) microgel dispersions. In the study of Körzendörfer and Hinrichs [26], with sonication as a post-treatment (WIntensity ≈ 23 W cm−2), the apparent viscosity was decreased by 29%. For a comparable energy intensity of 23 ± 1 W cm−2 in this study, the apparent viscosity was lowered by 26%. The declining apparent viscosity was the result of a decrease in volume fraction values.
The trend for the yield stress with increasing energy input could rather be described as an exponential decrease. Furthermore, yield stress seems to stay constant for the reference samples (τ0, 10 °C = 26.1 ± 1.3 Pa) with no significant change to ~14 MJ m−3 (τ0, 10 °C = 28.3 ± 1.3 Pa). For additional increases in the energy input, the yield stress decreases significantly until an energy input of ~37 MJ m−3 (τ0, 10 °C = 3.0 ± 0.2 Pa) and ~89%, respectively. For this energy input, the samples had a volume fraction of 0.36, indicating the yield stress of high protein samples can be attributed to the occurring crowding effects. The neighboring particles can stick to each other and, therefore, impede the free rotation and ability to flow of the microgel particles. The interparticle forces increase with the rising volume fractions causing higher yield stresses [17,43]. This demonstrates the high dependency of the yield stress from the volume fraction, especially above values of 0.4 (concentrated area).
For ~68 MJ m−3, the yield stress reached its minimum of 0.2 ± 0.0 Pa (ϕ = 0.31 ± 0.00), which equals an overall reduction of about 99%. This implies, that for fermented high-protein products with volume fractions below 0.3, the yield stress is lowered to a minimum, which was also reported by Poslinski et al. [47].
In summary, significant changes in the rheological properties were achieved as soon as the volume fraction was reduced below the threshold of ϕ = 0.4.
3.3. Comparison to Commercial Samples
For categorization, commercially produced (fat-free) fermented milk products with different protein contents were analyzed regarding their apparent viscosity η’100 s−1, 10 °C and yield stress τ0, 10 °C (Table 1) and compared with the sonicated samples (Section 3.1 and Section 3.2). The rheological properties of commercially produced stirred yogurt (1.5% fat) were set as aimed values for the sonicated fresh cheese.
The fresh cheese before sonication had a similar initial apparent viscosity (2.1 ± 0.2 Pa s to 2.1 ± 0.0 Pa s), yield stress (26.1 ± 1.3 Pa to 24.6 ± 0.5 Pa), and protein content (8.9 ± 0.4% to 9.4 ± 0.2%) to commercial greek yogurt. For an energy input of ~25 MJ m−3, a yield stress of 10.4 ± 0.3 was reached, which roughly equals the yield stress of the desired stirred yogurt (9.4 ± 0.2 Pa). Its apparent viscosity (0.8 ± 0.0 Pa s) was reached for an energy input of 52 MJ m−3 (0.8 ± 0.0 Pa s) and, hence, shows that the apparent viscosity is the parameter that should be mainly focused on when trying to tailor the rheological properties of concentrated microgel dispersions. This is in line with the results of Section 3.2, where the minimum yield stress without a significant change was reached for ~37 MJ m−3, whereas the apparent viscosity constantly decreased over the whole range of used energy input without reaching a minimum.
The ultrasound treatment reduced the yield stress of the fresh cheese to 0.24 ± 0.0 (WSpec ≈ 68 MJ m−3) and even reached the yield stress of the yogurt drink (0.3 ± 0.0 Pa). The lowest apparent viscosity achieved by sonication was 0.3 ± 0.0 Pa s for 74 MJ m−3 and thus is located between the stirred yogurt and the yogurt drink. However, the results from Figure 3a and Figure 4a imply, that lower volume fractions and, hence, apparent viscosities could be reached when using higher energy inputs than 74 MJ m−3 via cyclic treatment and even attain the rheological properties of the yogurt drink.
4. Conclusions
In this study, high-power ultrasound was proven to be suitable as a post-treatment step to lower the viscosity of concentrated fermented milk products; in this case, fresh cheese with 8.9 ± 0.4% (w/w) protein. Due to the decrease in the volume fraction by about 55% down to 0.24 ± 0.01, the concentrated area of ϕ > 0.4 was left. As a consequence, crowding effects in the microgel dispersion were drastically lowered. Hence, sonication reduced the apparent viscosity by 86% and the yield stress by 99%. Based on the literature, the observed decrease in the span of 36.2% should result in higher viscosities due to the Farris effect, but this can be neglected for microgel dispersions with volume fractions below 0.4, as confirmed in this study. The final apparent viscosity of the sonicated fresh cheese (0.3 ± 0.0 Pa s) fell slightly below commercially produced stirred yogurt, which was the aimed consistency. The minimum yield stress of 0.24 ± 0.0 Pa for an energy input of ~68 MJ m−3 reached similar values to those of a commercially produced yogurt drink. Furthermore, the sonicated samples were visually evaluated and did not show syneresis for a storage time of up to 2 weeks. Additionally, since there were indications of rebodying during storage, however, the samples were still classified the same after 2 weeks. The storage stability of the sonicated samples should be investigated in detail in future experiments. These results indicate the ability of high-power ultrasound to tailor the rheological properties to the desired consistency with lower apparent viscosity and yield stress, and, hence, allow the production of high-protein products (>8%) with pleasant textural properties.
Author Contributions
N.P.: conceptualization, formal analysis, investigation, methodology, visualization, writing—original draft, and writing—review and editing; A.H.: formal analysis, methodology, writing—review and editing; J.M.F.: conceptualization, and writing—review and editing; Z.A.: conceptualization and writing—review and editing; J.H.: conceptualization, resources, writing—review and editing, supervision, project administration, and funding acquisition. All authors have read and agreed to the published version of the manuscript.
Funding
This IGF Project of the FEI was supported via AiF within the program for promoting the Industrial Collective Research (IGF) of the German Ministry of Economic Affairs and Energy (BMWi), based on a resolution of the German Parliament; Project AiF 21545 N.
Institutional Review Board Statement
Not applicable.
Informed Consent Statement
Not applicable.
Data Availability Statement
Data are contained within the article.
Acknowledgments
The authors would like to thank Nabil Chaib and Luc Mertz for their assistance in the Dairy, Simon Diehl for performing parts of the particle size and rheological measurements, as well as Birgit Greif, Birgit Schilling, and Lara Hegele for carrying out the protein and dry matter analyses. Further, the authors appreciate the support from Melody Sachs and Karwendel-Werke Huber GmbH & Co. KG by providing the fresh cheese for the experiments.
Conflicts of Interest
The authors declare that this study neither received funding by Zifo Technologies GmbH nor were they involved in the study design, collection, analysis, interpretation of data, the writing of this article or the decision to submit it for publication. The respective author (Dr. Anisa Heck) was employed at the University of Hohenheim while contributing to this study and started working for this company during the creation of this manuscript.The remaining authors declare that the research was conducted in the absence of any commercial or financial relationships that could be construed as a potential conflict of interest.
References
- Chever, S.; Guyomarc’h, F.; Beaucher, E.; Famelart, M. High-protein fat-free acid milk gels: Control of protein composition and heat treatment. Int. Dairy J. 2014, 37, 95–103. [Google Scholar] [CrossRef]
- Garlick, P.J. The role of leucine in the regulation of protein metabolism. J. Nutr. 2005, 135, 1553S–1556S. [Google Scholar] [CrossRef] [PubMed]
- Tipton, K.D.; Elliott, T.A.; Cree, M.G.; Aarsland, A.A.; Sanford, A.P.; Wolfe, R.R. Stimulation of net muscle protein synthesis by whey protein ingestion before and after exercise. Am. J. Physiol. Endocrinol. Metab. 2007, 292, E71–E76. [Google Scholar] [CrossRef] [PubMed]
- Benelam, B. Satiation, satiety and their effects on eating behaviour. Nutr. Bull. 2009, 34, 126–173. [Google Scholar] [CrossRef]
- Jørgensen, C.E.; Abrahamsen, R.K.; Rukke, E.-O.; Hoffmann, T.K.; Johansen, A.-G.; Skeie, S.B. Processing of high-protein yoghurt—A review. Int. Dairy J. 2018, 88, 42–59. [Google Scholar] [CrossRef]
- Desai, N.; Shepard, L.; Drake, M. Sensory properties and drivers of liking for Greek yogurts. J. Dairy Sci. 2013, 96, 7454–7466. [Google Scholar] [CrossRef] [PubMed]
- Alsanei, W.A.; Chen, J. Food Structure Development for Specific Population Groups. In Handbook of Food Structure Development; Spyropoulos, F., Lazidis, A., Norton, I., Eds.; Royal Society of Chemistry: Cambridge, UK, 2020; pp. 459–479. [Google Scholar]
- Ney, D.M.; Weiss, J.M.; Kind, A.J.H.; Robbins, J. Senescent swallowing: Impact, strategies, and interventions. Nutr. Clin. Pract. 2009, 24, 395–413. [Google Scholar] [CrossRef] [PubMed]
- Wright, L.; Cotter, D.; Hickson, M. The effectiveness of targeted feeding assistance to improve the nutritional intake of elderly dysphagic patients in hospital. J. Hum. Nutr. Diet. 2008, 21, 555–562. [Google Scholar] [CrossRef]
- Tamime, A.Y.; Hickey, M.; Muir, D.D. Strained fermented milks—A review of existing legislative provisions, survey of nutritional labelling of commercial products in selected markets and terminology of products in some selected countries. Int. J. Dairy Technol. 2014, 67, 305–333. [Google Scholar] [CrossRef]
- Farkye, N.Y. Quark, Quark-like Products, and Concentrated Yogurts. In Cheese; Academic Press: Cambridge, MA, USA, 2017; pp. 1103–1110. [Google Scholar] [CrossRef]
- Schulz-Collins, D.; Senge, B. Acid- and acid/rennet-curd cheeses part A: Quark, cream cheese and related varieties. Cheese Chem. Phys. Microbiol. 2004, 2, 301–328. [Google Scholar] [CrossRef]
- Heck, A.J.; Schäfer, J.; Nöbel, S.; Hinrichs, J. Fat-free fermented concentrated milk products as milk protein-based microgel dispersions: Particle characteristics as key drivers of textural properties. Compr. Rev. Food Sci. Food Saf. 2021, 20, 6057–6088. [Google Scholar] [CrossRef] [PubMed]
- Walstra, P.; Wouters, J.T.M.; Geurts, T.J. Dairy Science and Technology, 2nd ed.; CRC/Taylor & Francis: Boca Raton, FL, USA, 2006. [Google Scholar]
- Krieger, I.M.; Dougherty, T.J. A Mechanism for Non-Newtonian Flow in Suspensions of Rigid Spheres. Trans. Soc. Rheol. 1959, 3, 137–152. [Google Scholar] [CrossRef]
- Loewen, A.; Nöbel, S.; Hinrichs, J. Microgel Particles and Their Effect on the Textural Properties of Foods. In Reference Module in Food Science; Elsevier: Amsterdam, The Netherlands, 2017. [Google Scholar]
- Willenbacher, N.; Vesaratchanon, J.S.; Thorwarth, O.; Bartsch, E. An alternative route to highly concentrated, freely flowing colloidal dispersions. Soft Matter 2011, 7, 5777–5788. [Google Scholar] [CrossRef]
- Dickinson, E. Microgels—An alternative colloidal ingredient for stabilization of food emulsions. Trends Food Sci. Technol. 2015, 43, 178–188. [Google Scholar] [CrossRef]
- Weidendorfer, K.; Bienias, A.; Hinrichs, J. Investigation of the effects of mechanical post-processing with a colloid mill on the texture properties of stirred yogurt. Int. J. Dairy Technol. 2008, 61, 379–384. [Google Scholar] [CrossRef]
- Dörr, A.; Sadiki, A.; Mehdizadeh, A. A discrete model for the apparent viscosity of polydisperse suspensions including maximum packing fraction. J. Rheol. 2013, 57, 743–765. [Google Scholar] [CrossRef]
- Hahn, C.; Nöbel, S.; Maisch, R.; Rösingh, W.; Weiss, J.; Hinrichs, J. Adjusting rheological properties of concentrated microgel suspensions by particle size distribution. Food Hydrocoll. 2015, 49, 183–191. [Google Scholar] [CrossRef]
- Ipsen, R. Microparticulated whey proteins for improving dairy product texture. Int. Dairy J. 2017, 67, 73–79. [Google Scholar] [CrossRef]
- Farris, R.J. Prediction of the Viscosity of Multimodal Suspensions from Unimodal Viscosity Data. Trans. Soc. Rheol. 1968, 12, 281–301. [Google Scholar] [CrossRef]
- Nöbel, S.; Weidendorfer, K.; Hinrichs, J. Apparent voluminosity of casein micelles determined by rheometry. J. Colloid Interface Sci. 2012, 386, 174–180. [Google Scholar] [CrossRef]
- van Marle, M.E.; Ende, D.v.D.; de Kruif, C.G.; Mellema, J. Steady-shear viscosity of stirred yogurts with varying ropiness. J. Rheol. 1999, 43, 1643–1662. [Google Scholar] [CrossRef]
- Körzendörfer, A.; Hinrichs, J. Manufacture of high-protein yogurt without generating acid whey—Impact of the final pH and the application of power ultrasound on texture properties. Int. Dairy J. 2019, 99, 104541. [Google Scholar] [CrossRef]
- Körzendörfer, A.; Schäfer, J.; Hinrichs, J.; Nöbel, S. Power ultrasound as a tool to improve the processability of protein-enriched fermented milk gels for Greek yogurt manufacture. J. Dairy Sci. 2019, 102, 7826–7837. [Google Scholar] [CrossRef] [PubMed]
- Robinson, R.K. Encyclopedia of Food Microbiology; Academic Press: San Diego, CA, USA, 2000. [Google Scholar]
- Chávez-Martínez, A.; Reyes-Villagrana, R.A.; Rentería-Monterrubio, A.L.; Sánchez-Vega, R.; Tirado-Gallegos, J.M.; Bolivar-Jacobo, N.A. Low and High-Intensity Ultrasound in Dairy Products: Applications and Effects on Physicochemical and Microbiological Quality. Foods 2020, 9, 1688. [Google Scholar] [CrossRef] [PubMed]
- Brennen, C.E. Cavitation and Bubble Dynamics; Oxford University Press: New York, NY, USA, 1995. [Google Scholar]
- Peters, D. Ultrasound in materials chemistry. J. Mater. Chem. 1996, 6, 1605–1618. [Google Scholar] [CrossRef]
- Crum, L.A. Comments on the evolving field of sonochemistry by a cavitation physicist. Ultrason. Sonochem. 1995, 2, S147–S152. [Google Scholar] [CrossRef]
- Patist, A.; Bates, D. Industrial Applications of High Power Ultrasonics. In Ultrasound Technologies for Food and Bioprocessing; Feng, H., Ed.; Springer: New York, NY, USA, 2011; pp. 599–616. [Google Scholar]
- DIN EN ISO 5534:2004-09; Cheese and Processed Cheese-Determination of the Total Solids Content. Beuth: Berlin, Germany, 2004. [CrossRef]
- DIN EN ISO 14891:2002-07; Milk and Milk Products-Determination of Nitrogen Content-Routine Method Using Combustion according to the Dumas Principle. Beuth: Berlin, Germany, 2002. [CrossRef]
- Heck, A.; Nöbel, S.; Hitzmann, B.; Hinrichs, J. Volume Fraction Measurement of Soft (Dairy) Microgels by Standard Addition and Static Light Scattering. Food Biophys. 2021, 16, 237–253. [Google Scholar] [CrossRef]
- Sonne, A.; Busch-Stockfisch, M.; Weiss, J.; Hinrichs, J. Improved mapping of in-mouth creaminess of semi-solid dairy products by combining rheology, particle size, and tribology data. LWT 2014, 59, 342–347. [Google Scholar] [CrossRef]
- Ashokkumar, M.; Bhaskaracharya, R.; Kentish, S.; Lee, J.; Palmer, M.; Zisu, B. The ultrasonic processing of dairy products—An overview. Dairy Sci. Technol. 2009, 90, 147–168. [Google Scholar] [CrossRef]
- Delmas, H.; Barthe, L. Ultrasonic mixing, homogenization, and emulsification in food processing and other applications. In Power Ultrasonics; Woodhead Publishing: Sawston, UK, 2015; pp. 757–791. [Google Scholar] [CrossRef]
- Wu, J.; Gamage, T.; Vilkhu, K.; Simons, L.; Mawson, R. Effect of thermosonication on quality improvement of tomato juice. Innov. Food Sci. Emerg. Technol. 2008, 9, 186–195. [Google Scholar] [CrossRef]
- Jambrak, A.R.; Mason, T.J.; Lelas, V.; Paniwnyk, L.; Herceg, Z. Effect of ultrasound treatment on particle size and molecular weight of whey proteins. J. Food Eng. 2014, 121, 15–23. [Google Scholar] [CrossRef]
- Mokoonlall, A.; Nöbel, S.; Hinrichs, J. Post-processing of fermented milk to stirred products: Reviewing the effects on gel structure. Trends Food Sci. Technol. 2016, 54, 26–36. [Google Scholar] [CrossRef]
- Genovese, D.B.; Lozano, J.E.; Rao, M.A. The rheology of colloidal and noncolloidal food dispersions. J. Food Sci. 2007, 72, R11–R20. [Google Scholar] [CrossRef] [PubMed]
- Iida, Y.; Tuziuti, T.; Yasui, K.; Towata, A.; Kozuka, T. Control of viscosity in starch and polysaccharide solutions with ultrasound after gelatinization. Innov. Food Sci. Emerg. Technol. 2008, 9, 140–146. [Google Scholar] [CrossRef]
- Körzendörfer, A.; Nöbel, S.; Hinrichs, J. Particle formation induced by sonication during yogurt fermentation—Impact of exopolysaccharide-producing starter cultures on physical properties. Food Res. Int. 2017, 97, 170–177. [Google Scholar] [CrossRef] [PubMed]
- Nöbel, S.; Ross, N.-L.; Protte, K.; Körzendörfer, A.; Hitzmann, B.; Hinrichs, J. Microgel particle formation in yogurt as influenced by sonication during fermentation. J. Food Eng. 2016, 180, 29–38. [Google Scholar] [CrossRef]
- Poslinski, A.J.; Ryan, M.E.; Gupta, R.K.; Seshadri, S.G.; Frechette, F.J. Rheological Behavior of Filled Polymeric Systems I. Yield Stress and Shear-Thinning Effects. J. Rheol. 1988, 32, 703–735. [Google Scholar] [CrossRef]
Figure 1.
Flow chart of the continuous ultrasound system with (1) feed tank, (2) screw spindle pump, (3) double pipe heat exchanger, (4) inline pressure and temperature sensors, (5) flow cell with sonotrode and cooling jacket, (6) acoustic transducer, (7) air-operated pinch valve, and (8) inline particle size measurement.

Figure 2.
(a) Schematic illustration and (b) image showing the ultrasound unit with the air-operated pinch valve, pressure, and temperature sensors. A detailed (c) cross-section of the flow cell with sonotrode (grey) and (d) dimensions of the sonotrode CS4d40L2 are given.
Figure 2.
(a) Schematic illustration and (b) image showing the ultrasound unit with the air-operated pinch valve, pressure, and temperature sensors. A detailed (c) cross-section of the flow cell with sonotrode (grey) and (d) dimensions of the sonotrode CS4d40L2 are given.

Figure 3.
(a) Volume fraction ϕ (■), (b) particle size d90,3 (▲), and distribution width (●) for different energy inputs WSpec provided by sonication at 15 °C and 0.15 MPa. The reference samples (□, △, ○) were pumped through the ultrasound system once under the same conditions, but without sonication. All measurements were conducted at room temperature (18–20 °C). The line in Figure 3a indicates the change from concentrated to not-concentrated area (ϕ = 0.4).

Figure 4.
(a) Apparent viscosity η’100 s−1 (■) and (b) yield stress τ0, 10 °C (▲) for different energy inputs WSpec provided by sonication at 15 °C and 0.15 MPa. The reference samples (□, △) were pumped through the ultrasound system once under the same conditions, but without sonication. All measurements were conducted at 10 °C.


Table 1.
Protein content, apparent viscosity, and yield stress of different (fat-free) fermented milk products (commercial samples).
Table 1.
Protein content, apparent viscosity, and yield stress of different (fat-free) fermented milk products (commercial samples).
| Sample | Fat Content * [%] | Protein Content [%] | η’100 s−1, 10 °C [Pa s] | τ0, 10 °C [Pa] |
|---|---|---|---|---|
| Quarg | 0.2 | 12.6 ± 0.1 | 5.5 ± 0.3 | 74.7 ± 2.9 |
| Skyr | 0.2 | 10.1 ± 0.1 | 2.1 ± 0.0 | 22.9 ± 0.0 |
| Greek yogurt | 0.2 | 9.4 ± 0.2 | 2.1 ± 0.0 | 24.6 ± 0.5 |
| Stirred yogurt | 1.5 | 5.6 ± 0.1 | 0.8 ± 0.0 | 9.4 ± 0.2 |
| Yogurt drink | 0.1 | 3.0 ± 0.1 | 0.1 ± 0.0 | 0.3 ± 0.0 |
* Taken from product specifications.
Disclaimer/Publisher’s Note: The statements, opinions and data contained in all publications are solely those of the individual author(s) and contributor(s) and not of MDPI and/or the editor(s). MDPI and/or the editor(s) disclaim responsibility for any injury to people or property resulting from any ideas, methods, instructions or products referred to in the content. |
© 2023 by the authors. Licensee MDPI, Basel, Switzerland. This article is an open access article distributed under the terms and conditions of the Creative Commons Attribution (CC BY) license (https://creativecommons.org/licenses/by/4.0/).
Share and Cite
MDPI and ACS Style
Piskors, N.; Heck, A.; Filla, J.M.; Atamer, Z.; Hinrichs, J. High Protein—Low Viscosity? How to Tailor Rheological Properties of Fermented Concentrated Milk Products. Dairy 2023, 4, 594-605. https://doi.org/10.3390/dairy4040041
AMA Style
Piskors N, Heck A, Filla JM, Atamer Z, Hinrichs J. High Protein—Low Viscosity? How to Tailor Rheological Properties of Fermented Concentrated Milk Products. Dairy. 2023; 4(4):594-605. https://doi.org/10.3390/dairy4040041
Chicago/Turabian StylePiskors, Nico, Anisa Heck, Jessica M. Filla, Zeynep Atamer, and Jörg Hinrichs. 2023. "High Protein—Low Viscosity? How to Tailor Rheological Properties of Fermented Concentrated Milk Products" Dairy 4, no. 4: 594-605. https://doi.org/10.3390/dairy4040041