Artificial Intelligence Algorithms for Discovering New Active Compounds Targeting TRPA1 Pain Receptors


Faculty of Pharmacy, “Carol Davila” University of Medicine and Pharmacy, Traian Vuia 6, 020956 Bucharest, Romania
*
Author to whom correspondence should be addressed.
AI 2020, 1(2), 276-285; https://doi.org/10.3390/ai1020018
Submission received: 22 April 2020
/
Revised: 5 June 2020
/
Accepted: 8 June 2020
/
Published: 11 June 2020
(This article belongs to the Special Issue AI in Drug Design)
Abstract
:Transient receptor potential ankyrin 1 (TRPA1) is a ligand-gated calcium channel activated by cold temperatures and by a plethora of electrophilic environmental irritants (allicin, acrolein, mustard-oil) and endogenously oxidized lipids (15-deoxy-∆12, 14-prostaglandin J2 and 5, 6-eposyeicosatrienoic acid). These oxidized lipids work as agonists, making TRPA1 a key player in inflammatory and neuropathic pain. TRPA1 antagonists acting as non-central pain blockers are a promising choice for future treatment of pain-related conditions having advantages over current therapeutic choices A large variety of in silico methods have been used in drug design to speed up the development of new active compounds such as molecular docking, quantitative structure-activity relationship models (QSAR), and machine learning classification algorithms. Artificial intelligence methods can significantly improve the drug discovery process and it is an attractive field that can bring together computer scientists and experts in drug development. In our paper, we aimed to develop three machine learning algorithms frequently used in drug discovery research: feedforward neural networks (FFNN), random forests (RF), and support vector machines (SVM), for discovering novel TRPA1 antagonists. All three machine learning methods used the same class of independent variables (multilevel neighborhoods of atoms descriptors) as prediction of activity spectra for substances (PASS) software. The model with the highest accuracy and most optimal performance metrics was the random forest algorithm, showing 99% accuracy and 0.9936 ROC AUC. Thus, our study emphasized that simpler and robust machine learning algorithms such as random forests perform better in correctly classifying TRPA1 antagonists since the dimension of the dependent variables dataset is relatively modest.
1. Introduction
Transient receptor potential ankyrin 1 (TRPA1) is a ligand-gated ionic channel permeable mostly for Ca2+, located primarily in sensory neurons [1]. It is activated by cold temperatures and by a plethora of electrophilic environmental irritants such as allicin, acrolein, mustard-oil [2,3]. Endogenously oxidized lipids like 15-deoxy-∆12,14-prostaglandin J2 or 5, 6-eposyeicosatrienoic acid work as agonists enabling TRPA1 to play a significant role in inflammatory and neuropathic pain [4,5,6,7]. Reactive oxygen species (ROS) generated in many pathologies like sleep deprivation-induced pain hypersensitivity, diabetic neuropathy, peripheral traumatic neuropathy, osteoarthritis, bacterial infection, or migraine activate the channel leading to nociceptive amplification by sending signals along the nerve fiber to the spinal cord and then into the brain [8,9]. Therefore, TRPA1 antagonists acting as non-central pain blockers are a promising choice for future treatment of such conditions having advantages over current therapeutic choices, like opioids or nonsteroidal anti-inflammatory drugs (NSAIDs) [10].
The discovery of new drugs is problematic due to the high costs of testing a large number of molecules and the time necessary for this process [11]. Different in silico methods have been used in drug design to speed up the development of new active compounds such as molecular docking that predicts the most likely pocket of a protein where a small molecule will bind and its affinity and quantitative structure–activity relationship models (QSAR), generating a mathematical equation between the pharmacological action and the chemical structure of a drug [12].
Available big data sets have paved the way for machine learning to be a new trend in solving complex problems in biological systems such as predicting interactions between a molecule and its target protein [13,14]. Advantages over classical dry lab methods are their ability to use high-dimensional data and complex nonlinear models. Using the right architecture can prevent disadvantages like the phenomenon of overfitting and overtraining [15].
A variety of web services are available for drug–target interactions or biological activities such as GUSAR antitarget/toxicity prediction [16], PASS Online [17], PharmMapper [18], ReverseScreen3D [19], similarity ensemble approach [20], TarFisDock [21]. Prediction of activity spectra for substances (PASS) is a program that comes in both a local and web version, which predicts a large panel of biological activities based on the chemical structure of a given molecule that comes as input data in the form of multilevel neighborhoods of atoms descriptors (MNA). Using an algorithm with a Bayesian approach the program yields a result Pa (probability to be active) and Pi (probability to be inactive) for each target [22,23].
Feedforward neural networks (FFNN) are a classical type of deep learning, and also the called multilayer perceptron (MLP), which use computational graphs for mapping input values to output values. Such networks are often used to find solutions in drug design problems. For example, Chen et al. with an 8-5-1 architecture calculated the permeability of molecules through the blood-brain barrier, a feature essential for central nervous system medication [24]. In our current study, we aimed to create an FFNN architecture with satisfying performance metrics, which receives as input data, MNA descriptors, and returns the probability of a compound to be a TRPA1 antagonist, serving as a tool for the discovery of new pain medication.
Other supervised machine learning algorithms used in the process of drug discovery are random forests (RF) and support vector machines (SVM), due to their ability to classify chemical compounds, generate optimal descriptors, and predict biologic activities [25,26]. Random forests are feature selection-based algorithms that use bootstraps created from random resampling on the training dataset and they apply feature selection steps by weighting each feature. SVM is a kernel-based machine learning method that relies on single classifiers [26,27].
2. Experiments and Methods
2.1. Datasets Preparation
An sdf file containing all the chemical structures of known human TRPA1 inhibitors and their activity expressed as half-maximal inhibitory concentration (IC50) values expressed in as mol/L (M) was extracted from the ChEMBL database [28]. The raw entries were filtered using DataWarrior v5.0.0 software [29] to remove all compounds with inexact values of IC50 and to merge duplicate structures into single entries with calculated mean IC50 values. Open Babel v2.4.1 [30] was used to extract each mol file from the sdf library. Since the TRPA1 inhibitors dataset is relatively small, a decoy dataset was created by randomly extracting chemical structures from the ChEMBL database. The randomization protocol to retrieve highly diverse molecules consisted of choosing random ID numbers for chemical structures from the whole ChEMBL database, thereby generating 127 decoy structures. In this case, decoys were defined as molecules consisting the inactive class, without proven activity on the TRPA1 receptor. Therefore, the implemented models would predict TRPA1 ligands with antagonistic activity within any range of potencies, rather than only antagonists with high potency. In each method, the ratio between the training and test datasets was 8:2. The expected value for the known TRPA1 inhibitors was 1 and for the decoy set was 0.
2.2. Descriptors Generation
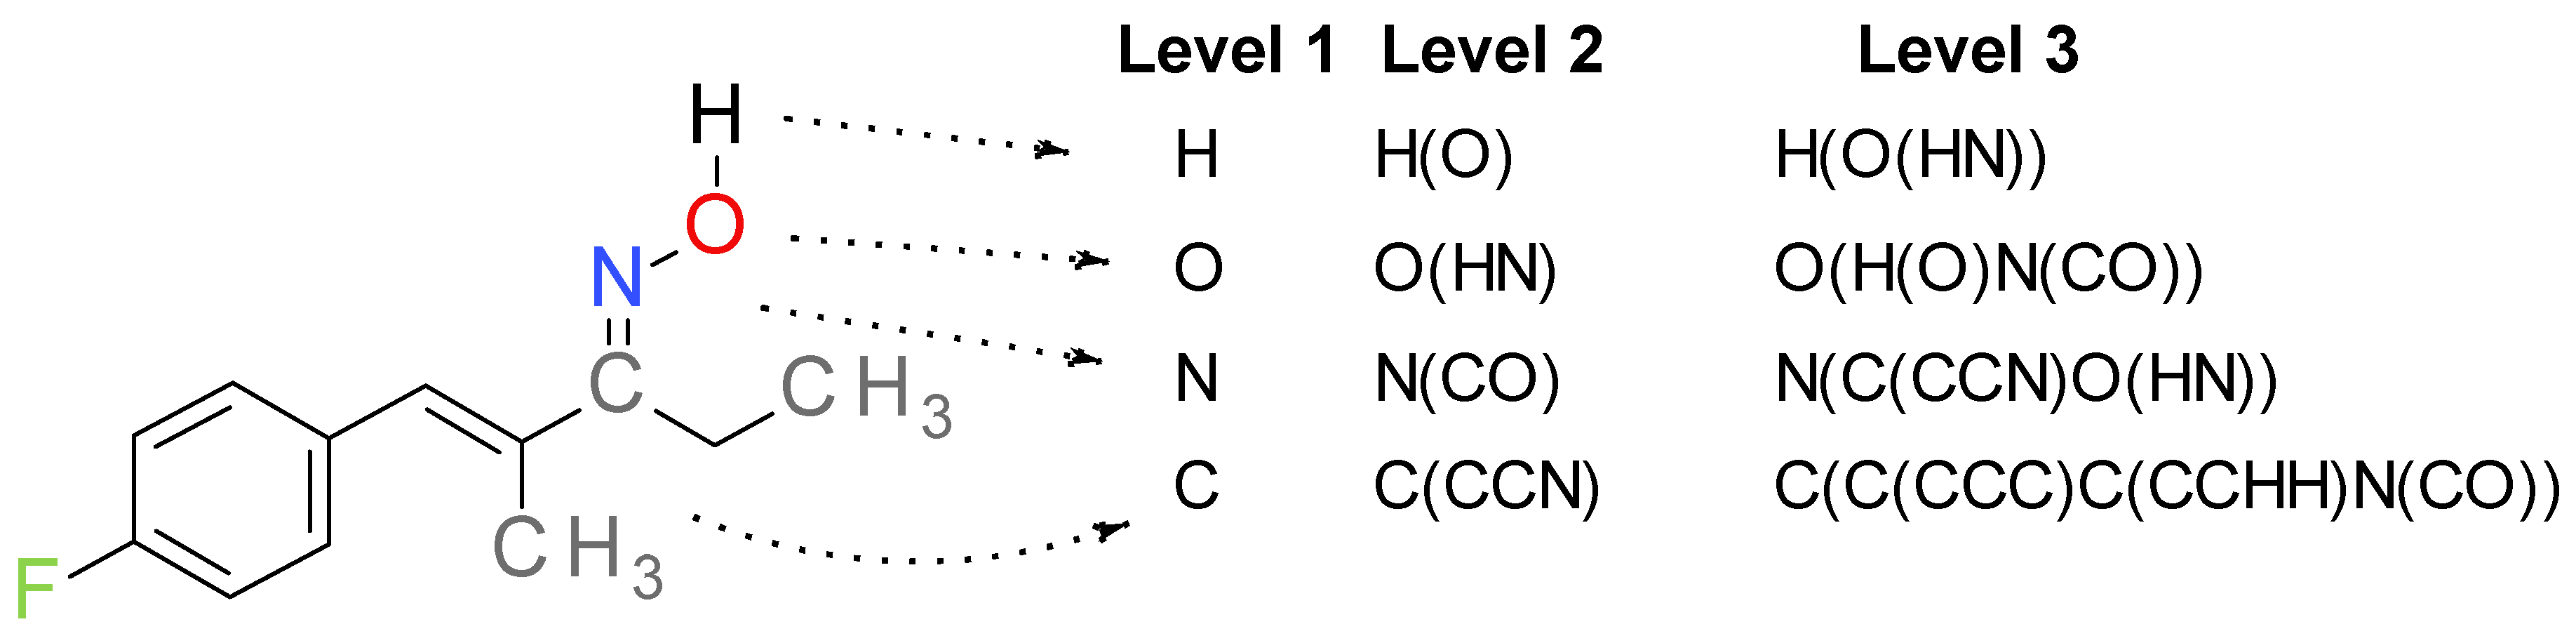
The data from the sdf file was extracted in an Excel table and using a simple formula, the connection data were transformed to generate the MNA descriptors for each compound in the database. The MNA descriptors were generated recursively starting with each atom and adding between parentheses the neighboring connected atoms. For multiple neighboring atoms, the writing order was alphabetical. This process continued at each new level starting with the corresponding MNA descriptor and adding connected atoms to the corresponding MNA descriptor [22]. Moreover, this approach ignores the types of bonds connecting the atoms [31]. The 1376 descriptors used for all compounds served as input data for the machine learning techniques that we used. Every compound was translated into an np.array with 1376 elements representing the number of occurrences of each descriptor in the molecule.
2.3. Feedforward Neural Networks (FFNN)
The neural network created using the keras python module [31], consisted of three components: the input layer, the hidden layer, and the output layer. For optimal performance, FFNN had just one hidden layer with 750 neurons, approximately half of the size of the input layer (1376, i.e., the number of descriptors), that were used as the activation function for the rectified linear unit (ReLU):
where x is the input to a neuron.
ReLU is linear for all positive values and zero for all negative values. We made this choice based on a study that suggests ReLU is more efficient than the sigmoid function [32].
To improve the performance of our neural network, we used the dropout technique that gave the best results with a dropout rate p = 0.6.
To minimize the discrepancy between the predicted values and the real values of the dataset, we used a loss function named binary cross-entropy, which measures how far away from the true value (which is either 0 or 1) the prediction is for each of the classes and then averages these class-wise errors to obtain the final loss [33]:
where t is the target value, and p is the predicted value. We trained the model for 30 epochs using a batch size equal to 16, and this parameter was chosen after running the GridSearchCV function from the sklearn module. The results came in the form of a pair representing the probability of the compound to be active and to be inactive. If the first value was larger, it was considered as positive.
To further validate the classification model, we used 10-fold cross-validation and determined the mean ROC AUC (i.e., under the receiver operating characteristic curve) of the values obtained after each validation round.
2.4. Random Forest
A random forest binary classification model was generated using the sklearn python module [34]. After running the GridSearchCV function from the sklearn module, we constructed an RF model with 50 decision trees, the maximum the square root of features considered for splitting a node, a maximum 90 levels in each decision tree, a minimum of two data points placed in a node before the node is split, a minimum one data point allowed in a leaf node, and a random state of 34. We trained our model with 80% of our datasets, while 20% was used as the test set. The predicted values were considered 1 (active) if they reached the threshold of 0.5 otherwise they were marked as 0 (inactive). To further validate the classification model, we used 10-fold cross-validation and determined the mean ROC AUC of the values obtained after each validation round.
2.5. Support Vector Machine
The support vector machine classification model was built with the sklearn python module [34]. To choose the right parameters for our current study that could generate an optimal hyperplane (decision surface) guaranteeing the best separation of our two classes, we used GridsearchCV to try a different combination of the parameters of the most importance. The C parameter, related to the penalty for wrong decisions, was tested in a range between 0.1 and 10. Different values of gamma (1, 0.1, 0.01, 0.001) related to the variance and bias of variables were tried. We also used different kernel functions, because they are the key properties of SVM, which are used to compute the dot products in the higher dimensional feature space. The optimal combination was C (8); gamma (0.001); kernel (rbf). To further validate the classification model, we used a 10-fold cross-validation and determined the mean ROC AUC of the values obtained after each validation round.
2.6. Performance Metrics
We assessed the performance of the model by computing the overall accuracy (ACC), balanced accuracy (bACC), sensitivity (true positive rate, TPR), specificity (true negative rate, TNR), false positive rate (FPR) and negative predictive value (NPV), given by the following formulas:
where TP is the number of true positives, TN is the number of true negatives, FP and FN are the numbers of false positives and false negatives, respectively.
Receiver operating characteristic curve or the ROC curves are graphical plots that show the ability of a classification system to distinguish between two classes as its discrimination threshold is varied [35]. The ROC curves were generated for each classification model, and the mean ROC AUC values for the 10 fold-cross validation were calculated.
3. Results
3.1. TRPA1 Inhibitors and Decoys Datasets
A dataset composed of 576 human TRPA1 inhibitors with biological activity expressed in IC50 values was downloaded from the ChEMBL database. Following the application of filtering procedures, a virtual chemical library was built by retaining 371 compounds from the original dataset (set A). Using the described randomization procedure, we selected 127 compounds from the ChEMBL database to form the decoy set, a group of compounds with no TRPA1 known activity (set D). The D set contained a variety of compounds from different chemical classes with molecular weights ranging from 113.12 g/mol to 1089.22 g/mol and a mean value of 418 g/mol.
3.2. Descriptors Generation
The MNA descriptors were characterized by their level, representing the number of iterations starting from an atom. In this study, the level 3 MNA descriptors were computed for all compounds in datasets A and D, resulting in 1376 distinct descriptors. The principle of the MNA descriptors generation is exemplified in Figure 1 for compound A-967079, a well-established TRPA1 antagonist [36].
3.3. Machine Learning Performance Metrics
Three supervised machine learning algorithms were implemented to build models for discovering novel TRPA1 antagonists, using state of the art methods used in drug discovery. Thus, the feedforward neural networks, random forests, and support vector machine predictive models were built with satisfying accuracy in classifying chemical compounds as active TRPA1 antagonists. For all the described algorithms, the following parameters were determined to assess the performance: accuracy, balanced accuracy, mean ROC AUC, sensitivity, specificity, false-positive rate, and negative predictive value, using the external validation dataset which represented 20% of set A (75 molecules) and set D (25 molecules) (Table 1).
ROC curves are global indicators of machine learning algorithms performance. By analyzing such graphical representations (Figure 2), it could be stated that the random forest algorithm yielded the best classification results, followed by the FFNN and SVM. The RF model showed the most optimal balance between sensitivity and specificity, with an overall accuracy of 99%. Moreover, the RF algorithm was characterized by a satisfyingly low false-positive rate and maximum negative predicted value. The high predictive power of the random forest was also underlined by the balanced accuracy (98%) and mean ROC AUC of 0.9936 for the 10-fold cross-validation, followed by SVM and FFNN, which both scored 0.9354.
The SVM algorithm yielded the second-best accuracy in correctly classifying TRPA1 antagonists. SVM showed a sensitivity and specificity lower than the RF, but higher than FFNN, performing similarly with the FFNN algorithm in identifying true positives and true negatives (Figure 3). However, SVM performed poorly in identifying inactive molecules, showing specificity of 84%. Moreover, SVM showed a high negative predicted value, but also a high false-positive rate, similar to FFNN, further highlighting its disadvantages in this specific case. For FFNN, both accuracy and balanced accuracy were lower than the SVM algorithm, even though the ROC AUC values were practically equal.
4. Discussion
Transient receptor potential ankyrin 1 is a non-selective ligand-gated calcium channel that is activated by noxious stimuli, such as cold temperatures, electrophilic environmental compounds (allicin, acrolein, mustard-oil), and endogenous lipids. TRPA1 channel is expressed in various tissues, including dorsal root ganglia, cortex, caudal nucleus, urinary bladder, colon innervations, and pancreatic beta cells, playing key roles in several pathophysiological processes. Discovery of novel TRPA1 receptor antagonists is a promising tool in managing diseases, such as neuropathic pain, inflammation, and multiple sclerosis, due to their ability to ameliorate such ailments by blocking the calcium influx mediated by this pain receptor [37]. Moreover, TRPA1 antagonists are advantageous over current therapeutic approaches that target pain, such as opioids, NSAIDs, and antiepileptic drugs, due to their pharmacotoxicological profiles [10].
All the implemented machine learning algorithms showed high predictive powers. The random forest algorithm showed the best performance metrics among all the implemented models. These results could be credited to the small dataset that is available for training such screening algorithms, usable in the process of discovering new active molecules targeting TRPA1 calcium channels.
PASS software is a trained computational screening method based on structure–activity relationships analysis and can predict over 4000 kinds of biologic activities, including target prediction, pharmacological, and toxic effects [38], as stated by the development team (http://www.pharmaexpert.ru/passonline/). Moreover, PASS is a generalized algorithm with generally good performance built for predicting a broad array of biologic activities, while we trained our machine learning models specifically for predicting TRPA1 antagonists. Therefore, we considered the independent variables used by the PASS algorithm as a promising descriptor class suitable for developing machine learning models for discovering novel TRPA1 antagonists. PASS uses the second level of MNA descriptors for analyzing structure–activity relationships [17], while we used as input variables the third level. This approach yielded satisfying performances for the implemented models, indicating that the third level MNA descriptors could be suitable for predicting the TRPA1 antagonist activity. One disadvantage of MNA descriptors as predicting variables is that they do not consider the differences in activities between optical or geometrical chemical isomers. Thus, neither PASS nor our models can differentiate activity cliffs between such isomers.
The random forest model outclassed the neural network and support vector machine models since neural networks tend to behave well when trained with a low number of dependent variables, which was our case, considering the small dimension of the TRPA1 antagonist dataset. On the other hand, neural networks perform better on larger datasets, since their architecture is more sophisticated and can withstand the impressive dimensions of both dependent and independent variables, while also being capable of solving multiple classification problems, with more than two input and output classes. Thus, we obtained lower performance metrics for the FFNN model due to an insufficient number of known TRPA1 antagonists needed for training a more complicated model that can accurately predict the biologic activities of highly diverse chemical structures with similar pharmacological profiles. On the other hand, the support vector machine model was slightly better in classifying TRPA1 antagonists than FFNN.
In our previous paper, we aimed to build a computational screening algorithm for repurposing drugs as therapeutic solutions for multiple sclerosis by targeting TRPA1 receptors [37]. We used a simple binary classification model based on optimal molecular descriptor cutoffs, and we obtained an accuracy of 81.3% in predicting the activity class and a ROC AUC of 0.874. This approach had lower predictive power than the RF, SVM, and FFNN algorithms. Furthermore, we integrated the outputs of the binary classification model, a multilinear regression model, and the binding energies retrieved from a molecular docking experiment into a global predictive model based on a multivariate binary logistic regression equation. This simplistic classification model that we used as a ranking method of potential repurposing candidates yielded an accuracy of 94.3% in predicting the activity class of the external validation set, with ROC AUC of 0.983. The predictive performance of this model was exceeded only by the random forest algorithm in terms of accuracy, sensitivity (93.2%) and specificity (95.3%), while the SVM algorithm was slightly behind in predictive power, considering the values for accuracy and sensitivity. However, the aforementioned prediction model was trained for discovering potent TRPA1 antagonists, while the three machine learning methods described herein were suitable for classifying TRPA1 antagonists as active compounds with potencies within any range of activity.
5. Conclusions
Our findings further underlined that simpler and robust machine learning algorithms such as random forests perform better in correctly classifying biologically active molecules when the dimensions of dependent variables datasets are relatively modest.
Author Contributions
Conceptualization, D.P.M. and G.M.N.; Investigation, D.P.M., C.T., G.S., D.R., and G.M.N.; Methodology, D.P.M., C.T., and G.S.; Writing—Original draft, D.P.M., C.T., G.S., and D.R.; Writing—Review & Editing, G.M.N. All authors have read and agreed to the published version of the manuscript.
Funding
This research received no external funding.
Conflicts of Interest
The authors declare no conflict of interest.
References
- Moran, M.M.; Xu, H.; Clapham, D.E. TRP ion channels in the nervous system. Curr. Opin. Neurobiol. 2004, 14, 362–369. [Google Scholar] [CrossRef]
- Moparthi, L.; Kichko, T.I.; Eberhardt, M.; Högestätt, E.D.; Kjellbom, P.; Johanson, U.; Reeh, P.W.; Leffler, A.; Filipovic, M.R.; Zygmunt, P.M. Human TRPA1 is a heat sensor displaying intrinsic U-shaped thermosensitivity. Sci. Rep. 2016, 6, 28763. [Google Scholar] [CrossRef] [PubMed]
- Bautista, D.M.; Jordt, S.-E.; Nikai, T.; Tsuruda, P.R.; Read, A.J.; Poblete, J.; Yamoah, E.N.; Basbaum, A.I.; Julius, D. TRPA1 Mediates the Inflammatory Actions of Environmental Irritants and Proalgesic Agents. Cell 2006, 124, 1269–1282. [Google Scholar] [CrossRef] [PubMed] [Green Version]
- Cruz-Orengo, L.; Dhaka, A.; Heuermann, R.J.; Young, T.J.; Montana, M.C.; Cavanaugh, E.J.; Kim, D.; Story, G.M. Cutaneous Nociception Evoked by 15-delta PGJ2 via Activation of Ion Channel TRPA1. Mol. Pain 2008, 4, 1730–1744. [Google Scholar] [CrossRef] [Green Version]
- Sisignano, M.; Park, C.-K.; Angioni, C.; Zhang, D.D.; von Hehn, C.; Cobos, E.J.; Ghasemlou, N.; Xu, Z.-Z.; Kumaran, V.; Lu, R.; et al. 5,6-EET Is Released upon Neuronal Activity and Induces Mechanical Pain Hypersensitivity via TRPA1 on Central Afferent Terminals. J. Neurosci. 2012, 32, 6364–6372. [Google Scholar] [CrossRef] [PubMed] [Green Version]
- Trevisan, G.; Benemei, S.; Materazzi, S.; De Logu, F.; De Siena, G.; Fusi, C.; Fortes Rossato, M.; Coppi, E.; Marone, I.M.; Ferreira, J.; et al. TRPA1 mediates trigeminal neuropathic pain in mice downstream of monocytes/macrophages and oxidative stress. Brain 2016, 139, 1361–1377. [Google Scholar] [CrossRef] [Green Version]
- Trevisan, G.; Hoffmeister, C.; Rossato, M.F.; Oliveira, S.M.; Silva, M.A.; Silva, C.R.; Fusi, C.; Tonello, R.; Minocci, D.; Guerra, G.P.; et al. TRPA1 receptor stimulation by hydrogen peroxide is critical to trigger hyperalgesia and inflammation in a model of acute gout. Free Radic. Biol. Med. 2014, 72, 200–209. [Google Scholar] [CrossRef] [PubMed] [Green Version]
- Tai, C.; Zhu, S.; Zhou, N. TRPA1: The Central Molecule for Chemical Sensing in Pain Pathway? J. Neurosci. 2008, 28, 1019–1021. [Google Scholar] [CrossRef] [PubMed] [Green Version]
- Koivisto, A.; Jalava, N.; Bratty, R.; Pertovaara, A. TRPA1 Antagonists for Pain Relief. Pharmaceuticals 2018, 11, 117. [Google Scholar] [CrossRef] [Green Version]
- Li, J.-X.; Zhang, Y. Emerging drug targets for pain treatment. Eur. J. Pharmacol. 2012, 681, 1–5. [Google Scholar] [CrossRef] [PubMed]
- DiMasi, J.A.; Hansen, R.W.; Grabowski, H.G. The price of innovation: New estimates of drug development costs. J. Health Econ. 2003, 22, 151–185. [Google Scholar] [CrossRef] [Green Version]
- Akhoon, B.A.; Tiwari, H.; Nargotra, A. In Silico Drug Design Methods for Drug Repurposing. In In Silico Drug Design; Elsevier: Amsterdam, The Netherlands, 2019; pp. 47–84. ISBN 978-0-12-816125-8. [Google Scholar]
- Lavecchia, A. Machine-learning approaches in drug discovery: Methods and applications. Drug Discov. Today 2015, 20, 318–331. [Google Scholar] [CrossRef] [PubMed] [Green Version]
- Pahikkala, T.; Airola, A.; Pietila, S.; Shakyawar, S.; Szwajda, A.; Tang, J.; Aittokallio, T. Toward more realistic drug-target interaction predictions. Brief. Bioinform. 2015, 16, 325–337. [Google Scholar] [CrossRef] [PubMed]
- Livingstone, D.J.; Manallack, D.T.; Tetko, I. V Data modelling with neural networks: Advantages and limitations. J. Comput.-Aided Mol. Des. 1997, 11, 135–142. [Google Scholar] [CrossRef] [PubMed]
- Lagunin, A.; Zakharov, A.; Filimonov, D.; Poroikov, V. QSAR Modelling of Rat Acute Toxicity on the Basis of PASS Prediction. Mol. Inform. 2011, 30, 241–250. [Google Scholar] [CrossRef]
- Filimonov, D.A.; Lagunin, A.A.; Gloriozova, T.A.; Rudik, A.V.; Druzhilovskii, D.S.; Pogodin, P.V.; Poroikov, V.V. Prediction of the biological activity spectra of organic compounds using the pass online web resource. Chem. Heterocycl. Compd. 2014, 50, 444–457. [Google Scholar] [CrossRef]
- Liu, X.; Ouyang, S.; Yu, B.; Liu, Y.; Huang, K.; Gong, J.; Zheng, S.; Li, Z.; Li, H.; Jiang, H. PharmMapper server: A web server for potential drug target identification using pharmacophore mapping approach. Nucleic Acids Res. 2010, 38, W609–W614. [Google Scholar] [CrossRef] [Green Version]
- Kinnings, S.L.; Jackson, R.M. ReverseScreen3D: A Structure-Based Ligand Matching Method to Identify Protein Targets. J. Chem. Inf. Modeling 2011, 51, 624–634. [Google Scholar] [CrossRef]
- Wang, Z.; Liang, L.; Yin, Z.; Lin, J. Improving chemical similarity ensemble approach in target prediction. J. Cheminformatics 2016, 8, 20. [Google Scholar] [CrossRef] [Green Version]
- Li, H.; Gao, Z.; Kang, L.; Zhang, H.; Yang, K.; Yul, K.; Luo, X.; Zhu, W.; Chen, K.; Shen, J.; et al. TarFisDock: A web server for identifying drug targets with docking approach. Nucleic Acids Res. 2006, 34, W219–W224. [Google Scholar] [CrossRef] [PubMed] [Green Version]
- Filimonov, D.A.; Druzhilovskiy, D.S.; Lagunin, A.A.; Gloriozova, T.A.; Rudik, A.V.; Dmitriev, A.V.; Pogodin, P.V.; Poroikov, V.V. Computer-aided prediction of biological activity spectra for chemical compounds: Opportunities and limitation. Biomed. Chem. Res. Methods 2018, 1, e00004. [Google Scholar] [CrossRef] [Green Version]
- Geronikaki, A.; Lagunin, A.; Poroikov, V.; Filimonov, D.; Hadjipavlou-Litina, D.; Vicini, P. Computer aided prediction of biological activity spectra: Evaluating versus known and predicting of new activities for thiazole derivatives. SAR QSAR Environ. Res. 2002, 13, 457–471. [Google Scholar] [CrossRef] [PubMed]
- Chen, Y.; Zhu, Q.-J.; Pan, J.; Yang, Y.; Wu, X.-P. A prediction model for blood–brain barrier permeation and analysis on its parameter biologically. Comput. Methods Programs Biomed. 2009, 95, 280–287. [Google Scholar] [CrossRef]
- Heikamp, K.; Bajorath, J. Support vector machines for drug discovery. Expert Opin. Drug Discov. 2014, 9, 93–104. [Google Scholar] [CrossRef] [PubMed]
- Lind, A.P.; Anderson, P.C. Predicting drug activity against cancer cells by random forest models based on minimal genomic information and chemical properties. PLoS ONE 2019, 14, e0219774. [Google Scholar] [CrossRef] [PubMed] [Green Version]
- Maltarollo, V.G.; Kronenberger, T.; Espinoza, G.Z.; Oliveira, P.R.; Honorio, K.M. Advances with support vector machines for novel drug discovery. Expert Opin. Drug Discov. 2019, 14, 23–33. [Google Scholar] [CrossRef]
- Gaulton, A.; Bellis, L.J.; Bento, A.P.; Chambers, J.; Davies, M.; Hersey, A.; Light, Y.; McGlinchey, S.; Michalovich, D.; Al-Lazikani, B.; et al. ChEMBL: A large-scale bioactivity database for drug discovery. Nucleic Acids Res. 2012, 40, D1100–D1107. [Google Scholar] [CrossRef] [Green Version]
- Sander, T.; Freyss, J.; Von Korff, M.; Rufener, C. DataWarrior: An open-source program for chemistry aware data visualization and analysis. J. Chem. Inf. Modeling 2015, 55, 460–473. [Google Scholar] [CrossRef]
- O’Boyle, N.M.; Banck, M.; James, C.A.; Morley, C.; Vandermeersch, T.; Hutchison, G.R. Open Babel: An Open chemical toolbox. J. Cheminformatics 2011, 3, 33. [Google Scholar] [CrossRef] [Green Version]
- Keras-team. GitHub. 2005. Available online: https://github.com/keras-team/keras (accessed on 10 June 2020).
- Hinton, G.E.; Srivastava, N.; Krizhevsky, A.; Sutskever, I.; Salakhutdinov, R.R. Improving neural networks by preventing co-adaptation of feature detectors. arXiv Preprint 2012, arXiv:1207.0580. Available online: https://arxiv.org/pdf/1207.0580.pdf (accessed on 11 June 2020).
- Golik, P.; Doetsch, P.; Ney, H. Cross-Entropy vs. Squared Error Training: A Theoretical and Experimental Comparison. In Proceedings of the 14th Annual Conference of the International Speech Communication Association, Lyon, France, 25–29 August 2013; pp. 1756–1760. [Google Scholar]
- Pedregosa, F.; Varoquaux, G.; Gramfort, A.; Michel, V.; Thirion, B.; Grisel, O.; Blondel, M.; Prettenhofer, P.; Weiss, R.; Dubourg, V.; et al. Scikit-learn: Machine Learning in Python. J. Mach. Learn. Res. 2011, 12, 2825–2830. [Google Scholar]
- Kumar, R.; Indrayan, A. Receiver operating characteristic (ROC) curve for medical researchers. Indian Pediatr. 2011, 48, 277–287. [Google Scholar] [CrossRef] [PubMed]
- Preti, D.; Saponaro, G.; Szallasi, A. Transient receptor potential ankyrin 1 (TRPA1) antagonists. Pharm. Pat. Anal. 2015, 4, 75–94. [Google Scholar] [CrossRef] [PubMed]
- Mihai, D.P.; Nitulescu, G.M.; Ion, G.N.D.; Ciotu, C.I.; Chirita, C.; Negres, S. Computational Drug Repurposing Algorithm Targeting TRPA1 Calcium Channel as a Potential Therapeutic Solution for Multiple Sclerosis. Pharmaceutics 2019, 11, 446. [Google Scholar] [CrossRef] [PubMed] [Green Version]
- Poroikov, V.V.; Filimonov, D.A.; Borodina, Y.V.; Lagunin, A.A.; Kos, A. Robustness of Biological Activity Spectra Predicting by Computer Program PASS for Noncongeneric Sets of Chemical Compounds. J. Chem. Inf. Comput. Sci. 2000, 40, 1349–1355. [Google Scholar] [CrossRef]
Figure 1.
The generation of MNA level 3 descriptors exemplified for a TRPA1 antagonist A-967079 ((NZ)-N-[(E)-1-(4-fluorophenyl)-2-methylpent-1-en-3-ylidene] hydroxylamine).
Figure 1.
The generation of MNA level 3 descriptors exemplified for a TRPA1 antagonist A-967079 ((NZ)-N-[(E)-1-(4-fluorophenyl)-2-methylpent-1-en-3-ylidene] hydroxylamine).

Figure 2.
ROC-AUC curves for random forest (left), SVM (middle), and FFNN (right). Highest ROC AUC values have been registered for the RF model (0.9936), followed by SVM and FFNN (0.9354). SVM showed a higher true positive rate (sensitivity) than FFNN, while FFNN showed a higher value for false-positive rate (lower specificity).

Figure 3.
Comparative performance metrics for supervised machine learning algorithms implemented as binary classification models. RF—random forest; FFNN—feedforward neural network; SVM—support vector machine; TPR—true positive rate (sensitivity); TNR—true negative rate (specificity); ACC—accuracy; bACC—balanced accuracy; FPR—false positive rate; NPV—negative predicting value; ROC AUC—area under receiver operating characteristic curve. RF model showed the highest values for all discussed performance metrics, with the lowest FPR. SVM and FFNN showed similar predictive powers, with equal ROC AUC values, and FFNN showing a slightly lower performance. Both SVM and FFNN had high sensitivities and low specificities.


Table 1.
Performance parameters for each algorithm.
| Algorithm | TPR (%) | TNR (%) | ACC (%) | bACC (%) | FPR (%) | NPV (%) | Mean ROC AUC |
|---|---|---|---|---|---|---|---|
| RF | 100 | 96 | 99 | 98 | 4 | 100 | 0.9936 |
| SVM | 92 | 84 | 90 | 88 | 16 | 77.78 | 0.9354 |
| FFNN | 90.67 | 80 | 88 | 85.33 | 20 | 74.07 | 0.9354 |
RF—random forest; SVM—support vector machine; FFNN—feedforward neural network; TPR—true positive rate (sensitivity); TNR—true negative rate (specificity); ACC—accuracy; bACC—balanced accuracy; FPR—false positive rate; NPV—negative predicting value; ROC AUC—Area under receiver operating characteristic curve.
© 2020 by the authors. Licensee MDPI, Basel, Switzerland. This article is an open access article distributed under the terms and conditions of the Creative Commons Attribution (CC BY) license (http://creativecommons.org/licenses/by/4.0/).
Share and Cite
MDPI and ACS Style
Mihai, D.P.; Trif, C.; Stancov, G.; Radulescu, D.; Nitulescu, G.M. Artificial Intelligence Algorithms for Discovering New Active Compounds Targeting TRPA1 Pain Receptors. AI 2020, 1, 276-285. https://doi.org/10.3390/ai1020018
AMA Style
Mihai DP, Trif C, Stancov G, Radulescu D, Nitulescu GM. Artificial Intelligence Algorithms for Discovering New Active Compounds Targeting TRPA1 Pain Receptors. AI. 2020; 1(2):276-285. https://doi.org/10.3390/ai1020018
Chicago/Turabian StyleMihai, Dragos Paul, Cosmin Trif, Gheorghe Stancov, Denise Radulescu, and George Mihai Nitulescu. 2020. "Artificial Intelligence Algorithms for Discovering New Active Compounds Targeting TRPA1 Pain Receptors" AI 1, no. 2: 276-285. https://doi.org/10.3390/ai1020018