
Mass Transport Limitations in Electrochemical Conversion of CO2 to Formic Acid at High Pressure


Engineering Thermodynamics, Process & Energy Department, Faculty of Mechanical, Maritime and Materials Engineering, Delft University of Technology, Leeghwaterstraat 39, 2628 CB Delft, The Netherlands
*
Author to whom correspondence should be addressed.
Electrochem 2022, 3(3), 549-569; https://doi.org/10.3390/electrochem3030038
Submission received: 8 August 2022
/
Revised: 24 August 2022
/
Accepted: 28 August 2022
/
Published: 2 September 2022
(This article belongs to the Collection Feature Papers in Electrochemistry)
Abstract
:Mass transport of different species plays a crucial role in electrochemical conversion of CO due to the solubility limit of CO in aqueous electrolytes. In this study, we investigate the transport of CO and other ionic species through the electrolyte and the membrane, and its impact on the scale-up process of HCOO/HCOOH formation. The mass transport of ions to the electrode and the membrane is modelled at constant current density. The mass transport limitations of CO on the formation of HCOO/HCOOH is investigated at different pressures ranges from 5–40 bar. The maximum achievable partial current density of formate/formic acid is increased with increasing CO pressure. We use an ion exchange membrane model to understand the ion transport behaviour for both the monopolar and bipolar membranes. The cation exchange (CEM) and anion exchange membrane (AEM) model show that ion transport is limited by the electrolyte salt concentrations. For 0.1 M KHCO, the AEM reaches the limiting current density more quickly than the CEM. For the BPM model, ion transport across the diffusion layer on either side of the BPM is also included to understand the concentration polarization across the BPM. The model revealed that the polarization losses across the bipolar membrane depend on the pH of the electrolyte used for the CO reduction reaction (CO2RR). The polarization loss on the anolyte side decreases with an increasing pH, while, on the cathode side, it increases with increasing catholyte pH. With this combined model for the electrode reactions and the membrane transport, we are able to account for the various factors influencing the polarization losses in the CO electrolyzer. To complete the analysis, we simulated the full cell polarization curve and fitted with the experimental data.
1. Introduction
The effects of global warming have already reached an alarming level [1]. The scientific community and the industry have been trying to reduce the emission of greenhouse gases from the atmosphere, especially CO. There are several methods being developed to store and sequestrate emitted CO gas to reduce CO concentrations in the atmosphere [2,3,4]. One of the ways to reduce CO emissions is to electrochemically convert CO into valuable chemicals [5,6,7,8,9,10,11,12,13]. The electrochemical method is a green process that only requires electricity that can be generated from renewable sources like solar and wind [14]. The main issue with the electrochemical conversion method is the need of an electrocatalyst that can produce desirable chemicals with a reasonable Faradaic efficiency [15,16,17]. Recently, considerable efforts have been made to produce CO and HCOOH from CO [18,19,20]. Electrochemical reduction of CO produces various products depending on the electrocatalyst used [16,21,22,23,24,25,26]. When tin metal (Sn) is used as electrocatalyst, formate/formic acid is identified as the main product of the CO reduction reaction (CO2RR) along with small quantities of CO [18,19,20,22,27,28]. The formate/formic acid can also be formed by direct reduction of bicarbonate anions [29,30,31]. In addition to the CO2RR, reduction of water also occurs. The CO2RR is carried out at the cathode in an electrochemical cell in combination with the oxygen evolution reaction (OER) at the anode. The overall reaction, which involves formate/formic acid formation and oxygen evolution is as follows:
where is the standard reduction potential, and SHE stands for Standard Hydrogen Electrode. The Faradaic efficiency for formic acid formation depends on the electrolyte concentration, pressure, and the applied potential. The Faradaic efficiency ranges from 65–90% as reported in literature [16,23,27]. One of the crucial factors that causes mass transport limitations is the low solubility of CO in aqueous electrolytes [32,33,34,35]. Increasing the CO pressure is one way to improve the mass transport of CO to the electrode surface. Another way is to feed gaseous CO2 (g) directly to the catalyst surface using a gas diffusion electrode (GDE). A high concentration of formic acid is reported using GDEs [36,37]. The depletion of CO at the electrode surface forms a concentration gradient of specific thickness that defines the rate of CO transfer to the electrode. This diffusion layer thickness also determines the maximum achievable current density. It is also possible to suppress the effect of mass transport limitations by operating the CO2RR at low current density [38]. At this lower current density, the CO surface concentration is not different from the bulk concentration, so there are more CO molecules available for reduction. There is also another way in which the CO2RR is carried out under controlled mass transport limitations in which the electrode is rotated at certain speed. It is reported that the rotation speed of 450 rpm is sufficient to maintain the surface concentration equal to bulk concentration [39]. There are several reports that investigated the effect of mass transport limitations experimentally [40,41]. In those studies, the rotating disc electrode was used to maintain the well-defined mass transport that allowed them to study the kinetics of CO2RR without any mass transport complications. One of the interesting experimental results related to the mass transport limitation has been reported by Dunwell et al. [39]. These authors used surface enhanced infrared spectroscopy to study the impact of mass transport limitations on the electrochemical reduction of CO. Interestingly, these authors correlated the mass transport effects with the concentration overpotential and its influence on the electrode kinetics of CO2RR. However, the measurements were performed using a half-cell configuration. These experimental conditions are not possible to implement in the industrial scale CO electrolyzers where high current density and large electrodes are used. However, the effect of ion transport through the membrane on performance of the CO electrolyzers was clearly missing from these studies.
In CO electrolyzers, the role of ion exchange membrane is crucial as it prevents the products from reaching the anode surface. The membrane also plays a role in maintaining the pH, since electrolytes with different pH are required at the cathode and anode sides to facilitate CO2RR and OER reactions at low overpotential. In addition, the CO2RR and OER reactions also produce OH and H. Typically, KHCO is used as a catholyte for the CO2RR, and alkaline electrolyte (KOH) is used as an anolyte for the OER. Bipolar membranes (BPM) have attracted much attention because of their ability to maintain the pH and high permeability and low cross-over. It facilitates the usage of electrolytes with different pH at the cathode and anode compartment. This application is very useful, especially for the CO electrolyzer, where neutral pH is beneficial for CO reduction (CO2RR), and an alkaline anolyte is needed for the oxygen evolution reaction (OER). In a BPM, the cation exchange membrane (CEM) and anion exchange membrane (AEM) are sandwiched together to form a single sheet of a membrane [42,43]. When a BPM is operated under reverse bias mode, water molecules present at the interface undergo dissociation, and H and OH ions are produced which are transported through the CEMs and AEMs to the catholyte and anolyte compartments, respectively. It is widely accepted that the water dissociation reaction at the interface is greatly influenced by the electric field effect according to the second Wien effect [44,45,46,47,48]. However, an electric field enhanced water dissociated model showed similar dissociation rate enhancement for an CEM and an AEM, but this cannot explain why water dissociation is only observed in AEM [44,49]. Simon et al. [42,49,50] have proposed a chemical reaction model based on the acid–base reaction of a weak basic group surrounded by water molecules. Both the electric field effect and the chemical reaction model are combined to calculate the enhanced rate dissociation constant for water dissociation at the interfacial region. It is also shown by Simon et al. [50] that the presence of catalysts at the interfacial region enhances the water-splitting reaction. The weak ion exchange groups present as a fixed charge on the polymer backbone that catalyzes the water dissociation reaction. Recently, Yan et al. [51] prepared a BPM with graphene oxide as a catalyst, and it was shown that the presence of the catalyst decreases the electric field intensity and at the same time the reversible protonation of weak basic group is catalyzed. However, there are fewer studies that describe the transport of H and OH ions inside the BPM and the adjacent diffusion boundary layer (DBL) [46,51,52]. Yan et al. [51] developed a numerical simulation model to describe ion transport and electric field enhanced water dissociation reaction. Recently, Mareev et al. [46] have developed a comprehensive model to describe the transport of salt ions, and the effect of a catalyst on the interfacial region. To the best of our knowledge, there is no study available to systematically understand the role of the BPM in the electrochemical conversion of CO to formate/formic acid. Given this background, we developed a full-cell model to understand the role of mass transport through the electrolytes and the membrane. This may provide valuable parameters for the scale up of formate/formic acid production.
Several models have been reported for CO electrolyzers [33,34,53,54,55,56]. Most of them are based on diffusion–reaction models to describe the transport of CO to the cathode surface [33,34,54]. The Butler–Volmer equation [34,53,57] is generally used to obtain the current density from the model. Few reports discussed the effect of the anode and the membrane [33]. Although the ion exchange membrane plays a critical role in the CO electrolyzer, there are not many studies that investigate the role of the membrane on the performance of CO electrolyzers. The focus of this study is to investigate the effect of ion transport through the membrane and its effect on the CO electrochemical conversion. A diffusion layer is included in the membrane model to analyze the role of electrolyte concentration and the limiting current density.
In this paper, we analyze the effect of CO pressure on the concentration of different ionic species produced during the homogeneous reactions of CO in the bulk of the KHCO electrolyte. The mass transport limited current density is modelled using a diffusion–reaction model. The limiting current density of the oxygen reduction reaction (ORR) on the Ir/IrO electrode is also modelled to explore the limitation of anode reactions. Subsequently, the transport of ions in the monopolar membrane, and the bipolar membrane is modelled. The membrane model also includes the diffusion layer on either side of the membrane. The correlation between the electrolyte concentration and limiting current density is established. We will show that, at a low electrolyte concentration (<0.1 M), the CO electrochemical conversion with the monopolar membrane is limited by the ion transport through the membrane. In the case of a BPM, the pH of the catholyte and anolyte plays an important role in reducing the polarization losses at the membrane/electrolyte interface. Finally, the contribution of different elements involved in the polarization losses is modelled. These parameters are used to model the full cell voltage and polarization curve.
2. Modelling
A schematic representation of the electrochemical cell used for this study is shown in Figure 1. The model electrochemical cell consists of Sn metal as cathode, Ir/IrO as anode and the ion exchange membrane. The electrolyte on both sides of the membrane is considered well stirred. The model system is also comparable to the flow cell configurations with a constant flow rate. We used a diffusion–reaction model to investigate the mass transport of CO to the cathode surface and the oxygen evolution at the anode surface. The concentration of dissolved CO at different pressures is used as input to investigate the transport of CO. The mass transfer rate of major charge carriers to the membrane is defined using a mass transfer coefficient and a Donnan equilibrium constant. The concentration of the counter ions at the membrane surface is calculated by assuming that the concentration is equal to the fixed membrane charges (1 M).
2.1. Transport of the Species to the Electrode Surface
The transport of CO and other ionic species in the electrolyte is governed by the Nernst–Planck equation [57], which considers diffusion, migration and convection transport phenomena:
where is the flux, is the concentration of species i (CO, HCO, CO, OH), z is the charge number of the species, u is the mobility of the ions related to the diffusion coefficient by the Nernst–Einstein equation, F is Faraday’s constant, D is the diffusion coefficient, and is the electrolyte potential. In Equation (2), the left side first term represents the migration, the second term represents the convection, and the third term represents the diffusion transport process. We assumed that the transport of CO (a neutral reactive species) takes place due to a change of concentration near the electrode surface. The influence of migration and convection phenomena to describe the transport of species to the electrode surface is neglected. By neglecting this, the Nernst–Planck equation becomes similar to Fick’s diffusion equation:
In this equation, r is the net rate of formation and consumption of species i involved. As CO reacts with water, it is important to consider all the ionic species formed in these reactions. This is written out in Appendix A. The set of transport equations for CO, HCO, OH and CO are solved numerically using the following initial and boundary conditions. Initially, the concentration of species near the electrode is equal to the bulk of the electrolyte i.e., concentrations are the same everywhere at t = 0 (Figure 2). When the current is applied, a diffusion layer is formed near the electrode due to the concentration gradient. Two boundary conditions need to be defined, one at the boundary between diffusion layer (X = ) and the bulk of the electrolyte, another one at the electrode surface (X = 0). At X = , the concentration of the various species equals their bulk values. The boundary condition at the electrode surface (X = 0) is defined by the flux term. The fluxes are calculated using the partial current density obtained from the Butler–Volmer equation:
in which i = HCOO, CO, H. In this equation, i is an exchange current density, k is the rate constant, C is the concentration of electroactive species (CO for CO2RR, and HO for HER), is the charge transfer coefficient, F is the Faraday constant, is the overpotential, R is the gas constant, and T is the temperature.
The reactions at the anode surface are considered non-limiting. To understand the behaviour of the full electrochemical cell, information from the anode electrode is needed. As the cell voltage and the polarization loss of the CO electrolyzer are influenced by the anodic reactions, it is important to model the anode reactions as well. The anode side is modelled in the same way as the cathode side, and the anolyte concentration (0.5 M KOH) is directly taken as the concentration of the electroactive species. The Nernst–Planck equation is used for the anode as well. No source term (r) is added to the transport equation, as no chemical reaction occurs in the anolyte. At the anode, the oxygen evolution reaction (OER) occurs at the Ir/IrO coated Ti electrode. The reaction is carried out in alkaline pH, and 0.5 M KOH is used as anolyte. The OH ion is the only reactive species in the OER reaction; hence, the electrolyte concentration is directly taken as the initial and boundary condition (Dirichlet). For the boundary condition at the electrode surface (X = 0), the anodic flux is calculated from total current density obtained from the cathode model. The total current density is the summation of the partial current densities of CO2RR and HER:
where I is the total current density which is calculated using Equation (4). Kinetic parameters for the Butler–Volmer equation given in Equation (4) are obtained from experimental data of Kuo et al. and Kai et al., as shown in Table 1 [58,59].
2.2. Transport of Species through the Membrane
The monopolar and the bipolar membranes are modelled assuming 1 M of fixed charge groups, which is equivalent to 1 meq·g. Our membrane model considers the membrane as a homogeneous mixture containing polymers with ion exchange groups and the electrolyte solution. The oppositely charged mobile ions are called “counter ions”, and the mobile ions with the same charge as the fixed ion exchange groups are called “co-ions”. These ionic species are transported across the membrane under the influence of the electric field. The mobility of the ionic species within the polymer differs from that of the aqueous solution due to the electrostatic forces and tortuosity of the polymer chains. To account for differences in the mobility, the diffusion coefficient of the counter ions is reduced by one order of magnitude, and the co-ions are reduced by two orders of magnitude as reported earlier in literature [33]. The following additional assumptions are made for the membrane model:
- 1.
- The ionic charges present in the membrane are larger than the charges present in the electrolyte.
- 2.
- The bulk of the electrolyte on either side of the membrane is well stirred; hence, the concentration of the mobile ions is constant at all times in the bulk electrolyte. There is an unstirred layer (Nernst layer) that is formed on both sides of the electrolyte–membrane interface (Figure 3). The thickness of the Nernst layer or diffusion layer is assumed to be same for the cathode and anode.
- 3.
- The concentration of the counter ions inside the membrane is equal to the concentration of fixed charge groups. The electroneutrality approximation is valid inside the membrane and also in the diffusion layer. The Donnan equilibrium is present at the solution–membrane interface.
- 4.
- At the junction of the bipolar membrane, the water dissociation reaction is catalyzed by an acid–base reaction of the weakly basic group present in the membrane. Donnan equilibrium is assumed to be present at the interface between CEM-AEM.
- 5.
- In the BPM, the current is carried only by water ions (H and OH). Therefore, the electrolyte salt ion transport from the interface is not included.
- 6.
- It is assumed that the membrane has a high permeability, and hence the transport of co-ions is negligible. The membrane is assumed to have a zero crossover for other molecules; hence, the transport of HCOOH/HCOO ion through the membrane is negligible. However, in practice, it is difficult to produce a membrane with exactly zero crossover.
To understand the transport of species through the membrane, the number of mobile ions that carries current needs to be defined. The electrolyte salt (KHCO) used as catholyte consists of K and HCO ions. The CO dissolution reactions produce HCO, HCO and CO ions. In Appendix A, it is shown that the concentration of HCO is very low and always in equilibrium with CO (aq). Therefore, we consider that HCO is not transported through the membrane. Similarly, CO reacts with H at the diffusion boundary layer (near the cathode side of the membrane) to form HCO. For this reason, we also assumed that CO is not transported through the membrane. The CO2RR produces HCOO, which is also present in the electrolyte along with H and OH ions produced due to water dissociation. Overall, we have five mobile ions: K, HCO, H, HCOO and OH that are present in the catholyte. At the other side of the membrane, i.e., in the anolyte, we have three mobile ions K, OH and H. Since we assumed that the membrane has a high permeability and zero crossover, no co-ions and HCOOH/HCOO ions are transported through the membrane. Therefore, for the BPM model, the transport of K and H ions (counter ions for the CEL layer) in the catholyte side and OH ions (counter ion for the AEL layer) at the anolyte side is considered. For the monopolar membrane, K is transported through CEM from the anolyte side to the catholyte side. For the AEM, HCO is transported from the catholyte side to the anolyte side.
The model for the monopolar membrane is extensively discussed in the literature [52,60,61,62,63,64]; however, the influence of the diffusion layer adjacent to the membrane is considered by only a limited number of studies. Fila and Bouzek et al. [61,62,64,65] explicitly investigated the influence of the concentration gradient in the diffusion layer on the ion transport through the membrane. A similar model was used to analyze the ion transport through the membrane in the CO electrolyzer. In this model, the thickness of the diffusion layer (DBL) is an important parameter that needs to be determined. The DBL thickness, in general, is calculated using the mass transfer coefficient as:
where k is the mass transfer coefficient, D is the effective diffusion coefficient and is the diffusion layer thickness. For a well stirred electrolyte, the thickness of the stagnant layer at the electrode and the membrane is the same. Therefore, we assumed that the diffusion layer thickness adjacent to the membrane is the same as for the cathode diffusion layer. The Nernst–Planck equation is used to describe the electro migration of ionic species through the membrane;
where i represents K for the CEM and HCO for the AEM, respectively. z is the charge number of the species, F is the Faraday’s constant, C is the concentration of the ionic species, D is the diffusion coefficient and is the electrolyte potential. The current carried by the ions through the membrane is calculated using
The potential gradient () in Equation (8) is obtained by substituting Equation (8) into Equation (9), and subsequent rearrangement leads to
in which k is the electrolyte conductivity. Charge neutrality is assumed in the electrolyte and also in the membrane bulk
where z and z are the charge number of the fixed charge group and the concentration of the counter ion, respectively. C, C are the concentration of the fixed charge group and the concentration of the counter ion inside the membrane bulk. These equations are also applicable for the BPM. However, in sharp contrast to the monopolar membrane, in the BPM, the current is carried by water ions generated from water dissociation reactions occurring at the interface of the CEM and AEM contact region:
In literature, there are two models to explain the nature of the interface or transition layer between the CEM-AEM. The abrupt junction model which is the analogy of p-n junction in semiconductors, assumes the existence of the depletion layer due to the presence of uncompensated fixed charge groups at the interface [45,66]. The neutral layer model assumes a neutral layer between CEM and AEM, where the contact surface of the CEM and AEM contains a thin layer of water molecules and the unbalanced fixed charge groups are balanced by an electrical double layer at the junction [42]. The thickness of this region depends on the resistance of the interface layer. Recently, Yan et al. [51] have used electrochemical impedance spectroscopy to measure the thickness of the interface layer in the BPM. It was found that the thickness of this layer equals 3 nm. The reported value is similar to the theoretical value predicted by Strathmann et al. [44]. To investigate the transport of the water ions through the BPM, a source term is added to the NP equation to account for the water dissociation reaction at the interface of the BPM. The source term defines the rate of water dissociation reaction that includes the catalytic effect and electric field effect enhanced water dissociation rate constant k. The rate of generation and recombination of H and OH ions is obtained from
In this equation, R is the generation and recombination rate of water ions produced at the interphase layer. The rate constant k is obtained by considering the base catalysed water dissociation reaction and the electric field effect according to the second Wien effect. The proton transfer reaction catalyzed by a neutral base in AEM can be written as
Similarly, the acid catalyzed proton transfer reaction in CEM is written as
where B is the weak base, BH the conjugate acid of the weak base, AH is a weak acid, and A is the conjugate base of the weak acid. k, k are the forward rate constants and k, k are the rate constants for the backward reaction. The ability of the fixed charge groups to undergo protonation and deprotonation reactions with water molecules depends on the pKb value of that group. If pKb (or pKa for the CEM) is low, the reaction rate for the protonation reaction k is higher, and all groups are in the protonated form. If the pKb is lower than 7, then k > k that means that the protonation step is faster than the deprotonation, and hence the deprotonation reaction is the rate determining step. When pK = 7, the protonation and deprotonation reactions occur at the same rate. By assuming that the reactions of Equations (16) and (17) are in equilibrium, we are able to calculate the rate constants k and k. For instance, the rate constant k can be calculated as follows:
By using the relation between K and pK, the pKb dependent rate constant is obtained:
Similarly, k can be calculated as
The electric field enhanced water dissociation constant was calculated using the Onsagar equation for the dissociation of weak electrolytes under the electric field [67]
According to this equation, the dissociation rate constant of weak electrolytes under the electric field can be computed from the parameter b given by
where E is the electric field, is the dielectric constant of the electrolyte, and T is the temperature. The value of the b is directly proportional to the electric field intensity. For the derivation of this parameter, it was considered that the molecule is dissociated into the respective ions through the ion-pair formation (molecule ⟺ ion-pair ⟺ ions). The recombination of ion-pair to molecule occurs at a faster rate, and the rate of this molecule formation is considered independent of the electric field. The dissociation reaction of ion-pair to individual ions occurs slowly. This interaction is depending on the electric field as it is influenced by the coulombic forces between the ions. The field effect and the electrostatic forces between the ions are combined with the equation for Brownian motion to describe the enhancement of dissociation constant under the electric field [67].
The concentrations of the ionic species in the catholyte and anolyte are used as initial and boundary conditions for the catholyte (left) and anolyte (right) sides of the membrane (Figure 3). For the concentration inside the membrane bulk, we can write
where C is the concentration of the counter ion inside the membrane. Q is the concentration of fixed charge groups. The concentration of the ions at the electrolyte/membrane interface is defined using Donnan equilibrium constants:
where C, C is the concentration of the ions in the catholyte bulk and inside the membrane bulk, respectively. and are the Donnan potentials at the catholyte–membrane and anolyte–membrane interface, respectively. The concentration of the ions at the solution side of the electrolyte/membrane interface is calculated using
where C is the concentration of counter ion at the solution side of the interface. K is the Donnan equilibrium constant that is obtained by rearranging Equations (27) and (28) as follows:
where M represents the concentration of the counter ion species i (K, HCO, H, OH) inside the membrane. For the monopolar membrane, i represents the K (CEM), HCO concentrations (AEM) and the bipolar membrane H for the CEM layer, and OH for the AEM layer. Q is the fixed charge group concentration, which is equivalent to ion exchange capacity of 1 meq/g (1 M). Similar to Equations (28) and (29), the concentration of the ions at the anolyte side of the interface can be calculated.
The model discussed above is also applicable to study the transport of salt ions through the CEM and AEM in bipolar membranes. There are two limiting current regions observed in the BPM. At low current density, the current is carried by salt ions present in the interface layer. When the applied voltage is high enough, all salt ions are removed from the interface and the resistance of the membrane increases. Further increase in the voltage results in the dissociation of water, and the current will be solely be carried by HO and OH. The rate constant k for the forward dissociation reaction determined the limit of the current that can be carried by the water ions.
2.3. Total Cell Voltage and Polarization Loss
The cell voltage of the electrolyzer consists of the following polarization losses:
where E represents the equilibrium potential of the respective cathode and anode reactions. E and E represent the cathode and anode over potentials. E is the contribution of the ohmic drop due to electrolyte and membrane components inside the cell. The contribution of concentration polarization is given by E. Concentration polarization occurs due to mass transport limitation of the active species to the electrode surface. The standard equilibrium potential for the electrochemical conversion of CO to formic acid is 1.03 V (corresponding to pH = 7 for the cathode and pH = 13 for the anode) [18]. In practice, higher voltages are required to perform the reaction. The contribution of the voltage losses to the cell voltage is modelled by combining the equilibrium potential (E), the overpotential of the cathode and anode reactions (E) and ohmic losses (E). The ohmic losses are calculated from electrolyte and the membrane conductivity. The voltage loss in the BPM is due to the combined resistance of the ion exchange membrane (CEM and AEM) and the interfacial layer. The main contribution for the voltage drop at the interfacial region is the voltage needed to split water to produce H and OH ions, which is equal to 0.8 V [68,69,70]. Furthermore, there is an additional resistance contribution due to the concentration loss at the electrolyte–membrane interface. If 1 M (pH = 1) of acid and 1 M alkaline (pH = 14) electrolyte is used as catholyte and anolyte, there will be zero voltage loss as there is no pH gradient at the interface. However, the pH range of the catholyte used for CO reduction is >7. Therefore, there will be an additional voltage loss due to the pH gradient at the electrolyte–membrane interface. For a change of one pH unit, there will be a potential loss of 59 mV [57,68]:
where , and are the Donnan potentials at the catholyte—CEL, CEL-AEL and AEL–anolyte interface, respectively. The Nernst-like equation can be expressed to calculate the Donnan potential for each interface and also across the membrane as follows:
The polarization curve simulated using Equation (30) is fitted to the experimental data. For the experimental data, a flow cell with a Sn cathode, Ir/IrO anode, and bipolar membrane (160 m thickness, purchased from Fumasep FBM-PK, Fumatech), was fabricated. At the cathode compartment, 0.5 M KHCO catholyte was used, and 0.5 M KOH anolyte was used at the anode compartment. The applied voltage was varied from 1 V to 4 V, and current was measured at each applied potential for 10 min. Before the experiments, KHCO electrolyte was purged with CO gas. More details of the experimental setup can be found in our previous work [35].
3. Results and Discussion
The concentration of CO at different KHCO concentration at different pressures is taken from Morrison et al. [34]. These authors calculated the CO concentration in a KHCO electrolyte assuming that HCO has a similar salt effect as that of chloride ions, as reported by Tang et al. [71]. To calculate the concentration of the species present in the bulk of the electrolyte at different CO pressures, the concentration dependent CO solubility is taken into account [34]. Since the composition of the species dissolved in the electrolytes are pH dependent, the distribution of the carbon species at different pH is modelled as shown in Figure 4. At a pH lower than 5, CO and H are the dominant species. The availability of protons at low pH reduces the polarization loss of the cell. This is beneficial for the conversion of CO to formic acid. However, a high H concentration promotes the H evolution reaction on the formic acid producing electrodes that will impact the Faradaic efficiency of HCOO/HCOOH formation. At pH > 5, the concentration of HCO is increasing and reaches the solubility limit around pH 9. Further increase in pH results in equilibrium shifting towards the CO formation. For pH > 12, CO is the dominant species present in the electrolyte. However, the information about the CO concentration at different pH is significant for CO2RR. We can observe that, at pH > 7, the CO concentration is decreasing and completely converted into HCO and CO at alkaline pH. Though only a small amount of CO is involved in the homogeneous reaction, we have a plenty of CO available for the CO2RR reaction. Figure 4a shows the charge balance calculated for 0.5 M KHCO at 5 bar CO pressure. It reveals important information about the pH of the electrolyte (dashed line in Figure 4a). It also shows the relation between CO concentration and the electrolyte pH. For instance, the CO concentration is 33 mM for the pH 7.6. This value corresponds to CO concentration in 0.5 M KHCO at atmospheric pressure. The effect of pressure on the pH of the KHCO electrolyte at different concentrations is another important parameter modelled here to calculate the distribution of the reactive species in the bulk, which is shown in Figure 4b. The results showed that, at high pressure, the electrolyte pH is dropped significantly and still acidic even at 1 M KHCO. At atmospheric pressure, the pH stays neutral to slightly basic for all the KHCO concentrations used here.
At the electrode surface, CO is reduced and converted to formic acid. At t = 0, the concentration of CO at the surface is equal to the bulk concentration. At t > 0, when an external voltage is applied, CO is consumed that leads to a concentration gradient near the electrode surface. At a certain voltage, all the CO molecules are reduced, and the concentration becomes negligible. At this point, the reaction is limited by the mass transport of CO to the electrode surface. One of the effects of high pressure is the enhanced CO mass transport. The CO concentration at atmospheric pressure is 33 mM while at 40 bar the concentration is close to 1 M. Since there is a 10-fold jump in CO concentration in 0.5 M KHCO solution, we could also expect a similar increment in limiting current density at high pressure. We can correlate this limiting current density with the diffusion layer thickness that defines the rate of mass transport resistance to the electrode surface. In general, diffusion layer thickness is calculated using experimentally observed limiting current density data or based on theoretical methods. Here, we used the diffusion layer thickness that was fitted to the experimentally observed limiting current density data of Todoroki et al. [32]. The kinetic parameters obtained from the fitting process used to simulate voltage dependent current density for CO2RR and HER using the Butler–Volmer equation as shown in Figure 5. The kinetic parameters used for the calculation are listed in Table 1 [32,34]. To show the effect of CO concentration polarization across the 50 M diffusion layer, the current density is simulated with and without mass transfer effects (Figure 5a). The limiting current density of 30 mA·cm is obtained for mass transport limited CO2RR in atmospheric pressure (33mM). The effect of CO partial pressure on the current density is shown in Figure 5b. We can clearly see that the CO limiting current density is increasing with increasing CO partial pressure. The predicted limiting current density is 200 mA·cm at 40 bar, which is nearly seven times higher compared to atmospheric CO pressure.
Mass Transport Limitations in Monopolar and Bipolar Membranes
In MEA configured CO electrolyzers, the role of ion selective membrane is crucial to determine the performance of CO2RR. Since CEM is permeable to positively charged ions, it transports not only H ions but also allows transport of K ions. However, the concentration of K is much higher in the catholyte than that of H ions. Thus, the dominant charge carrier for the CEM membrane is K ions. Figure 6 shows the concentration profile of K ions across the cation exchange membrane and the diffusion layer adjacent to the CEM/electrolyte interface. When the current is applied, the K ions transported from the anolyte compartment to the catholyte compartment where it becomes concentrated. The flux of K ions enters the membrane is equal to the flux of CO and HO consumed at the cathode surface. The concentration change of K ions across the anolyte/CEM interface and within CEM at 100 mA·cm is shown in Figure 6b. As expected, the concentration of K is depleted at the anolyte side of the membrane as a result of migration into the membrane. The concentration changes within either side of the membrane are also evident from Figure 6b, which indicates ion transport across the membrane. One of the implications of the constant pumping of K ions from anolyte to catholyte is that, after a certain period of time (depending on the concentration of KHCO), the depletion of K ion starts limiting the cell performance. This transport limitations of K ion leads to increased cell voltage and decreased Faradaic efficiency. After the complete transport of K ions, the current will be carried by H ion. This transition of H ions being the main charge carrier, after the K ions transport ceased, has important consequences for the total cell voltage. This behavior was experimentally observed by Vermaas et al. [72]. These authors showed a nearly 700 mV increase in the cell voltage due to the K depletion. The increased H concentration led to a change in 4 pH unit. Another effect of steady increases in the K concentration in the CEM is the decreased CO solubility due to salting-out effects at high catholyte concentration. It was observed in the previous studies that, at high salt concentration (>1 M, KHCO), the CO solubility was decreased due to the salting-out effect [34].
Similarly, for AEM, the transport of HCO ions from the catholyte to the anolyte is modelled. Though AEM is permeable to other anions like CO and OH, the concentration of these minority carriers is very low compared to the HCO ions and contributes little towards the total current density. Therefore, we limit our discussion to the transport of HCO only. The concentration changes within the diffusion layer and the bulk of the AEM are shown in Figure 6c,d for the 0.1 M KHCO/0.1 M KHCO system. When the HCO ions are transported, a concentration gradient is formed at the catholyte/AEM interface as shown in Figure 6c. The limiting current density is reached at 30 mA·cm for 0.1 M HCO catholyte, which is lower than the limiting current achieved for CEM. Since we have a limited amount of HCO ions for a given volume of catholyte, the continuous transport of HCO completely depletes the catholyte of HCO ion. At this point, the pH of the catholyte bulk starts to increase as a result of the increased OH concentration and reduced buffering capacity of the catholyte. This increased catholyte pH favors the HCO/CO formation through homogeneous reaction of dissolved CO. This pH effect can be clearly understood from Figure 4. At the anolyte side, concentrated HCO/CO ions react with H ions (formed during OER at the anode) to form CO. Therefore, under the limitation of HCO ion, the CO will be transported to an anolyte compartment through HCO/CO formation. This is explained in a sequence of reactions in Figure 7. In addition, formate ions would also be transported to an anolyte compartment, where it oxidizes at the anode to form CO. These complications in AEM assembled cells can be avoided by periodically replenishing the catholyte. In this way HCO is always available for transport and will not limit the CO2RR. Another important parameter extracted from the membrane model is the voltage drop across the membrane. Figure 8 shows the potential drop obtained for CEM and AEM. The potential drop across the AEM is higher than for the CEM; this means that the resistance of the AEM is higher than that of the CEM. The trend is expected since the concentration polarization is deeper for AEM compared to CEM (Figure 6). We can attribute this behaviour to the differences in diffusivity of HCO ions.
For the BPM, we consider that H and OH ions are the main charge carriers. However, at low current density (<10 mA·cm), the salt ions are the main charge carrier. Since the current density considered here is above the limiting current of salt ions, the total current is carried only by H and OH ions. Though it is possible to use several electrolyte combinations for BPM operation, only the pH 7–14 and pH 7–7 system is the most suitable and widely used combination for the CO2RR and OER reactions. The flux of water ions generated at the interfacial region depends on the water dissociation rate constant, which in turn depends on the pKb of the weak base and the electric field strength. Figure 9a shows the value of the dissociation rate constant calculated for different pK. At pK 7, the dissociation rate constants for the protonation and deprotonation of a weak base are equal. The electric field enhanced rate constant for the electric field intensity ranges from 1 × 10 V·m to 1 × 10 V·m, which is calculated based on a second Wien effect (Figure 9b). The enhancement of the rate constant value depends on the relative permittivity of the electrolyte, in this case water. To support the high current density, the value of the dielectric constant, , should be lower than 30. Therefore, both the catalytic and electric field effect is needed to calculate the effective water dissociation rate constant.
The concentration changes within the CEM and AEM layer, and the corresponding membrane/electrolyte interface for the pH 7–7 and pH 7–14 is shown in Figure 10a,b. Since the H ions and OH ions are migrated through the CEM and AEM layers, respectively, the pH gradient is formed in the DBL at either side of the BPM. For the current density of 50 mA·cm, there is a difference of 6 pH units between membrane and the catholyte bulk (Figure 10b), which corresponds to 350 mV loss (Equation (32)). At the same time, there is a small pH difference, approximately 0.2 pH unit at the anolyte side of the membrane. This small pH difference is due to high alkaline pH of the anolyte. If the 0.5 M KHCO with the pH value of 7 is used as the anolyte, there will be a loss of additional 350 mV as a result of a 6 pH unit difference on the anolyte side of the membrane as well. Therefore, it is evident that use of alkaline anolyte is beneficial for the low polarization losses across the BPM. The concentration changes that appeared on the right side of the CEM layer is attributed to the flux of the H ion that moved out of the membrane to support the required current density. Another important observation from Figure 10 is that the concentration polarization in AEM is higher compared to CEM. These differences in the concentration polarization are attributed to the lower mobility of hydroxide ions. Similar results were reported by Weber et. al [73].
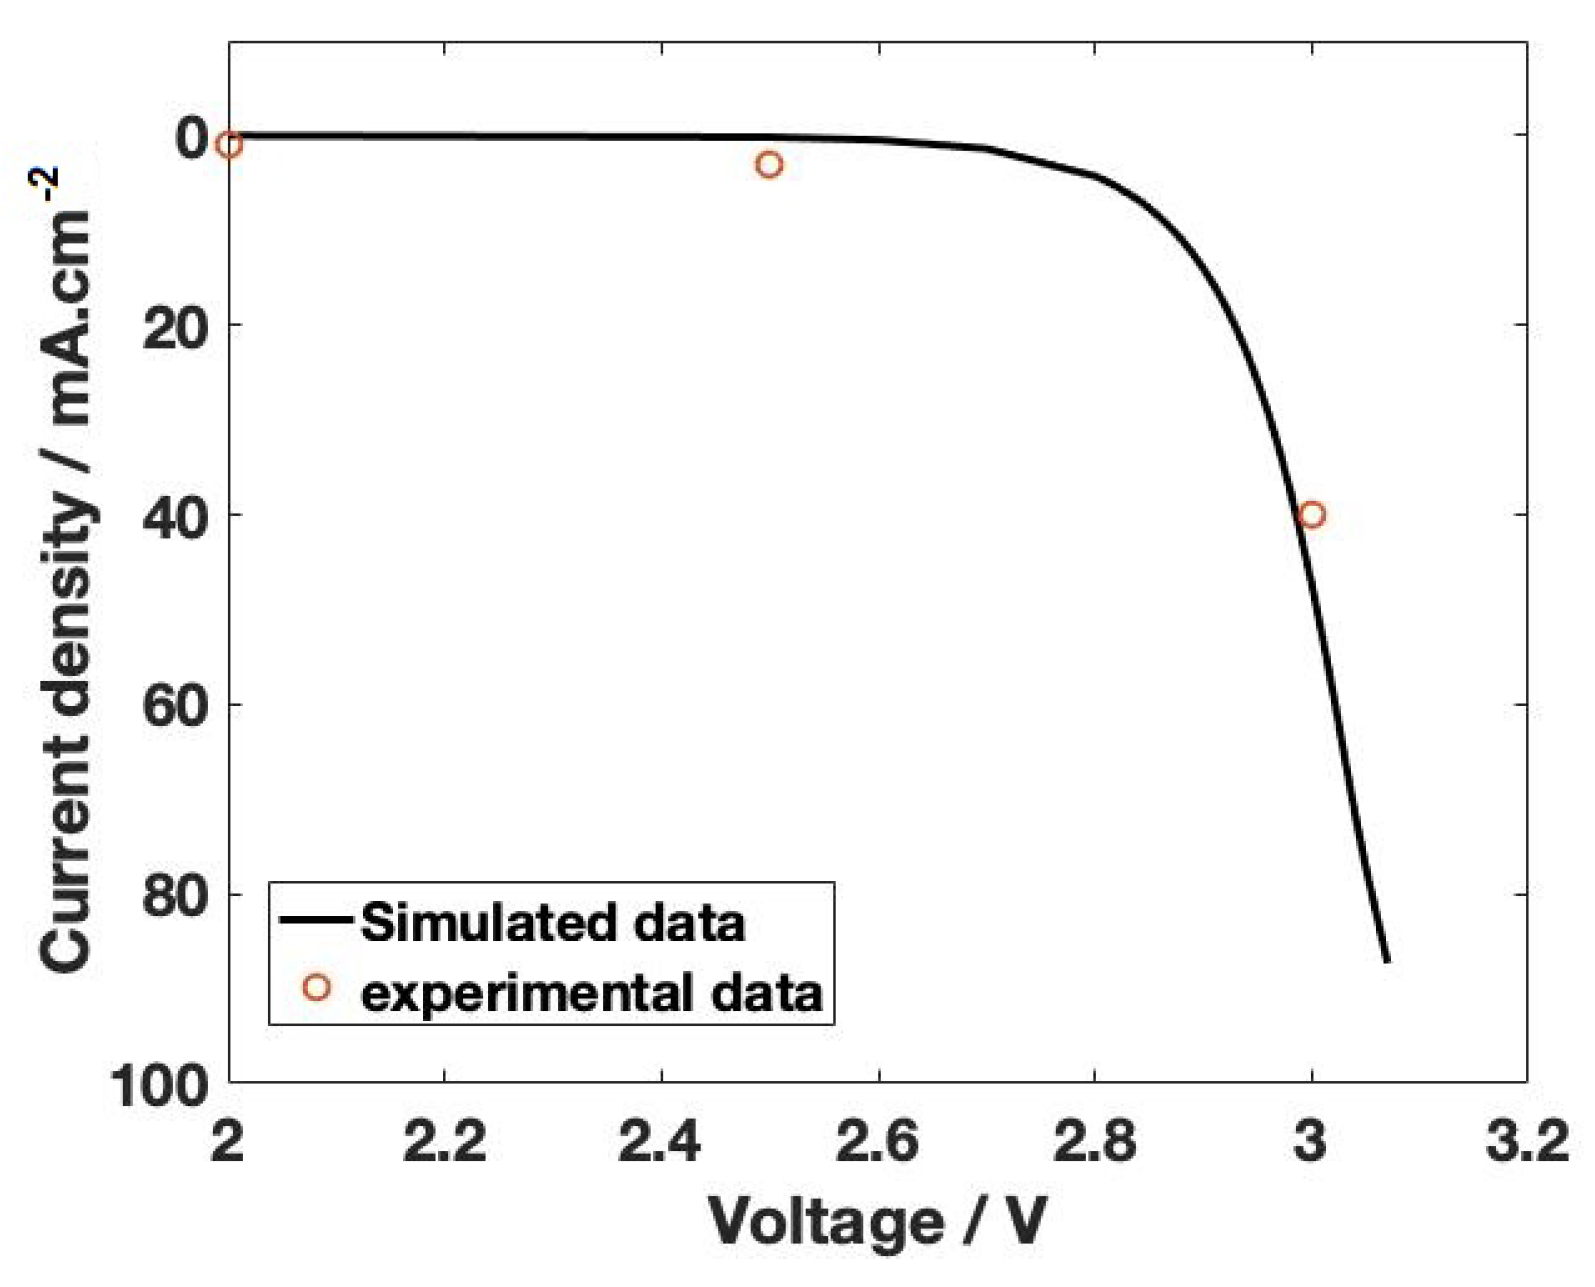
The polarization curve generated for the electrochemical reduction of CO is shown in Figure 11. The E value of approximately 2.5 V is obtained from the onset potential of the polarization curve shown in Figure 11. The onset potential is a combination of equilibrium potential (1.03 V), activation overpotential of cathode and anode, and also the membrane activation voltage (0.8 V) (Equation (30)). This is the minimum voltage required to start the reaction. The current density shown in Figure 11 is the total current density obtained from the Bulter–Volmer equation by combining the partial current density of formate/formic acid, CO and H formation. It can be clearly observed that the current density obtained from the model is in close agreement with the experimental value. To conclude, our investigation of mass transport limitations predicted crucial parameters needed for the scale-up process. Importantly, mass transport limitations at the electrode surface reveal that CO solubility limitations can be overcome by operating at high pressure. A nearly seven-fold increase in current density was observed at 40 bar compared with the atmospheric pressure. The monopolar membrane model predicted a minimum electrolyte concentration of 0.1 M to operate the electrolyzer without membrane transport limitations. However, BPM allows the operation of low electrolyte salt concentrations because, at a high current density, the contribution of salt ions is negligible. The water ions (H and OH) produced at the BPM interface will dominate the ion transport. Though BPM allows two different electrolytes with different pHs at the cathode and anode compartment, the value of the electrolyte pH is crucial. The BPM model showed that neutral or slightly acidic catholyte and alkaline anolyte are required to reduce the potential drop across the membrane. It results in lower cell voltage and enhanced Faradaic efficiency. With this versatile capability, the bipolar membrane will contribute tremendously to large-scale CO electrolyzer operations in the near future. However, higher activation potential to initiate the water dissociation reactions pushes up the operating voltage of the electrolyzer. Therefore, better catalysts need to be developed to lower the water activation potential and future research on the BPM will move towards this direction.
4. Conclusions
In this work, we developed a model to understand the transport limitations in the electrochemical conversion of CO to formic acid. In particular, the mass transport of CO to the electrode surface and ion transport through the membrane is modelled. The electrochemical reduction of CO at the cathode and the oxygen evolution reaction at the anode are described by a 1D diffusion–reaction model. In the bulk catholyte, dissolution of CO and the effect of pH at different electrolyte concentration are analysed. The effect of mass transport limitation on the partial current density of formate/formic acid formation are significant. The maximum attainable current density is increasing with CO pressure due to the high concentration of CO. The membrane model reveals important information about which type of electrolyte should be used, and it clarifies the role of pH on the polarization loss in CO electrolyzers. The model predicted that, for electrolyte concentration below 0.1 M, the system is limited by the transport of the ions through the membrane. The high electrolyte salt concentration will eliminate the influence of transport limitation through the membrane. Another finding of this work is that polarization loss across the bipolar membrane depends on the pH of the electrolyte and the polarization losses due to membrane, which increases with decreasing anolyte pH.
Author Contributions
Conceptualization, M.R. and T.J.H.V.; methodology, S.C., M.R. and T.J.H.V.; investigation, S.C., M.R. and T.J.H.V.; writing—original draft preparation, S.C.; writing—review and editing, S.C., M.R. and T.J.H.V.; supervision, M.R. and T.J.H.V. All authors have read and agreed to the published version of the manuscript.
Funding
This research was funded by the Dutch Ministry of Economic Affairs, under the scheme EZ-subsidies, Topsector Energy, executed by RVO (Rijksdienst voor Ondernemend Nederland). T.J.H.V. acknowledges NWO-CW (Chemical Sciences) for a VICI grant.
Institutional Review Board Statement
Not applicable.
Informed Consent Statement
Not applicable.
Data Availability Statement
Available from the authors upon reasonable request.
Conflicts of Interest
The authors declare no conflict of interest.
Appendix A
The cathode side of the cell contains three parts which include CO dissolution reaction in the bulk electrolyte, transport of the species to the electrode surface through the diffusion layer and electrochemical reactions at the electrode surface. When gaseous CO(g) is dissolved in water, it undergoes a series of chemical rfeactions and produces several reactive species. The dissolved CO(aq) reacts with water to form carbonic acid (HCO)
The carbonic acid is a diprotic acid which further undergoes two subsequent acid dissociation reactions and produces HCO and CO ions:
The concentration of HCO is very low compared with the concentration of CO. Therefore, it is assumed to be in equilibrium with HCO at all times and represented as CO:
The HCO ion further undergoes an acid dissociation reaction which produces carbonate ions with the following reaction:
In addition to the CO dissolution reaction, water dissociation also occurs in the electrolyte:
At higher pH (pH > 7), CO2(aq) directly reacts with OH and forms HCO:
The concentration of HCO anc CO can be calculated from
The mass balance and charge balance in the electrolyte are described as follows:
The distribution of reactive species at equilibrium in the bulk electrolyte can be calculated by substituting Equations (A8) and (A9) in the carbon and charge balance. The species present in the bulk electrolyte are also considered to be present in the diffusion layer. These species will react with hydroxide ions generated during the electrochemical reactions.
References
- Peters, G.; Andrew, R.; Boden, T.A.; Canadell, J.; Ciais, P.; Quéré, C.L.; Marland, G.; Raupach, M.; Wilson, C. The challenge to keep global warming below 2 °C. Nat. Clim. Chang. 2013, 3, 4–6. [Google Scholar] [CrossRef]
- Hassanpouryouzband, A.; Farahani, M.V.; Yang, J.; Tohidi, B.; Chuvilin, E.; Istomin, V.; Bukhanov, B. Solubility of Flue Gas or Carbon Dioxide-Nitrogen Gas Mixtures in Water and Aqueous Solutions of Salts: Experimental Measurement and Thermodynamic Modeling. Ind. Eng. Chem. Res. 2019, 58, 3377–3394. [Google Scholar] [CrossRef]
- Vasheghani Farahani, M.; Hassanpouryouzband, A.; Yang, J.; Tohidi, B. Insights into the climate-driven evolution of gas hydrate-bearing permafrost sediments: Implications for prediction of environmental impacts and security of energy in cold regions. RSC Adv. 2021, 11, 14334–14346. [Google Scholar] [CrossRef] [PubMed]
- Hassanpouryouzband, A.; Joonaki, E.; Edlmann, K.; Haszeldine, R.S. Correction to “Offshore Geological Storage of Hydrogen: Is This Our Best Option to Achieve Net-Zero?”. ACS Energy Lett. 2021, 6, 3342. [Google Scholar] [CrossRef]
- Weimer, T.; Schaber, K.; Specht, M.; Bandi, A. Methanol from atmospheric carbon dioxide: A liquid zero emission fuel for the future. Energy Convers. Manag. 1996, 37, 1351–1356. [Google Scholar] [CrossRef]
- Hashimoto, K.; Habazaki, H.; Yamasaki, M.; Meguro, S.; Sasaki, T.; Katagiri, H.; Matsui, T.; Fujimura, K.; Izumiya, K.; Kumagai, N.; et al. Advanced materials for global carbon dioxide recycling. Mater. Sci. Eng. A 2001, 304–306, 88–96. [Google Scholar] [CrossRef]
- Le, M.; Ren, M.; Zhang, Z.; Sprunger, P.T.; Kurtz, R.L.; Flake, J.C. Electrochemical Reduction of CO2 to CH3OH at Copper Oxide Surfaces. J. Electrochem. Soc. 2011, 158, E45. [Google Scholar] [CrossRef]
- Lu, Q.; Rosen, J.; Zhou, Y.; Hutchings, G.; Kimmel, Y.; Chen, J.; Jiao, F. A selective and efficient electrocatalyst for carbon dioxide reduction. Nat. Commun. 2014, 5, 3242. [Google Scholar] [CrossRef] [PubMed]
- Hori, Y.; Takahashi, I.; Koga, O.; Hoshi, N. Selective Formation of C2 Compounds from Electrochemical Reduction of CO2 at a Series of Copper Single Crystal Electrodes. J. Phys. Chem. B 2002, 106, 15–17. [Google Scholar] [CrossRef]
- Albo, J.; Alvarez-Guerra, M.; Castaño, P.; Irabien, A. Towards the electrochemical conversion of carbon dioxide into methanol. Green Chem. 2015, 17, 2304–2324. [Google Scholar] [CrossRef]
- Azuma, M. Electrochemical Reduction of Carbon Dioxide on Various Metal Electrodes in Low-Temperature Aqueous KHCO3 Media. J. Electrochem. Soc. 1990, 137, 1772. [Google Scholar] [CrossRef]
- Chen, Y.; Kanan, M.W. Tin Oxide Dependence of the CO2 Reduction Efficiency on Tin Electrodes and Enhanced Activity for Tin/Tin Oxide Thin-Film Catalysts. J. Am. Chem. Soc. 2012, 134, 1986–1989. [Google Scholar] [CrossRef] [PubMed]
- Lv, W.; Zhang, R.; Gao, P.; Gong, C.; Lei, L. Electrochemical reduction of carbon dioxide with lead cathode and zinc anode in dry acetonitrile solution. J. Solid State Electrochem. 2013, 17, 2789–2794. [Google Scholar] [CrossRef]
- Abbott, D. Keeping the Energy Debate Clean: How Do We Supply the World’s Energy Needs? Proc. IEEE 2010, 98, 42–66. [Google Scholar] [CrossRef]
- Whipple, D.T.; Kenis, P.J.A. Prospects of CO2 Utilization via Direct Heterogeneous Electrochemical Reduction. J. Phys. Chem. Lett. 2010, 1, 3451–3458. [Google Scholar] [CrossRef]
- Hori, Y.; Wakebe, H.H.I.; Tsukamoto, T.; Koga, O. Electrocatalytic process of CO selectivity in electrochemical reduction of CO2 at metal electrodes in aqueous media. Electrochim. Acta 1994, 39, 1833–1839. [Google Scholar] [CrossRef]
- Masel, R.I.; Liu, Z.; Yang, H.; Kaczur, J.J.; Carrillo, D.; Ren, S.; Salvatore, D.; Berlinguette, C.P. An industrial perspective on catalysts for low-temperature CO2 electrolysis. Nat. Nanotechnol. 2021, 16, 118–128. [Google Scholar] [CrossRef]
- Chaplin, R.P.; Wragg, A.A. Effects of process conditions and electrode material on reaction pathways for carbon dioxide electroreduction with particular reference to formate formation. J. Appl. Electrochem. 2003, 33, 1107–1123. [Google Scholar] [CrossRef]
- Oloman, C.; Li, H. Electrochemical processing of carbon dioxide. ChemSusChem 2008, 1, 385–391. [Google Scholar] [CrossRef]
- Hatsukade, T.; Kuhl, K.P.; Cave, E.R.; Abram, D.N.; Jaramillo, T.F. Insights into the electrocatalytic reduction of CO2 on metallic silver surfaces. Phys. Chem. Chem. Phys. 2014, 16, 13814–13819. [Google Scholar] [CrossRef]
- Gattrell, M.; Gupta, N.; Co, A. A review of the aqueous electrochemical reduction of CO2 to hydrocarbons at copper. J. Electroanal. Chem. 2006, 594, 1–19. [Google Scholar] [CrossRef]
- Gattrell, M.; Gupta, N.; Co, A. Electrochemical reduction of CO2 to hydrocarbons to store renewable electrical energy and upgrade biogas. Energy Convers. Manag. 2007, 48, 1255–1265. [Google Scholar] [CrossRef]
- Köleli, F.; Atilan, T.; Palamut, N.; Gizir, A.M.; Aydin, R.; Hamann, C.H. Electrochemical reduction of CO2 at Pb and Sn-electrodes in a fixed-bed reactor in aqueous K2CO3 and KHCO3 media. J. Appl. Electrochem. 2003, 33, 447–450. [Google Scholar] [CrossRef]
- Anzai, A.; Liu, M.H.; Ura, K.; Noguchi, T.G.; Yoshizawa, A.; Kato, K.; Sugiyama, T.; Yamauchi, M. Cu Modified TiO2 Catalyst for Electrochemical Reduction of Carbon Dioxide to Methane. Catalysts 2022, 12, 478. [Google Scholar] [CrossRef]
- Wu, B.; Chen, J.; Qian, L. Recent Advances in Heterogeneous Electroreduction of CO2 on Copper-Based Catalysts. Catalysts 2022, 12, 860. [Google Scholar] [CrossRef]
- Ramírez-Valencia, L.D.; Bailón-García, E.; Carrasco-Marín, F.; Pérez-Cadenas, A.F. From CO2 to Value-Added Products: A Review about Carbon-Based Materials for Electro-Chemical CO2 Conversion. Catalysts 2021, 11, 351. [Google Scholar] [CrossRef]
- Feaster, J.T.; Shi, C.; Cave, E.R.; Hatsukade, T.; Abram, D.N.; Kuhl, K.P.; Hahn, C.; Nørskov, J.K.; Jaramillo, T.F. Understanding Selectivity for the Electrochemical Reduction of Carbon Dioxide to Formic Acid and Carbon Monoxide on Metal Electrodes. ACS Catal. 2017, 7, 4822–4827. [Google Scholar] [CrossRef]
- Yoo, J.S.; Christensen, R.; Vegge, T.; Nørskov, J.K.; Studt, F. Theoretical Insight into the Trends that Guide the Electrochemical Reduction of Carbon Dioxide to Formic Acid. ChemSusChem 2016, 9, 358–363. [Google Scholar] [CrossRef]
- Sreekanth, N.; Phani, K.L. Selective reduction of CO2 to formate through bicarbonate reduction on metal electrodes: New insights gained from SG/TC mode of SECM. Chem. Commun. 2014, 50, 11143–11146. [Google Scholar] [CrossRef]
- Zhu, S.; Jiang, B.; Cai, W.B.; Shao, M. Direct Observation on Reaction Intermediates and the Role of Bicarbonate Anions in CO2 Electrochemical Reduction Reaction on Cu Surfaces. J. Am. Chem. Soc. 2017, 139, 15664–15667. [Google Scholar] [CrossRef]
- Bonet Navarro, A.; Nogalska, A.; Garcia-Valls, R. Direct Electrochemical Reduction of Bicarbonate to Formate Using Tin Catalyst. Electrochem 2021, 2, 64–70. [Google Scholar] [CrossRef]
- Todoroki, M.; Hara, K.; Kudo, A.; Sakata, T. Electrochemical reduction of high pressure CO2 at Pb, Hg and In electrodes in an aqueous KHCO3 solution. J. Electroanal. Chem. 1995, 394, 199–203. [Google Scholar] [CrossRef]
- Singh, M.R.; Goodpaster, J.D.; Weber, A.Z.; Head-Gordon, M.; Bell, A.T. Mechanistic insights into electrochemical reduction of CO2 over Ag using density functional theory and transport models. Proc. Natl. Acad. Sci. USA 2017, 114, E8812–E8821. [Google Scholar] [CrossRef]
- Morrison, A.R.T.; van Beusekom, V.; Ramdin, M.; van den Broeke, L.J.P.; Vlugt, T.J.H.; de Jong, W. Modeling the Electrochemical Conversion of Carbon Dioxide to Formic Acid or Formate at Elevated Pressures. J. Electrochem. Soc. 2019, 166, E77–E86. [Google Scholar] [CrossRef]
- Ramdin, M.; Morrison, A.R.; De Groen, M.; Van Haperen, R.; De Kler, R.; Van Den Broeke, L.J.; Martin Trusler, J.P.; De Jong, W.; Vlugt, T.J.H. High Pressure Electrochemical Reduction of CO2 to Formic Acid/Formate: A Comparison between Bipolar Membranes and Cation Exchange Membranes. Ind. Eng. Chem. Res. 2019, 58, 1834–1847. [Google Scholar] [CrossRef]
- Irtem, E.; Andreu, T.; Parra, A.; Hernández-Alonso, M.D.; García-Rodríguez, S.; Riesco-García, J.M.; Penelas-Pérez, G.; Morante, J.R. Low-energy formate production from CO2 electroreduction using electrodeposited tin on GDE. J. Mater. Chem. A 2016, 4, 13582–13588. [Google Scholar] [CrossRef]
- Yang, H.; Kaczur, J.J.; Sajjad, S.D.; Masel, R.I. Electrochemical conversion of CO2 to formic acid utilizing Sustainion™ membranes. J. Co2 Util. 2017, 20, 208–217. [Google Scholar] [CrossRef]
- Zeng, J.S.; Corbin, N.; Williams, K.; Manthiram, K. Kinetic Analysis on the Role of Bicarbonate in Carbon Dioxide Electroreduction at Immobilized Cobalt Phthalocyanine. ACS Catal. 2020, 10, 4326–4336. [Google Scholar] [CrossRef]
- Dunwell, M.; Yang, X.; Setzler, B.P.; Anibal, J.; Yan, Y.; Xu, B. Examination of Near-Electrode Concentration Gradients and Kinetic Impacts on the Electrochemical Reduction of CO2 using Surface-Enhanced Infrared Spectroscopy. ACS Catal. 2018, 8, 3999–4008. [Google Scholar] [CrossRef]
- Ooka, H.; Figueiredo, M.C.; Koper, M.T.M. Competition between Hydrogen Evolution and Carbon Dioxide Reduction on Copper Electrodes in Mildly Acidic Media. Langmuir 2017, 33, 9307–9313. [Google Scholar] [CrossRef] [Green Version]
- Goyal, A.; Marcandalli, G.; Mints, V.A.; Koper, M.T.M. Competition between CO2 Reduction and Hydrogen Evolution on a Gold Electrode under Well-Defined Mass Transport Conditions. J. Am. Chem. Soc. 2020, 142, 4154–4161. [Google Scholar] [CrossRef]
- Simons, R.; Khanarian, G. Water dissociation in bipolar membranes: Experiments and theory. J. Membr. Biol. 1978, 38, 11–30. [Google Scholar] [CrossRef]
- Wilhelm, F.G.; Van Der Vegt, N.F.; Strathmann, H.; Wessling, M. Comparison of bipolar membranes by means of chronopotentiometry. J. Membr. Sci. 2002, 199, 177–190. [Google Scholar] [CrossRef]
- Strathmann, H.; Krol, J.J.; Rapp, H.J.; Eigenberger, G. Limiting current density and water dissociation in bipolar membranes. J. Membr. Sci. 1997, 125, 123–142. [Google Scholar] [CrossRef]
- Ramírez, P.; Rapp, H.J.; Mafé, S.; Bauer, B. Bipolar membranes under forward and reverse bias conditions. Theory vs. experiment. J. Electroanal. Chem. 1994, 375, 101–108. [Google Scholar] [CrossRef]
- Mareev, S.A.; Evdochenko, E.; Wessling, M.; Kozaderova, O.A.; Niftaliev, S.I.; Pismenskaya, N.D.; Nikonenko, V.V. A comprehensive mathematical model of water splitting in bipolar membranes: Impact of the spatial distribution of fixed charges and catalyst at bipolar junction. J. Membr. Sci. 2020, 603, 118010. [Google Scholar] [CrossRef]
- Mafé, S.; Ramírez, P.; Alcaraz, A. Electric field-assisted proton transfer and water dissociation at the junction of a fixed-charge bipolar membrane. Chem. Phys. Lett. 1998, 294, 406–412. [Google Scholar] [CrossRef]
- Pärnamäe, R.; Mareev, S.; Nikonenko, V.; Melnikov, S.; Sheldeshov, N.; Zabolotskii, V.; Hamelers, H.V.M.; Tedesco, M. Bipolar membranes: A review on principles, latest developments, and applications. J. Membr. Sci. 2021, 617, 118538. [Google Scholar] [CrossRef]
- Simons, R. Water splitting in ion exchange membranes. Electrochim. Acta 1985, 30, 275–282. [Google Scholar] [CrossRef]
- Simons, R. Preparation of a high performance bipolar membrane. J. Membr. Sci. 1993, 78, 13–23. [Google Scholar] [CrossRef]
- Yan, Z.; Zhu, L.; Li, Y.C.; Wycisk, R.J.; Pintauro, P.N.; Hickner, M.A.; Mallouk, T.E. The balance of electric field and interfacial catalysis in promoting water dissociation in bipolar membranes. Energy Environ. Sci. 2018, 11, 2235–2245. [Google Scholar] [CrossRef]
- Volgin, V.M.; Davydov, A.D. Ionic transport through ion-exchange and bipolar membranes. J. Membr. Sci. 2005, 259, 110–121. [Google Scholar] [CrossRef]
- Delacourt, C.; Ridgway, P.L.; Newman, J. Mathematical Modeling of CO2 Reduction to CO in Aqueous Electrolytes. J. Electrochem. Soc. 2010, 157, B1902. [Google Scholar] [CrossRef]
- Gupta, N.; Gattrell, M.; MacDougall, B. Calculation for the cathode surface concentrations in the electrochemical reduction of CO2 in KHCO3 solutions. J. Appl. Electrochem. 2006, 36, 161–172. [Google Scholar] [CrossRef]
- Proietto, F.; Galia, A.; Scialdone, O. Electrochemical Conversion of CO2 to HCOOH at Tin Cathode: Development of a Theoretical Model and Comparison with Experimental Results. ChemElectroChem 2019, 6, 162–172. [Google Scholar] [CrossRef]
- Kopljar, D.; Inan, A.; Vindayer, P.; Wagner, N.; Klemm, E. Electrochemical reduction of CO2 to formate at high current density using gas diffusion electrodes. J. Appl. Electrochem. 2014, 44, 1107–1116. [Google Scholar] [CrossRef]
- Allen, J.B.; Larry, R.F. Electrochemical Methods Fundamentals and Applications, 2nd ed.; John Wiley & Sons: New York, NY, USA, 2001. [Google Scholar]
- Exner, K.; Over, H. Beyond the Rate-Determining Step in the Oxygen Evolution Reaction over a Single-Crystalline IrO2(110) Model Electrode: Kinetic Scaling Relations. ACS Catal. 2019, 9, 6755–6765. [Google Scholar] [CrossRef]
- Kuo, D.Y.; Kawasaki, J.K.; Nelson, J.N.; Kloppenburg, J.; Hautier, G.; Shen, K.M.; Schlom, D.G.; Suntivich, J. Influence of Surface Adsorption on the Oxygen Evolution Reaction on IrO2(110). J. Am. Chem. Soc. 2017, 139, 3473–3479. [Google Scholar] [CrossRef]
- Verbrugge, M.W. Ion and Solvent Transport in Ion-Exchange Membranes. J. Electrochem. Soc. 1990, 137, 893. [Google Scholar] [CrossRef]
- Fíla, V.; Bouzek, K. A mathematical model of multiple ion transport across an ion-selective membrane under current load conditions. J. Appl. Electrochem. 2003, 33, 675–684. [Google Scholar] [CrossRef]
- Fíla, V.; Bouzek, K. The effect of convection in the external diffusion layer on the results of a mathematical model of multiple ion transport across an ion-selective membrane. J. Appl. Electrochem. 2008, 38, 1241–1252. [Google Scholar] [CrossRef]
- Moshtarikhah, S.; Oppers, N.A.; de Groot, M.T.; Keurentjes, J.T.; Schouten, J.C.; van der Schaaf, J. Nernst–Planck modeling of multicomponent ion transport in a Nafion membrane at high current density. J. Appl. Electrochem. 2017, 47, 51–62. [Google Scholar] [CrossRef]
- Geraldes, V.; Afonso, M.D. Limiting current density in the electrodialysis of multi-ionic solutions. J. Membr. Sci. 2010, 360, 499–508. [Google Scholar] [CrossRef]
- Sistat, P.; Pourcelly, G. Chronopotentiometric response of an ion-exchange membrane in the underlimiting current-range. Transport phenomena within the diffusion layers. J. Membr. Sci. 1997, 123, 121–131. [Google Scholar] [CrossRef]
- Sokirko, A.V.; Ramírez, P.; Manzanares, J.A.; Mafés, S. Modeling of Forward and Reverse Bias Conditions in Bipolar Membranes. Berichte Bunsenges. Phys. Chem. 1993, 97, 1040–1048. [Google Scholar] [CrossRef]
- Onsager, L. Deviations from Ohm’s Law in Weak Electrolytes. J. Chem. Phys. 1934, 2, 599–615. [Google Scholar] [CrossRef]
- Vermaas, D.A.; Wiegman, S.; Nagaki, T.; Smith, W.A. Ion transport mechanisms in bipolar membranes for (photo)electrochemical water splitting. Sustain. Energy Fuels 2018, 2, 2006–2015. [Google Scholar] [CrossRef]
- McDonald, M.B.; Ardo, S.; Lewis, N.S.; Freund, M.S. Use of bipolar membranes for maintaining steady-state pH gradients in membrane-supported, solar-driven water splitting. ChemSusChem 2014, 7, 3021–3027. [Google Scholar] [CrossRef]
- Grew, K.N.; McClure, J.P.; Chu, D.; Kohl, P.A.; Ahlfield, J.M. Understanding Transport at the Acid-Alkaline Interface of Bipolar Membranes. J. Electrochem. Soc. 2016, 163, F1572–F1587. [Google Scholar] [CrossRef]
- Tang, Y.; Bian, X.; Du, Z.; Wang, C. Measurement and prediction model of carbon dioxide solubility in aqueous solutions containing bicarbonate anion. Fluid Phase Equilibria 2015, 386, 56–64. [Google Scholar] [CrossRef]
- Vermaas, D.A.; Sassenburg, M.; Smith, W.A. Photo-assisted water splitting with bipolar membrane induced pH gradients for practical solar fuel devices. J. Mater. Chem. A 2015, 3, 19556–19562. [Google Scholar] [CrossRef]
- Bui, J.C.; Digdaya, I.; Xiang, C.; Bell, A.T.; Weber, A.Z. Correction to “Understanding Multi-Ion Transport Mechanisms in Bipolar Membranes”. ACS Appl. Mater. Interfaces 2021, 13, 24342–24343. [Google Scholar] [CrossRef] [PubMed]
Figure 1.
Schematic representation of the simulated electrochemical cell. The boxes in the figure do not represent the actual dimensions. The figure consists of a cathode, anode and the bipolar membrane regions. To explain the water dissociation reactions at the interphase, the box containing the membrane region is shown larger than the other regions. The dotted line indicates the Donnan equilibrium at the membrane–electrolyte interphase. The following abbreviations are used in the figure: DBL is the diffusion layer, CEL is cation exchange layer, AEL is anion exchange layer, is the diffusion layer thickness, and represent the diffusion layer at the cathode and anode, respectively. and represent the diffusion boundary layer at the cathode and anode side membranes, respectively.

Figure 2.
Schematic representation of the cathode diffusion–reaction model. It consists of a bulk electrolyte, diffusion layer and electrode surface. The diffusion layer contains two boundaries, one at the bulk of the electrolyte, and another one at the electrode surface. The dotted line indicates the concentration profile of the species inside the Nernst diffusion layer. The diffusion of ions in and out of the diffusion layer is represented by arrows. The solvation shell is omitted. OHP denotes the outer Helmholtz plane.
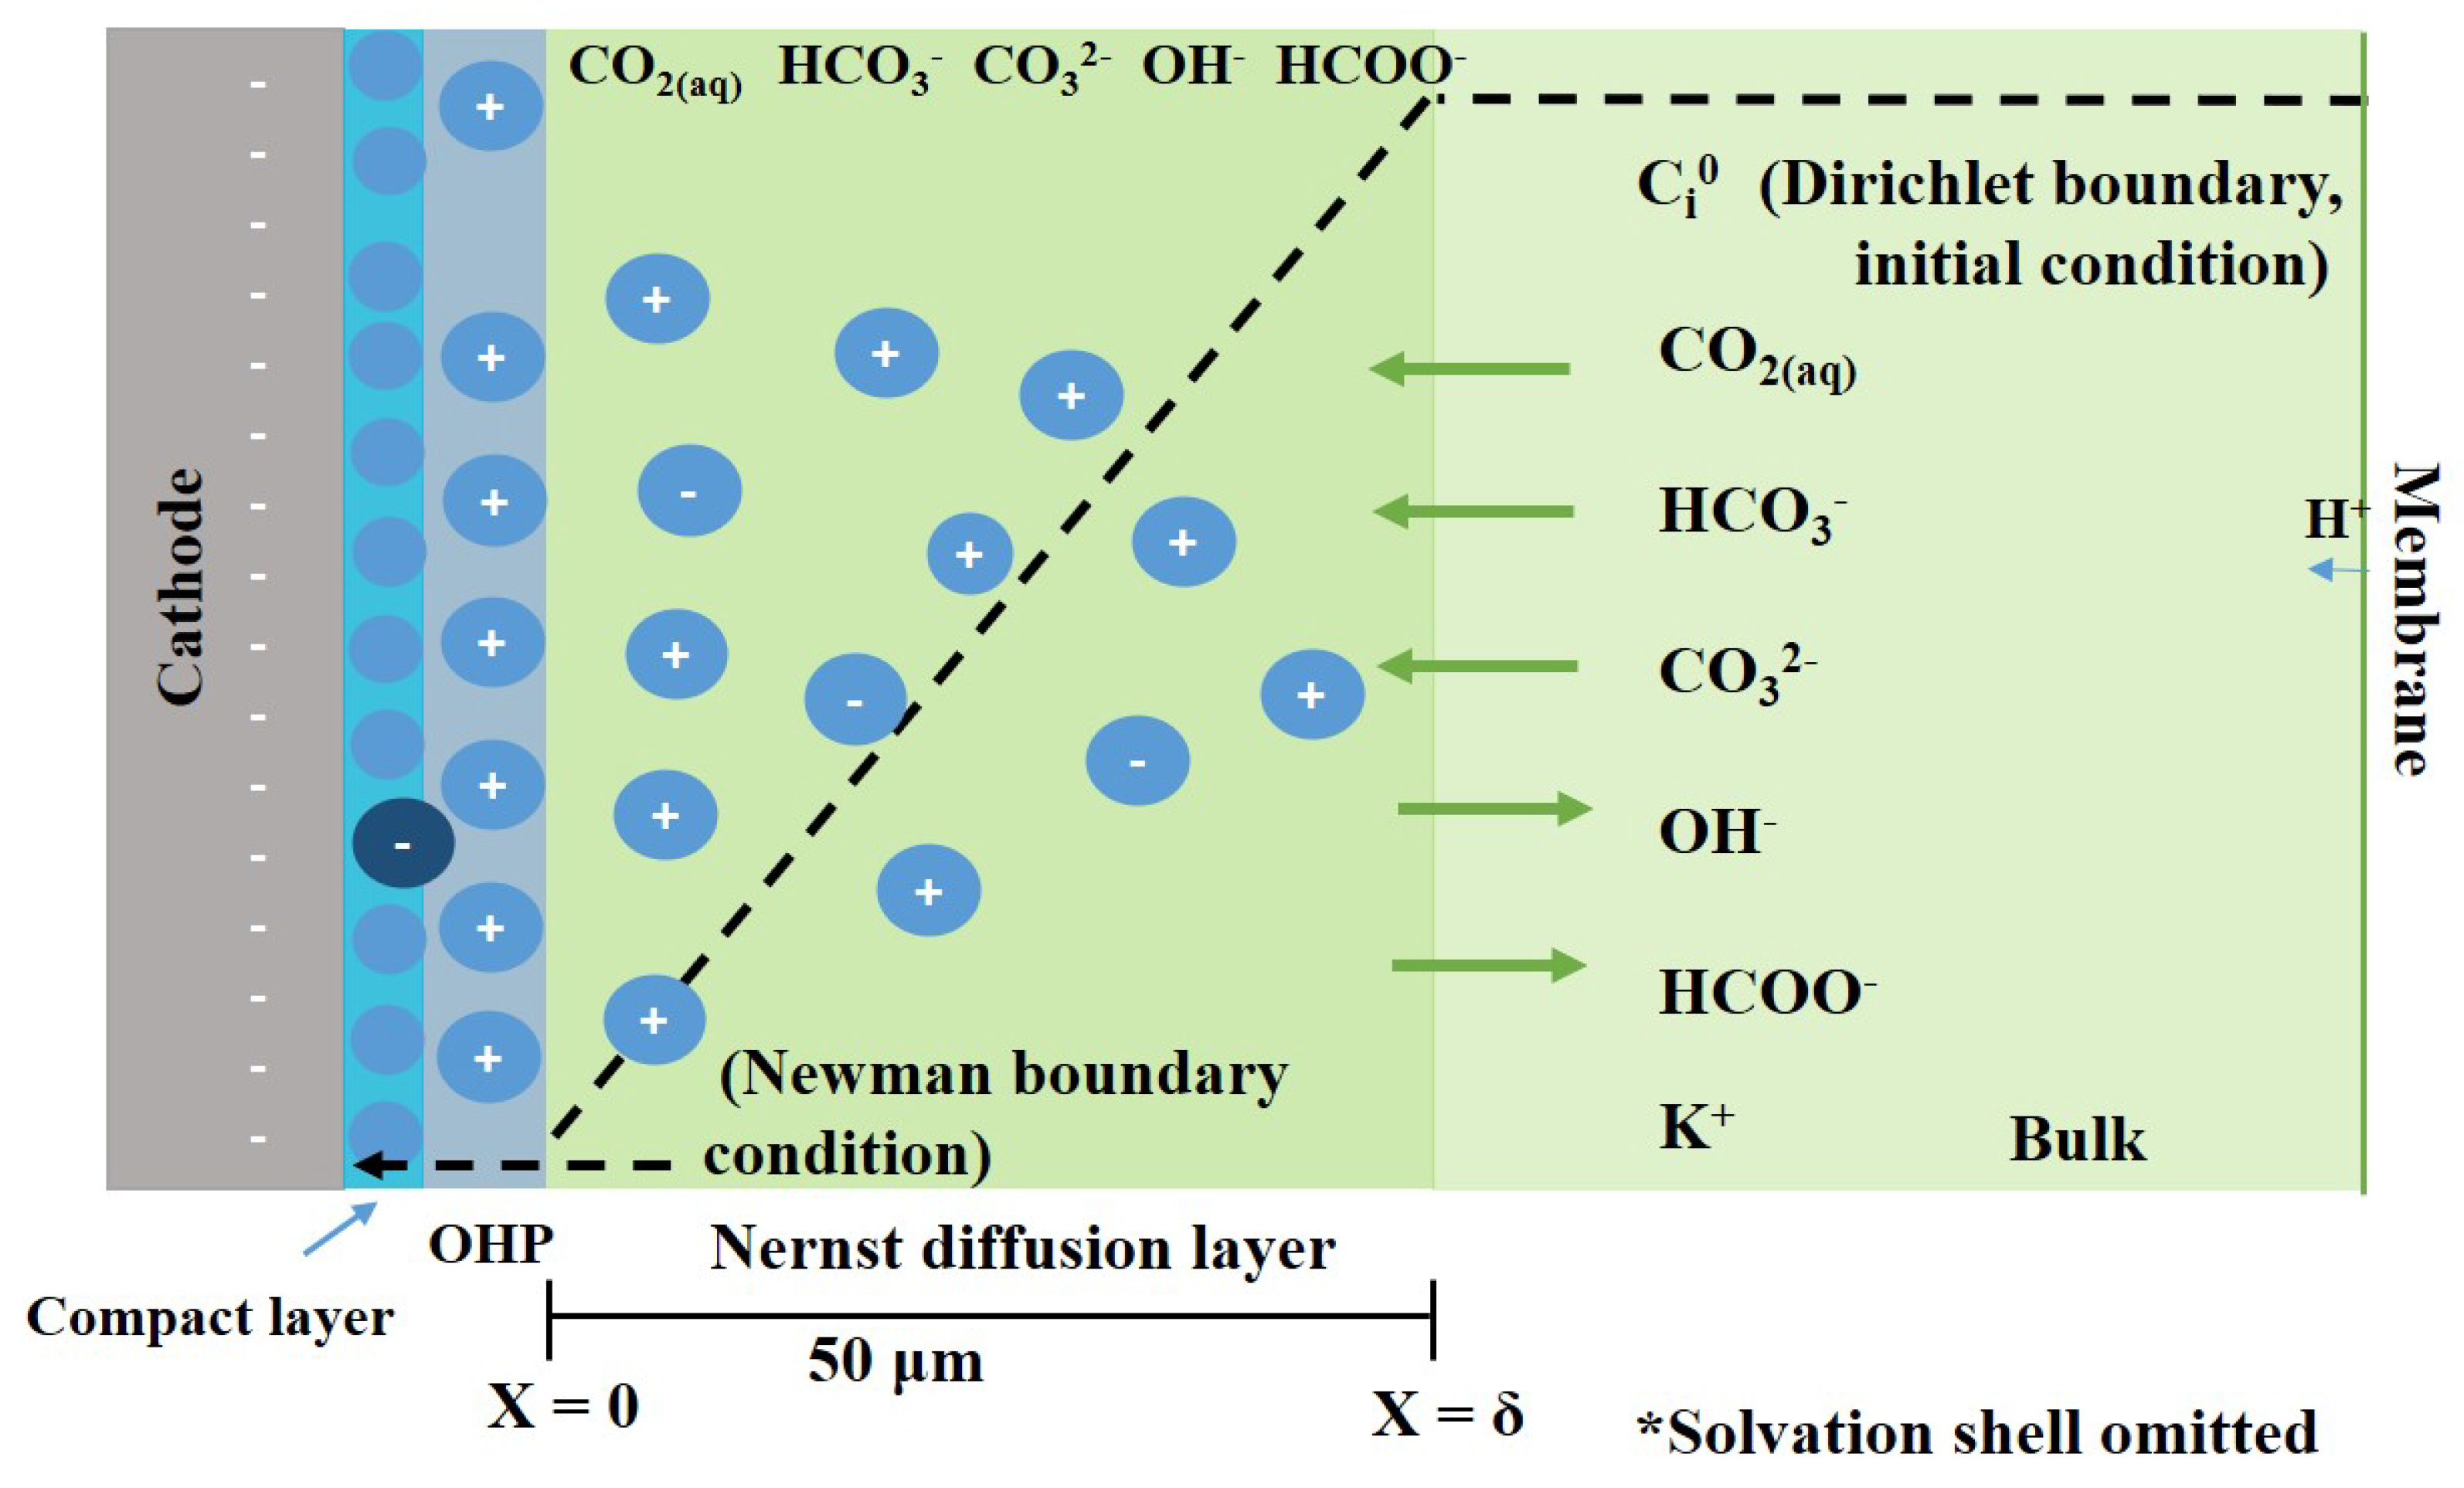
Figure 3.
Ion transport through a BPM in reverse bias mode. C, C, are the initial concentration of mobile ionic species in the catholyte and anolyte, respectively. C is the concentration of fixed charge groups on the membrane. C, C, are the concentrations of H and OH ions in respective CEL and AEL. , is a Donnan potential at the interface between catholyte–membrane and membrane–anolyte, respectively. X, X represent the electrolyte–membrane interface near catholyte and anolyte bulk. The black bold line represents concentration in the diffusion layer and inside the membrane at t = 0, and dotted lines indicate the concentration changes in the diffusion layer and inside the membrane at t > 0.

Figure 4.
(a) The distribution of carbon species in 0.5 M KHCO electrolyte at fixed CO concentration and pH values, at 1 bar. The dashed line indicates the pH value at which the CO dissolution reaction reaches equilibrium at 1 bar. This pH value changes with respect to CO pressure and electrolyte salt concentration, (b). The effect of electrolyte concentration on the pH of bulk electrolyte at CO pressures of 1, 5 and 40 bar, respectively. Details of these calculations can be found in Appendix A.
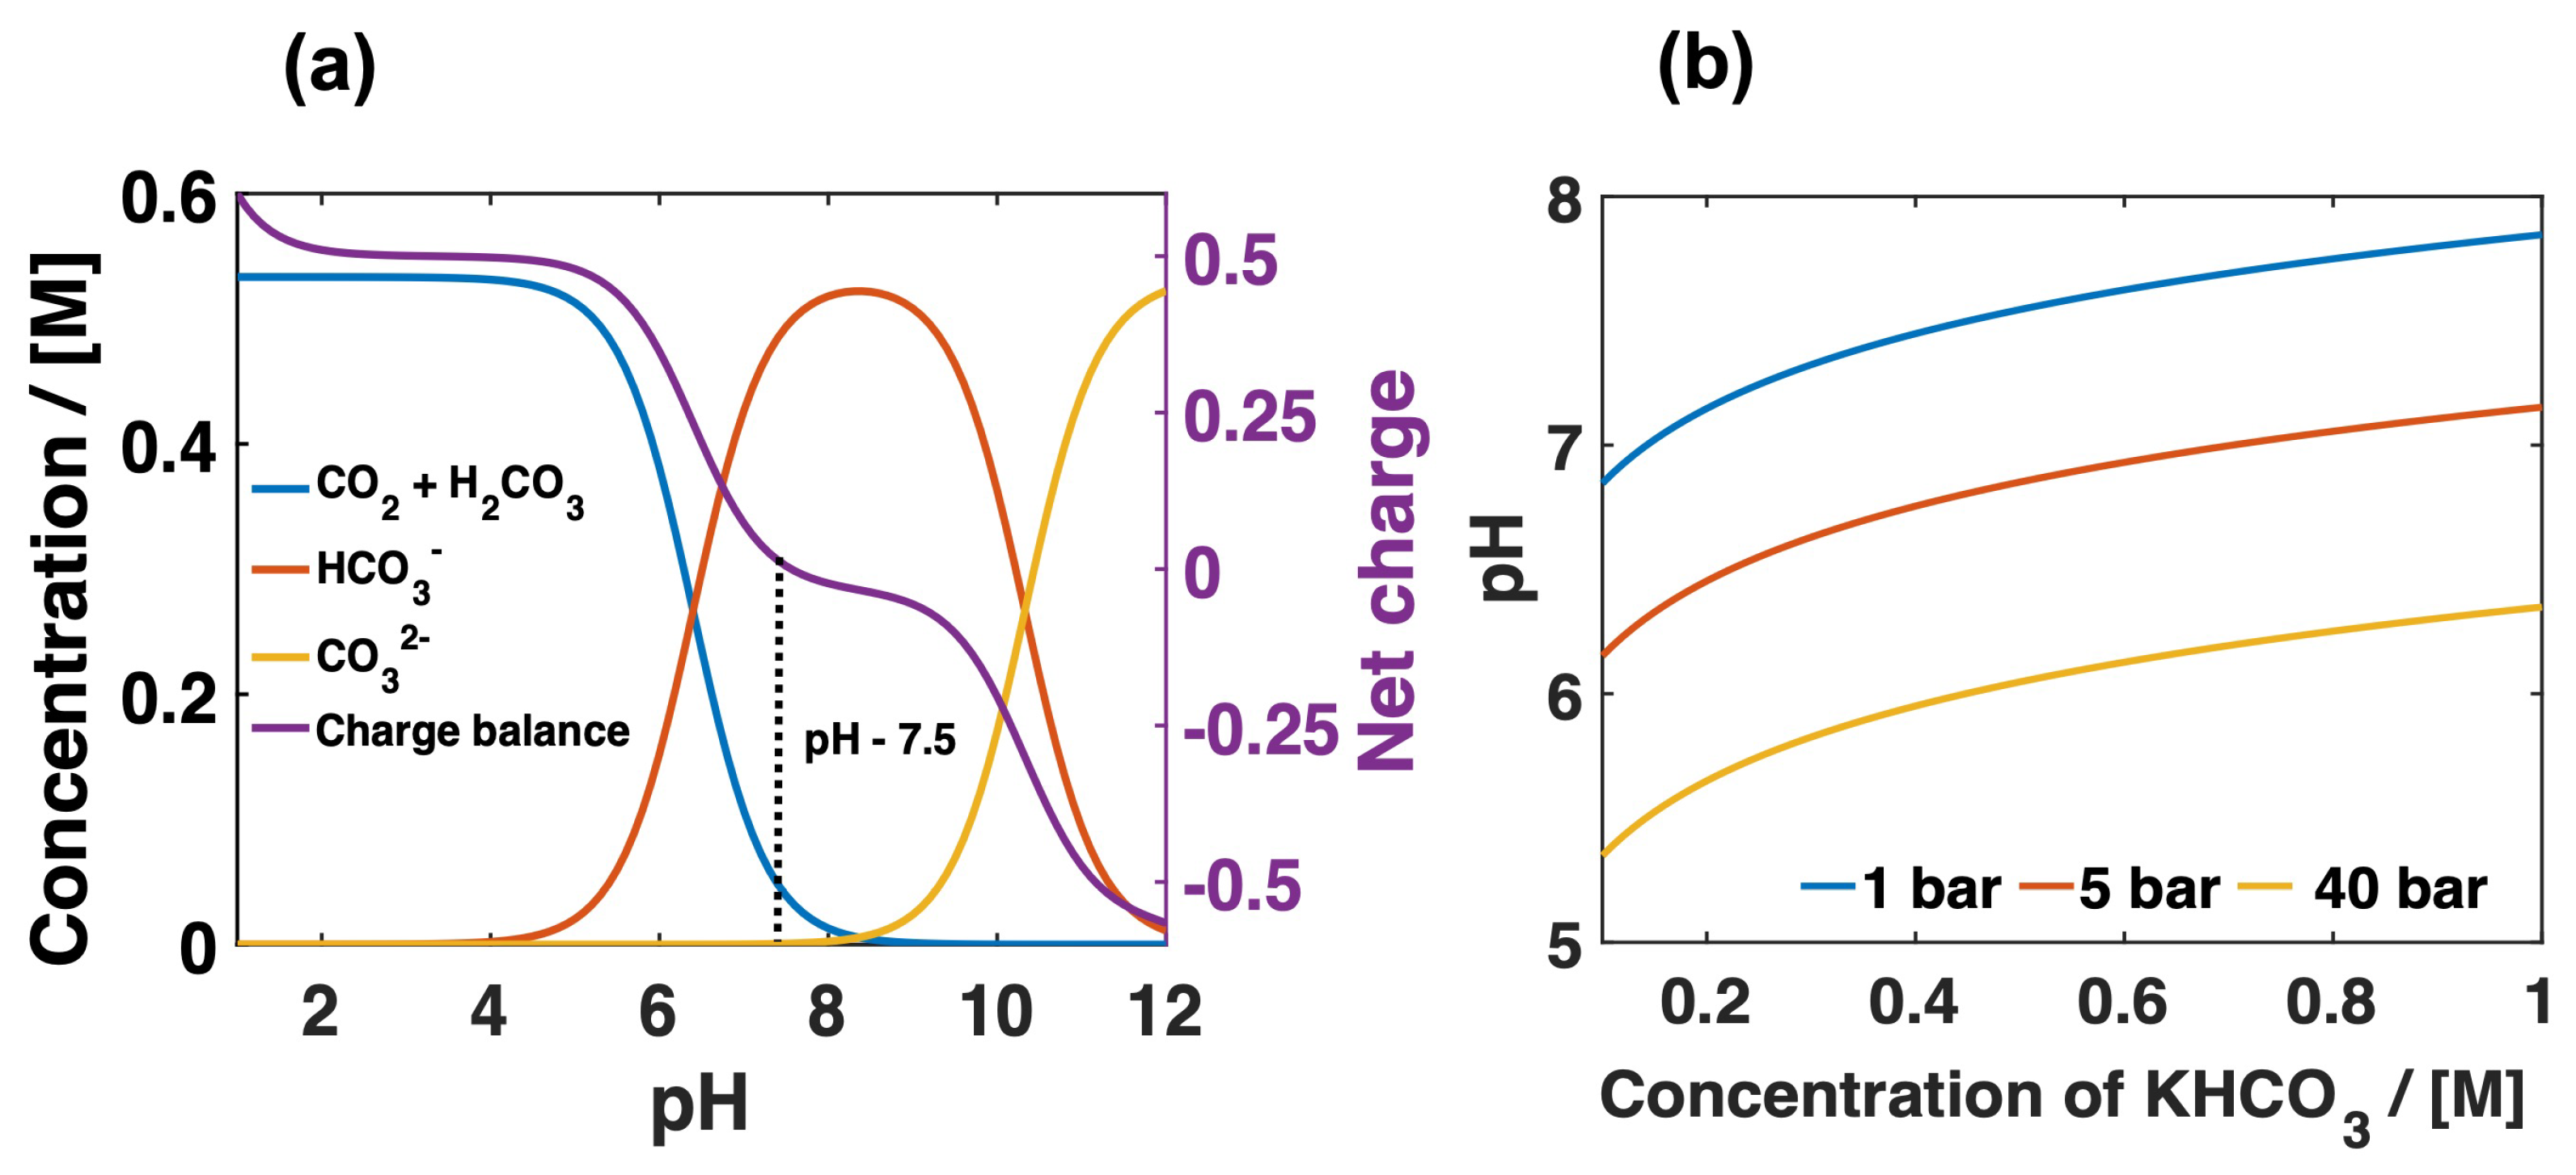
Figure 5.
(a) The potential dependent partial current density of formate/formic acid and CO formation with and without applying CO mass transport resistance. The current density without mass transfer resistance is calculated assuming that the CO concentration at the electrode surface is equal to bulk at all voltage. For the mass transfer affected current density, the surface concentration is updated for every applied potential; (b) effect of CO pressure on maximum achievable current density for formate/formic acid and CO at 5 and 40 bar, respectively.

Figure 6.
The transport of the ionic species through the diffusion layer (depleted side) and the bulk of the membrane at t = 0 (black line) and t > 0 (blue line). (a) the steady state concentration of K at the depleted side of the CEM (blue line) and (b) inside the bulk of CEM (blue line); (c) the steady state concentration of HCO at the depleted side of the AEM (blue line) and the concentration change of HCO inside the bulk of AEM ((d), blue line). The equal concentration of 0.5 M KHCO is assumed for catholyte and anolyte, respectively. The thickness of the bulk membrane is 160 m, and the diffusion layer thickness on either side of the membrane is 50 m.

Figure 7.
AEM ion transport mechanism; Transport of CO (aq) from catholyte to anolyte in alkaline pH.
Figure 7.
AEM ion transport mechanism; Transport of CO (aq) from catholyte to anolyte in alkaline pH.
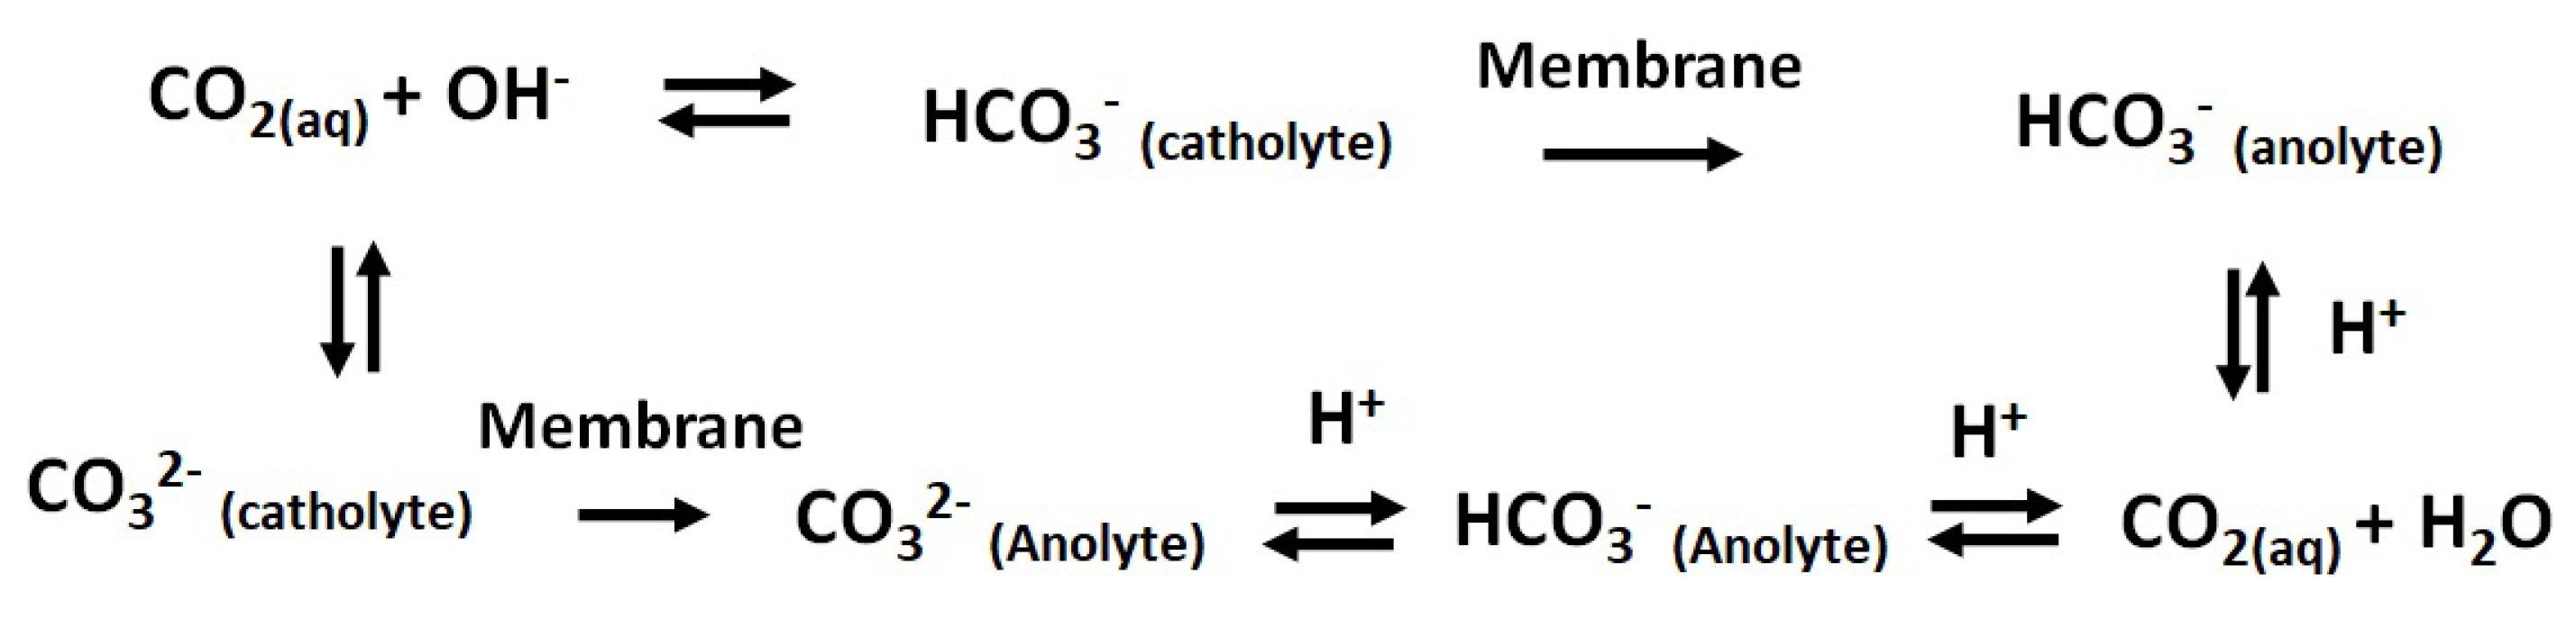
Figure 8.
The potential drop across the CEM and AEM, respectively, at the current density up to 100 mA·cm. The potential ( = 0) on the anolyte side of the membrane for CEM and catholyte side of the membrane for AEM is fixed to zero.
Figure 8.
The potential drop across the CEM and AEM, respectively, at the current density up to 100 mA·cm. The potential ( = 0) on the anolyte side of the membrane for CEM and catholyte side of the membrane for AEM is fixed to zero.
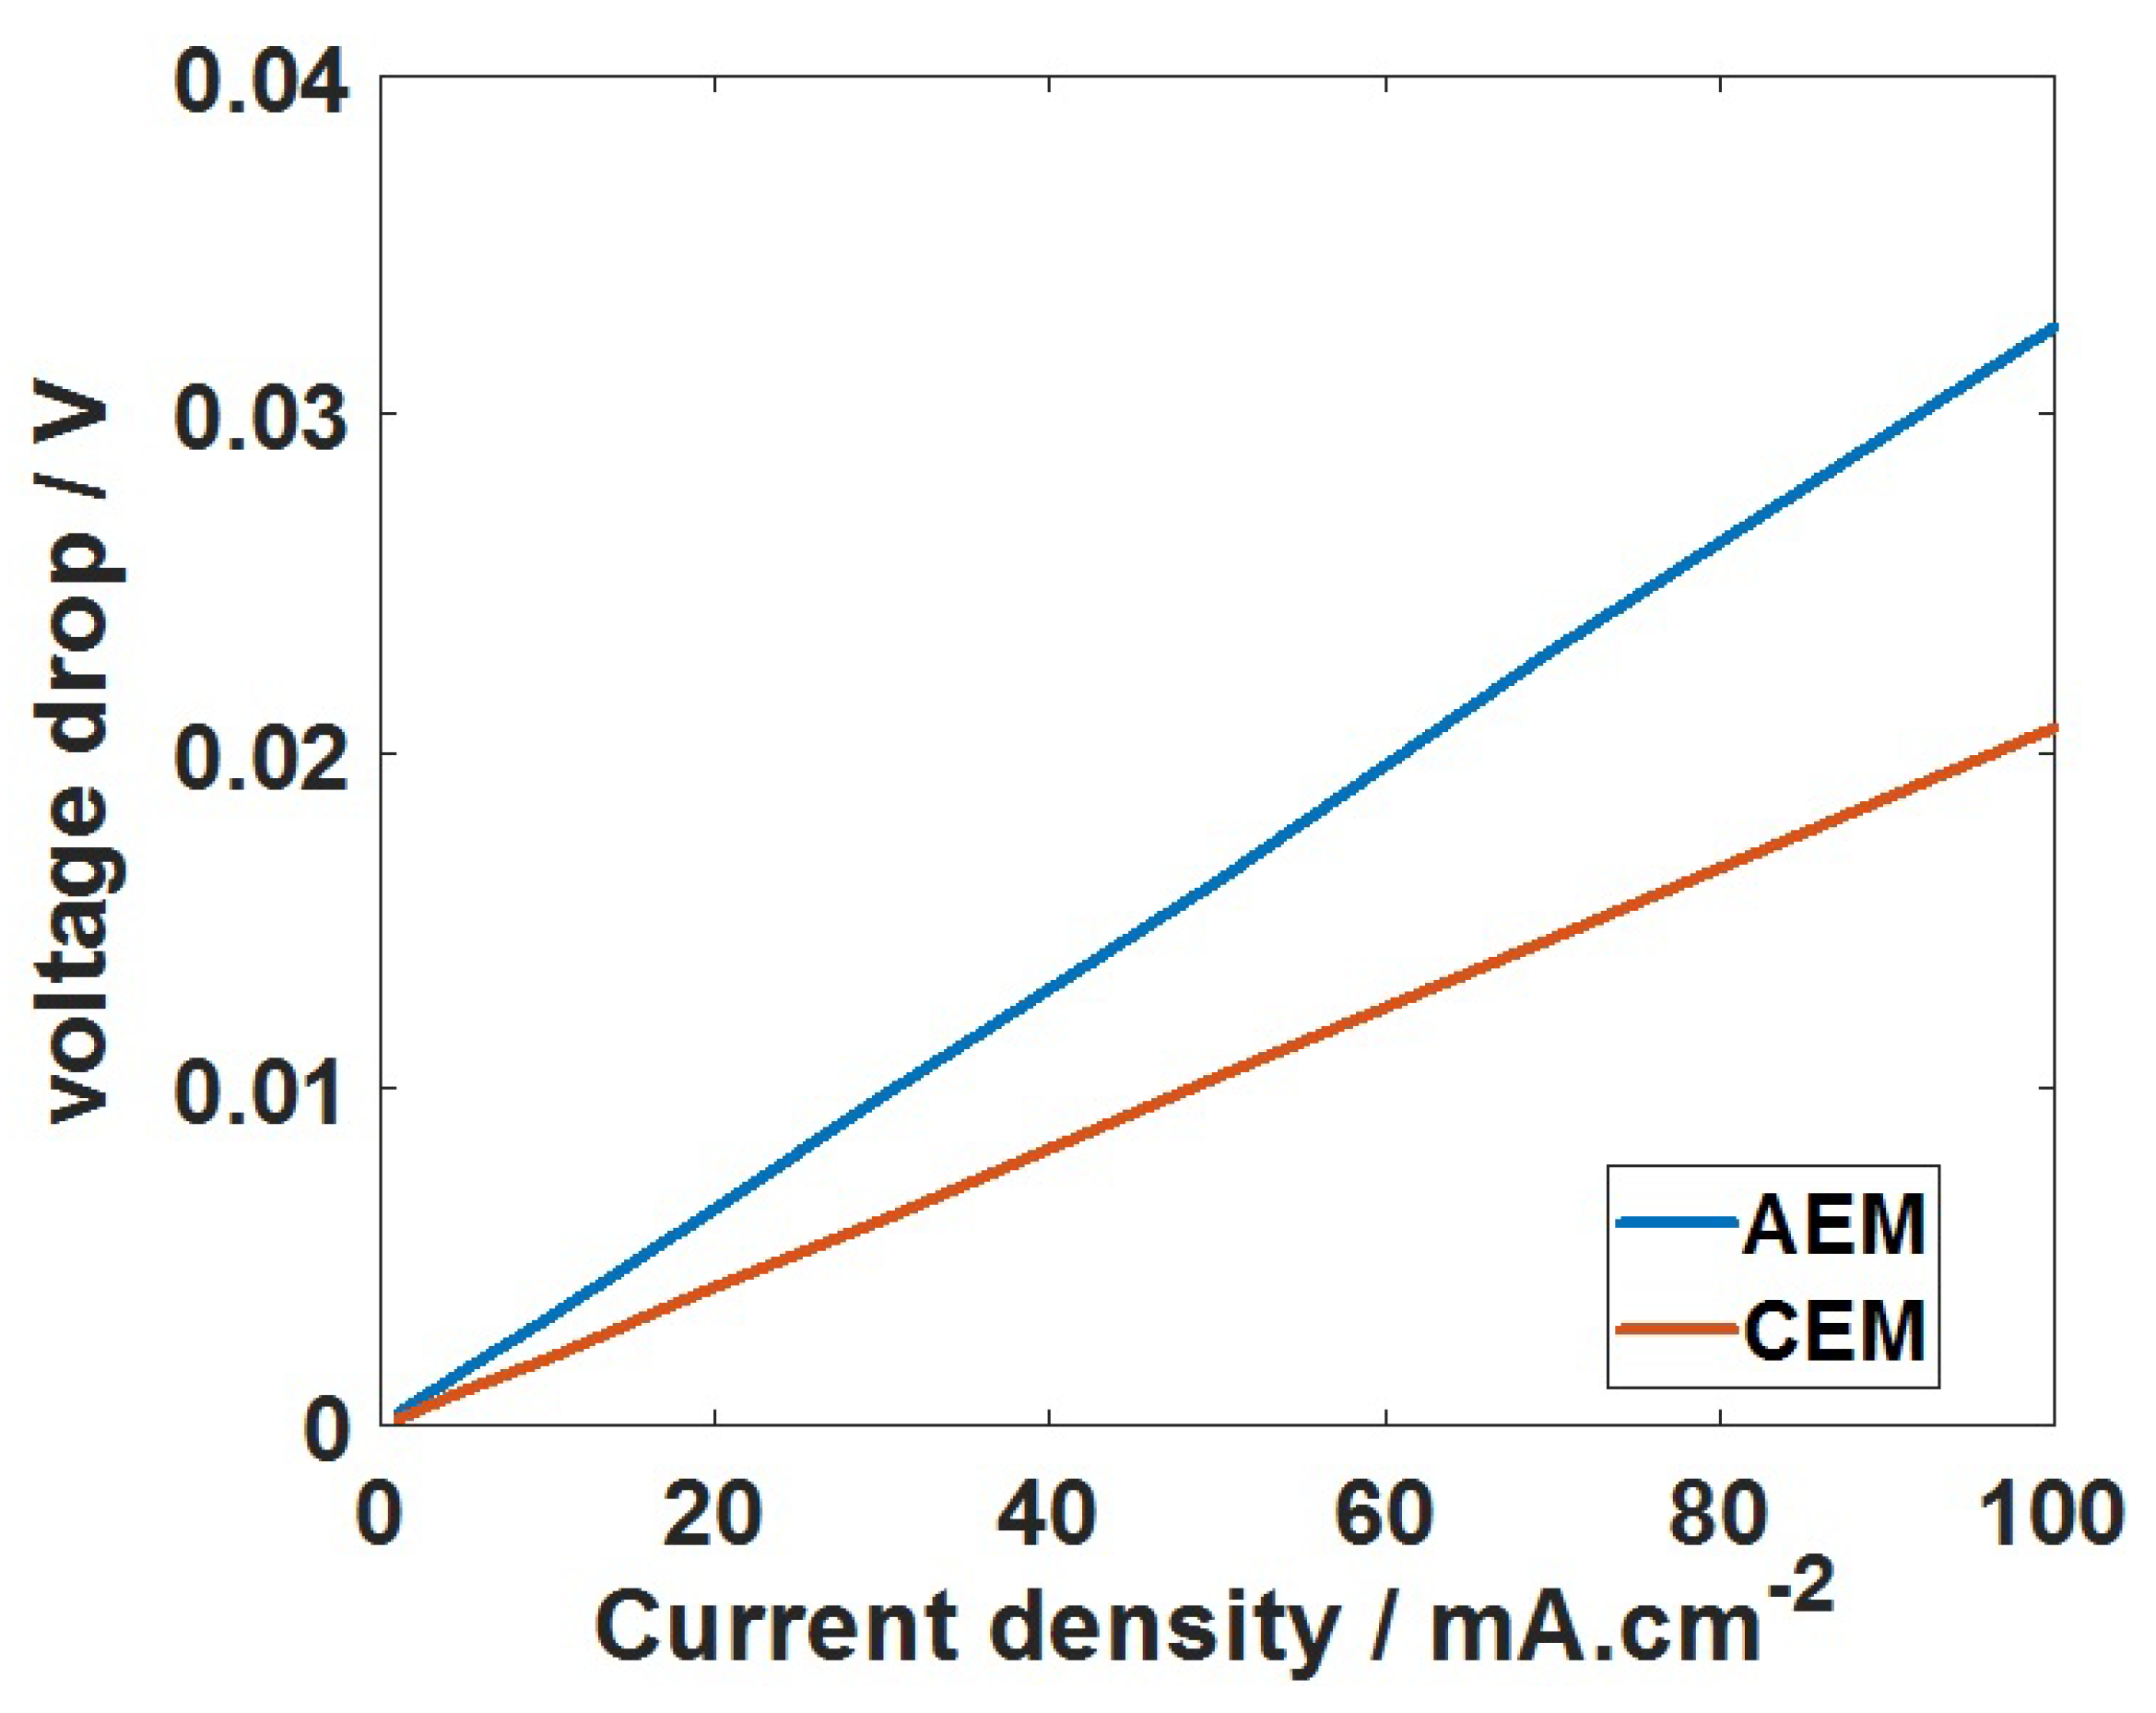
Figure 9.
(a) pKb dependent rate constant for protonation and deprotonation of a weak base group at the BPM interface. At pKa = 7, the protonation and deprotonation rate constant is equal. The K and K indicate the forward rate constant of protonation and deprotonation reaction of the neutral base; (b) the electric field influenced rate constant at different dielectric constants of water.

Figure 10.
The concentration changes of H and OH ions within the CEM and AEM layer for pH 7–7 (a) and pH 7–14 (b). The concentration profile is obtained at the applied current density of 50mA·cm. The blue lines indicate the concentration at t = 0.
Figure 10.
The concentration changes of H and OH ions within the CEM and AEM layer for pH 7–7 (a) and pH 7–14 (b). The concentration profile is obtained at the applied current density of 50mA·cm. The blue lines indicate the concentration at t = 0.
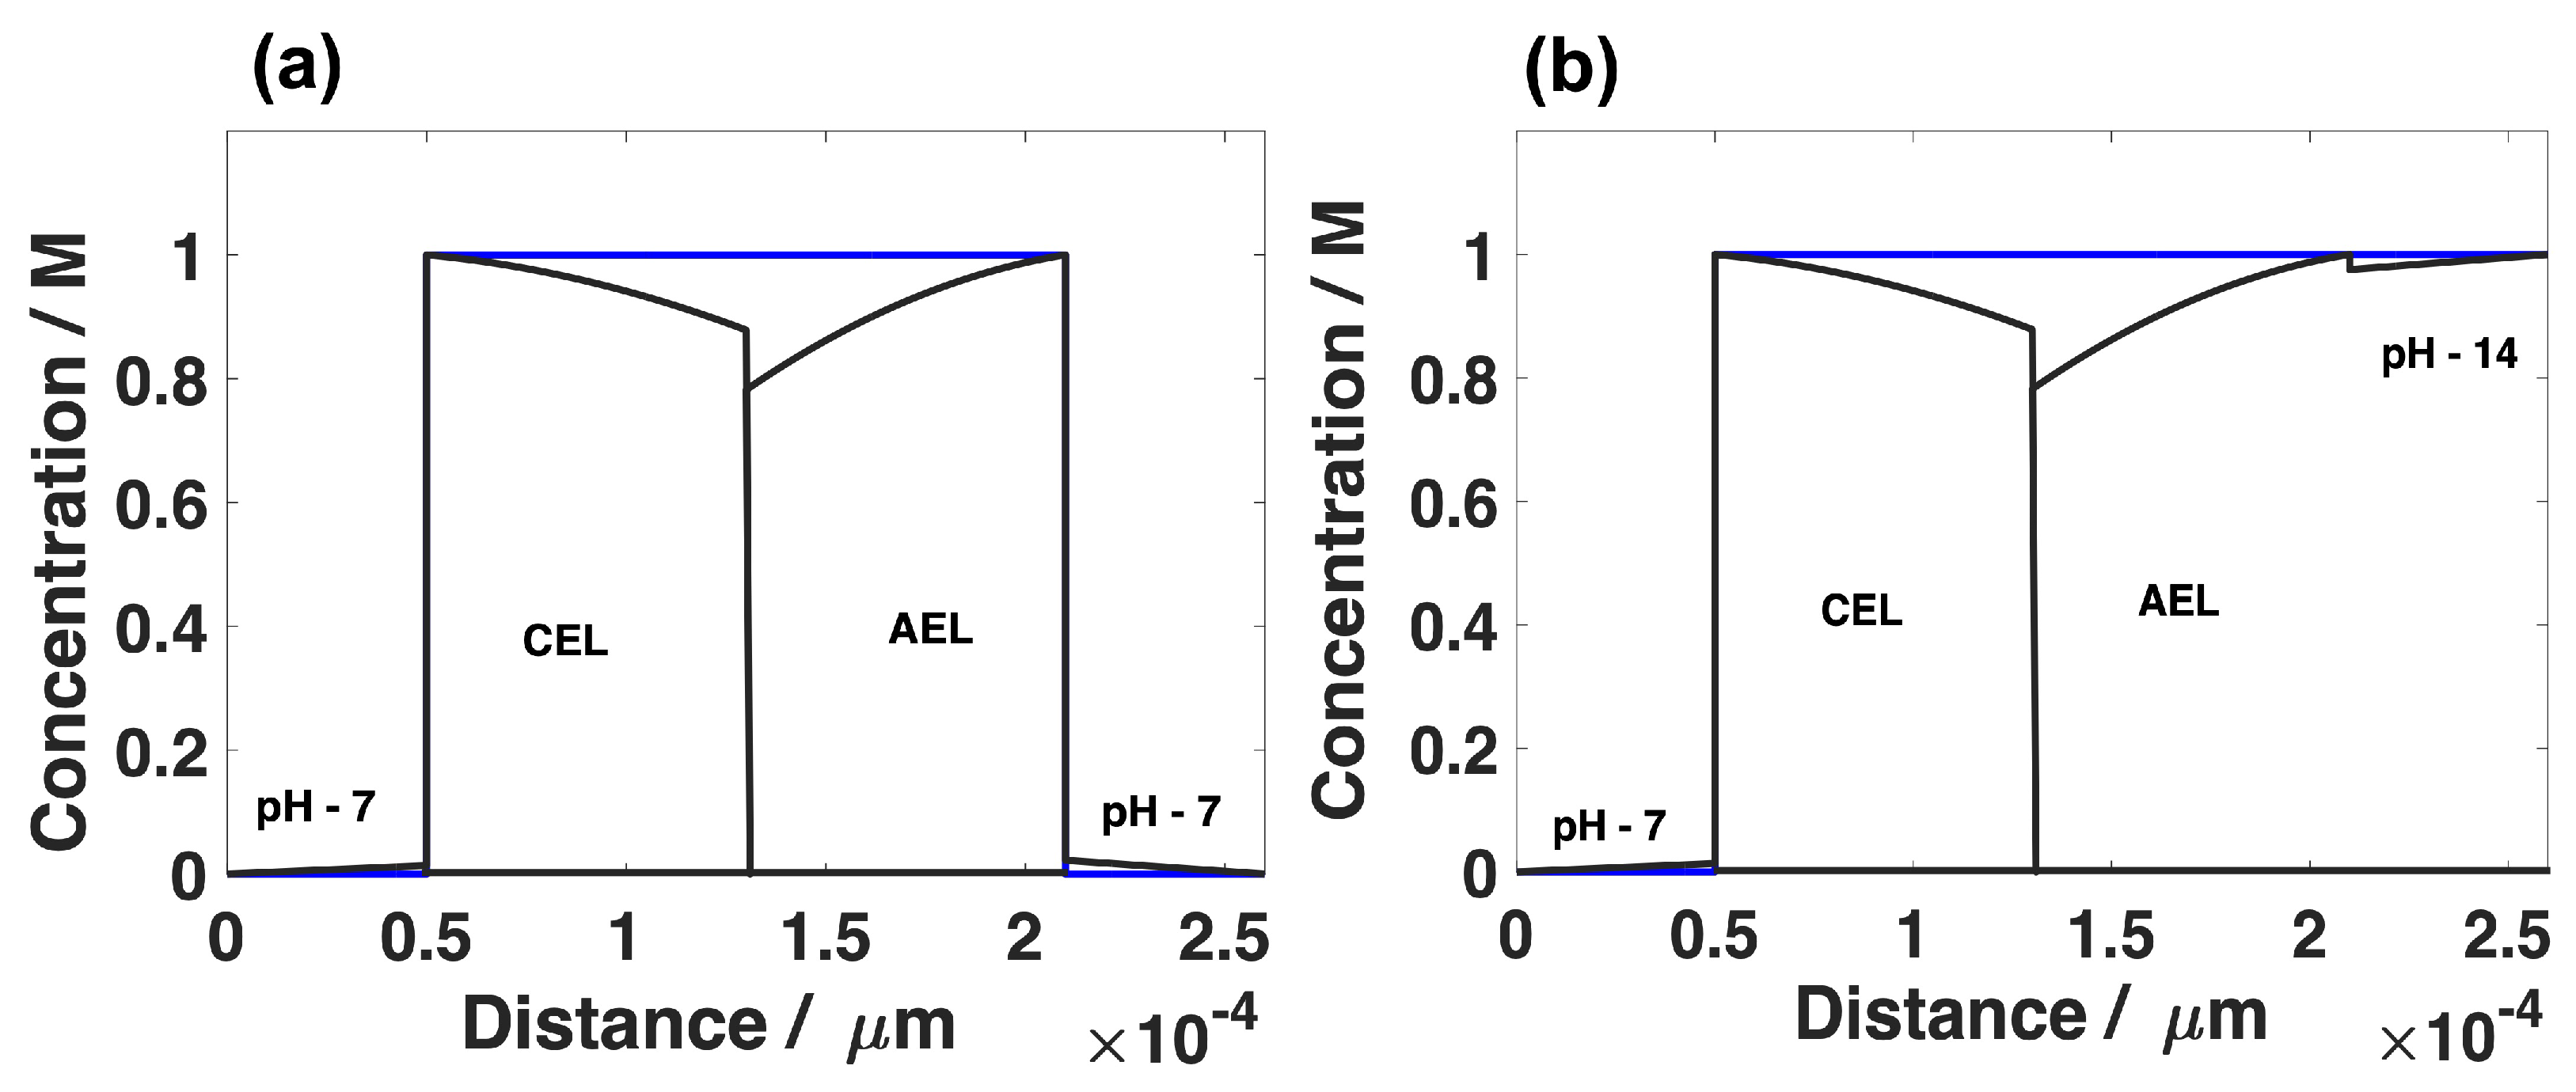
Figure 11.
The polarization curve of CO electrolyzer at 5 bar. The curve is generated by combining equilibrium potential (E) and activation overpotential of respective electrode reactions (cathode and anode) and the membrane. The value for E is assumed from the onset voltage of the polarization curve obtained from experimental data. The mass transport resistance of CO is included in calculating the total current density, which is the sum of partial current density of formate/formic acid, CO and H. The ohmic loss is not included in the polarization curve, and it can be added as a series resistance to calculate the current density. The black bold line is the simulated polarization curve, and the hollow circles are experimental data points.

Publisher’s Note: MDPI stays neutral with regard to jurisdictional claims in published maps and institutional affiliations. |
© 2022 by the authors. Licensee MDPI, Basel, Switzerland. This article is an open access article distributed under the terms and conditions of the Creative Commons Attribution (CC BY) license (https://creativecommons.org/licenses/by/4.0/).
Share and Cite
MDPI and ACS Style
Chinnathambi, S.; Ramdin, M.; Vlugt, T.J.H. Mass Transport Limitations in Electrochemical Conversion of CO2 to Formic Acid at High Pressure. Electrochem 2022, 3, 549-569. https://doi.org/10.3390/electrochem3030038
AMA Style
Chinnathambi S, Ramdin M, Vlugt TJH. Mass Transport Limitations in Electrochemical Conversion of CO2 to Formic Acid at High Pressure. Electrochem. 2022; 3(3):549-569. https://doi.org/10.3390/electrochem3030038
Chicago/Turabian StyleChinnathambi, Selvaraj, Mahinder Ramdin, and Thijs J. H. Vlugt. 2022. "Mass Transport Limitations in Electrochemical Conversion of CO2 to Formic Acid at High Pressure" Electrochem 3, no. 3: 549-569. https://doi.org/10.3390/electrochem3030038