
Electric Double Layer: The Good, the Bad, and the Beauty


Electrochemistry Group, São Carlos Institute of Chemistry, University of São Paulo, Av. Trabalhador Sancarlense, 400, São Carlos 13566-590, Brazil
Electrochem 2022, 3(4), 789-808; https://doi.org/10.3390/electrochem3040052
Submission received: 11 October 2022
/
Revised: 7 November 2022
/
Accepted: 23 November 2022
/
Published: 2 December 2022
(This article belongs to the Collection Feature Papers in Electrochemistry)
Abstract
:The electric double layer (EDL) is the most important region for electrochemical and heterogeneous catalysis. Because of it, its modeling and investigation are something that can be found in the literature for a long time. However, nowadays, it is still a hot topic of investigation, mainly because of the improvement in simulation and experimental techniques. The present review aims to present the classical models for the EDL, as well as presenting how this region affects electrochemical data in everyday experimentation, how to obtain and interpret information about EDL, and, finally, how to obtain some molecular point of view insights on it.
1. Introduction
The electric double layer (EDL) is the most important part of any electrochemical system because it is the region in space where the electrochemical reaction takes place. It was always understood that the composition and conformation of this interfacial region are important to the electrochemical reaction [1,2,3,4,5,6]. The composition, thickness, conformation, and other parameters are already expected to be dependent on the electrode material, the electrolyte chemistry, and the interaction between these two phases. Because of it, the development of electrochemical theory always considered these factors for modeling the electrochemical reactions, but just recently (around the last 30 years), the electrochemical information could merge with molecular-level information, and the EDL structure could be investigated [7,8,9,10,11,12,13,14,15,16,17,18].
Most of the works in the literature investigated the EDL response to the applied potential of polarized electrodes without the presence of faradaic reaction, which allowed the investigation of how the capacitive current is dependent on EDL, [7,10,11] a matter of importance for double layer capacitor devices, [19,20,21,22] in which also some quantum effects can also be present for enhancing the capacitance: [23,24,25] electric double layer transistors, [26] as well as for electrocatalysts, e.g., However, some authors also presented information under the presence of faradaic processes and suggested that the solvent orientation, as well as supporting electrolyte ions adsorption are of great importance to the stabilization of key intermediates [16,17,27,28,29,30,31].
The present work’s goal is to summarize the basis of EDL theory, present the experimental and simulation data obtained over the years and relate an experimental and a theoretical basis to further comprehend the EDL importance, mainly in electrocatalysis. In this way, the work is divided as follows: (i) EDL physical interpretation and classical models; (ii) how it affects electrochemical reactions and the electrochemical measure of EDL-related quantities; (iii) finally, how it is possible to gain molecular and atomistic experimental information about it. Therefore, this work aims to support inexperienced researchers in the field, as well as remind experienced ones of that, as well as briefly summarize some (spectro)electrochemical techniques that can be accessible for some research groups and could be underrated by them.
2. Electrochemical Double Layer—Definition and Classical Models
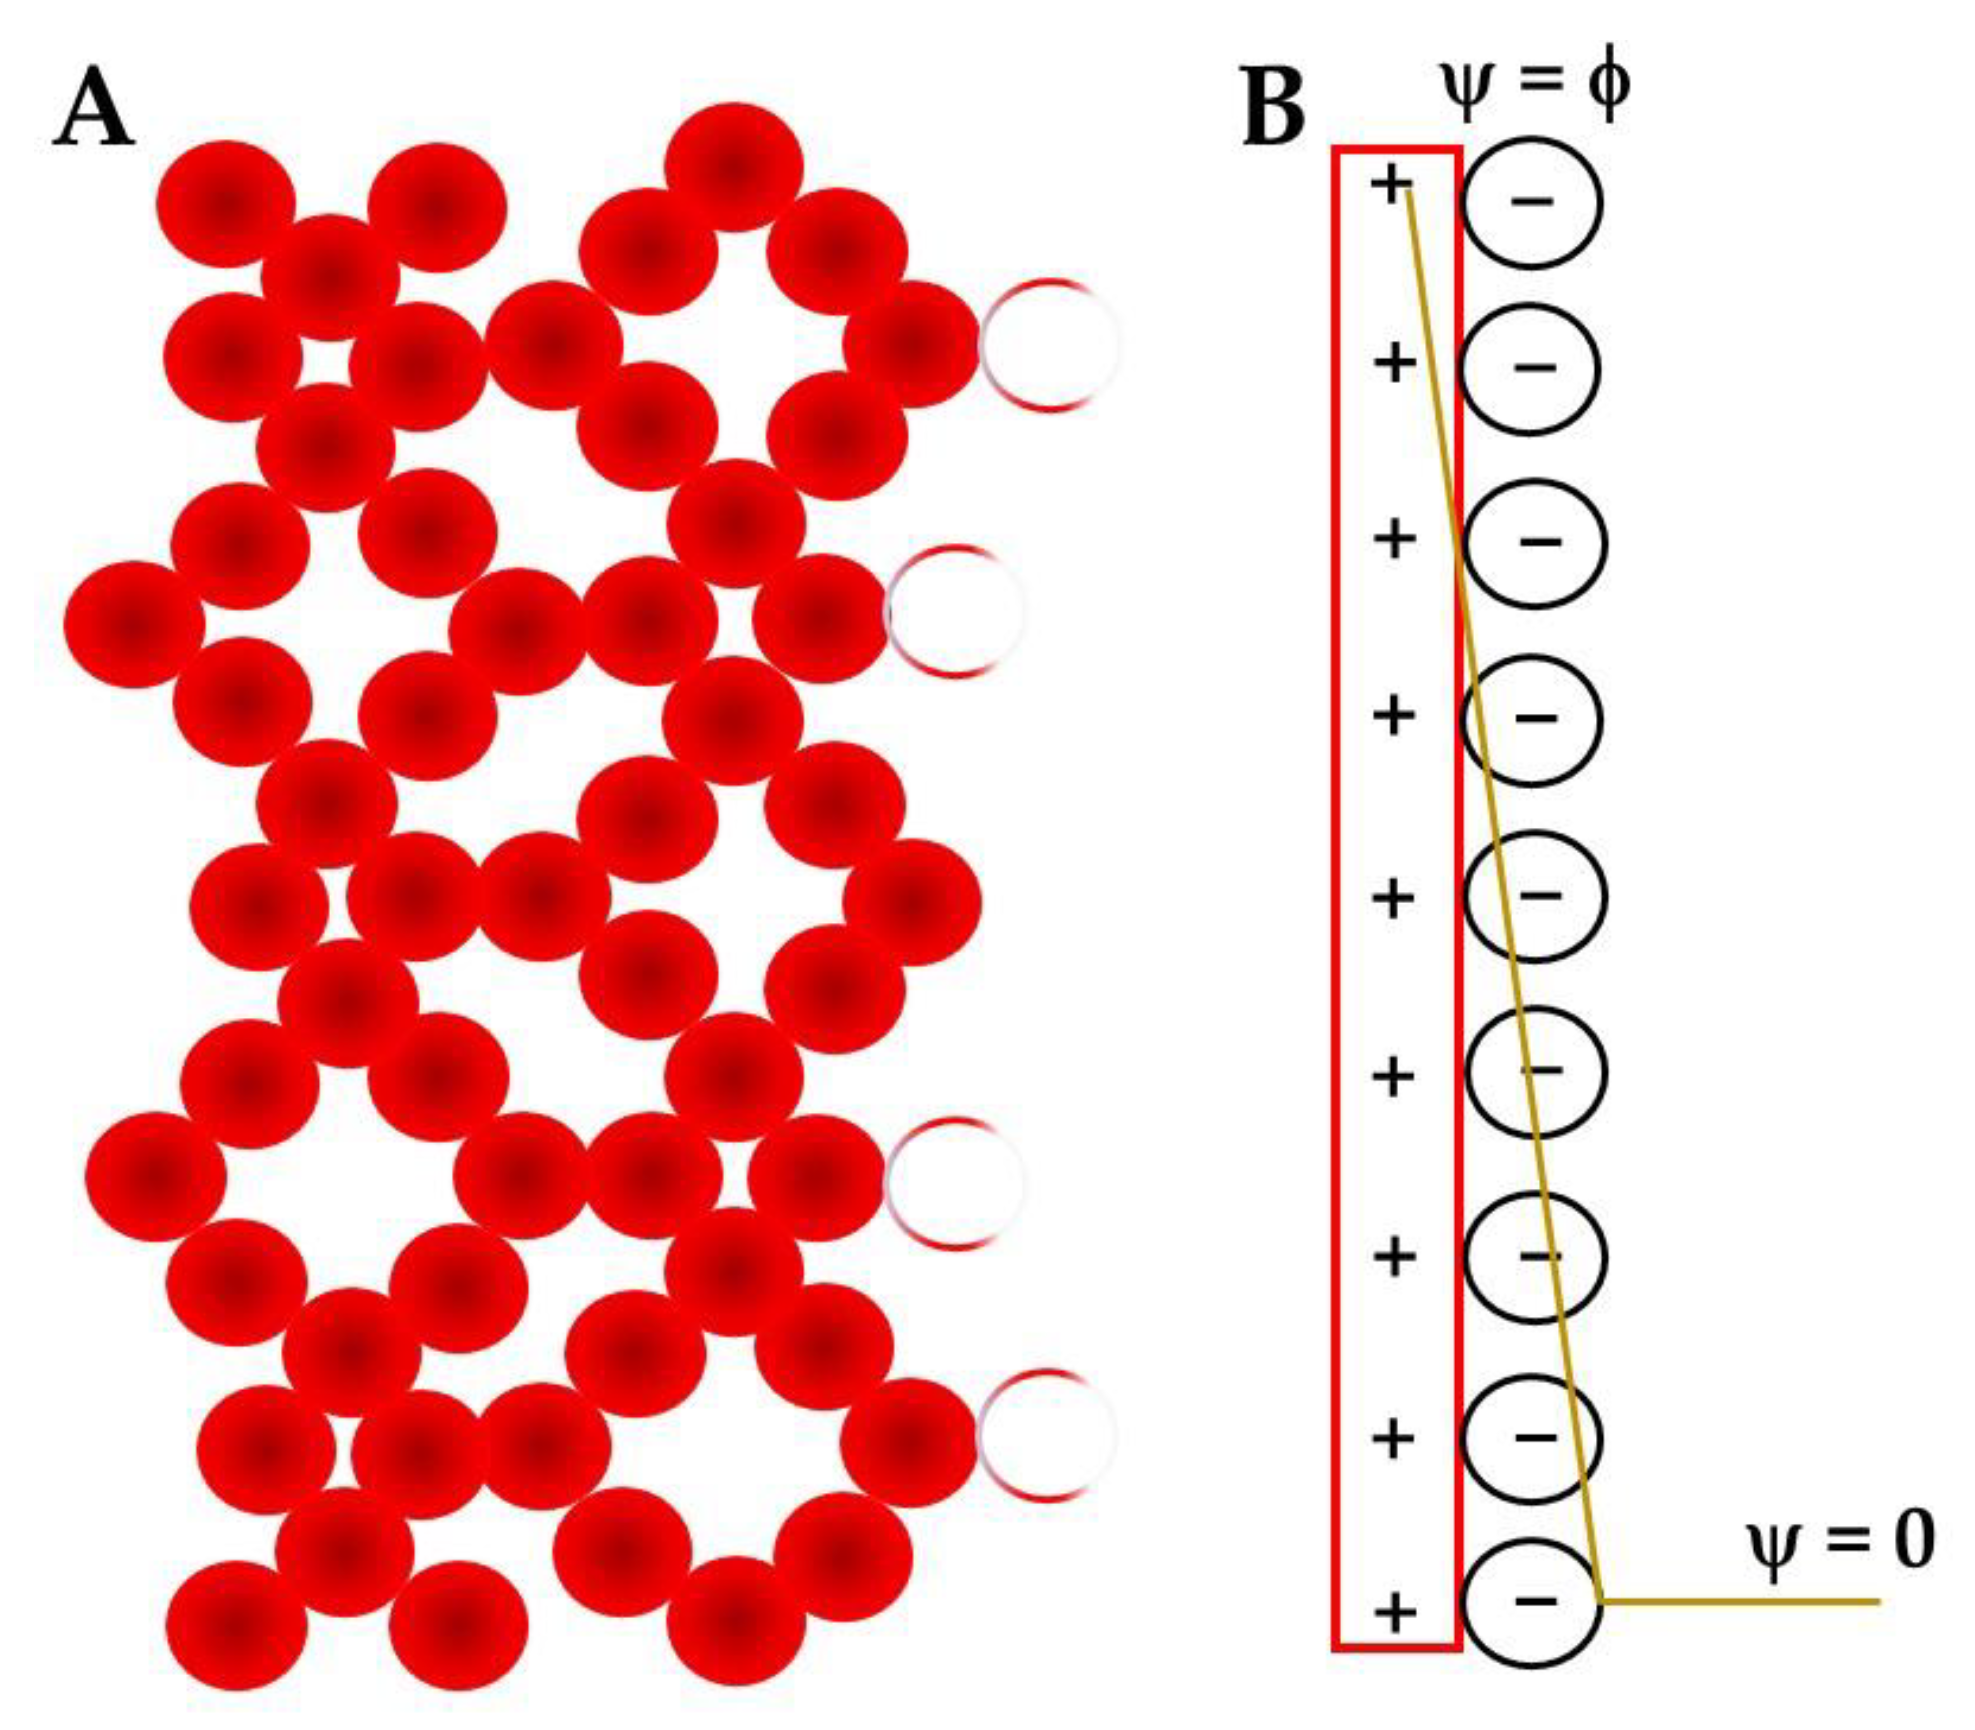
For every bulk chemical phase, the system presents symmetry. In this way, the chemical bonds or van der Walls interactions are fully satisfied in all directions. The referential point for our analysis’s initial position is inside the electrode bulk phase surrounded by such an environment (Figure 1A). Since all interactions possible are satisfied, the system presents no electric charge and no free energy. Now, letting the referential point be at the surface of the metal phase, the symmetry is broken because the bonds are no longer fully satisfied, at least half of them are no longer present [32]. Because of this matter, the electrode surface may present some surface charge, which should be responsible for the surface potential (ϕ).
The electroneutrality principle should be sustained so the other chemical phase, which in this case will be the aqueous liquid electrolyte, is the one that should be adapted from this perturbation. At this point, the reader is invited to revisit the ion–dipole interaction models, such as the Born model [33]. In the presence of charged particles, dipole molecules, such as water, will be oriented. In this way, if the particle is positively charged, the partially negative end of the solvent molecule (O atom) will be attracted by the particle, while the opposite is observed when the charge is negative.
If the particle in question is the electrode surface, it is expected that a layer of water molecules should be oriented on the surface as the first component of the EDL. However, despite being a dipole, water molecules are not charged, so the electrode surface potential is still not compensated. The electrolyte is also composed of ions, which are also interacting with water by the solvation shells. These solvated ions are attracted by the electrodes with opposite sign charges, so cations are attracted by negatively charged electrodes and anions by the positive ones. For a first approximation, we will assume that there are no specific interactions, just electrostatic ones between the electrode and the ions. In this way, the ionic layer formed over the electrode surface is, of course, not direct, since at least the water in the first solvation shell of the ion is present.
If this first ionic layer is enough to compensate ϕ, it is expected that at the end of this layer no potential should be observed, the electrolyte should behave as bulk already below it, and the potential (ψ) should promptly decay in this layer, as observed in a capacitor. This was the behavior described by Helmholtz [32,33,34] and the potential drop illustrated in Figure 1B.
The Helmholtz model did not consider the thermic motion of the ions in the solution, such as that considered for the ion–ion interaction in the Debye–Hückel model [33,34,35]. Inspired by it, Gouy and Chapman proposed the diffuse layer model. The ions are considered punctual charges, which are attracted by the electrode, and the total charge of the diffuse layer should be the same as the electrode surface, for electroneutrality.
Considering the particles’ thermo-motion, the cations and anions population can be described as Boltzmann distributions:
where is related to the cation population, to the anion, to the bulk ion population, and to the ion charge number; e is the electron charge, the Boltzmann constant, and T the temperature. The charge density (ρ) is written as:
Substituting Equation (1) in (2):
The Poisson equation for a plane is:
with ε being the liquid’s permittivity and x related to the distance from the electrode surface. In this way, the Poisson–Boltzmann equation is reached when Equation (3) is substituted in (4):
The thermal motion is the reason for the ions’ kinetic energy, and if this quantity is higher than the expected for the electric potential energy, or in mathematical terms, if T >> |zeψ|, then the exponent term in Equation (5) can be expended in a polynomial form and trunked in the second term, linearizing the equation:
The first term at the right side of Equation (6) is related to the total charge of the electrolyte bulk, which is known to be zero since electroneutrality is observed. In this way, it is possible to reduce Equations (6) and (7).
After some rearrangement:
A solution for the differential equation in 8 is:
The Debye length, , is defined as the thickness of the ionic cloud around the center ion, in the Debye–Hückel theory [33,34,35]. The total charge of this cloud has the same modulus as the central ion charge, but the signal is the opposite, which guarantees electroneutrality. This quantity is presented in Equation (10). If it is substituted in (9), Equation (11) is obtained.
with NA being Avogadro’s number and I the ionic strength, which is defined by:
The potential drop, as well as the ionic surface excess population distribution, is shown in Figure 2.
The Gouy–Chapman model also presents some misconceptions, such as the assumption that the ions are punctual charges. For the dimensions of the EDL, this approximation is not valid, especially because small ions are found to be big in the solution due to the solvation shell. That is why Stern’s model considered the size of these ions, mainly closer to the surface, the first layers. By using this approach, the reader can notice that the Stern model combines the Helmholtz and the Gouy–Chapman model, assuming that the Helmholtz layer (HL) is not enough to compensate ϕ; so, at the HL’s end (), a residual potential () is observed. Therefore, the potential of the diffuse layer is now described by:
The Stern model works nicely for the description of the EDL; however, it is still not enough to describe molecularly the electrode interface, especially inside the HL. The Grahame model was later proposed in a way that the HL layer can be described as two different layers, the first being more rigid than the second [36]. The first layer is composed of solvent (water) molecules, oriented according to the electrode charge. These molecules can also be involved in ion solvation, which is already a component of the second layer. The first layer is normally called the inner Helmholtz plane (IHP), while the second is the outer Helmholtz plane (OHP), as shown in Figure 3.
It is important to highlight another important application of . It is called, in colloid science, zeta potential (ζ). It is an important quantity since the surface charge of nanoparticles dispersed in electrolytes is normally not possible to measure. However, the ζ-potential is measurable and is a strong indication of how the particles are charged.
In the present work we considered just flat electrodes, which can also be considered for smooth nanoparticles, if these boundary conditions are applied. For double layer supercapacitors, however, the EDL also extends to the frequent porous structures of the electrodes, which can provide some differences in the final result. It is beyond the scope of the present work to consider such matters, due to the focus in electrocatalysis; for the curious reader, the work by Wu [23] is highly recommended.
Concepts to keep in mind:
- EDL is a natural phenomenon caused by the interfacial region between the solid electrode and the ionic conducting electrolyte;
- Its most complete modeling considers that the electrode surface charge compensation happens in two layers, a rigid one that can be divided in two sub-layers, IHP (mostly solvent) and OHP (mostly solvated ions compensating the electrode charge) and the diffuse layer;
- The EDL potential drops linearly in the rigid layer and exponentially in the diffuse one.
3. Electrochemistry in the Game
Knowing that the EDL can be understood as a double layer capacitor, as presented in the models in Section 2, some relation between this propriety and the charge transfer process needed to be established. One measurement that was proposed was the use of ultra-high vacuum experiments, in which the electron working function (W) could be measured by a photo-electron effect [37]. In this way, if a thin electrolyte layer is present, W is related not only to the electrode material, but it is also related to the resistance of the EDL for this electronic transfer. A simple relation was proposed between W and the potential of zero charge (PZC), which by its turn, is an EDL property that can be related to the electrode material, the conformation and structure, as well as the electrolyte chemical properties. This relation was summarized in Equation (14).
where e the electron charge and the so-called interfacial parameter. This empiric quantity is related to the physical differences between the electrochemical environment used to measure the PZC and the ultra-high vacuum needed for the W measurement.
Equation (14) gives two important factors to be considered: (i) the PZC/W ratio is an important quantity to understand the electron transfer process; and (ii) there is a proportion constant that is dependent on the electrode material, electrolyte, solvent, temperature, and other variables [37]. In this way, it is somehow logical to say that the electron transfer and the electrochemical kinetics are dependent on the interface and on the EDL.
The deviations from the PZC and W relations were related to the water in the EDL and its orientation, as suggested for a long time by Trasatti [38], for metallic electrodes. Therefore, this author presents that W can be described as dependent on the electron’s chemical potential in the metal () and the potential at the metal surface () and F (Equation (15)) [38].
It should also be highlighted that the W description by Equation (15) is related to quantities, such as ϕ, which should be dependent on the experimental conditions, so the measurement in high vacuum may not be the same as the expected in electrochemical conditions, which can result in deviations from the PZC/W ratio estimation [38]. These differences due to electrode in contact with water (δϕ) and the solution dipole can be related to the IHP. Trasatti also shows that the PZC is also a function of the electrode material and the chemical environment in which it is inserted (electrolyte) [38]. Considering Equations (14) and (15), the electrode material should be represented by and directly related to W, while the electrolyte should be better represented by .
In ref. [5], a possibility for obtaining information on the EDL is the measurement of the double layer capacitance (), which can be measured by electrochemical impedance spectroscopy (EIS) or cyclic voltammetry (CV). CVs in the EDL potential window, i.e., in absence of faradaic processes, are frequently presented in the electrocatalysis literature for the estimative value of the electrochemical active surface area (ECSA) [39,40,41,42,43,44,45]. It is important to comment that such deviations from the perfect capacitor are normally related to surface irregularities distributed along the surface [42,46,47,48,49]. These deviations will be important later in this text.
When one uses the CV technique for the measurement, the information obtained would be an average of the related potential window where faradaic processes are absent, and higher scan rates (between 0.1 and 1 V s−1, e.g.,) of the are more independent on the scan rate, so with less experimental error [46].
EIS, by contrast, is a more sensitive technique, being also sensitive to charging differences in narrow potential windows, suggesting that is also affected by non-faradaic processes, such as EDL charging and discharging [23,50]. These differences are related to the definition of capacitance (Equation (16)).
In this way, is expected to decrease with the increment of potential (E) and to be proportional to the charge (Q) observed. Obviously, the potential applied will also affect Q, so the overall relation is not so simple. Considering an experiment in which potential is the control variable, one can expect to observe a minimum of charge, in a way in which the natural charge, related to the ζ-potential, is fully compensated by the bias potential. In such a case, is expected to be also minimized. Because of this, the minimum of a vs. E profile (Figure 4) is related to the PZC (Equation (14)). In other words, EIS is a powerful and purely electrochemical technique to obtain EDL information, such as , and by measuring this quantity at different E, electrochemical activity can also be better comprehended by the relation between W and PZC.
Cdl is normally not directly obtained by EIS measurements, due to the surface imperfections previously cited. Because of it, it can be better related to a constant phase element (CPE) [42,46,47,48,49]. The data fitting for these CPEs is normally not directly comparable due to the exponential term. Because of it, the conversion of the CPE data to an effective double layer capacitance () should be considered, and so far, the model presented by Brug et al. [51] is of high relevance because it considers a surface distribution of imperfections.
Changing the electrolyte nature, as the cations and/or anions, the PZC changes, and so the electrocatalytic activity, which is related to W. As presented in the literature for alkali ions [52], there is a linear tendency with the solvation energy of the ion and the PZC, which immediately calls one’s attention to the Hofmeister series [53,54,55]. According to ref. [55], this series classifies the ions as kosmotropic and chaotropic, the former one being the more solvated ions and the latter one being the less solvated ions. This series was proposed by Hofmeister for the precipitation of proteins [56], but at that time, the relation between the chemistry of these ions and their interaction with the biomolecules was not clear. Later, it was related to the ion–solvent interaction [57], and the series was observed to be of relevance in surface science as well [32].
For the EDL structure, the Hofmeister series is related to the capacity of these ions to be adsorbed on the electrode surface, which equals the inner or outer Helmholtz’s planes. The kosmotropic ions, the ones that disturb the bulk water structure, are the ones expected to be more adsorbed on the surface. As a consequence, the measured in media is always lower than that measured in ones, [52,58] suggesting that more chaotropic ion is less adsorbed on the electrode, leading to a more exposed electrode surface. In this way, (Equation (10)) is expected to be larger in chaotropic media.
The anion consideration of the EDL structure is also important, especially because these ions are more affected by the Hofmeister series [55]. However, in this case, it is also important to consider that the participation of anions in the EDL can be due to a chemical bond between the electrode surface and the anion, if it is a halogenate [59] or [60] In these cases, even if the anion presents a “neutral” chaotropicity, as , it will strongly adsorb on the electrode and influence on the IHP structure. In addition, the direct comparison is facilitated in the cations case due to the periodic groups that are normally used and can vary from kosmotropic to chaotropic, as the alkali metals group. For anions, the case normally is to compare ions that have very different chemical compositions, e.g., as sulfate () and perchlorate (). Nevertheless, as a kosmotropic ion, sulfate is normally more adsorbed on the electrode surface than perchlorate. Because of it, it is normal to observe higher activities in electrolytes [17].
Another influence to be considered in the EDL is the electrode crystalline structure. If one investigates the literature for single crystal electrodes [12,31,61,62,63], it will be noted that a simple j/E profile is strongly affected by the exposed electrode facet, and in pure supporting electrolyte, it is mostly due to the ionic adsorption, which is, by its turn, due to the differences in surface charge and energy for each plane. An expressive example is the triangular potential perturbation of Pt basal planes in a sulfuric acid solution. Taking Pt(111) first, the j/E profile presents a current spike at 0.45 VRHE, which is not related to a faradaic process but to the adsorption/desorption of sulfate anions on the electrode [61]. For Pt(100), this process is shifted to 0.38 VRHE, approximately, but is not as sharp as in the previous electrode. Knowing that the electrochemical adsorption energy is proportional to the potential peak [64], it is already possible to notice that, even if the electrodes are made of the same element, they are immersed in the same electrolyte and exposed to the same chemical species, and the adsorption energy will be different due to the crystallographic structure; this can be understood as a perturbation on the EDL, since it would affect ϕ and the whole EDL structure as a consequence. A similar conclusion was described in the literature for Pd basal electrodes [65] using EIS.
Temperature (T) affects the molecular motion, enhancing the ionic mobility and randomizing the water structure, which makes the EDL structuration more difficult [66]. This could lead to two different behaviors, one is the decrease in PZC with T, due to the resulting lower permittivity [66], or a PZC increase, due to the enhanced ionic mobility. The first case was found to be true for the three-electrode cell, a well-behaved system, while the second case is observed in a more complex system, such as the case of a fuel cell [66].
Another interfacial quantity is the interfacial pH. Electrochemical reactions tend to generate/consume hydronium/hydroxyl ions, and these species will be less/more concentrated in the EDL, making the interfacial pH significantly different from the bulk pH [67,68,69,70,71,72,73]. These variations may lead to misreading of the potential, or even to a change in activity and/or selectivity of the catalyst under investigation [16,39,67,74]. Because of it, the consideration of this EDL property is of high relevance.
The pH variation at the interface can be estimated by some electrochemical techniques, such as the rotating ring disk electrode (RRDE), in which the electrochemical reaction is taking place on the disk, and the generation/consumption of hydronium/hydroxyl ions can be measured at the ring electrode, which surrounds the disk. These ions reach the ring due to the forced convection needed for this powerful technique [75,76,77,78,79].
The first suggestion in the literature to measure the interfacial pH by RRDE application dates from 1983, in which Albery and Calvo suggested leaving the ring electrode at open circuit conditions and measuring the potential variation, which should be previously calibrated [80]. Later, Hessami and Tobias have shown how this measurement is affected by the electrode dimensions and the effects of the efficiency collector (N) in this interfacial pH measurement [81]. If one prefers to apply the potentiometric measurement of interfacial pH, it is of high interest for the ring electrode to be sensitive to pH variations. In this way, the previously cited works [80,81] suggested using a Pt ring. However, other materials can be used, such as the IrOx [82,83], which is reported to be more sensitive. Since many pH-sensitive faradaic reactions of interest are related to gas evolution, such as or evolution and reduction, it is important to consider that accumulation of bubbles may lead to misreading at the ring electrode [84].
Other electrochemical approaches that may help in the interfacial pH investigation are local techniques, such as scanning electrochemical microscopy (SECM) [85,86,87,88]. Similar materials that are used for RRDE apparatus can be used as SECM tips and be operated in potentiometric mode. The mean advantage of SECM over RRDE is the possibility of mapping the working electrode. By this, non-homogeneous electrodes with specific active sites can be investigated in detail.
SECM can be used in different modes and by using different tips in a way that different interfacial properties, such as conductivity and [85,86,87,88,89,90,91,92] adsorption of intermediates [93,94,95,96], can be investigated. In addition, it is possible to couple SECM with EIS in the so-called local EIS [91,94,97]. With this combined approach, it is possible to investigate the electrochemical proprieties of the EDL of isolated points of the electrode, which would allow the determination of quantities, such as local PZC, which can be used to understand the properties of active sites of electrocatalysts.
However, even with all the information that is possible to obtain with the electrochemical techniques, molecular-level information is still missing. Because of it, some spectroelectrochemical techniques need to be considered as well.
Concepts to keep in mind:
- EDL can be used for charge transfer processes investigation, mainly due to how it is related to W;
- PZC is a quantity that can be easily obtained by EIS measurements and is strongly dependent on the EDL;
- The electrolyte chemical composition affects the EDL, and consequently the PZC and the W. Because of it, the catalysis is strongly affected by the supporting electrolyte.
4. EDL Structure
So far, we discussed the EDL modelling, how it affects the electrochemical activity, and how some proprieties can be measured by electrochemical techniques. However, we still are not observing how the EDL structure behaves at a molecular level, which can contribute to adsorbed species stability through intermolecular interactions [28,29,98,99]. To better comprehend how both factors contribute to the system under investigation, the EDL molecular structure needs to be taken into consideration, and spectroscopic techniques and theoretical calculations need to be used for these insights. The present work will focus on experimental approaches for the EDL structure; however, some theoretical comparisons will be done when significant. For the reader interested in theoretical/molecular simulations, the works by Wu [23], Chu [50], and Rossmeisl [100,101,102,103,104,105] are highly recommended.
To investigate electrochemical interfaces by experimental approaches, coupling the electrochemical measurement with a spectroscopic technique is needed. Along the most used spectroelectrochemical approaches [100,106,107,108,109,110,111,112,113], the vibrational ones are the most used for EDL investigation due to their traditional application for intermediate/product identification and mechanistic proposals [17,28,29,108,109,110,111,114,115,116,117,118,119]. Because of that, vibrational spectroelectrochemistry is the main focus of this section. The operational principles, selection rules, and limitations of infrared and/or Raman surface/electrochemical spectroscopy are not discussed in here. If the reader is not familiar with them, some literature is proposed for infrared [120,121,122,123,124] and Raman [125,126,127,128].
Before considering electrochemical reactions, it is better to consider how the EDL can respond to small potential perturbations. In this sense, works using surface-enhanced infrared spectroscopy (SEIRAS) [7,10,108,129,130], surface-enhanced Raman spectroscopy (SERS) [131], and shell-isolated nanoparticle-enhanced Raman spectroscopy (SHINERS) [11] can be found. For these studies, single-crystal electrodes were the most used ones, since it should make the electrode material contribution (, Equation (15)) constant for the whole analysis [12,31,100].
Independent of the supporting electrolyte used, water bands are always present. Because of it, the water-related bands are the target ones for EDL investigations. The banding band (δ, around 1600 cm−1) is a qualitative guide for surface wetting [17,119,132]. For most cases, this band is normally not centered at the expected region for free water molecules (1645 cm−1), and when it is redshifted to below 1600 cm−1, the shift is explained by the fact that the IHP water is stabilized by the interaction with the electrode surface [7,10]. In acidic media, it is necessary to consider that the hydronium species can also co-adsorb water. This interaction between hydronium and water generates a double degenerated asymmetric banding centered around 1700 cm−1 [7,8,9,10,11,27,29,129]. The increment in the hydronium-related band can be also related to the surface excess charge; in other words, if the electrode is more negatively charged, the IHP and OHP hydronium concentrations increase and the 1700 cm−1 intensity increases. In this way, the behavior of this band is normally related to a spectroscopic determination of the PZC [7,8,9,10,11].
For neutral conditions, the shifts in the δ can be related to different conformations, such as the weakly adsorbed water molecule, with the interaction by the H atoms (H-down, Figure 5A) expected to be around 1615 cm−1 [7,8,9,10], the bi-layered conformation related to the “ice-like” structure (Figure 5B) around 1640 cm−1 [7,10], and the stronger interaction by the oxygen electrons lone-pairs and the surface at 1650 cm−1 (H-up, Figure 5C) [10].
Another band observed for water molecules is the O-H stretching (νOH). This is very intense, and the broadband is localized over 3000–3200 cm−1. In most spectroelectrochemical investigations, this band is just cited as a “water-related band” and no further interest is given to it [114,116,134,135,136]. However, it is already known that this is not a full symmetric band; it presents several shoulders, which sometimes evolve into proper bands [7,10]. Applying deconvolution methods, the contribution of smaller bands can also be investigated, such as the one centered around 2900 cm−1, and attributed to the stretching of an O-H moiety in which the H atom is also interacting with the electrode surface in the IHP (H-down, Figure 5A) [7], 3250 cm−1, related to a Fermi resonance of νOH with a δ overtone [7]. At 3400 cm−1, the band is suggested to be related to the solvation shell of anions, mainly SO42− (Figure 5D) [8,9]. At 3470 cm−1, the νOH is related to an almost flat-water molecule conformation (Figure 5C); however, it is a little tilted, a condition needed for the observation of this band due to the surface selection rules, and the shift is interpreted to be related to an interaction between the O lone-pairs and the surface [8,9]. At higher wavenumbers, such as 3640 and 3735 cm−1, water dimers are expected (Figure 5E) [7], while for alkaline media, the νOH for hydroxyl ions is expected to be at 3750 cm−1 (Figure 5F) [133].
The bi-layered “ice-like” structure (Figure 5B), also presents a characteristic νOH, which can be observed around 3200 cm−1, according to Garcia-Araez et al. [9] or around 3612 cm−1, according to Ataka et al. [7] In this conformation, just one water layer is related to the IHP, while the second is already considered as part of the OHP [100]. The naming of this structure as “ice-like” is supported by the fact that its adsorption strength is close to the bulk ice binding energy. Additionally, at this conformation, no chemical interaction between the IHP water (first layer) and the electrode is observed, purely physical adsorption [100].
At the PZC, the EDL water is reported to be closer to bulk conformation [11], presenting no preferential interaction, just a flat relation having one lone-pair interacting with the electrode (Figure 5G) [7,130] or even the “ice-like” conformation (Figure 5B) [10]. Ataka et al. [7] proposed that at potentials more negative than the PZC, δ should be around 1612 cm−1 and is related to a weakly H-bonded molecule and to a conformation in which the H-down conformation (Figure 5A) is not fully perpendicular (at a tilt); so, there is an interaction between the metallic surface and an oxygen lone-pair [7,8,9]. Wandlowski et al. [10], at the same conditions, also suggested that a second layer is related to the H-bond between the IHP tilted water, and an OHP water is present by also looking at the νOH bands. At the PZC (≈0.58 VRHE, Au electrode in 0.5 mol L−1 HClO4 electrolyte [7]), no preference was observed, and the spectrum at this potential was used as a background [7,8,9,10,11].
At potentials shortly more positive than the PZC, Ataka et al. [7] and Wandlowski et al. [10] suggested the “ice-like” conformation (Figure 5B). However, the range in which each group suggested such a structure did not match, and later, Garcia-Araez et al. [9] highlighted that the divergence between both excellent works could be due to the proposed PZC region. At even more positive potentials, the electrode is expected to be fully H-up (Figure 5C), and some anions are expected to co-adsorb as well (Figure 5D); so, water bands in the solvation shell are also expected [7,8,9,10,28,29,130].
At potentials more negative than the PZC, one of the most interesting works is using SHINERS [11]. There, the authors observed that two possible H-down conformations can be observed. The first is related to a row of water molecules in which one H is interacting with the electrode (Figure 6A), while the other is involved in an H-bond with the water molecule directly in front; the second conformation is also a bi-layered one (Figure 6B) in which the IHP water has both H-atoms interacting with the electrode, while the OHP molecules have one in an extended interaction with the electrode and the second is an H-bond with the IHP molecules.
One of the biggest issues of investigating EDL by vibrational spectroscopy is that it is difficult to interpret the relation between band position and potential [11,27,129]. The literature highlights that it can be a Stark shifting, related to how strongly adsorbed the water conformation of one or the other IHP is due to the changing in the conformation, which normally have bands closely centered. For this reason, the investigation of these bands needs to be taken with care and always considering both moieties, δ and νOH.
In electrolytic solutions, water is not the only chemical species present, there are also ionic ones. In acidic media, the hydronium ions (δ around 1700 cm−1) are the cation, and the anions are, frequently, sulfate [9,10,17,18,29,118,129], perchlorate [7,8,9,17,28,29], and sometimes other acids, such as nitric [18] and halogenates [131], which are also present. The anion participation in the EDL structure is very important, especially for oxidative reactions since they normally occur at potentials more positive than the PZC. These anions are attracted/repelled to/from the EDL by the surface charging process and may assume different conformations [17,18].
The kosmotropic anions, such as sulfate, are known to strongly interact with the surface [53,54,55], and this may shift the PZC, as discussed in the previous section. The PZC shift is normally reflected in a positive shift in the oxidation potential, making the oxidation process less favorable [28,29]. The strong interaction may also block some catalytic sites, and because of it, the electrocatalytic overall current may be smaller. The bands related to sulfate are around 1100 cm−1 [7,9,10,17,18,119], and this band can be deconvoluted in two C2v vibration modes related to adsorption in which two oxygen atoms are interacting with the surface (Figure 7A) [17,18]. This conformation results in two observed bands, one above 1100 cm−1, which is the stronger one, and another below 1000 cm−1. The first is related to the asymmetric stretching and the other to the symmetric one [18]. Another possible conformation for the sulfate adsorption is related to an inverted tetrahedron, in which just one O atom is interacting with the surface in a C3v mode (Figure 7B). The symmetric stretching is expected to be between 750 and 900 cm−1 and the asymmetric between 1250–1350 cm−1 [18]. All these bands are expected to be observed as a broad and an asymmetric band, so once again deconvolution methods are recommended [17].
For chaotropic anions, such as perchlorate and nitrate, the adsorption is not so strong. Especially for perchlorate, which is normally assumed to be a non-adsorbing anion [53,54,55]. However, there is already evidence that this anion is not just an adsorbate one [62,63,65,137], but that this adsorption also may present different conformations on the electrode surface [17]. The perchlorate adsorption is expected to present a duplicate of an asymmetric mode around 1250 cm−1 [17] and a symmetric mode stretching around 1100 cm−1 [7,8,9,17,28,29]. The symmetric one is reported to be more intense, and maybe this is the reason for it being mostly reported as the only perchlorate band. However, it is possible to find works that not only report both bands but also deconvolute the symmetric band in two, suggesting three moieties for the adsorption [17].
Nitrate ions are reported to adsorb just by one conformation (Figure 7C) using two oxygen atoms and presenting just symmetric and asymmetric modes, at 1043 and 1440–1450 cm−1 [18] Halogenates, assumed in the Hofmeister series to be “neutral”, normally form chemical bonds with the electrode surface, and since they are monoatomic ions, the typical vibrations are M–X (M: metal, X: halogenate) stretching ones. These bands are observed at very low wavenumbers and, because of it, normally are in the region of absorption of the infrared cell window material, so they are observed just at Raman spectroscopy [98,131].
The presence of these ions in the EDL is reported to affect the electrochemical activity of several reactions, such as the oxidation reaction [28,29,116], and even some reduction reactions, such as the oxygen reduction [17]. The reduction reactions are normally observed at potentials more negative than the PZC, and because of it, the anions are expected to be repelled from the electrode surface. However, as shown by Nesselberger and Arenz, some anions, such as phosphate and sulfate, have a maximum surface coverage at potentials in which the ORR is already taking place [17]. In that work, the authors have shown that phosphoric acid adsorbs more and at more negative potentials than sulfate and/or perchlorate, suggesting not only a shift in PZC but also a blocking of active sites at more negative potentials by phosphate anions.
As presented before, the EDL can also present a different pH value than the bulk electrolyte [67,68,69,70,71,72,73]. Since hydronium and hydroxyl ions present vibrational bands, it is obvious that spectroelectrochemistry is also a powerful tool to investigate interfacial pH [27]. For more detailed information, the stretching of the hydronium complexes need also to be considered. The solvated hydronium, the Eigen cation (), has a very short lifetime, so unless the EDL is probed by a high-resolution spectroscopic technique, it will probably not be seen [138]. By contrast, the shared proton, Zundel complex (……), is more stable [138] and possible to be observed in infrared spectroscopy applied to electrochemical systems by the band centered at 1700 cm−1 [7,8,9,28,29,130,139]. It also presents a characteristic stretching mode around 3160 cm−1 [138].
For obtaining more quantitative information about the local pH, the anions present in the electrolyte may be a more efficient probe. Ayemoba and Cuesta presented an interesting investigation on the interfacial pH variation during the reduction in Au electrodes [74] in which the intensity ratio between (2340 cm−1) and bicarbonate (1650 cm−1) related bands was used as a pH indicator based in the Henderson–Hasselbach equation. For such a study, the authors calibrated the system measuring this ratio using different solutions with bias-adjusted pH. The authors varied the cations in the electrolyte and investigated how they affect the reduction. They have shown that for the biggest alkali cations, the ones with the lowest charge density and smaller solvation shells (the most chaotropic ones), the pH increment during the reaction is lower, and the electrochemical activity is higher [74].
Another anion pair that can be used as a pH probe is sulfate/bisulfate. Previous investigations have shown that with an increase in hydronium generation the sulfate-related band (1100 cm−1) decreases, while the symmetric (1000 cm−1) and asymmetric (1250 cm−1) bisulfate ones increase [119]. Investigating these bands, Dourado et al. [132] were able to calibrate an interfacial pH dependence on the bulk titrated pH and proposed a method to investigate the pKa of adsorbed species.
In alkaline media, the anion is hydroxyl (3750 cm−1) [133], and in a similar way as that explained for acidic media, this should not be the only ion presented in the EDL; the cations should also be present. However, these cations do not present vibrational bands by themselves, and normally no cation–electrode as well. In this specific case, it is suggested to further investigate the water-stretching region. In there, bands related to the solvated cations can be observed around 3630 cm−1, which are reported in the literature to be related to a Zundel-like complex involved in the solvation shell of sodium [7,10,140,141,142,143] or potassium ions [9,12,27].
Concepts to keep in mind:
- Spectroelectrochemic techniques can provide the EDL structure evolution during an electrochemical process;
- The water related bands can be deconvoluted and different conformations can be obtained and investigated by them;
- The potential shift of these water bands needs to be taken with care since they can be related to a generation or consumption behavior as well as a Stark shift. Simultaneous consideration of stretching and bending modes is mandatory;
- Anions can also be followed by spectroscopic techniques, and its adsorption can be related to active sites blocking;
- Cations are considered in alkaline media, but due to the lack of natural bands, the water in the solvation shell is responsible for the probing bands.
5. Conclusions
In the present review, the EDL was firstly defined according to classic models for the charged interface and electrolyte interaction, by the historical evolution from Helmholtz’ to Grahame’s model. After that, the EDL properties, such as the PZC and the interfacial pH, are shown and related to the electrochemical activity in catalytic systems. Several electrochemical techniques, such as EIS, RRDE, and SECM, are presented as powerful tools for the chemical investigation and understanding of the EDL relation with electron tunneling and the chemical pathway selectivity.
Finally, all these aspects were related to spectroelectrochemistry, so a molecular-level point of view can be considered for further comprehension of EDL evolution in electrochemical reactions. This text never aimed to be an ultimate contribution to the EDL study; on the contrary, we tried to summarize different points of view on the problem and tried to show the reader how complex, and yet fascinating, it is to study and learn about this interfacial region.
Funding
This research was funded by São Paulo’s Research Foundation (FAPESP), grant number 2020/15230-5 and 2021/09630-3 and Shell’s Research Center for Greenhouse Gas Innovation (RCGI).
Institutional Review Board Statement
Not applicable.
Informed Consent Statement
Not applicable.
Data Availability Statement
Not applicable.
Conflicts of Interest
The author declares no conflict of interest.
Abbreviations
| EDL | electric double layer |
| ϕ | electrode surface potential |
| ψ | EDL potential |
| kB | Boltzmann’s constant |
| T | temperature |
| z | ionic charge number |
| e | electron charge |
| N | atomic population |
| x | EDL thickness |
| κ−1 | Debye length |
| I | ionic strength |
| NA | Avogadro’s constant |
| HL | Helmholtz layer |
| ψh | Helmholtz layer potential |
| xh | Helmholtz layer thickens |
| IHP | inner Helmholtz layer |
| OHP | outer Helmholtz layer |
| PZC | potential of zero charge |
| W | work function |
| Xifp | interfacial parameter |
| F | Faraday’s constant |
| μm | electron’s chemical potential |
| Cdl | double layer capacitance |
| EIS | electrochemical impedance spectroscopy |
| CV | cyclic voltammetry |
| C | capacitance |
| Q | charge |
| E | potential |
| CPE | constant phase element |
| RRDE | rotating ring disk electrode |
| SECM | scanning electrochemical microscopy |
| SEIRAS | surface enhanced infrared absorption spectroscopy |
| SERS | surface enhanced Raman spectroscopy |
| SHINERS | shell-isolated nanoparticle-enhanced Raman spectroscopy |
References
- Huang, J.; Chen, Y. Editorial Overview Surface electrochemistry (2022) The double layer: A persisting issue with emerging trends. Curr. Opin. Electrochem. 2022, 35, 101099. [Google Scholar] [CrossRef]
- Schmickler, W. Double Layer Theory. J. Solid State Electrochem. 2020, 24, 2175–2176. [Google Scholar] [CrossRef] [Green Version]
- Fawcett, W.R. Fifty Years of Studies of Double Layer Effects in Electrode Kinetics—A Personal View. J. Solid State Electrochem. 2011, 15, 1347–1358. [Google Scholar] [CrossRef] [Green Version]
- Jacob, T.; Sabo, L. Electrochemical Double Layer Modeling Electrified Interfaces; Elsevier: Amsterdam, The Netherlands, 2018. [Google Scholar]
- Haid, R.W.; Ding, X.; Sarpey, T.K.; Bandarenka, A.S.; Garlyyev, B. Exploration of the Electrical Double-Layer Structure: Influence of Electrolyte Components on the Double-Layer Capacitance and Potential of Maximum Entropy. Curr. Opin. Electrochem. 2022, 32, 100882. [Google Scholar] [CrossRef]
- Stamenkovic, V.R.; Strmcnik, D.; Lopes, P.P.; Markovic, N.M. Energy and Fuels from Electrochemical Interfaces. Nat. Mater. 2016, 16, 57–69. [Google Scholar] [CrossRef] [PubMed]
- Ataka, K.; Yotsuyanagi, T.; Osawa, M. Potential-Dependent Reorientation of Water Molecules at an Electrode/Electrolyte Interface Studied by Surface-Enhanced Infrared Absorption Spectroscopy. J. Phys. Chem. 1996, 100, 10664–10672. [Google Scholar] [CrossRef]
- Garcia-Araez, N.; Rodriguez, P.; Navarro, V.; Bakker, H.J.; Koper, M.T.M. Structural Effects on Water Adsorption on Gold Electrodes. J. Phys. Chem. C 2011, 115, 21249–21257. [Google Scholar] [CrossRef]
- Garcia-Araez, N.; Rodriguez, P.; Bakker, H.J.; Koper, M.T.M. Effect of the Surface Structure of Gold Electrodes on the Coadsorption of Water and Anions. J. Phys. Chem. C 2012, 116, 4786–4792. [Google Scholar] [CrossRef]
- Wandlowski, T.; Ataka, K.; Pronkin, S.; Diesing, D. Surface Enhanced Infrared Spectroscopy—Au(1 1 1–20 Nm)/Sulphuric Acid—New Aspects and Challenges. Electrochim. Acta 2004, 49, 1233–1247. [Google Scholar] [CrossRef]
- Li, C.-Y.; Le, J.-B.; Wang, Y.-H.; Chen, S.; Yang, Z.-L.; Li, J.-F.; Cheng, J.; Tian, Z.-Q. In Situ Probing Electrified Interfacial Water Structures at Atomically Flat Surfaces. Nat. Mater. 2019, 18, 697–701. [Google Scholar] [CrossRef]
- Chen, X.; McCrum, I.T.; Schwarz, K.A.; Janik, M.J.; Koper, M.T.M. Co-Adsorption of Cations as the Cause of the Apparent PH Dependence of Hydrogen Adsorption on a Stepped Platinum Single-Crystal Electrode. Angew. Chem. Int. Ed. 2017, 56, 15025–15029. [Google Scholar] [CrossRef]
- Velasco-Velez, J.J.; Wu, C.H.; Pascal, T.A.; Wan, L.F.; Guo, J.; Prendergast, D.; Salmeron, M. The Structure of Interfacial Water on Gold Electrodes Studied by X-ray Absorption Spectroscopy. Science 2014, 346, 831–834. [Google Scholar] [CrossRef] [PubMed]
- Favaro, M.; Jeong, B.; Ross, P.N.; Yano, J.; Hussain, Z.; Liu, Z.; Crumlin, E.J. Unravelling the Electrochemical Double Layer by Direct Probing of the Solid/Liquid Interface. Nat. Commun. 2016, 7, 12695. [Google Scholar] [CrossRef] [PubMed]
- Shin, S.; Kim, D.H.; Ringe, S. Electric Double Layer Structure in Aqueous Electrolyte and Its Electrocatalytic Importance. Research Square, 2021; preprint. [Google Scholar] [CrossRef]
- Ledezma-Yanez, I.; Wallace, W.D.Z.; Sebastián-Pascual, P.; Climent, V.; Feliu, J.M.; Koper, M.T.M. Interfacial Water Reorganization as a PH-Dependent Descriptor of the Hydrogen Evolution Rate on Platinum Electrodes. Nat. Energy 2017, 2, 17031. [Google Scholar] [CrossRef] [Green Version]
- Nesselberger, M.; Arenz, M. In Situ FTIR Spectroscopy: Probing the Electrochemical Interface during the Oxygen Reduction Reaction on a Commercial Platinum High-Surface-Area Catalyst. ChemCatChem 2016, 8, 1125–1131. [Google Scholar] [CrossRef] [Green Version]
- Moraes, I.R.; da Cunha, M.C.P.M.; Nart, F.C. Vibrational Spectroscopy of Adsorbed Sulfate and Nitrate Ions on Au(100) Electrodes. J. Braz. Chem. Soc. 1996, 7, 453–460. [Google Scholar] [CrossRef]
- Martins, V.L.; Neves, H.R.; Monje, I.E.; Leite, M.M.; de Oliveira, P.F.M.; Antoniassi, R.M.; Chauque, S.; Morais, W.G.; Melo, E.C.; Obana, T.T.; et al. An Overview on the Development of Electrochemical Capacitors and Batteries—Part I. An. Acad. Bras. Cienc. 2020, 92, 1–28. [Google Scholar] [CrossRef]
- Sagadevan, S.; Marlinda, A.R.; Chowdhury, Z.Z.; Wahab, Y.B.A.; Hamizi, N.A.; Shahid, M.M.; Mohammad, F.; Podder, J.; Johan, M.R. Fundamental Electrochemical Energy Storage Systems. In Advances in Supercapacitor and Supercapattery: Innovations in Energy Storage Devices; Elsevier: Amsterdam, The Netherlands, 2020; pp. 27–43. ISBN 9780128198971. [Google Scholar]
- Sagadevan, S.; Johan, M.R.; Marlinda, A.R.; Akbarzadeh, O.; Pandian, K.; Shahid, M.M.; Mohammad, F.; Podder, J. Background of Energy Storage. In Advances in Supercapacitor and Supercapattery: Innovations in Energy Storage Devices; Elsevier: Amsterdam, The Netherlands, 2020; pp. 1–26. ISBN 9780128198971. [Google Scholar]
- Bashir, S.; Chong, M.Y.; Hina, M.; Kamran, K.; Ramesh, S.; Ramesh, K. Aqueous Solid and Gel Electrolytes for Supercapattery. In Advances in Supercapacitor and Supercapattery: Innovations in Energy Storage Devices; Elsevier: Amsterdam, The Netherlands, 2020; pp. 271–310. ISBN 9780128198971. [Google Scholar]
- Wu, J. Understanding the Electric Double-Layer Structure, Capacitance, and Charging Dynamics. Chem. Rev. 2022, 122, 10821–10859. [Google Scholar] [CrossRef]
- Drab, M.; Kralj-Iglič, V. Electric Double Layer of Electrons: Attraction between Two like-Charged Surfaces Induced by Fermi–Dirac Statistics. Phys. Lett. A 2019, 383, 358–365. [Google Scholar] [CrossRef]
- Drab, M.; Kralj-Iglič, V. Diffuse Electric Double Layer in Planar Nanostructures Due to Fermi-Dirac Statistics. Electrochim. Acta 2016, 204, 154–159. [Google Scholar] [CrossRef]
- Du, H.; Lin, X.; Xu, Z.; Chu, D. Electric Double-Layer Transistors: A Review of Recent Progress. J. Mater. Sci. 2015, 50, 5641–5673. [Google Scholar] [CrossRef]
- De Rodrigues, M.P.S.; Dourado, A.H.B.; de Cutolo, L.O.; Parreira, L.S.; Alves, T.V.; Slater, T.J.A.; Haigh, S.J.; Camargo, P.H.C.; Cordoba de Torresi, S.I. Gold–Rhodium Nanoflowers for the Plasmon-Enhanced Hydrogen Evolution Reaction under Visible Light. ACS Catal. 2021, 11, 13543–13555. [Google Scholar] [CrossRef]
- Dourado, A.H.B.; Silva, N.A.; Munhos, R.L.; del Colle, V.; Arenz, M.; Varela, H.; Córdoba de Torresi, S.I. Influence of Anion Chaotropicity on the SO2 Oxidation Reaction: When Spectator Species Determine the Reaction Pathway. ChemElectroChem 2020, 7, 1843–1850. [Google Scholar] [CrossRef]
- Dourado, A.H.B.; Munhos, R.L.; Silva, N.A.; del Colle, V.; Carvalho, G.G.A.; Oliveira, P.V.; Arenz, M.; Varela, H.; Córdoba de Torresi, S.I. Opportunities and Knowledge Gaps of SO2 Electrocatalytic Oxidation for H2 Electrochemical Generation. ACS Catal. 2019, 9, 8136–8143. [Google Scholar] [CrossRef]
- Lamoureux, P.S.; Singh, A.R.; Chan, K. PH Effects on Hydrogen Evolution and Oxidation over Pt(111): Insights from First-Principles. ACS Catal. 2019, 9, 6194–6201. [Google Scholar] [CrossRef]
- Zheng, Y.; Jiao, Y.; Vasileff, A.; Qiao, S.Z. The Hydrogen Evolution Reaction in Alkaline Solution: From Theory, Single Crystal Models, to Practical Electrocatalysts. Angew. Chem. Int. Ed. 2018, 57, 7568–7579. [Google Scholar] [CrossRef] [PubMed]
- Barnes, C.T.; Gentle, I.R. Interfacial Science: An Introduction, 2nd ed.; Oxford Press: New York, NY, USA, 2010. [Google Scholar]
- Bard, A.J.; Faulkner, L.R. Electrochemical Methods: Fundamentals and Applications, 2nd ed.; John Wiley & Sons: New York, NY, USA, 2001. [Google Scholar]
- Damaskin, B.; Petri, O. Fundamentos de Eletroquímica Teórica, 1st ed.; Mir: Moscow, Russia, 1985. [Google Scholar]
- Bockris, J.O.; Reddy, A.K.N. Modern Electrochemistry 1, 2nd ed.; Kluwer Academic Publishers: Boston, MA, USA, 2002; ISBN 0-306-45554-4. [Google Scholar]
- Grahame, D.C. The Electrical Double Layer and the Theory of Electrocapillarity. Chem. Rev. 1947, 41, 441–501. [Google Scholar] [CrossRef] [PubMed]
- Petrii, O.A. Zero Charge Potentials of Platinum Metals and Electron Work Functions (Review). Russ. J. Electrochem. 2013, 49, 401–422. [Google Scholar] [CrossRef]
- Trasatti, S. Work Function, Electronegativity, and Electrochemical Behaviour of Metals. II. Potentials of Zero Charge and “Electrochemical” Work Functions. J. Electroanal. Chem. 1971, 33, 351–378. [Google Scholar] [CrossRef]
- Nitopi, S.; Bertheussen, E.; Scott, S.B.; Liu, X.; Engstfeld, A.K.; Horch, S.; Seger, B.; Stephens, I.E.L.; Chan, K.; Hahn, C.; et al. Progress and Perspectives of Electrochemical CO2 Reduction on Copper in Aqueous Electrolyte. Chem. Rev. 2019, 119, 7610–7672. [Google Scholar] [CrossRef] [Green Version]
- Verdaguer-Casadevall, A.; Li, C.W.; Johansson, T.P.; Scott, S.B.; McKeown, J.T.; Kumar, M.; Stephens, I.E.L.; Kanan, M.W.; Chorkendorff, I. Probing the Active Surface Sites for CO Reduction on Oxide-Derived Copper Electrocatalysts. J. Am. Chem. Soc. 2015, 137, 9808–9811. [Google Scholar] [CrossRef] [PubMed]
- Li, C.W.; Kanan, M.W. CO2 Reduction at Low Overpotential on Cu Electrodes Resulting from the Reduction of Thick Cu2O Films. J. Am. Chem. Soc. 2012, 134, 7231–7234. [Google Scholar] [CrossRef] [PubMed]
- Schalenbach, M.; Durmus, Y.E.; Tempel, H.; Kungl, H.; Eichel, R.A. Double Layer Capacitances Analysed with Impedance Spectroscopy and Cyclic Voltammetry: Validity and Limits of the Constant Phase Element Parameterization. Phys. Chem. Chem. Phys. 2021, 23, 21097–21105. [Google Scholar] [CrossRef]
- Schalenbach, M.; Durmus, Y.E.; Robinson, S.A.; Tempel, H.; Kungl, H.; Eichel, R.A. Physicochemical Mechanisms of the Double-Layer Capacitance Dispersion and Dynamics: An Impedance Analysis. J. Phys. Chem. C 2021, 125, 5870–5879. [Google Scholar] [CrossRef]
- Schalenbach, M.; Durmus, Y.E.; Tempel, H.; Kungl, H.; Eichel, R.A. The Role of the Double Layer for the Pseudocapacitance of the Hydrogen Adsorption on Platinum. Sci. Rep. 2022, 12, 3375. [Google Scholar] [CrossRef] [PubMed]
- Morales, D.M.; Risch, M. Seven Steps to Reliable Cyclic Voltammetry Measurements for the Determination of Double Layer Capacitance. J. Phys. Energy 2021, 3, 034013. [Google Scholar] [CrossRef]
- Gharbi, O.; Tran, M.T.T.; Tribollet, B.; Turmine, M.; Vivier, V. Revisiting Cyclic Voltammetry and Electrochemical Impedance Spectroscopy Analysis for Capacitance Measurements. Electrochim. Acta 2020, 343, 136109. [Google Scholar] [CrossRef]
- Alexander, C.L.; Tribollet, B.; Orazem, M.E.; Vivier, V.; Orazem, M.E. Contribution of Surface Distributions to Constant-Phase-Element (CPE) Behavior: 1. Influence of Roughness. Electrochim. Acta 2015, 173, 99–108. [Google Scholar] [CrossRef]
- Córdoba-Torres, P. A Generalized Expression for the Resistivity Distribution in Films: From the Young Model to Constant-Phase Element (CPE) Behavior. Electrochim. Acta 2017, 241, 535–543. [Google Scholar] [CrossRef]
- Córdoba-Torres, P. Relationship between Constant-Phase Element (CPE) Parameters and Physical Properties of Films with a Distributed Resistivity. Electrochim. Acta 2017, 225, 592–604. [Google Scholar] [CrossRef]
- Du, H.; Lin, X.; Xu, Z.; Chu, D. A Review of Molecular Modelling of Electric Double Layer Capacitors. Phys. Chem. Chem. Phys. 2014, 16, 6519–6538. [Google Scholar]
- Brug, G.J.; van den Eeden, A.L.G.; Sluyters-Rehbach, M.; Sluyters, J.H. The Analysis of Electrode Impedances Complicated by the Presence of a Constant Phase Element. J. Electroanal. Chem. Interfacial Electrochem. 1984, 176, 275–295. [Google Scholar] [CrossRef]
- Xue, S.; Garlyyev, B.; Auer, A.; Kunze-Liebhäuser, J.; Bandarenka, A.S. How the Nature of the Alkali Metal Cations Influences the Double-Layer Capacitance of Cu, Au, and Pt Single-Crystal Electrodes. J. Phys. Chem. C 2020, 124, 12442–12447. [Google Scholar] [CrossRef]
- Ninham, B.W.; Duignan, T.T.; Parsons, D.F. Approaches to Hydration, Old and New: Insights through Hofmeister Effects. Curr. Opin. Colloid Interface Sci. 2011, 16, 612–617. [Google Scholar] [CrossRef]
- Schwierz, N.; Horinek, D.; Sivan, U.; Netz, R.R. Reversed Hofmeister Series—The Rule Rather than the Exception. Curr. Opin. Colloid Interface Sci. 2016, 23, 10–18. [Google Scholar] [CrossRef]
- Gibb, B.C. Hofmeister’s Curse. Nat. Chem. 2019, 11, 963–965. [Google Scholar] [CrossRef]
- Kunz, W.; Henle, J.; Ninham, B.W. “Zur Lehre von Der Wirkung Der Salze” (about the Science of the Effect of Salts): Franz Hofmeister’s Historical Papers. Curr. Opin. Colloid Interface Sci. 2004, 9, 19–37. [Google Scholar] [CrossRef]
- Zhao, L.; Damodaran, S. Hofmeister Order of Anions on Protein Stability Originates from Lifshitz-van Der Waals Dispersion Interaction with the Protein Phase. Langmuir 2019, 35, 12993–13002. [Google Scholar] [CrossRef]
- Iamprasertkun, P.; Hirunpinyopas, W.; Keerthi, A.; Wang, B.; Radha, B.; Bissett, M.A.; Dryfe, R.A.W. Capacitance of Basal Plane and Edge-Oriented Highly Ordered Pyrolytic Graphite: Specific Ion Effects. J. Phys. Chem. Lett. 2019, 10, 617–623. [Google Scholar] [CrossRef]
- Pajkossy, T.; Kolb, D.M. Anion-Adsorption-Related Frequency-Dependent Double Layer Capacitance of the Platinum-Group Metals in the Double Layer Region. Electrochim. Acta 2008, 53, 7403–7409. [Google Scholar] [CrossRef]
- Zhu, J.; Le, J.; Koper, M.T.M.; Doblhoff-Dier, K.; Cheng, J. Effects of Adsorbed OH on Pt(100)/Water Interfacial Structures and Potential. J. Phys. Chem. C 2021, 125, 21571–21579. [Google Scholar] [CrossRef]
- Climent, V.; Feliu, J.M. Surface Electrochemistry with Pt Single-Crystal Electrodes. In Advances in Electrochemical Science and Engineering: Nanopatterned and Nanoparticle-Modified Electrodes; Elsevier: Amsterdam, The Netherlands, 2017; pp. 1–57. ISBN 9783527340934. [Google Scholar]
- Marković, N.M.; Adžić, R.R.; Cahan, B.D.; Yeager, E.B. Structural Effects in Electrocatalysis: Oxygen Reduction on Platinum Low Index Single-Crystal Surfaces in Perchloric Acid Solutions. J. Electroanal. Chem. 1994, 377, 249–259. [Google Scholar] [CrossRef]
- Attard, G.A.; Brew, A.; Hunter, K.; Sharman, J.; Wright, E. Specific Adsorption of Perchlorate Anions on Pt{hkl} Single Crystal Electrodes. Phys. Chem. Chem. Phys. 2014, 16, 13689–13698. [Google Scholar] [CrossRef] [Green Version]
- Perry, S.C.; Denuault, G. The Oxygen Reduction Reaction (ORR) on Reduced Metals: Evidence for a Unique Relationship between the Coverage of Adsorbed Oxygen Species and Adsorption Energy. Phys. Chem. Chem. Phys. 2016, 18, 10218–10223. [Google Scholar] [CrossRef] [PubMed] [Green Version]
- Gubanova, E.; Schmidt, T.O.; Watzele, S.; Alexandrov, V.; Bandarenka, A.S. Structure-Dependent Electrical Double-Layer Capacitances of the Basal Plane Pd(Hkl) Electrodes in HClO4. J. Phys. Chem. C 2022, 126, 11414–11420. [Google Scholar] [CrossRef]
- Watzele, S.A.; Katzenmeier, L.; Sabawa, J.P.; Garlyyev, B.; Bandarenka, A.S. Temperature Dependences of the Double Layer Capacitance of Some Solid/Liquid and Solid/Solid Electrified Interfaces. An Experimental Study. Electrochim. Acta 2021, 391, 138969. [Google Scholar] [CrossRef]
- Wu, J.; Zheng, W.; Chen, Y. Factors Affecting the Cathode/Electrolyte Interfacial PH Change during Water Reduction: A Simulation Study. Int. J. Hydrogen Energy 2022, 47, 18597–18605. [Google Scholar] [CrossRef]
- Monteiro, M.C.O.; Koper, M.T.M. Measuring Local PH in Electrochemistry. Curr. Opin. Electrochem. 2021, 25, 100649. [Google Scholar] [CrossRef]
- Henckel, D.A.; Counihan, M.J.; Holmes, H.E.; Chen, X.; Nwabara, U.O.; Verma, S.; Rodríguez-López, J.; Kenis, P.J.A.; Gewirth, A.A. Potential Dependence of the Local PH in a CO2 Reduction Electrolyzer. ACS Catal. 2021, 11, 255–263. [Google Scholar] [CrossRef]
- Jong, M.; Sleegers, N.; Schram, J.; Daems, D.; Florea, A.; de Wael, K. A Benzocaine-Induced Local Near-Surface PH Effect: Influence on the Accuracy of Voltammetric Cocaine Detection. Anal. Sens. 2021, 1, 54–62. [Google Scholar] [CrossRef]
- Varela, A.S.; Kroschel, M.; Reier, T.; Strasser, P. Controlling the Selectivity of CO2 electroreduction on Copper: The Effect of the Electrolyte Concentration and the Importance of the Local PH. Catal. Today 2016, 260, 8–13. [Google Scholar] [CrossRef]
- Wang, X.; Xu, C.; Jaroniec, M.; Zheng, Y.; Qiao, S.Z. Anomalous Hydrogen Evolution Behavior in High-PH Environment Induced by Locally Generated Hydronium Ions. Nat. Commun. 2019, 10, 4876. [Google Scholar] [CrossRef] [PubMed] [Green Version]
- Zülke, A.; Perroni, P.; Machado, E.G.; Varela, H. Rrde Studies of Glycerol Electro-Oxidation: Local PH Variation and Oscillatory Dynamics. ECS Trans. 2017, 77, 1643–1650. [Google Scholar] [CrossRef]
- Ayemoba, O.; Cuesta, A. Spectroscopic Evidence of Size-Dependent Buffering of Interfacial PH by Cation Hydrolysis during CO2 Electroreduction. ACS Appl. Mater. Interfaces 2017, 9, 27377–27382. [Google Scholar] [CrossRef] [PubMed] [Green Version]
- Barrozo, A.V.; Benedetti, S. Compreensão Matemática Da Difusão No Contexto Eletroquímico. Quim. Nova 2016, 39, 356–370. [Google Scholar] [CrossRef]
- Southampton Electrochemistry Group. Convective Diffusion Systems—The Rotating Disc and Ring-Disc Electrodes. In Instrumental Methods in Electrochemistry; Ellis Horwood Limired: West Sussex, UK, 1990; pp. 113–148. [Google Scholar]
- Albery, W.J.; Hitchman, M.L. Ring-Disc Electrodes, 1st ed.; Oxford University Press: London, UK, 1971. [Google Scholar]
- Miller, B.; Bruckenstein, S. Hydrodynamic Potentiometry and Amperometry at Ring-Disk Electrodes. J. Electrochem. Soc. 1970, 117, 1032–1039. [Google Scholar] [CrossRef]
- Popović, N.D.; Johnson, D.C. A Ring−Disk Study of the Competition between Anodic Oxygen-Transfer and Dioxygen-Evolution Reactions. Anal. Chem. 1998, 70, 468–472. [Google Scholar] [CrossRef]
- Albery, W.J.; Calvo, E.J. Ring–Disc Electrodes. Part 21—PH Measurement with the Ring. J. Chem. Soc. Faraday Trans. 1 1983, 79, 2583. [Google Scholar] [CrossRef]
- Hessami, S.; Tobias, C.W. In-situ Measurement of Interfacial PH Using a Rotating Ring-disk Electrode. AIChE J. 1993, 39, 149–162. [Google Scholar] [CrossRef]
- Zimer, A.M.; Medina da Silva, M.; Machado, E.G.; Varela, H.; Mascaro, L.H.; Pereira, E.C. Development of a Versatile Rotating Ring-Disc Electrode for in Situ PH Measurements. Anal. Chim. Acta 2015, 897, 17–23. [Google Scholar] [CrossRef] [PubMed]
- Steegstra, P.; Ahlberg, E. In Situ PH Measurements with Hydrous Iridium Oxide in a Rotating Ring Disc Configuration. J. Electroanal. Chem. 2012, 685, 1–7. [Google Scholar] [CrossRef] [Green Version]
- Vos, J.G.; Koper, M.T.M. Examination and Prevention of Ring Collection Failure during Gas-Evolving Reactions on a Rotating Ring-Disk Electrode. J. Electroanal. Chem. 2019, 850, 113363. [Google Scholar] [CrossRef]
- Bard, A.J.; Fan, F.F.; Kwak, J.; Lev, O. Scanning Electrochemical Microscopy. Introduction and Principles. Anal. Chem. 1989, 61, 132–138. [Google Scholar] [CrossRef]
- Davis, J.M.; Fan, F.-R.F.; Bard, A.J. Currents in thin layer electrochemical cells with spherical and conical electrodes. J. Electroanal. Chem. 1987, 238, 9–31. [Google Scholar] [CrossRef]
- Kwak, J.; Bard, A.J. Scanning Electrochemical Microscopy. Theory of the Feedback Mode. Anal. Chem. 1989, 61, 1221–1227. [Google Scholar] [CrossRef]
- Zoski, C.G. Scanning Electrochemical Microscopy. In Encyclopedia of Analytical Chemistry; John Wiley & Sons, Ltd.: Hoboken, NJ, USA, 2009. [Google Scholar]
- Zhi, F.; Lu, X.; Yang, J.; Wang, X.; Shang, H.; Zhang, S.; Xue, Z. Selective Anion Sensing through a Self-Assembled Monolayer of Thiol-End-Functionalized Porphyrin. J. Phys. Chem. C 2009, 113, 13166–13172. [Google Scholar] [CrossRef]
- Kwak, J.; Bard, A.J. Scanning Electrochemical Microscopy. Apparatus and Two-Dimensional Scans of Conductive and Insulating Substrates. Anal. Chem. 1989, 61, 1794–1799. [Google Scholar] [CrossRef]
- Huang, V.M.; Wu, S.L.; Orazem, M.E.; Pébre, N.; Tribollet, B.; Vivier, V. Local Electrochemical Impedance Spectroscopy: A Review and Some Recent Developments. Electrochim. Acta 2011, 56, 8048–8057. [Google Scholar] [CrossRef] [Green Version]
- Ochoa, N.; Moran, F.; Pébère, N.; Tribollet, B. Influence of Flow on the Corrosion Inhibition of Carbon Steel by Fatty Amines in Association with Phosphonocarboxylic Acid Salts. Corros. Sci. 2005, 47, 593–604. [Google Scholar] [CrossRef]
- Noël, J.-M.; Kanoufi, F. Probing the Reactive Intermediate Species Generated during Electrocatalysis by Scanning Electrochemical Microscopy. Curr. Opin. Electrochem. 2022, 35, 101071. [Google Scholar] [CrossRef]
- Trinh, D.; Keddam, M.; Novoa, X.R.; Vivier, V. Alternating Current Measurements in Scanning Electrochemical Microscopy, Part 2: Detection of Adsorbates. ChemPhysChem 2011, 12, 2177–2183. [Google Scholar] [CrossRef] [PubMed]
- Wittstock, G.; Burchardt, M.; Pust, S.E.; Shen, Y.; Zhao, C. Scanning Electrochemical Microscopy for Direct Imaging of Reaction Rates. Angew. Chem. Int. Ed. Engl. 2007, 46, 1584–1617. [Google Scholar] [CrossRef] [PubMed]
- Wang, W.; Li, X.; Wang, X.; Shang, H.; Liu, X.; Lu, X. Comparative Electrochemical Behaviors of a Series of SH-Terminated-Functionalized Porphyrins Assembled on a Gold Electrode by Scanning Electrochemical Microscopy (SECM). J. Phys. Chem. B 2010, 114, 10436–10441. [Google Scholar] [CrossRef]
- Trinh, D.; Keddam, M.; Novoa, X.R.; Vivier, V. Alternating-Current Measurements in Scanning Electrochemical Microscopy, Part 1: Principle and Theory. ChemPhysChem 2011, 12, 2169–2176. [Google Scholar] [CrossRef] [PubMed]
- Brolo, A.G.; Germain, P.; Hager, G. Investigation of the Adsorption of L-Cysteine on a Polycrystalline Silver Electrode by Surface-Enhanced Raman Scattering (SERS) and Surface-Enhanced Second Harmonic Generation (SESHG). J. Phys. Chem. B 2002, 106, 5982–5987. [Google Scholar] [CrossRef]
- Mendes, R.K.; Freire, R.S.; Fonseca, C.P.; Neves, S.; Kubota, L.T. Characterization of Self-Assembled Thiols Monolayers on Gold Surface by Electrochemical Impedance Spectroscopy. J. Braz. Chem. Soc. 2004, 15, 849–855. [Google Scholar] [CrossRef] [Green Version]
- Björneholm, O.; Hansen, M.H.; Hodgson, A.; Liu, L.M.; Limmer, D.T.; Michaelides, A.; Pedevilla, P.; Rossmeisl, J.; Shen, H.; Tocci, G.; et al. Water at Interfaces. Chem. Rev. 2016, 116, 7698–7726. [Google Scholar] [CrossRef]
- Jensen, K.D.; Tymoczko, J.; Rossmeisl, J.; Bandarenka, A.; Chorkendorff, I.; Escudero-Escribano, M.; Stephens, I.E.L. Elucidation of the Oxygen Reduction Volcano in Alkaline Media Using a Copper-Platinum(111) Alloy. Angew. Chem. Int. Ed. 2018, 57, 2800–2805. [Google Scholar] [CrossRef]
- Zana, A.; Wiberg, G.K.H.; Deng, Y.; Østergaard, T.; Rossmeisl, J.; Arenz, M. Accessing the Inaccessible: Analyzing the Oxygen Reduction Reaction in the Diffusion Limit. ACS Appl. Mater. Interfaces 2017, 9, 38176–38180. [Google Scholar] [CrossRef]
- Sebastián-Pascual, P.; Petersen, A.S.; Bagger, A.; Rossmeisl, J.; Escudero-Escribano, M. PH and Anion Effects on Cu–Phosphate Interfaces for CO Electroreduction. ACS Catal. 2021, 1128–1135. [Google Scholar] [CrossRef]
- Rossmeisl, J.; Chan, K.; Skúlason, E.; Björketun, M.E.; Tripkovic, V. On the PH Dependence of Electrochemical Proton Transfer Barriers. Catal. Today 2016, 262, 36–40. [Google Scholar] [CrossRef]
- Tripkovic, V.; Björketun, M.E.; Skúlason, E.; Rossmeisl, J. Standard Hydrogen Electrode and Potential of Zero Charge in Density Functional Calculations. Phys. Rev. B Condens. Matter Mater. Phys. 2011, 84, 115452. [Google Scholar] [CrossRef] [Green Version]
- Timoshenko, J.; Roldan Cuenya, B. In Situ/Operando Electrocatalyst Characterization by X-ray Absorption Spectroscopy. Chem. Rev. 2021, 121, 882–961. [Google Scholar] [CrossRef]
- Mesa, C.A.; Pastor, E.; Francàs, L. UV-Vis Operando Spectroelectrochemistry for (Photo)Electrocatalysis: Principles and Guidelines. Curr. Opin. Electrochem. 2022, 35, 101098. [Google Scholar] [CrossRef]
- Cuesta, A. ATR-SEIRAS for Time-Resolved Studies of Electrode–Electrolyte Interfaces. Curr. Opin. Electrochem. 2022, 35, 101041. [Google Scholar] [CrossRef]
- Yu, A.; Chen, W.; Chen, Y.-X.; Zhu, B.-Q.; Sun, Z.-J.; Cai, J. Probing Complex Electrocatalytic Reactions Using Electrochemical in Situ Infrared Spectroscopy. Curr. Opin. Electrochem. 2019, 14, 113–123. [Google Scholar] [CrossRef]
- Wang, H.; Zhou, Y.-W.; Cai, W.-B. Recent Applications of in Situ ATR-IR Spectroscopy in Interfacial Electrochemistry. Curr. Opin. Electrochem. 2017, 1, 73–79. [Google Scholar] [CrossRef]
- Sanghapi, A.; Ramakrishan, S.; Fan, S.; Shannon, C. InSitu Characterization of Bipolar Electrodes by Using Vibrational Stark Spectroscopy and Surface-Enhanced Raman Spectroelectrochemistry. ChemElectroChem 2016, 3, 436–440. [Google Scholar] [CrossRef]
- Kaim, W.; Fiedler, J. Spectroelectrochemistry: The Best of Two Worlds. Chem. Soc. Rev. 2009, 38, 3373–3382. [Google Scholar] [CrossRef] [PubMed]
- Scherson, D.A.; Tolmachev, Y.V.; Stefan, I.C. Ultraviolet/Visible Spectroelectrochemistry; John Wiley & Sons, Ltd.: Hoboken, NJ, USA, 2006; pp. 10172–10225. [Google Scholar]
- Dourado, A.H.B.; Arenz, M.; Córdoba de Torresi, S.I. Mechanism of Electrochemical L-Cysteine Oxidation on Pt. ChemElectroChem 2019, 6, 1009–1013. [Google Scholar] [CrossRef]
- Blizanac, B.B.; Lucas, C.A.; Gallagher, M.E.; Arenz, M.; Ross, P.N.; Marković, N.M. Anion Adsorption, CO Oxidation, and Oxygen Reduction Reaction on a Au(100) Surface: The PH Effect. J. Phys. Chem. B 2004, 108, 625–634. [Google Scholar] [CrossRef]
- Dourado, A.H.B.; del Colle, V.; Munhos, R.L.; Feliu, J.M.; Varela, H.; de Torresi, S.I.C. SO2 Electrooxidation Reaction on Pt Single Crystal Surfaces in Acidic Media: Electrochemical and in Situ FTIR Studies. Electrochim. Acta 2022, 403, 139601. [Google Scholar] [CrossRef]
- Dourado, A.H.B.; da Silva, A.G.M.; Pastrián, F.A.C.; Munhos, R.L.; de Lima Batista, A.P.; de Oliveira-Filho, A.G.S.; Quiroz, J.; de Oliveira, D.C.; Camargo, P.H.C.; Córdoba de Torresi, S.I. In Situ FTIR Insights into the Electrooxidation Mechanism of Glucose as a Function of the Surface Facets of Cu2O-Based Electrocatalytic Sensors. J. Catal. 2019, 375, 95–103. [Google Scholar] [CrossRef]
- Pastrián, F.A.C.; da Silva, A.G.M.; Dourado, A.H.B.; de Lima Batista, A.P.; de Oliveira-Filho, A.G.S.; Quiroz, J.; de Oliveira, D.C.; Camargo, P.H.C.; Córdoba de Torresi, S.I. Why Could the Nature of Surface Facets Lead to Differences in the Activity and Stability of Cu2O-Based Electrocatalytic Sensors? ACS Catal. 2018, 8, 6265–6272. [Google Scholar] [CrossRef]
- Dourado, A.H.B.; de Lima Batista, A.P.; Oliveira-Filho, A.G.S.; Sumodjo, P.T.A.; Cordoba de Torresi, S.I. L-Cysteine Electrooxidation in Alkaline and Acidic Media: A Combined Spectroelectrochemical and Computational Study. RSC Adv. 2017, 7, 7492–7501. [Google Scholar] [CrossRef] [Green Version]
- Osawa, M.; Ataka, K.; Yoshii, K.; Yotsuyanagi, T. Surface-Enhanced Infrared ATR Spectroscopy for in Situ Studies of Electrode/Electrolyte Interfaces. J. Electron. Spectros Relat. Phenomena 1993, 64–65, 371–379. [Google Scholar] [CrossRef]
- Hoffmann, F. Infrared Reflection-Absorption Spectroscopy of Adsorbed Molecules. Surf. Sci. Rep. 1983, 3, 107. [Google Scholar] [CrossRef]
- Chabal, Y.J. Surface Infrared Spectroscopy. Surf. Sci. Rep. 1988, 8, 211–357. [Google Scholar] [CrossRef]
- Osawa, M.; Ataka, K.I.; Yoshii, K.; Nishikawa, Y. Surface-Enhanced Infrared Spectroscopy: The Origin of the Absorption Enhancement and Band Selection Rule in the Infrared Spectra of Molecules Adsorbed on Fine Metal Particles. Appl. Spectrosc. 1993, 47, 1497–1502. [Google Scholar] [CrossRef]
- Ras, R.H.A.; Schoonheydt, R.A.; Johnston, C.T. Relation between S-Polarized and p-Polarized Internal Reflection Spectra: Application for the Spectral Resolution of Perpendicular Vibrational Modes. J. Phys. Chem. A 2007, 111, 8787–8791. [Google Scholar] [CrossRef]
- Cai, W.-B.; Ren, B.; Li, X.Q.; She, C.X.; Liu, F.M.; Cai, X.W.; Tian, Z.-Q. Investigation of Surface-Enhanced Raman Scattering from Platinum Electrodes Using a Confocal Raman Microscope: Dependence of Surface Roughening Pretreatment. Surf. Sci. 1998, 406, 9–22. [Google Scholar] [CrossRef]
- Tian, Z.; Ren, B. Infrared and Raman Spectroscopy in Analysis of Surfaces. In Encyclopedia of Analytical Chemistry; John Wiley & Sons, Ltd.: Hoboken, NJ, USA, 2006; pp. 1–40. ISBN 9780470027318. [Google Scholar]
- Xie, W.; Schlücker, S. Rationally Designed Multifunctional Plasmonic Nanostructures for Surface-Enhanced Raman Spectroscopy: A Review. Rep. Prog. Phys. 2014, 77, 116502. [Google Scholar] [CrossRef]
- Tian, Z.-Q.; Ren, B.; Li, J.-F.; Yang, Z.-L. Expanding Generality of Surface-Enhanced Raman Spectroscopy with Borrowing SERS Activity Strategy. Chem. Commun. 2007, 34, 3514–3534. [Google Scholar] [CrossRef] [PubMed] [Green Version]
- Nakamura, M.; Kato, H.; Hoshi, N. Infrared Spectroscopy of Water Adsorbed on M(111) (M = Pt, Pd, Rh, Au, Cu) Electrodes in Sulfuric Acid Solution. J. Phys. Chem. C 2008, 112, 9458–9463. [Google Scholar] [CrossRef]
- Osawa, M.; Tsushima, M.; Mogami, H.; Samjeské, G.; Yamakata, A. Structure of Water at the Electrified Platinum-Water Interface: A Study by Surface-Enhanced Infrared Absorption Spectroscopy. J. Phys. Chem. C 2008, 112, 4248–4256. [Google Scholar] [CrossRef]
- Shen, A.; Pemberton, J.E. Investigation of Trace Interfacial Water at Silver Electrodes in a Series of Normal Alcohols Using Surface Enhanced Raman Scattering. Phys. Chem. Chem. Phys. 1999, 1, 5677–5684. [Google Scholar] [CrossRef]
- Dourado, A.H.B.; Silva, R.A.; Torresi, R.M.; Sumodjo, P.T.A.; Arenz, M.; Cordoba de Torresi, S.I. Kinetics, Assembling, and Conformation Control of L-Cysteine Adsorption on Pt Investigated by in Situ FTIR Spectroscopy and QCM-D. ChemPhysChem 2018, 19, 2340–2348. [Google Scholar] [CrossRef]
- Brooker, J.; Christensen, P.A.; Hamnett, A.; He, R.; Paliteiro, C.A. Combined Scanning Tunnelling Microscopy and in Situ Fourier Transform Infrared Study of Dioxygen Reduction on Gold. Faraday Discuss. 1992, 94, 339. [Google Scholar] [CrossRef]
- Doneux, T.; Buess-Herman, C.; Lipkowski, J. Electrochemical and FTIR Characterization of the Self-Assembled Monolayer of 2-Mercaptobenzimidazole on Au(111). J. Electroanal. Chem. 2004, 564, 65–75. [Google Scholar] [CrossRef]
- Zinola, C.F.; Rodríguez, J.L.; Arévalo, M.C.; Pastor, E. FTIR Studies of Tyrosine Oxidation at Polycrystalline Pt and Pt(111) Electrodes. J. Electroanal. Chem. 2005, 585, 230–239. [Google Scholar] [CrossRef]
- Ogura, K.; Kobayashi, M.; Nakayama, M.; Miho, Y. In-Situ FTIR Studies on the Electrochemical Oxidation of Histidine and Tyrosine. J. Electroanal. Chem. 1999, 463, 218–223. [Google Scholar] [CrossRef]
- Gómez-Marín, A.M.; Feliu, J.M. Pt(111) Surface Disorder Kinetics in Perchloric Acid Solutions and the Influence of Specific Anion Adsorption. Electrochim. Acta 2012, 82, 558–569. [Google Scholar] [CrossRef]
- Agmon, N. Infrared Spectroscopy: The Acid Test for Water Structure. Nat. Chem. 2016, 8, 206–207. [Google Scholar] [CrossRef] [PubMed]
- Max, J.-J.; Trudel, M.; Chapados, C. Substraction of the Water Spectra from the Infrared Spectrum of Acidic and Alkaline Solutions. Appl. Spectrosc. 1998, 52, 963–969. [Google Scholar] [CrossRef]
- Thamer, M.; de Marco, L.; Ramasesha, K.; Mandal, A.; Tokmakoff, A. Ultrafast 2D IR Spectroscopy of the Excess Proton in Liquid Water. Science 2015, 350, 78–82. [Google Scholar] [CrossRef] [PubMed] [Green Version]
- Max, J.J.; Trudel, M.; Chapados, C. Infrared Titration of Aqueous Glycine. Appl. Spectrosc. 1998, 52, 226–233. [Google Scholar] [CrossRef]
- Max, J.-J.; Ménichelli, C.; Chapados, C. Infrared Titration of Aqueous Sulfuric Acid. J. Phys. Chem. A 2000, 104, 2845–2858. [Google Scholar] [CrossRef]
- Max, J.-J.; Chapados, C. Infrared Titration of Aqueous NaOH by Aqueous HCl. Can. J. Chem. 2000, 78, 64–72. [Google Scholar] [CrossRef]
Figure 1.
(A) An example surface showing how the bulk atoms are bonding with the neighboring ones, while the surface atoms have missing bonds, represented by the empty circles. (B). Helmholtz’s electric double layer model shows the electrode surface (red rectangle), positively charged, while the electrolyte responds to this potential by generating an anion monolayer (black circumferences). The potential drop as a function of the distance from the electrode is shown as a golden line.

Figure 2.
Gouy–Chapman electric double layer model. The electrode is represented as a red rectangle, and it is positively charged. The potential drop as a function of the distance from the surface is shown as a golden line and the Debye length as a dotted black line. The anions are represented as black circumferences and the cations as gray ones. The anion’s concentration is higher the smaller x, and the cations are bigger, both reaching the minima or maxima (in order) above κ, where the electrolyte behaves as a bulk phase.
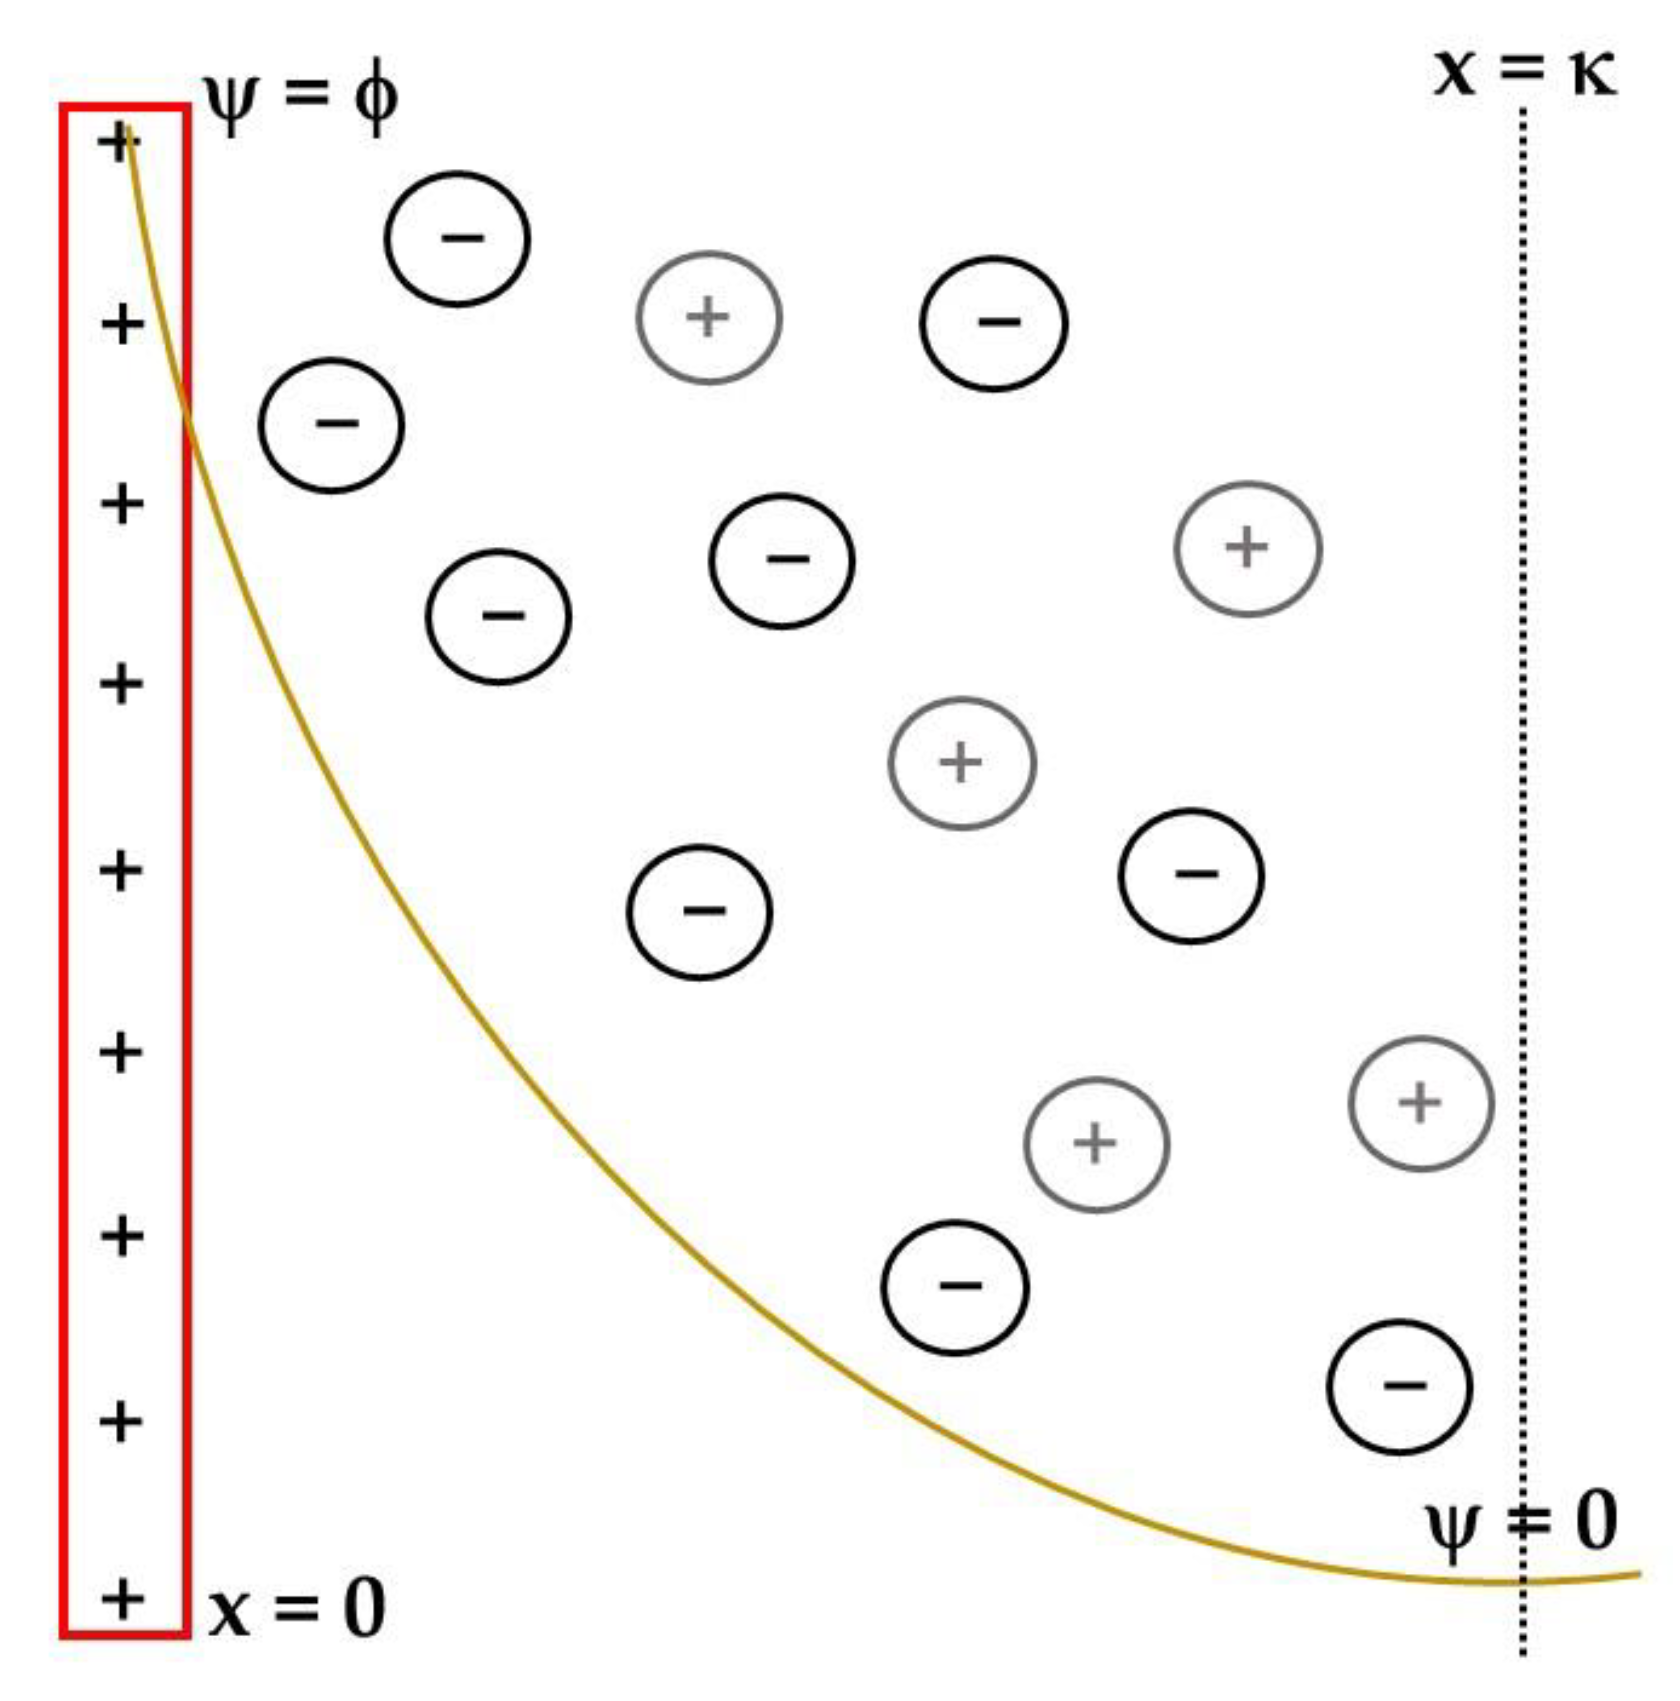
Figure 3.
(A) Stern’s electric double layer model. Being the positively charged electrode in a red rectangle, the potential drop as a function of the distance from the electrode is a golden line. The initial anion layer is marked with a dotted black line, the Helmholtz layer. Anions are represented by black circumferences and cations as gray ones. (B) Grahame’s adaptation of Stern’s model is for the electric double layer. The solvent molecules were added (blue circumferences), and the HL was divided into two regions, the inner Helmholtz plane (IHP) and the outer one (OHP). The Helmholtz potential (), or ζ-potential, is also shown at the end of the HL in A and OHP in B.

Figure 4.
Representation of the double layer capacitance () variation with potential (E). The minimum is marked with a gray dotted line, representing the potential of zero charge (PZC).
Figure 4.
Representation of the double layer capacitance () variation with potential (E). The minimum is marked with a gray dotted line, representing the potential of zero charge (PZC).
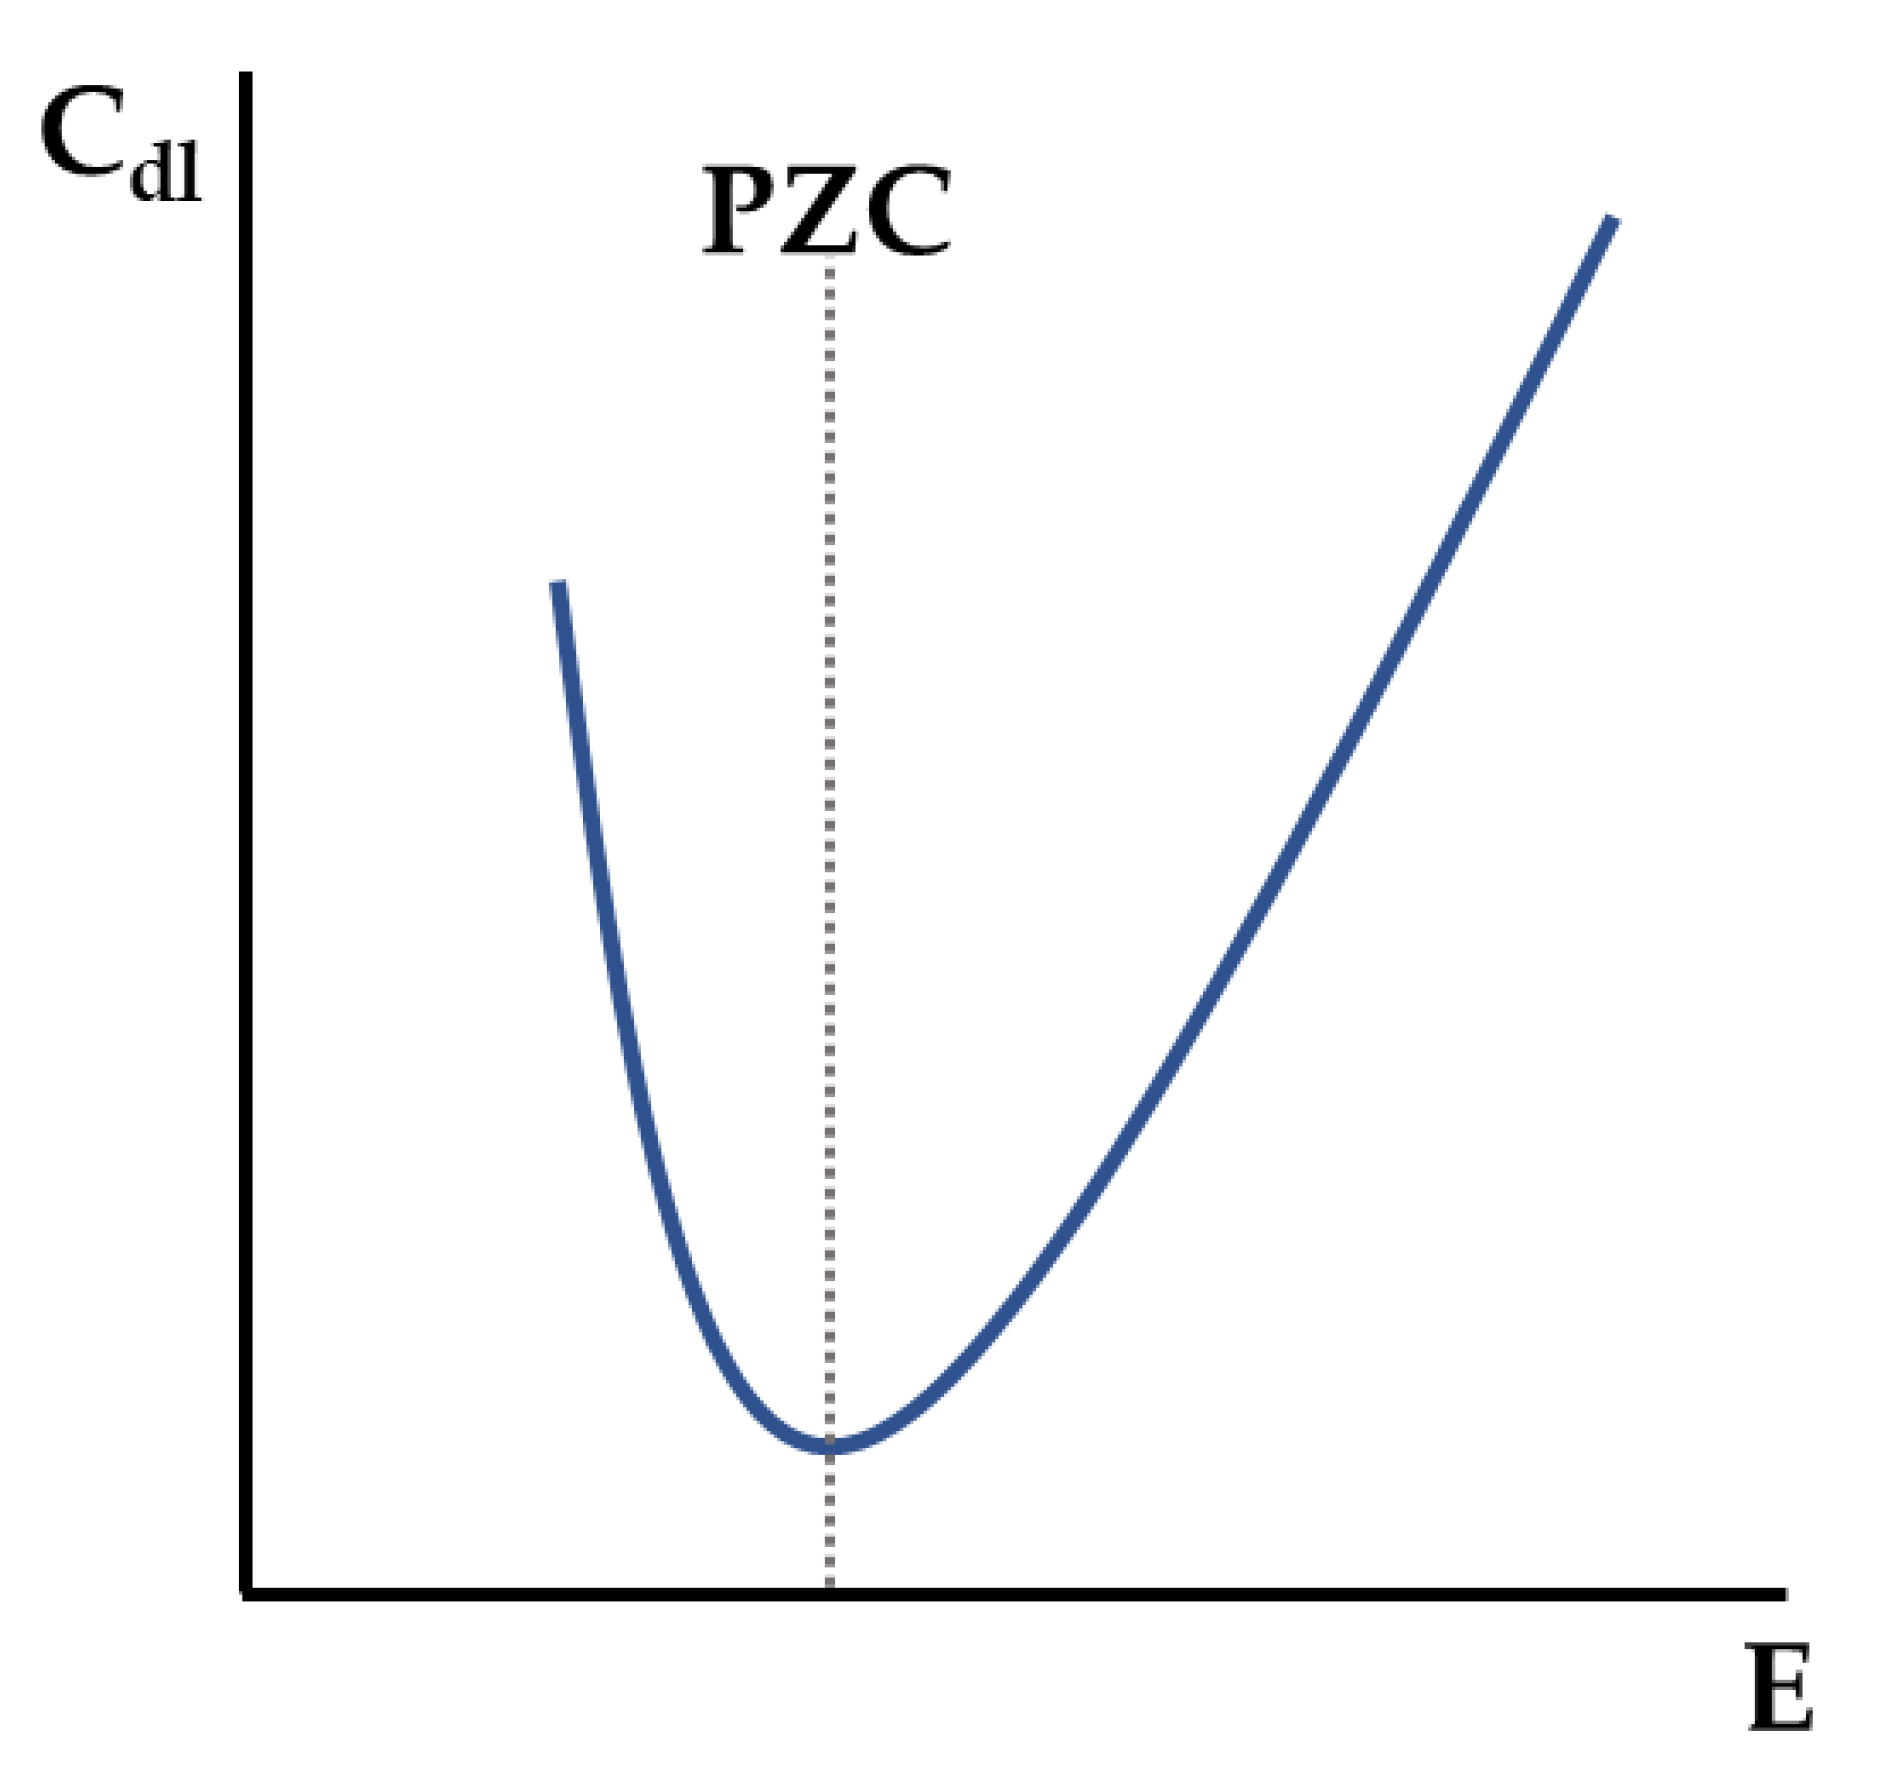
Figure 5.
Schematics of water adsorbed structures on electrode surfaces (red rectangles). Red spheres represent oxygen atoms, black hydrogen, and yellow sulfur: (A) H-down conformation observed at potentials more negative than the PZC [7,8,9]; (B) “ice-like” bilayer structure observed around PZC [7,8,9,10]. (C) H-up conformation observed at potentials more positive than the PZC [7,8,9]; (D) solvated sulfate anions suggested for positive potentials [10]; (E) water dimer; (F) adsorbed OH− [133]; (G) flat adsorbed water at potentials around PZC [7,10].
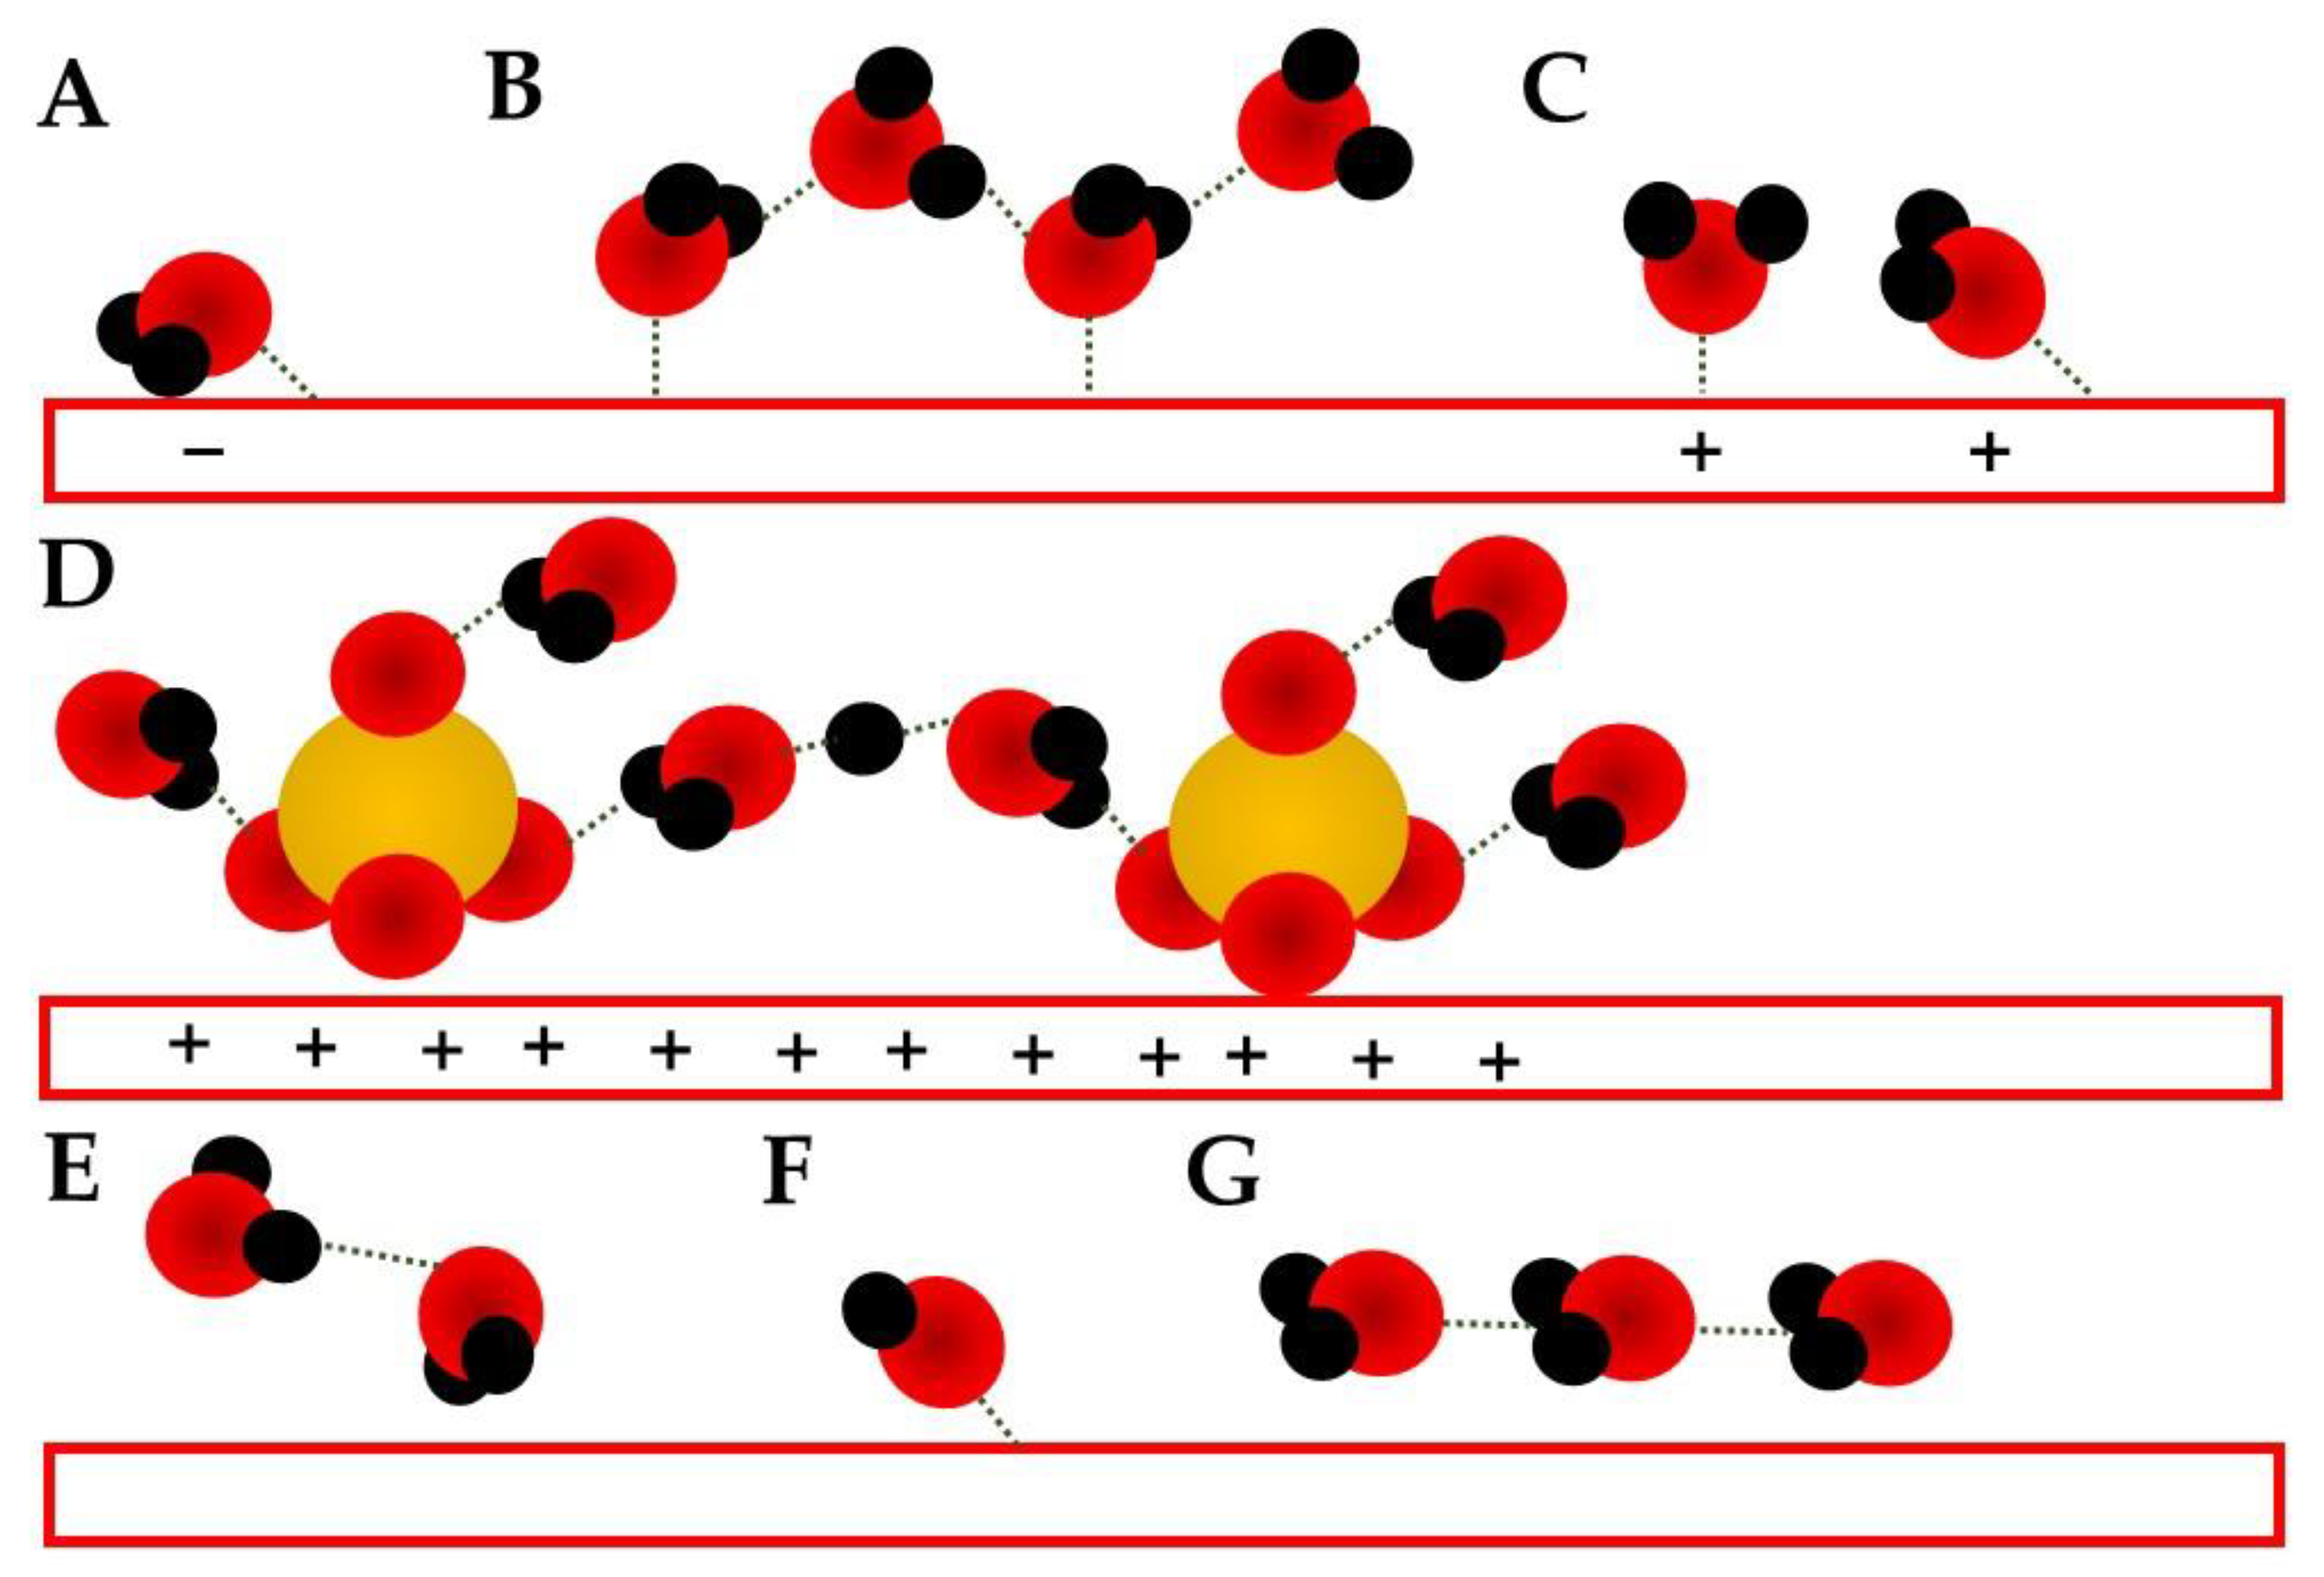
Figure 6.
Representation of the two H-down conformation described by Li et al. [11] at potentials more negative than PZC; (A) is expected for shortly more negative than the PZC and (B) for potentials much more negative.
Figure 6.
Representation of the two H-down conformation described by Li et al. [11] at potentials more negative than PZC; (A) is expected for shortly more negative than the PZC and (B) for potentials much more negative.
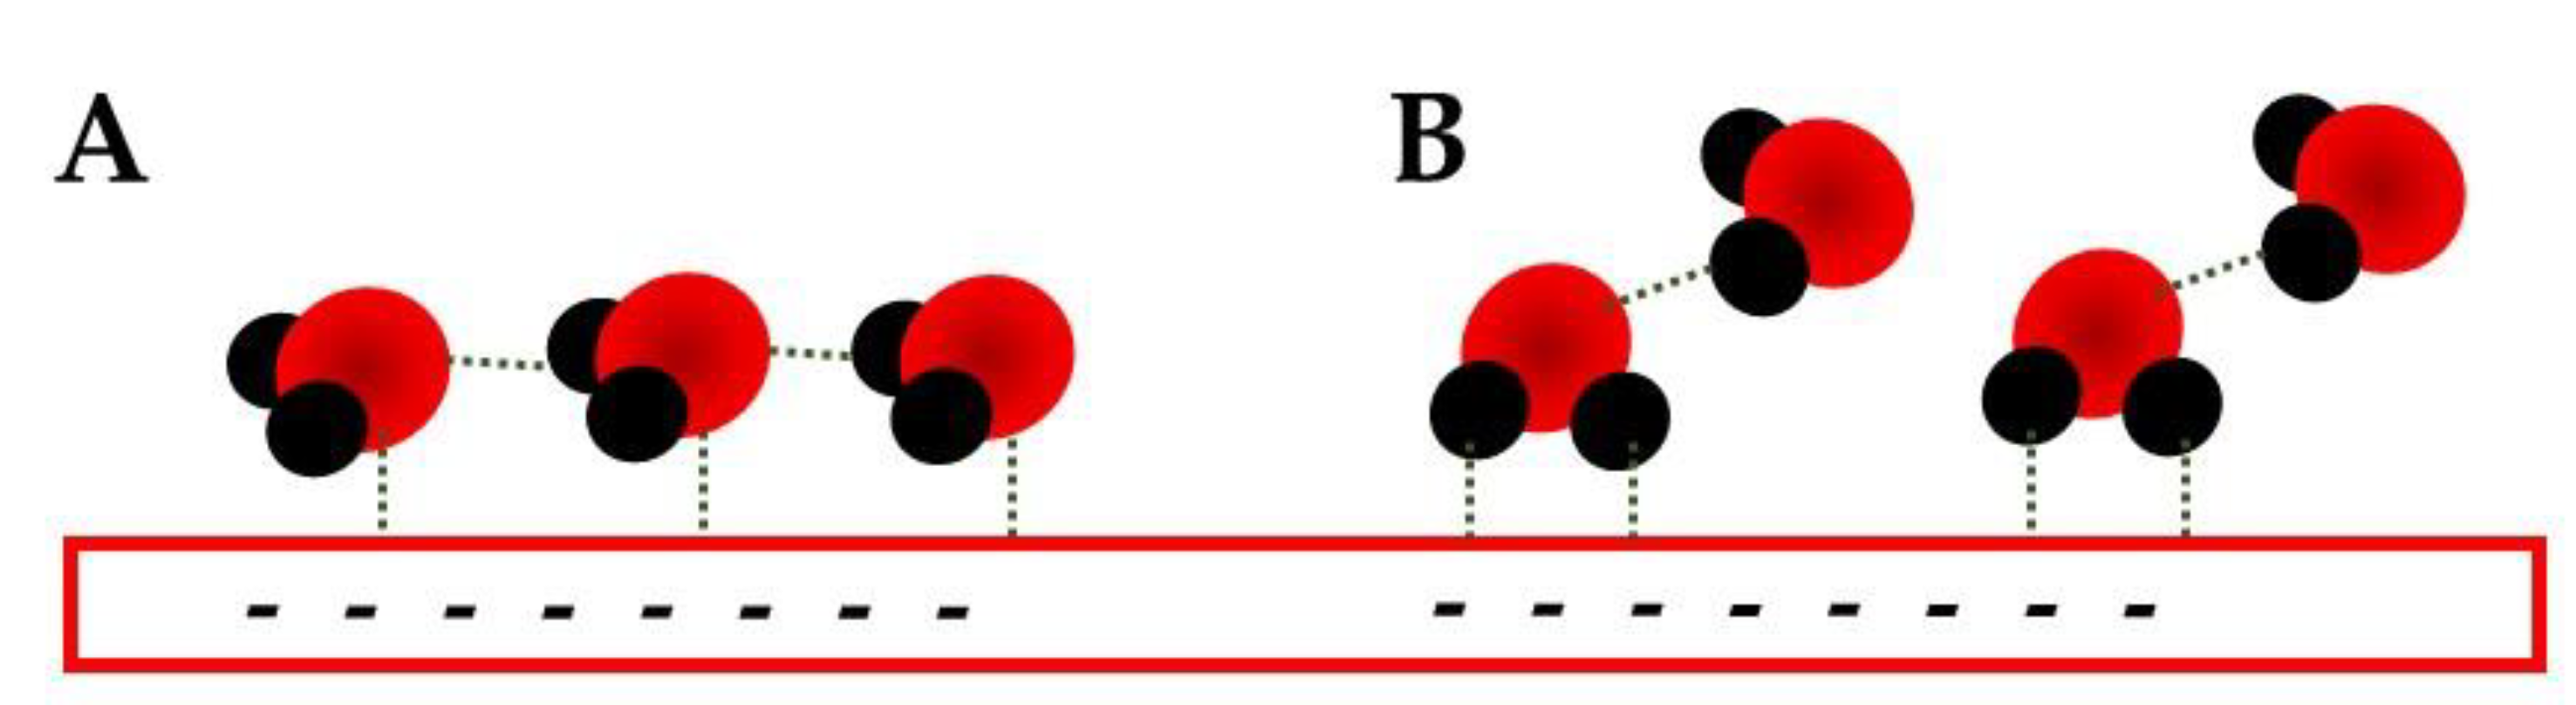
Figure 7.
Proposed anion adsorption conformations for sulfate (A,B) and nitrate (C) [18].
Figure 7.
Proposed anion adsorption conformations for sulfate (A,B) and nitrate (C) [18].
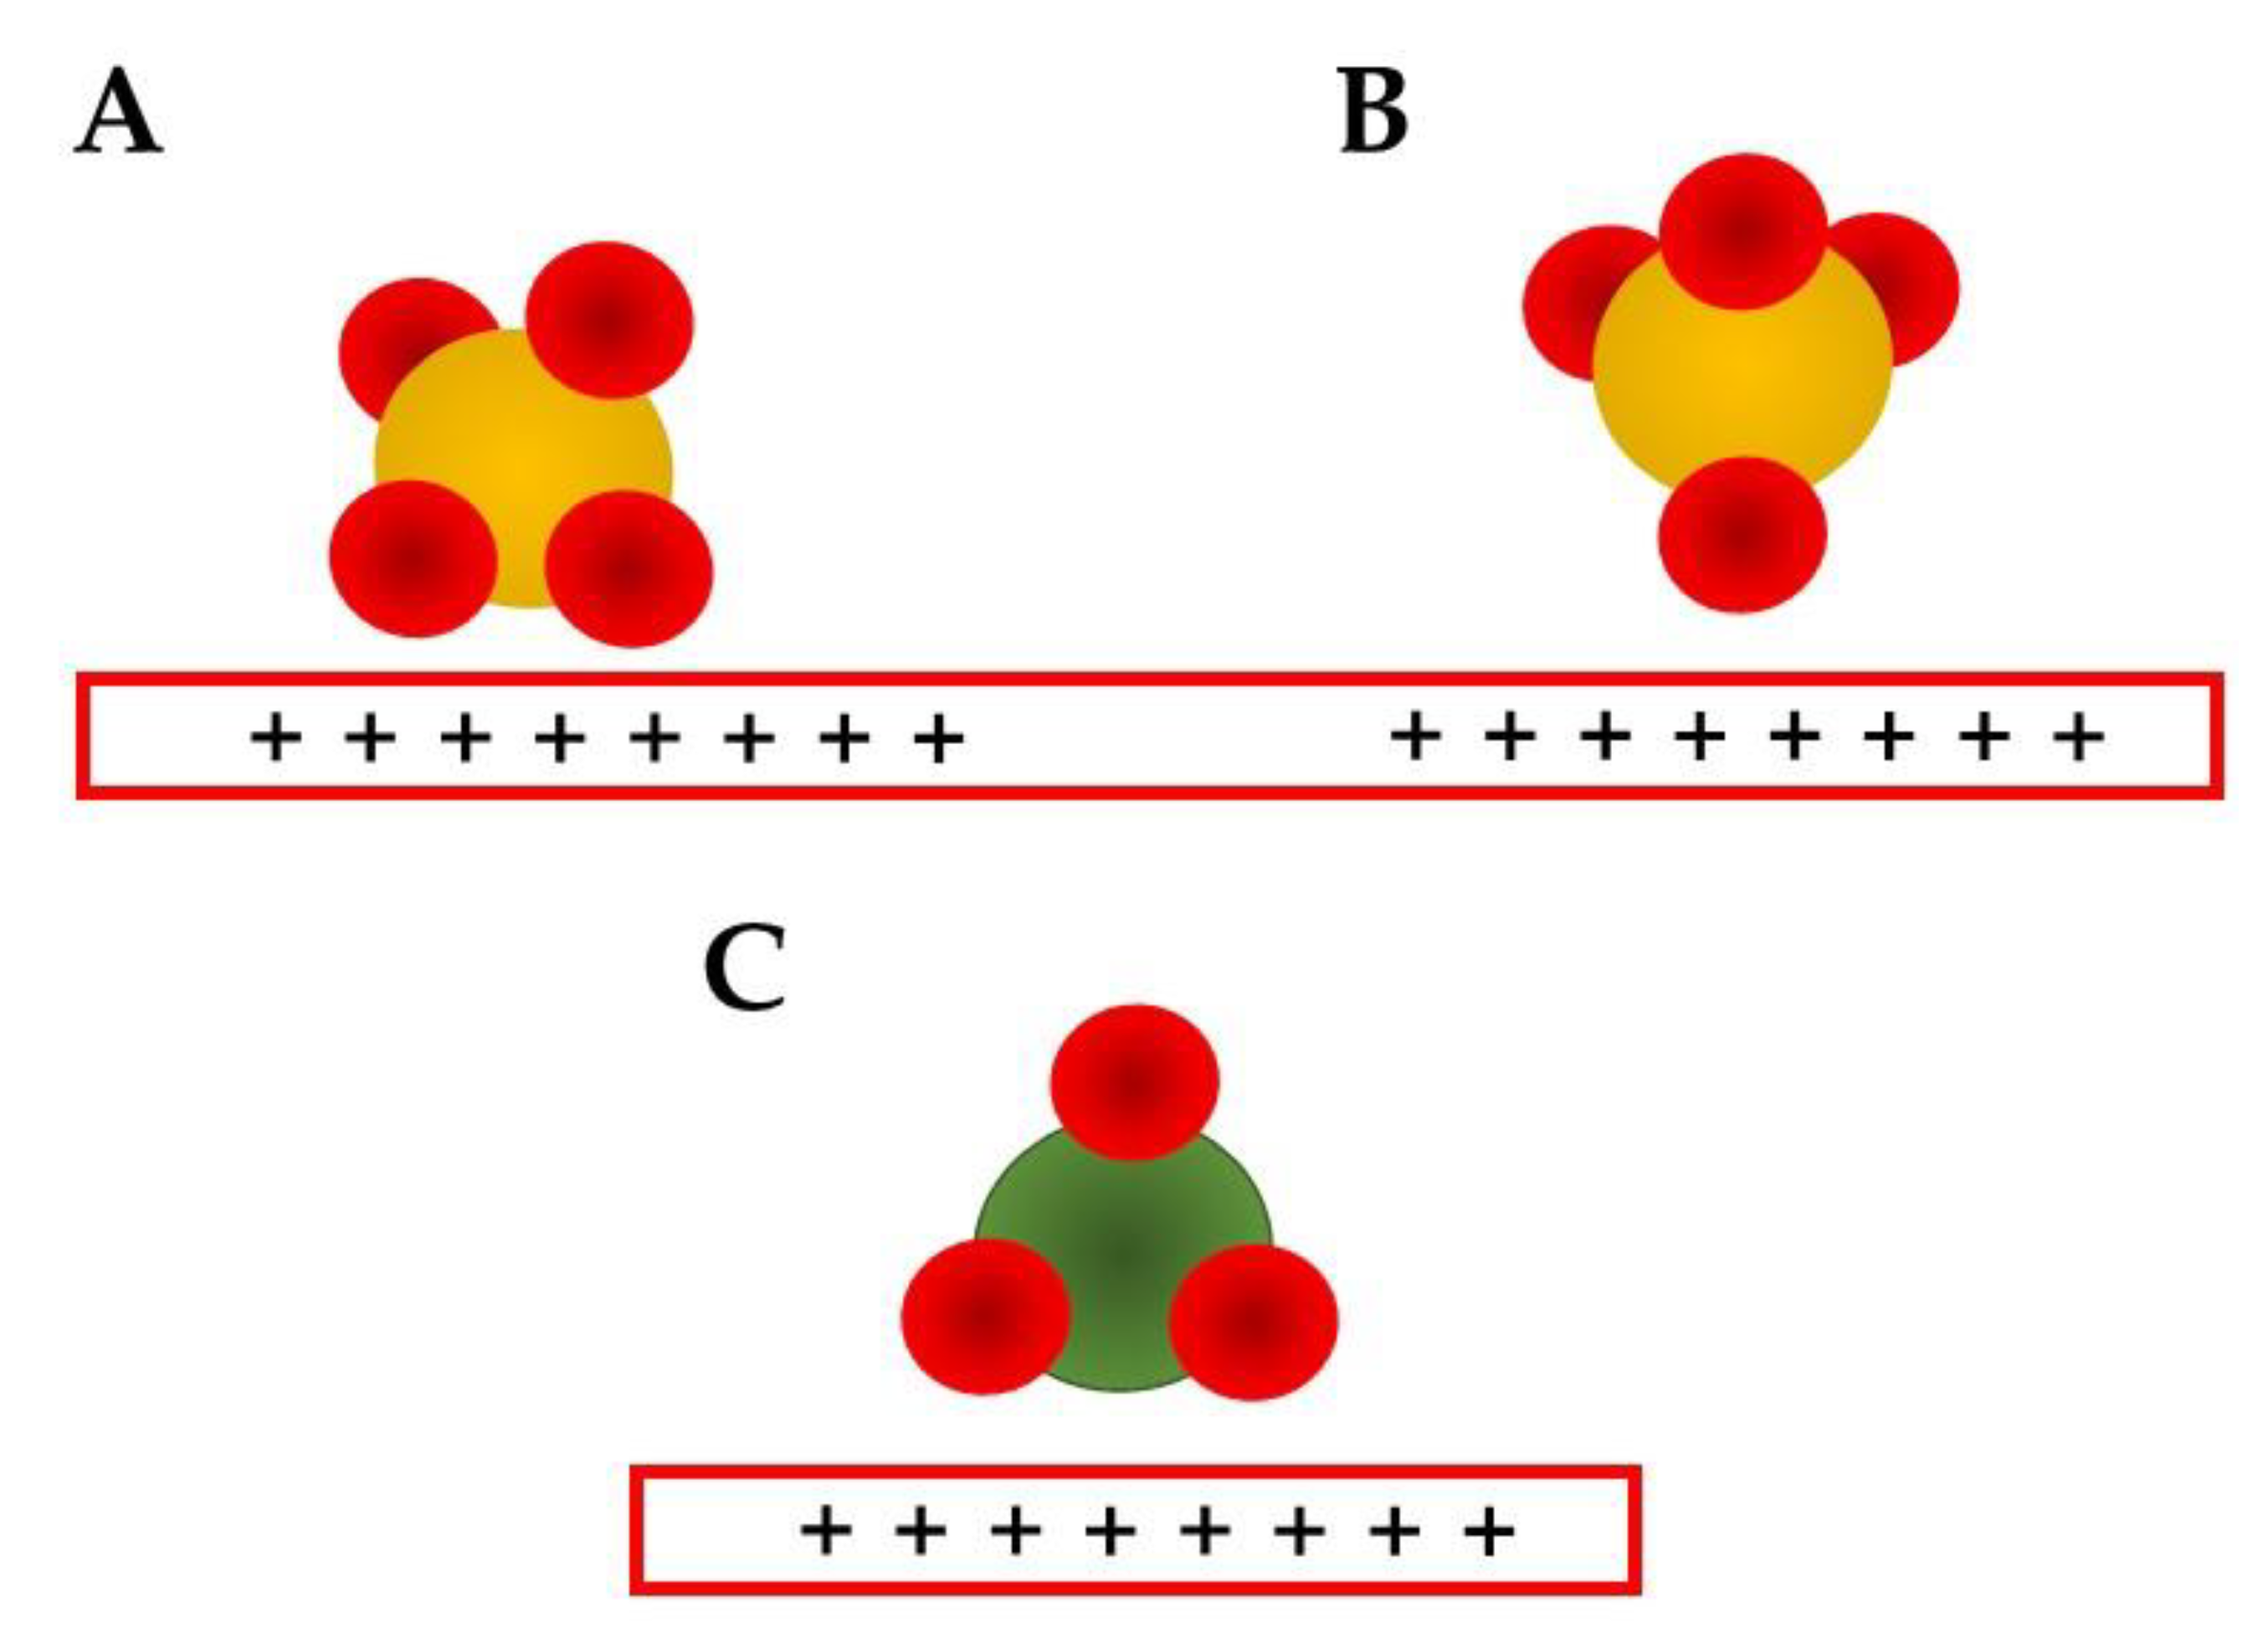
Publisher’s Note: MDPI stays neutral with regard to jurisdictional claims in published maps and institutional affiliations. |
© 2022 by the author. Licensee MDPI, Basel, Switzerland. This article is an open access article distributed under the terms and conditions of the Creative Commons Attribution (CC BY) license (https://creativecommons.org/licenses/by/4.0/).
Share and Cite
MDPI and ACS Style
Dourado, A.H.B. Electric Double Layer: The Good, the Bad, and the Beauty. Electrochem 2022, 3, 789-808. https://doi.org/10.3390/electrochem3040052
AMA Style
Dourado AHB. Electric Double Layer: The Good, the Bad, and the Beauty. Electrochem. 2022; 3(4):789-808. https://doi.org/10.3390/electrochem3040052
Chicago/Turabian StyleDourado, André H. B. 2022. "Electric Double Layer: The Good, the Bad, and the Beauty" Electrochem 3, no. 4: 789-808. https://doi.org/10.3390/electrochem3040052