


AI-Assisted Multi-Operator RAN Sharing for Energy-Efficient Networks
by
 ,
,
Saivenkata Krishna Gowtam Peesapati
* ,
,
Magnus Olsson
,
Sören Andersson
,
Christer Qvarfordt
and
Anders Dahlen
Huawei Technologies Sweden AB, 164 40 Stockholm, Sweden
*
Author to whom correspondence should be addressed.
Telecom 2023, 4(2), 334-368; https://doi.org/10.3390/telecom4020020
Submission received: 29 January 2023
/
Revised: 22 May 2023
/
Accepted: 5 June 2023
/
Published: 19 June 2023
(This article belongs to the Special Issue Artificial Intelligence/Machine Learning in Wireless Communications and Networking)
Abstract
:Recent times have seen a significant rise in interest from mobile operators, vendors, and research projects toward achieving more energy-efficient and sustainable networks. Not surprisingly, it comes at a time when higher traffic demand and more stringent and diverse network requirements result in diminishing benefits for operators using complex AI-driven network optimization solutions. In this paper, we propose the idea of tower companies that facilitate radio access network (RAN) infrastructure sharing between operators and evaluate the additional energy savings obtained in this process. In particular, we focus on the RAN-as-a-Service (RANaaS) implementation, wherein each operator leases and controls an independent logical RAN instance running on the shared infrastructure. We show how an AI system can assist operators in optimizing their share of resources under multiple constraints. This paper aims to provide a vision, a quantitative and qualitative analysis of the RANaaS paradigm, and its benefits in terms of energy efficiency. Through simulations, we show the possibility to achieve up to 75 percent energy savings per operator over 24 h compared to the scenario where none of the energy-saving features are activated. This is an additional 55 percent energy savings from sharing the RAN infrastructure compared to the baseline scenario where the operators use independent hardware.
1. Introduction
The energy consumption of information and communication technology (ICT) has triggered a lot of discussions in recent times, and there has been a growing concern to keep it within sustainable limits. As of 2020, ICT contributed to seven percent of the total global electricity usage and is expected to increase for several years as data traffic volumes continue to grow [1]. It is challenging to make accurate predictions due to the various entities and factors involved, their contribution being unpredictable. For instance, new trends such as cryptocurrency mining, the relentless speed of data center construction, blockchain, artificial intelligence, virtual reality, and augmented reality have not been factored into recent energy consumption studies but could potentially end up as the highest contributors [1]. To analyze these different trends and contributors, authors in [2] divided the electricity usage by ICT into four categories: (1) consumer devices; (2) network infrastructure; (3) data center computation and storage; (4) the production of the above categories (see Figure 1). Of these categories, our focus is on the network infrastructure—in particular, the base station’s energy consumption, which accounts for 15 percent of the total ICT energy consumption [3].
The fifth-generation (5G) mobile networks have been designed to cater to higher traffic demands, more intelligent terminals, and an ever-growing capacity and service-aware demand, while consuming the same or less energy. While densifying the network could address the capacity requirements, it could lead to increased network infrastructure costs and energy consumption by up to 2–3 times for operators, as 5G is rolled out alongside existing technologies. This has a direct impact on operational expenditure (OPEX), which continues to grow as networks evolve and expand. In line with the European Commission’s 2030 climate and energy framework, there is a pressing need for a higher energy efficiency of 5G networks to reduce global greenhouse gas (GHG) emissions by 50 percent by 2030. To this end, mobile operators are beginning to use renewable energy sources that meet or exceed decarbonization goals, and vendors play their role by developing flexible and energy-efficient solutions [4].
A typical network experiences large variations in traffic demand in a day. As shown in [5], the demand during peak hours could be around 8–10 times higher as compared to the off-peak hours. Moreover, since networks are designed to cater to the peak demands, large variations could lead to the under-utilization of base station resources and a higher energy consumption during the off-peak hours. To mitigate this problem, one can turn off the base station’s hardware components depending on their activation–deactivation and idle time—a technique known as advanced sleep modes (ASMs). This has been looked into in [6,7,8,9,10]. The selection of the most suitable sleep mode that fulfills both the quality of service and energy-saving requirements is a complex task, as it depends on their activation–deactivation time, the network conditions, and the variation in the energy consumption of a base station with the radio resource used. To this end, reinforcement learning (RL) has proven to be a useful assistance tool for radio resource management.
While these solutions improve the network energy efficiency and reduce the OPEX for the operators, there is still room for savings in their capital expenditure (CAPEX). This is where tower companies (or TowerCos) can play a crucial role.
1.1. Tower Companies
TowerCos are independent companies that own the passive infrastructure, such as towers, cooling, and power, and provide space at the sites on lease to the mobile network operators (MNO). They provide the RAN infrastructure which is shared by multiple MNOs, thereby reducing the operator’s CAPEX and OPEX without compromising on the coverage they could provide. It is a growing trend internationally, specifically in the European wireless network industry.
The independent TowerCos in Europe have expanded significantly in the last few years. For example, Cellnex, a Spanish TowerCo originally providing broadcasting equipment to television towers, has now expanded into wireless networks by acquiring sites from operators in various European countries. Moreover, operators create separate TowerCos where they usually are the majority shareholder, for example, Vantage from Vodafone. Another emerging trend is to share the sites and the infrastructure between operators, especially in less profitable areas, such as rural or suburban areas.
1.1.1. RAN-Sharing Types and Operator Differentiation
One way of classifying RAN sharing could be as active and passive. Under passive sharing, operators share the costs associated with deploying the physical infrastructure, such as the costs of masts, towers, and the space to deploy this infrastructure. It results in fewer sites relative to multiple standalone networks. On the other hand, active sharing involves sharing the electronic equipment such as transmitters and receivers. Enabling active sharing can improve energy savings as the active components contribute to around 60 percent of a site’s energy consumption (see Figure 2). Beyond reducing the OPEX and CAPEX, it would enable an operator to focus on its core business and further specialize in service provisioning to end users.
While both active and passive sharing have clear benefits in terms of CAPEX and OPEX for the network operators, an assessment of the likely effects on competition is often necessary as competition authorities often raise concerns about the extent to which such sharing could impair an operator’s ability to differentiate its network quality and services. Of the two, passive sharing has a limited impact on competition as only the physical location of each site is shared [11] while the active sharing of the infrastructure leads to operator differentiation issues due to the deeper level of network sharing involving active equipment used for transmitting, receiving, and processing signals. This link between physical equipment and service differentiation makes it difficult for operators to actively participate in a RAN-sharing arrangement.
For a successful implementation of such a system, operators need (i) to be able to differentiate their RAN from competitors’ RANs as much as possible, (ii) lower the cost associated with sharing resources, and (iii) be as independent as possible from the other MNOs using the same shared infrastructure. It calls for an underlying architecture that provides orchestration services across different RAN instances belonging to various operators. We call this system ClusterRAN—a system capable of providing control of RAN instances so that operators can maintain independent operations wherever possible while leveraging cost savings from shared resources.
1.1.2. ClusterRAN
The ClusterRAN system provides orchestration services for the cluster instances, e.g., public RAN clusters and (or) nonpublic network clusters. It consists of the ClusterRAN controller and ClusterRAN infrastructure. The ClusterRAN controller manages the infrastructure and handles the life-cycle management of the cluster instances. The ClusterRAN infrastructure consists of the equipment providing computing, connectivity, and radio infrastructure resources needed to host RAN clusters. Each cluster instance consists of one cluster intelligent controller controlling one or more RAN network functions that provide the services of the cluster. A high-level view of the system is presented in Figure 3 and Figure 4.
1.1.3. RAN-Sharing Types
Another way to classify RAN sharing is as a RAN as a service (RANaaS) and RAN services. Provisioning a RANaaS is about providing the necessary capabilities of a RAN to an operator, where it exposes the same interfaces to the surrounding environment for control and data plane. An additional interface for monitoring the capability performance is exposed to the tenant without disclosing the actual provisioning of the services as seen in Figure 4. Furthermore, each local area RAN, provided as a service, is logically independent, with separate network functions and interfaces. This service exposes a management plane interface that allows the operator to control and manage the logical nodes and links that are created by TowerCos. Thus, each RAN has its own gNBs, base stations, and interfaces that form a separate network from other tenants’ RANs. From an operator’s perspective, the RAN provided as a service looks similar to one that would have been built originally by the operator. An alternative would be to provide the RAN as tenant-specific hardware and software; however, for resource efficiency reasons, a pooling of resources between tenants would be preferred, with reduced CAPEX for TowerCos.
1.1.4. Sharing RAN Resources and Responsibilities
The pooling of resources implies that multiple logical RANs share the same infrastructure. To meet the operator’s requirements, the hardware and software resources controlled by TowerCos are pooled and allocated dynamically to the different logical RANs. It is similar to putting together building blocks to provide a specific capability, functionality, or feature. It is important for shared platform services such as AI, data access, etc., offered by TowerCos. In the RANaaS scenario, as seen in Figure 4, the TowerCo is responsible for the resource infrastructure and service infrastructure layers, the ClusterRAN controller, and cluster service orchestration along with the cluster function and infrastructure management. The operator is a tenant of the logical RAN and is responsible for managing the RAN cluster instance.
In the RANaaS scenario, as seen in RAN A in Figure 5, the operator is responsible for the assurance of the end-user connectivity services provided by the RANaaS. On the other hand, the TowerCo manages the creation and the life-cycle management of various cluster instances. It is different if the operator had ordered a RAN Service (RAN B in Figure 5) where the TowerCo is responsible for the creation, assurances of the end-user connectivity, and life-cycle management of all cluster instances and the operator only uses the RAN.
1.2. Multitenant Energy Management by TowerCo
Traditionally, TowerCos were set up as entities that generated and provided electricity to their MNO tenants at telecom tower sites. Apart from energy services, other standard functions such as site security, the monitoring of active equipment, and the upgradation of passive infrastructure, etc., are provided. For a TowerCo providing these services, energy generation and provisioning can constitute up to 60 percent of all annual operating expenses. As a result, they are incentivized to continuously seek long-term opportunities for energy-efficiency initiatives to reduce costs and improve cost predictability. However, historically, this has not been the case as most contracts between the TowerCos and MNOs were structured in a way that provided little or no commercial or business incentives for TowerCos to prioritize energy cost reductions and energy efficiency. Nowadays, with network operators looking to reduce their carbon footprint, we could expect to see a shift in this trend as more operators look towards adopting green renewable energy solutions that would benefit both parties by reducing costs and helping meet sustainability goals.
Enabling Energy-Saving Features
Energy-saving features are RAN-specific. Some of these features are autonomous once activated (e.g., symbol power saving), while others are activated on demand and could be controlled by AI functionalities. Currently, AI is typically used to identify thresholds suitable for features such as cell sleep, carrier sleep, and RF channel sleep. These thresholds are then used to activate or deactivate radio resources on a rather slow time scale (a few times per 24 h). As mentioned earlier, in the RANaaS RAN-sharing scenario, the operators have control of the activation and deactivation of energy-saving features involving various radio resources. Tenant differentiation also implies that the energy-saving features should be independently upgradeable. To reduce the data shared with the TowerCo, the RAN energy-saving features could be implemented as a part of the logical RAN, i.e., the RAN service layer of ClusterRAN (see Figure 4) and not belong to the shared service infrastructure layer (which the TowerCo is responsible for).
With the RANaaS sharing scenario, the total energy consumption reduction becomes a joint effort by the MNOs and the TowerCo. The TowerCo is responsible for distributing the total energy cost that includes active RAN components, cooling, and other energy-consuming equipment amongst the operators. As the energy-saving differentiation between operators could be a complex task, the TowerCo actor needs to have certain functionalities to distribute energy costs among the operators. As the TowerCo controls the activation–deactivation of the physically shared infrastructure resources, a resource can be deactivated only when all the sharing MNOs have decided to deactivate it. Overall, one can easily conclude that the TowerCo RANaaS architecture must support special coordination requirements for the energy management of shared hardware units such as remote radio units (RRUs)/active antenna units (AAUs). Preferably, this support is achieved by separating the TowerCo’s energy management of the multiple logical RANs and the MNO energy-saving functionality within each logical RAN, as suggested in Figure 6.
As shown in Figure 6, there is a logically individual AI functionality for each logical RAN serving different energy-saving features. If the TowerCo’s energy management requires using AI, then there is a logically separated AI service for the TowerCo. The RAN services offering the AI functionality of the RAN are still logically individual from other RANs and that of the TowerCo’s energy management. However, the TowerCo selects the AI services to use as it controls the logical RAN. The coordination functionality managed by the TowerCo shall be as independent as possible of the different RANs provided to the tenants. This functionality is concealed from the operators, has an independent life-cycle management, and operates in the service infrastructure layer. The coordination functionality becomes an infrastructure service that the TowerCo provides to the logical RANs. In Figure 7, we show the addition of the coordination functionality as a service infrastructure provider’s (SIP) network function (NF) to the original baseline in Figure 4.
The rest of the paper is organized as follows. In Section 2, we look at related works. In Section 3, we present a description of the problem we look to solve along with our contributions to this area. The system model that includes the deployment aspects and energy cost distribution is introduced in Section 4. The AI system implemented to assist each MNO in managing their independent logical RAN instances is discussed within Section 5. Finally, details about simulation parameters, assumptions, setup, results, and a comparison to other works can be found in Section 6. Conclusions along with the proposed future directions are presented in Section 7.
2. Related Works
RAN sharing has been studied mainly from two perspectives: (i) resource allocation and (ii) resource optimization. The former case could be to meet the service level agreement (SLA) requirements of different operators, while the latter is to improve on the network KPIs of interest. Ref. [12] was one of the first few works to lay the foundation for the concept of RANaaS and how cloud technology could be leveraged to achieve a flexible RAN. In [13], the energy-efficiency aspects of RANaaS are highlighted. In [14], the authors analyzed the benefits of employing network slicing in the RAN to introduce more flexibility in the configuration of RAN-sharing architectures. There, specific radio slices were allocated to an operator based on their SLA constraints.
Previous works on energy-efficient networks have mainly considered radio resource adaptation and sleep modes independently. In [15], the authors showed that mMIMO adaptation could provide energy savings of up to 40 percent compared to a fixed antenna system under varying traffic loads. In the same work, the authors also presented a base station power model. In [16], the authors proposed a multistream carrier aggregation algorithm to maximize the network capacity while considering the aspects of fairness and network energy efficiency.
Sleep modes reduce the power consumption of a base station by turning off various hardware components during the idle period. The papers [6,7,8,9,10,17,18] focused specifically on sleep-mode management under varying loads. In [6,8,9], the authors proposed a reinforcement-learning-based algorithm to manage and determine the appropriate sleep mode depending on the user requests arrival rate. They obtained significant energy savings at low loads at the expense of a slight degradation in user throughput and latency. However, that technique has drawbacks, as the energy cost associated with turning ON/OFF base station components cannot be overlooked. To minimize the switching cost associated with the transitions, the authors in [19] proposed an algorithm to help determine how often and to which sleep level a base station should switch down. In [17], the authors proposed a distributed energy-saving algorithm that determined the sequence in which base stations can be turned off while ensuring a minimal impact on the network energy efficiency due to the additional load on the neighboring base stations. In [18], the authors addressed the limitations of a Q-learning-based sleep mode management algorithm by proposing a deep-Q learning-based solution that adapted better to the non-stationary nature of real-world traffic scenarios.
In [20], we extended the analytical methodology developed in [21] to propose a dynamic Q-learning-based resource adaptation algorithm to obtain higher energy savings under varying traffic loads. As an extension to [20], in [22], we mainly addressed the challenges associated with complex long-horizon problems by developing a hierarchical reinforcement learning solution wherein different optimization strategies were implemented as a hierarchy of reinforcement learning agents. It was not only to improve the network energy efficiency but also to learn the best way to optimize the network in any given scenario. To an extent, we were able to show that different agents with different objectives and following different policies can coexist and coordinate with each other in the same environment to achieve a common goal [23]. Table 1 provides a summary of related works from 2020 to 2023.
3. Problem Description and Contributions
Current mobile networks are often over-dimensioned to accommodate varying traffic demands, resulting in the under-utilization of base station resources during off-peak hours. It leads to increased costs for operators opting for SingleRAN technology, including the expenses for network sites, spectrum, and electricity. Furthermore, the deployment of 5G alongside existing technologies exacerbates these costs. While operators have been working on network optimization solutions to improve resource utilization, there is still room for more energy savings. This paper aims to answer the following questions:
- How can RAN sharing improve the energy savings for an operator as compared to using independent hardware?
- What could be the impact of independent resource optimization by the operators with different KPIs on the energy savings obtained?
Our contributions in this work are as follows:
- 1.
- Through simulations we evaluate the benefits, complexity, and challenges of the RANaaS RAN-sharing scenario from the TowerCo perspective, specifically on the energy savings obtained. We analyze the benefits of providing independence in the sharing process by allowing each operator to control their share of resources and other cell-level parameters, thus enabling service differentiation.
- 2.
- We conduct a benefit analysis of using AI for energy-efficient network optimization from an operator’s perspective.
- 3.
- We propose an approach to distribute the energy cost among the participating MNOs in the RAN-sharing scenario of interest.
- 4.
- We discuss the implications and challenges of independent resource optimization by MNOs in the RANaaS RAN-sharing scenario by highlighting the potential benefits and drawbacks.
4. System Model
At the highest level, the system consists of four main entities: (i) the TowerCo, (ii) MNOs, (iii) AI system, (iv) shared/logical RAN resources, as seen in Figure 8. In this work, we consider three MNOs operating in a network consisting of a homogeneous deployment of seven three-sector sites, as seen in Figure 9. The serving base station i is surrounded by interferers. To simplify the analysis, we assume a maximum of six interfering base stations, i.e., . Each base station serves N active users in time T, distributed uniformly in the cell of radius . Assuming a fixed average requirement of megabits per user, the hourly traffic demand can be expressed as Equation (1). The variation in the number of active users during the day is assumed to follow the profile shown in Figure 10.
Considering the downlink scenario and assuming perfect channel state information (CSI) to be available at the transceivers, the achievable rate per user k is expressed as Equation (2). Here, depends on the signal power (Equation (3)) from the base station i that the user is connected to, and the interference from the neighboring base stations as in Equation (4). Furthermore, depends on the activity of the interferers while varies with the bandwidth and the number of spatial multiplexing layers . These parameters can be expressed as
In Equation (3), depends on the number of users served simultaneously , the power per power amplifier (PA) , and the active array size . The array gain increases the received signal power and is obtained using a larger antenna array at the base station. It is the maximum gain obtained by considering a zero-forcing precoder at the transmitter [26]. and are the distances of the user from the serving and interfering base stations, respectively. is the path loss exponent with a value of 2. c captures the gains of the antennas at the base station and user. The normalized gain between the serving base station and the user is expressed as where is the precoding matrix at the transmitter, and is the weights’ matrix. The gain is given as with . The instantaneous cell throughput can be calculated as
4.1. Base Station’s Activity Factor
To serve the connected users, the base station i has to remain active for a fraction of the total observation period T. It is called the base station’s activity factor (see Figure 11) [27], denoted by and given as Equation (7), where is the requirement of user k. By replacing in (7) with (2), we obtain
If number of users are served simultaneously, then Equation (7) can be modified as
The maximum value of depends on the antenna configuration at the base station. The spectral efficiency obtained with an antenna configuration also depends on the configuration (receiver diversity) at the user terminal . The upper bound is calculated as Equation (9) [28]. Incorporating this in Equation (8), we obtain Equation (10).
where is the maximum data rate that can be achieved by a user with transmit and receive antennas. T represents the observation window over which we measure the activity of the base station. In this work, T is equal to the periodicity of the synchronization signal block transmission [29]. The observation window, the hourly traffic demand, and the rate at which the users are served determine the overall activity factor of the base station.
4.2. Base Station’s Power Model
As seen in Figure 11, the resources utilized or the configuration (in terms of the bandwidth and antenna configuration) in the base station has an impact on its instantaneous power consumption, the user performance, and its activity factor [21]. A base station’s power model quantifies the impact of resources used on its power consumption. An accurate power model helps us to analyze the impact of various components on the overall power consumption. Furthermore, a model depends on the base station type, and as a result, it is necessary to ensure that the implemented model accurately models the base station under consideration. A base station’s total power consumption can be divided into the load-dependent and load-independent parts as expressed in (13). The load-dependent parts consist of the baseband and power amplifier power consumption as given in Equations (11) and (12).
Here, p is the load experienced by the power amplifier (PA), is the efficiency of the PA, is a PA-dependent constant, and is the local oscillator power consumption. More detailed equations showing the impact of and on the baseband’s and the power amplifier’s power consumption can be found in [21]. It is important to note that in a TowerCo scenario, the power amplifiers could experience different loads and consequently have different power consumption values.
4.3. Base Station’s Sleep Modes
Sleep modes reduce the power consumption of a base station during the idle period by deactivating various hardware resources (see Figure 11). They are classified into four modes based on the minimum sleep duration and the activation–deactivation time of the associated hardware resources. Deeper sleep modes (, , and ) reduce the base station’s power consumption by a large extent as more hardware components are deactivated. However, the increased burstiness in the traffic demand during peak hours makes it difficult to switch down to deeper sleep levels having long transition times. Moreover, with the maximum periodicity of the synchronization signal block (SSB) transmission in 5G being 160 ms [29], the base station cannot switch to with a transition time of 1 s. Therefore, we restricted our study to the first three sleep levels. The transition times for the sleep levels , , and were taken as 0.5 s, 35 s, and 15 ms, respectively [30]. The base station’s power consumption model considering the various sleep modes can be written as Equation (14). Here, is the number of sectors, and is the no-load power consumption of the base station given in Equation (15).
4.4. Base Station’s Energy Consumption
The activity factor of a base station is closely linked to its energy consumption and the sleep level that it can switch down to and the associated transition time [21]. When calculating the energy consumption of a base station based on the activity factor, we assume that all sites start serving their users simultaneously. It could lead to slightly overestimated interference and energy consumption values from those observed in a real network. The energy consumption of a base station can be expressed as
Here, is the idle mode power consumption of a base station, is the sleep delta and indicates the depth of sleep, and are the idle and sleep-level activation–deactivation (transition) times, respectively. Further information on the power model and the values of various parameters is found in [21]. The overall network energy consumption in an area with a base station density is calculated as,
A complete list of the variables and the various controllable parameters is provided in the Appendix A in Table A1.
4.5. Energy Cost Distribution
The energy cost distribution involves distributing the TowerCo energy consumption amongst all the operators. The TowerCo power model is similar to the description in Section 4.2 except that the total power consumption as given in Equation (13) is now a contribution of all the participating MNOs. Measured during the observation window, the TowerCo’s energy consumption consists of two parts, (i) the active-mode and (ii) the idle-mode energy consumption. The active-mode energy consumption further comprises the static (or no-load) and dynamic (or variable) energy consumption as seen in Figure 12. As for the dynamic energy consumption, it is the load-dependent power consumption in Equation (13) that plays a crucial role. Unlike the single-RAN scenario where the power amplifiers experience similar load, in a TowerCo scenario, the load experienced by the power amplifiers could vary depending on the configuration and the power amplifiers used by the active MNOs. This variation leads to their differing energy consumption measured during the observation window. The power amplifiers can be divided into two types:
- Shared power amplifiers —the power amplifiers used by two or more MNOs.
- Independent power amplifiers—the power amplifiers used by only one of the MNOs.
In the RANaaS scenario, the TowerCo divides that energy consumption of the shared power amplifiers amongst the operators based on their usage as outlined in Algorithm 1. On the other hand, the load-independent (or no-load) power consumption depends only on the highest configuration of all the active operators at a given site.
| Algorithm 1 TowerCo’s energy cost distribution algorithm |
|
5. Energy-Saving Features and AI-Assisted Radio Resource Management
In the RANaaS scenario, the TowerCo is responsible for the resource and service infrastructure layer, while the operator manages the independent logical RAN instance. It is up to the operator to assure end-user connectivity based on the services provided by the RAN. While the use of AI is optional, in this work, we assume each operator uses AI to ensure meeting the service requirements and improve resource utilization. The AI system interacts with the RAN functions, as seen in Figure 13. In this section, we look into the energy-saving features and the AI implementation aspects assisting the operators in achieving the most energy-efficient resource utilization.
5.1. Energy-Saving Features
Of the many ways to save energy, in addition to sleep modes, this work focus on two resource-adapting energy-saving features that operate on different time scales, i.e., features having different timing constraints for their activation. They are:
- 1.
- Carrier adaptation: Activating this energy-saving feature involves turning on/off capacity layers or bands at each of the sites based on traffic demand, user distribution, and other network conditions. This process takes a longer time than antenna or bandwidth adaptation since it requires re-associating connected users to the same/different site and (or) band, which could take a variable time depending on the network scenario and conditions. Additionally, this process must be executed in a way that does not degrade the quality of service when there is an increase in traffic demand.
- 2.
- Antenna and bandwidth adaptation: Antenna adaptation involves turning on/off the number of active antennas at the base station, and the bandwidth adaptation results in varying the instantaneous bandwidth allocated to each user dynamically. These adaptations operate on a much shorter time scale compared to carrier adaptation. Both antenna and bandwidth adaptation lead to a change in the instantaneous throughput experienced by the user as seen in Equation (2) and described in Section 4. The change in the user throughput impacts the base station’s activity factor (see Equation (8)) and its energy consumption (see Equation (17)).
We implemented these energy-saving features as a hierarchy of reinforcement learning agents described in Section 5.3.
5.2. Hierarchical Reinforcement Learning (HRL)
HRL is an extension of traditional reinforcement learning where several agents are hierarchically connected and work together to achieve a common objective. HRL employs two techniques, namely, task decomposition and temporal abstraction. Task decomposition breaks down the reinforcement learning problem into smaller subproblems wherein solving each of them will be more beneficial than solving the entire problem as seen in Figure 14 [31,32]. On the other hand, temporal abstraction involves a higher-level agent learning to perform the task by choosing optimal subtasks as higher-level actions [33,34]. This approach helps us to deal with exponentially growing memory requirements of high-dimensional complex reinforcement learning problems while improving their convergence probability and speed.
Moreover, HRL enables a flexible credit assignment to agents in a hierarchy based on their functionality [35]. The system designer can define separate reward functions for each subtask. Agents higher in the hierarchy can have a simpler and sparser reward function. Furthermore, this approach provides more structured exploration patterns throughout the training process leading to agents trained on subtasks and being able to transfer their experience to similar environments, something that most state-of-the-art algorithms tend to fail due to overspecialization. Additionally, it allows agents with different objectives and policies to coexist and coordinate with each other to achieve a common goal [23].
In our case, HRL provides an elegant approach to combine and implement different network optimization strategies operating on different time scales. By having the strategies as actions of a higher-level agent, we learn the sequence and the most suitable optimization strategies under different network scenarios. We delve further into the hierarchical aspects of this work in Section 5.3.
5.3. Network Optimization as an HRL Problem
In this work, we implemented an AI system (Figure 15) consisting of four independent and hierarchically connected agents (A#) as seen in Figure 15. These agents were trained to optimize the energy efficiency of the wireless network under some throughput degradation constraints using the features described in Section 5.1. The environment (E) models the behavior of a wireless network and provides feedback to the agents regarding their actions through a reward system. During each episode, A1 initializes the environment with an input traffic demand which returns a feature vector corresponding to its current state. Based on this information, A1 selects an optimization strategy that it deems most beneficial for that particular state; this is then executed by lower-level agents A2, A3, and A4. Following the completion of their task, these agents receive rewards accordingly, depending on their effectiveness in improving the energy efficiency within the network. Subsequently, they update the weights of their value network using Bellman’s Equation (18).
A combination of three agents (A2, A3, and A4) perform the tasks of carrier adaptation and radio resource adaptation (RRA), respectively. Algorithm 2 presents the pseudocode of the implementation. Table 2 describes the five agents.
| Algorithm 2 Single-operator network optimization algorithm |
|
Reinforcement Learning Algorithm
Of the many reinforcement learning algorithms, we focused on a variant of traditional Q-learning using neural networks as function approximators. Traditionally, in DQNs, during the learning (or training) phase, a single Q-network is used to select and evaluate an action. However, in noisy environments, this could lead to overestimating the action values (or Q-values), resulting in a slower learning process. To resolve this issue and obtain an unbiased Q-value estimate, we implemented each agent as a double deep Q-Network (DDQN) consisting of two Q-networks: (i) a value network and (ii) a target network, as seen in Figure 4 in [25]. In this approach, two separate Q-value estimators are used in tandem to select an action (i.e., action selection) and for value evaluation (i.e., action evaluation). The update is similar to (18) and is given as (19). Compared to the original formulation of a deep Q-network (18), the weights of the target network in a DDQN are replaced by those of the value network to evaluate the current greedy policy. The agents are trained using the experiences obtained at different time steps.
Experience Replay: Ensures the convergence of DNNs in a reinforcement learning scenario is a complex task. It requires a large number of uncorrelated data samples that are independent and identically distributed. To prevent action values from diverging catastrophically, experience replay is used. This technique involves randomly sampling experience tuples consisting of state–action pairs and corresponding rewards from the buffer memory during each learning iteration.
5.4. Q-Learning Definitions
- State: It is a representation of the environment that an agent finds itself in and influences the actions of an agent. In this work, we considered a diverse set of heuristically determined input features for each agent listed in Table 3. Each agent observes a subset/complete set of features depending on its role and position in the hierarchy. In addition to the features listed in Table 3, each agent receives features that are more specific to their role. For instance, the local configuration adapter agent takes as input only those features that are more relevant at the site of interest. The site selector for RRA—a centralized agent—receives information from all sites along with the user distribution statistics at each site. On the other hand, the carrier adapter receives as input the carriers that could be activated or deactivated at each site.
- Action space: It corresponds to the decisions that an agent takes at each decision point. Each agent has a different action set closely tied to its objective. Table 2 describes the agent’s actions.
- Reward: The reward signal is common to all the agents and is a function of the two optimization KPIs: network energy consumption and throughput. The reward is expressed asHere, and correspond to the percentage change in the energy consumption and throughput, respectively. Here, and () are their importance factors. They indicate the relative importance of the two parameters in the optimization process. is a fixed reward that is assigned based on the direction of change in the two KPIs.
5.5. Implementation Flow
In Figure 16, we illustrate the implementation flow of the RANaaS scenario consisting of four different entities, namely, (i) the TowerCo’s controller and energy manager, (ii) MNOs, and (iii) AI manager. The role of these entities is as follows:
- TowerCo’s controller and energy manager: The TowerCo’s controller is responsible for allocating the share of resources to different MNOs, including the maximum bandwidth and antenna configuration that can be used on each band (step 1). We assumed equal and non-overlapping spectral resources to be available to all the MNOs as outlined in Table 4. Furthermore, the TowerCo’s controller receives the energy cost per MNOs from the TowerCo’s energy manager (step 7). The latter calculates the energy cost per MNO based on resources used by them at different sites in a network as described in Section 4.5 (step 5).
- MNO: The operator controls its share of resources and the KPIs it would like to optimize or improve. In this case, we assumed all operators would like to improve on both the energy efficiency and the network throughput. The only difference was the maximum throughput degradation that each operator could permit. To make this decision, they could consider the average traffic demands at different sites and the requirements of the connected users. Moreover, we assumed that the operators used the AI system described in Section 5 for managing their share of resources. Doing so required the operators to send their AI and KPI requirements to the AI manager (step 2).
- AI manager: The role of the AI manager is to select an AI configuration based on the needs and requirements of the operator. In this case, it could depend on the desired energy-saving features, the KPIs to optimize, and the degradation restrictions or limitations on the throughput set forth by the operator. In this work, we assumed each operator to have its own AI system, as seen in Figure 15. The AI system/functionality shown in the Figure 13 assists the operator in optimizing their share of resources. Figure 16 shows it as separate AI agents connected to and controlled by each operator.
6. Implementation, Results, and Analysis
In this section, we implemented and evaluated the energy performance of the TowerCo’s RANaaS RAN-sharing scenario seen in Figure 8. We used the AI system proposed in [22] to assist each MNO in adapting their logical RAN resources. Following this, we looked at the energy savings’ probability under three scenarios and studied the impact of the operator’s requirements over 24 h. This analysis considered the energy-saving features activated under different scenarios and the extent to which the operator’s decisions overlapped. These simulations were carried out using a proprietary network-level evaluation tool.
6.1. System Setup, Simulation Parameters, and Assumptions
For the network deployment, we considered an urban deployment scenario consisting of seven three-sector sites, as seen in Figure 9. We consider three operators operating simultaneously in that area, each with a peak traffic demand of 350 Mbps/km [21]. The intersite distance was set to 1200 m, and the observation window (as defined in Section 4.1) during which we calculated the energy consumption was 160 ms. To run the simulations, we used an event-based simulator where an event corresponded to a change in the traffic demand and the network scenario. The performance of the proposed approach was measured in terms of the two network KPIs considered in the reward function (see Section 5.4). In the following subsections, we look at some assumptions from an operator and TowerCo’s perspective along with the baseline used to compare our results.
6.1.1. MNO
In RANaaS, the MNOs adapt/control the band state, the bandwidth, and the antenna configuration on the three bands at each site, as seen in Table 4. We considered two different throughput degradation limits of 0 and 20% for each MNO. These limits specified the maximum permissible reduction in the network throughput due to the network optimization actions taken by an MNO’s agent. The agents took these limits into account during training. Furthermore, the number of users served by each MNO simultaneously on the three bands was limited to 1/1/8, respectively. These numbers indicated that the users on band 1 and 2 were served sequentially while those on band 3 could be parallelized. In terms of user distribution, we assumed a uniform distribution of users across all sites for all the MNOs.
6.1.2. TowerCo
In the RANaaS scenario depicted in Figure 8, the TowerCo is responsible for the resource allocation and cost distribution. As a host of multiple operators, we assumed the TowerCo could support the simultaneous maximum resource utilization by all the MNOs meaning a maximum bandwidth utilization and the maximum number of users served simultaneously on all three bands by each operator. This gave us a cumulative TowerCo’s bandwidth of 30/60/300 MHz and TowerCo’s spatial multiplexing factor of 3/3/24 on the three bands 700/2100/3500 MHz, respectively. Furthermore, it should be able to serve all the users during a given time slot. To do so, we assumed that the TowerCo had enough BB-processing capacity to meet these requirements.
6.1.3. Baseline
The performance evaluation of the optimization strategies implemented as hierarchical agents was carried out in [22]. In that evaluation, we measured the energy savings obtained by comparing it against the baseline scenario with all resources activated at each site, i.e., from an operator perspective, the maximum bandwidth of 10/20/100 MHz and the maximum antenna configuration, 4/4/64 on the three bands 700/2100/3500 MHz, respectively. Furthermore, we assumed that the sleep modes had been activated, and the base station could switch down to one of the three levels depending on the duration of the idle period and the activation–deactivation time of each sleep mode. The three sleep levels, , , and , had sleep deltas of 0.84, 0.69, and 0.5, respectively. Similar to [22], in this work, the energy-savings obtained were additional to those obtained through advanced sleep modes. A few RL hyperparameters are listed in Table 5.
6.2. Result Categories
The results were analyzed from two perspectives: (i) TowerCo and (ii) MNO. From the TowerCo’s perspective, we had three different outcome categories as listed in Table 6 depending on the number of KPIs fulfilled for each operator. Furthermore, the requirements of the MNOs played a crucial role in the energy savings obtained and the energy cost distribution. For the MNO, we had five different outcome categories, as seen in Table 7. The KPIs fulfilled depended on how well the AI system could reduce the network energy consumption without degrading the throughput beyond the permissible limit for each operator. Amongst these two, we selected the energy consumption to play a dominant role by having a higher importance factor, i.e., achieving energy savings had a higher priority over throughput degradation within permissible limits. That led to the possibility of obtaining outcomes where only one of the requirements was satisfied, as listed in Table 7. We also analyzed how the AI system optimized an MNO’s share of resources under different TDLs. In the rest of the document, we refer to the TowerCo and MNO’s outcome categories as and , respectively, where x is the category of outcome and .
In addition to the two perspectives presented above, we divided the results into three scenarios as seen in Table 8. This division was based on the throughput degradation limits for each operator. We also assumed that the operators had the same 24 h traffic demand profile as seen in Figure 10. In our analysis, we not only evaluated the benefits of RAN sharing from an MNO or TowerCo’s perspective but also analyzed the scenarios which of the two RAN-sharing approaches (RANaaS and RAN services) could be more applicable and (or) beneficial.
6.3. TowerCo’s Energy Performance Analysis
To analyze the performance from a TowerCo’s perspective, we needed to look at how well each of the participating MNOs optimized their share of resources (i.e., local perspective) and the result of this independent optimization from a global perspective (i.e., the TowerCo’s level). Based on the outcome for each MNO, the TowerCo’s results could be categorized into three categories as listed in Table 6. From the TowerCo’s perspective, we would have liked to have most of the simulation outcomes falling in (see Table 6), which would have meant more simulation outcomes (see Table 7). However, due to the limitations of the AI system in learning the actual behavior of the environment, we ended up with outcomes in categories 2, 3, and 4 for an operator. During training, we tried to maximize both the reward obtained by the agents in each episode and the share of outcomes in categories 1 or 5. This approach was more applicable in our case as the maximum reward that could be obtained in a given scenario depended on the energy savings and throughput change. As these values were dependent on the network conditions and user distribution, we ended up in a scenario where similar actions under similar traffic demands could yield totally different rewards.
6.3.1. Energy Savings
In Figure 17, we plotted the scaled energy consumption for an operator in three different scenarios over 24 h. It presents the energy savings obtained by (i) activating sleep modes, (ii) optimizing resource utilization, and (iii) by sharing hardware resources with other operators. In the simplest case, activating symbol sleep provided up to two percent of energy savings over 24 h compared to the scenario with no sleep modes and network optimization. Enabling deeper sleep modes could increase these gains by up to seven percent. Deep sleep modes were most beneficial during the off-peak hours (4–7 h) as they provided up to 15–18 percent of energy savings as most sites had very few or no connected users.
In [22], we presented the benefits of AI-assisted network optimization. In this work, by modifying the AI architecture and the input features of the agents, we were able to achieve more instances where both KPIs were fulfilled. The average energy savings obtained by combining network optimization and sleep modes were around 20 percent over 24 h compared to having only symbol sleep. Finally, the lowest curve (TowerCo EC per MNO) shows the average energy consumption per operator if they were to use shared hardware. By sharing resources, operators could achieve a reduction of up to 70 percent in energy consumption as they shared both the active- and idle-mode energy consumption. During the active period, the energy consumption was distributed amongst the MNOs according to Algorithm 1 outlined in Section 4.5, while the idle-mode energy consumption was divided amongst all the participating MNOs. The savings could be as high as 20/13 percent of the AAU/RRU energy consumption at full load.
The operators’ requirements play an important role as they not only determine the outcome of the AI-driven network optimization, but also the outcome category both for the operator and the TowerCo service provider. We present this analysis in the following section.
6.3.2. Impact of Operator Requirements on the Outcome Probabilities
From an operator’s perspective, it is expected to have better results in relaxed network scenarios, which in this case is the higher TDL (see Table 9). Figure 18 shows the share of outcomes under each category for the three scenarios listed in Table 8. Here, S1 and S2 correspond to scenarios where an operator has a throughput degradation limit (TDL) of 0 and 20 percent, respectively, while in S3, the operator switches between the two extreme TDLs of 0 and 20 percent over 24 h. In an environment consisting of stationary users, having a more relaxed TDL increased the probability of fulfilling both the KPIs by 16 percent (i.e., 78.1 percent to 94.5 percent). However, the average energy savings for 0 and 20 percent TDL over 24 h stood at 15.1 and 14.3 percent, respectively. This indicates that similar network optimization actions taken in more relaxed scenarios (i.e., with higher TDL) could lead to favorable outcomes especially when we considered a static environment.
From a TowerCo’s perspective, we found that stringent requirements by all the MNOs (S1) reduced the probability of fulfilling all requirements for all the MNOs simultaneously. This is seen in Figure 19, where the probability of a outcome is 20 and 45 percent lower in the case of an S3 and S1 scenario in comparison to S2. Furthermore, the probability of a outcome is 39 percent lower as compared to the same category at the MNO level (i.e., 78 percent). Now, given that all the MNOs optimized their share of resources independently and the probability of in S1 and S2 were comparable, a lower probability of outcomes in S1 indicated a possibility for the TowerCo to improve in terms of resource allocation and (or) transferring optimization policies to the MNOs. Two ways to improve that could be through:
- A dynamic allocation of resources to MNOs based on their traffic demand and user distribution;
- Allowing the TowerCo to optimize the network for all the MNOs in a centralized manner.
These approaches require sharing additional information by the MNOs compared to the current implementation. The latter could involve migrating from RANaaS to RAN services and relinquishing control and responsibility of resource management by the MNOs to the TowerCo service provider. In RANaaS, the analysis from a TowerCo’s perspective boils down to studying the energy-saving features activated by the operators at different times and how often their actions overlap.
6.3.3. Impact of Operator Requirements on Energy-Saving Feature Activation and Savings
The operator requirements (e.g., different TDLs) could influence the activation probability and the energy savings obtained from the various features. For this analysis, we focused on a single feature-carrier adaptation. Table 10 summarizes the impact of different TDLs on the activation probability and the energy savings obtained by an operator by turning off a different number of bands. We observed that a higher TDL did not necessarily lead to increased activation carrier adaptation. Rather, the probability of selecting carrier adaptation remained constant at 25 percent across all scenarios. The lower preference (25 percent) for selecting carrier adaptation over bandwidth or antenna adaptation could be due to two reasons:
- 1.
- The limitation imposed in terms of how often bands could be turned ON/OFF during an observation period. We set this limitation factor to 10, i.e., it took ten times longer to perform carrier adaptation as compared to adapting the bandwidth or antenna configuration. In other words, in an episode of 20 steps, a band’s state could be changed at most twice.
- 2.
- The partial reassociation of connected users—turning off a band required moving the users connected to a different site and (or) band. However, in a stationary environment where all bands are uniformly loaded, it could be difficult to find a band at the same/different site that could accommodate additional users without degrading the KPIs of interest. In such a scenario, the carrier shutdown action is not executed fully, leading to a more unbalanced network. Such a network is more likely to degrade on the KPIs of interest.
These factors rendered carrier adaptation to be a multilevel decision-making problem of identifying the carriers that could be turned off and reassociating the connected users. Across all scenarios, we found the probability of turning off just one band was 70 percent higher compared to turning off more bands. This was due to the two reasons mentioned earlier. Additionally, the increased network energy consumption due to user reassociation was not compensated by the energy saving obtained by turning off more bands. However, as described in Section 6.3.2 and seen in Table 10, having some room in the form of a higher TDL offered the AI system an opportunity to take this action and achieve up to 37 percent higher simulation outcomes.
From a TowerCo’s perspective, long-term actions such as carrier shutdown can only be implemented if it has been selected by all the operators. This extent of overlap in decisions taken by the operators is the focus of the next section.
6.3.4. Overlapping Actions from a TowerCo’s Perspective
To decide on the most suitable RAN-sharing approach, one could not only look at the actions taken by different operators but also at how often these actions overlap. Of the three possible energy-saving features, we focused on carrier adaptation as its impact at the TowerCo’s level was observed only in fully overlapping scenarios (i.e., when all the MNOs had taken the same decision). In other words, a carrier shutdown decision at any site was executed only when all the MNOs decided to do so. Table 11 summarizes the extent to which actions overlapped in the three scenarios.
From the TowerCo’s perspective in Table 11, we found that carrier adaptation was invoked a similar number of times by one or more MNOs across all three scenarios. These results were in line with the observations in Table 10 indicating that the maximum TDL did not impact the selection of carrier adaptation. It was expected in a stationary environment, as the probability of taking that action depended on user distribution and the load at different sites. Of the total carrier adaptation actions, we observed similar percentages of overlap of 27 to 30 percent across the three scenarios (see Table 11). It was because each MNO took actions independently of the others without any form of coordination. However, as seen in Figure 20, the share of outcomes in overlapped scenarios increased by 33 percent with an increase in TDL. It is observed in Figure 21, Figure 22 and Figure 23 where the ratio of the number of overlapping instances (in blue) to those that resulted in a outcome (in red) increased as we went from 0 to intermediate to 20 percent TDL. It indicated that under stringent network requirements (Figure 21), the overlapping actions were not equally beneficial to all the operators.
In the overlapping instances, we observed that the probability of turning off more than one band was lower than 15 percent, irrespective of the TDL (see Table 10). This was 70 percent lower than the probability of turning off one band and could be due to two factors described in Section 6.3.3. Firstly, there were inherent limitations in the form of stationary users associated with the environment and a combination of energy-saving features operating on different time scales. Secondly, as described in Section 6.3.3, certain limitations made it difficult to change a carrier state compared to other features such as bandwidth or antenna configuration.
The lower share of fully overlapping actions meant that the TowerCo was unable to implement the action in 70 percent of the cases. In other words, the TowerCo could turn off a band only when all the MNOs agreed—an outcome achieved in just 12 percent of overlapping cases. This lack of coordination severely impacted the TowerCo’s energy savings and profitability; therefore, a centralized coordinating entity is necessary—a role that can be fulfilled by the TowerCo itself. Doing so would improve their energy savings and share of outcomes.
6.3.5. Energy Savings from a TowerCo’s Perspective
In this subsection, we analyzed the impact of different TDLs and the percentage of overlapping actions on the TowerCo’s energy performance. In the RANaaS implementation, the TowerCo did not control resources used by MNOs. Rather, it only distributed energy consumption costs based on resources used by MNOs. As a result, across the three scenarios tested here (S1–S3), similar energy savings of around 65 percent were obtained. The average TowerCo’s energy consumption over 24 h in S2 was two percent lower, while that in S3 was one percent higher compared to S1.
As described in Section 6.3.2, RAN services could bridge the percentage difference of simulation outcomes in category one from the operators’ and TowerCo’s perspectives. It provides a way forward to serve multiple operators based on traffic demands, user distribution, and network configuration of all MNOs. Furthermore, if the operators opt for the RANaaS offering, the energy cost distributions must consider how much their actions overlap.
6.4. Comparison to Other Works
In this section, we compare our work and other related works in the methodology, assumptions, and results obtained. In [12,13], the authors looked into RAN sharing in different network deployments. Their idea of RAN sharing revolved around the virtualization of RAN functionalities, and its impact on different KPIs such as latency, throughput, and network energy consumption for a single operator. Contrarily, we assumed a fixed degree of virtualization and analyzed the impact of varying resource utilization by multiple operators on the distribution of the TowerCo’s energy costs, the probability of fulfilling both the KPIs from a TowerCo’s perspective, and the energy-saving features that overlapped had the most impact during different hours of the day. In simple words, the foundation of our work was on radio resource utilization, while the others focused on the virtualization of RAN functionalities.
In [13], the authors focused on energy efficiency aspects and the benefits of RANaaS implementation in a heterogeneous network. They analyzed the variation in the packet loss and the network power consumption with a progressive virtualization of RAN functionalities. They found that in the case of a single operator, an optimal virtualization solution could provide up to 17% higher energy efficiency compared to a random policy. Similarly, in [12], the authors analyzed the impact of the centralization of processing and management in RAN based on the service requirements and network characteristics in a homogeneous network.
In a more recent work [14], the authors proposed a dynamic radio slice allocation to each operator based on their requirements and service level agreement (SLA) constraints. In particular, they analyzed the impact of dynamic spectrum allocation on the throughput and latency. It is in line with our RAN services approach described in Section 1.1.3, wherein the TowerCo manages and controls the resources allocated to the different operators. On evaluating the performance of their algorithm, the authors showed that it was possible to reduce the latency by 50 percent and improve their throughput by 3–5 times for operators with fewer spectral resources. As we studied a different RAN-sharing approach, we consider this work as a baseline for future studies on the RAN services scenario.
A comparison of energy savings depends heavily on the assumption of the base station’s power model, the network deployment scenarios, and the traffic demand. As a result, we are limited to [15,20,22] for energy savings, and [27] for the power model constants. While [6,7,8,9] provided a good input on the management of ASMs, they were not very comparable in terms of the energy-saving results due to their significantly lower sleep mode’s power consumption values. The authors assumed a reduction of 80, 94, and 96 percent in the power consumption of the base station due to activating , , and , respectively, in contrast to our assumption of 16, 31, and 50 percent for the same. As a result, their energy savings of 60 percent were significantly higher as compared to our values of 20 percent. This coupled with their very low traffic demands of 1 user/s/km makes our work unique in this regard.
7. Conclusions and Future Work
RAN sharing has a great potential to reduce both OPEX and CAPEX for the network operators, freeing up valuable resources that can be used to acquire new services and improve user experience. In this work, we analyzed how a RANaaS RAN-sharing approach affected the energy consumption of network operators under varying throughput degradation limits. Additionally, we explored how AI could be integrated into the optimization process in order to assist operators with resource optimization. Furthermore, we evaluated the impact of different operator requirements on the optimization process, such as the energy-saving probability and absolute energy savings from an operator and TowerCo’s perspective [22]. We showed that an AI-driven network optimization could allow an MNO to scale its resources according to traffic demands, resulting in average energy savings of 15–20 percent; however, these benefits tended to saturate when densifying the network for higher traffic demands. This was where RAN sharing could provide significant additional value: up to 50 percent more energy savings over 24 h by sharing active/idle-mode power consumption (see Figure 24).
From the analysis of our results, it is evident that network operators’ requirements have an important influence not only on the optimization process, energy-saving potential, and absolute energy savings but also on selecting the right RAN-sharing solution. Deciding on the type of RAN sharing is a complex task that depends on:
- 1.
- The operator’s preferences and needs;
- 2.
- The level of autonomy and control desired by the operators over their resources;
- 3.
- The data shared with TowerCo service providers;
- 4.
- How often data should be exchanged in the case of RAN services for achieving reasonable gains from a centralized network optimization;
- 5.
- Whether or not there is any pricing difference for both RAN-sharing options.
Deciding between these two approaches—RANaaS and RAN services—requires careful consideration of all the relevant aspects, most importantly, the security and privacy of the data shared with the TowerCo service provider. In both the RAN sharing scenarios, the responsibility of data security lies with the TowerCo service provider. Furthermore, the level of security depends on the type of data and services that an operator would like to activate, and the TowerCo should guarantee that there is no information leakage. As for the control, the motivation for a more centralized control comes from the fact that slower energy-saving features, such as carrier adaptation, need more coordination between MNOs compared to faster energy-saving features such as antenna or bandwidth adaptation (see Section 6.3.4 and Section 6.3.3).
Ensuring that the TowerCo has the ability to enforce a certain level of coordination could enable it to achieve its own targets, if any, thereby bringing balance to negotiations and discussions which have historically favored the MNOs, while providing commercial/business incentives for TowerCos to continue operating and provide services beyond standard functions. Not only does this enable the MNOs to optimize their share of energy consumption through resource optimization, but it also provides an opportunity for TowerCos to increase profits by providing some high-level coordination based on source and cost of energy. Moreover, it can further allow them access to advanced analytics capabilities in order to improve network performance metrics such as latency, throughput, reliability, and overall energy savings. Overall, it is a win-win scenario for both the operators and the TowerCo service provider.
There are several ways this work can be expanded in future studies, including dynamic RAN-sharing scenarios where a TowerCo serves operators who have opted for either approach; carrying out a deeper analysis of RAN-sharing scenarios where both approaches can coexist; assessing the impact of traffic demands and operator requirements on the TowerCo’s performance; and comparing network performance in terms of latency, throughput, reliability, and energy savings in both cases.
Author Contributions
Conceptualization, S.K.G.P., M.O., S.A., C.Q. and A.D.; Methodology, S.K.G.P., M.O., S.A. and C.Q.; Software, S.K.G.P.; Validation, S.K.G.P.; Formal analysis, S.K.G.P.; Investigation, S.K.G.P., M.O. and S.A.; Resources, S.K.G.P., M.O. and S.A.; Data curation, S.K.G.P.; Writing—original draft, S.K.G.P.; Writing—review editing, S.K.G.P., M.O. and S.A.; Visualization, S.K.G.P. and S.A.; Supervision, M.O., S.A. and C.Q.; Project administration, M.O. and S.A. All authors have read and agreed to the published version of the manuscript.
Funding
This research received no external funding.
Data Availability Statement
Data sharing is not applicable to this article.
Conflicts of Interest
The authors declare no conflict of interest.
Abbreviations
The following abbreviations are used in this manuscript:
| AAU | Active antenna unit |
| AI | Artificial intelligence |
| AR | Augmented reality |
| BB | Baseband |
| CAPEX | Capital expenditure |
| CIC | Cluster intelligent controller |
| CLRC | ClusterRAN controller |
| CLRI | ClusterRAN infrastructure |
| DDQN | Double deep Q-Network |
| DNN | Deep neural networks |
| EC | Energy consumption |
| EE | Energy efficiency |
| GHG | Greenhouse gas |
| ICT | Information and communication technology |
| KPI | Key performance indicators |
| LCM | Life-cycle management |
| MNO | Mobile network operator |
| NF | Network function |
| NPN | Nonpublic network |
| OPEX | Operational expenditure |
| RAN | Radio access networks |
| RANaaS | Radio access network as a service |
| RL | Reinforcement learning |
| RRA | Radio resource adaptation |
| RRU | Remote radio unit |
| SGD | Stochastic gradient descent |
| SIP | Service infrastructure provider |
| SLA | Service level agreement |
| TDL | Throughput degradation limit |
| VR | Virtual reality |
Appendix A
List of Variables and Parameters
Of the various parameters listed in Table A1, the variable parameters include the number of active antennas at base station i, , and the bandwidth per user k or at each site, B. Furthermore, the capacity bands can be turned on/off at each site depending on the traffic demand.

Table A1.
List of variables.
| Variable | Symbol | Unit | Min Value | Max Value |
|---|---|---|---|---|
| Number of interferering BSs | 3 | 6 | ||
| Number of users in each cell | N | |||
| Observation time | T | ms | 0 | 160 |
| Cell radius | m | 0 | 400 | |
| Average requirement per user k | MB | |||
| Traffic demand | Mbps/km | |||
| Share of active subscribers | % | 2 | 16 | |
| Achievable rate per user | ||||
| Signal power | ||||
| Interference power | ||||
| Activity factor of BS i | 0 | 1 | ||
| Bandwidth per user k or the bandwidth used at a site | B | MHz | 0 | 100 |
| Number of spatial multiplexing layers | 1 | 2 | ||
| Number of users served simultaneously | ||||
| Power per power amplifier | p | W | ||
| Efficiency of power amplifier | % | 0 | 25 | |
| Power amplifier constant | ||||
| Active antennas at BS i | 0 | 64 | ||
| Distance of a user from a BS | D | m | 0 | 800 |
| Path loss exponent | 1 | ∞ | ||
| Antenna gain | c | |||
| Precoding matrix | ||||
| Weights matrix | ||||
| Local oscillator power consumption | W | |||
| Number of sectors | 0 | 3 | ||
| BS’s no-load power consumption | W | |||
| BS’s fixed power consumption | W | |||
| BS’s total power consumption | W | |||
| Energy consumption of a BS | E | J | ||
| Sleep delta/mode | 1 | 3 | ||
| Idle time | ms | 0 | 160 | |
| Sleep level transition times | ms | 0.0005 | 15 | |
| Total deployment area | km | |||
| Base station density |
References
- Andrae, A. New perspectives on internet electricity use in 2030. Eng. Appl. Sci. Lett. 2020, 3, 19–31. [Google Scholar]
- Andrae, A.; Edler, T. On Global Electricity Usage of Communication Technology: Trends to 2030. Challenges 2015, 6, 117–157. [Google Scholar] [CrossRef] [Green Version]
- ITU: Smart Energy Saving of 5G Base Stations: Traffic Forecasting and Strategy Optimization of 5G Wireless Network Energy Consumption Based on Artificial Intelligence and Other Emerging Technologies. 2021. Available online: https://www.itu.int/rec/T-REC-L.Sup43-202105-I (accessed on 1 June 2022).
- Huawei White Paper: Green 5G. 2022. Available online: http://www-file.huawei.com/-/media/corp2020/pdf/tech-insights/1/green_5g_white_paper_en_v2.pdf (accessed on 1 June 2022).
- Auer, G.; Giannini, V.; Desset, C.; Godor, I.; Skillermark, P.; Olsson, M.; Imran, M.A.; Sabella, D.; Gonzalez, M.J.; Blume, O.; et al. How much energy is needed to run a wireless network? IEEE Wirel. Commun. 2011, 18, 40–49. [Google Scholar] [CrossRef]
- Salem, F.E.; Altman, Z.; Gati, A.; Chahed, T.; Altman, E. Reinforcement learning approach for Advanced Sleep Modes management in 5G networks. In Proceedings of the VTC-FALL 2018: 88th Vehicular Technology Conference, Chicago, IL, USA, 27–30 August 2018; IEEE Computer Society: Chicago, IL, USA, 2018; pp. 1–5. [Google Scholar] [CrossRef]
- Salem, F.E.; Chahed, T.; Altman, E.; Gati, A.; Altman, Z. Optimal Policies of Advanced Sleep Modes for Energy-Efficient 5G networks. In Proceedings of the 2019 IEEE 18th International Symposium on Network Computing and Applications (NCA), Cambridge, MA, USA, 26–28 September 2019; pp. 1–7. [Google Scholar] [CrossRef] [Green Version]
- Salem, F.E.; Gati, A.; Altman, Z.; Chahed, T. Advanced Sleep Modes and Their Impact on. In Proceedings of the 2017 IEEE 86th Vehicular Technology Conference (VTC-Fall), Toronto, QC, Canada, 24–27 September 2017; pp. 1–7. [Google Scholar]
- Salem, F.E.; Chahed, T.; Altman, Z.; Gati, A. Traffic-aware Advanced Sleep Modes management in 5G networks. In Proceedings of the 2019 IEEE Wireless Communications and Networking Conference (WCNC), Marrakesh, Morocco, 15–18 April 2019; pp. 1–6. [Google Scholar]
- Masoudi, M.; Khafagy, M.; Soroush, E.; Giacomelli, D.; Morosi, S.; Cavdar, C. Reinforcement Learning for Traffic-Adaptive Sleep Mode Management in 5G Networks. In Proceedings of the 2020 IEEE 31st Annual International Symposium on Personal, Indoor and Mobile Radio Communications, IEEE PIMRC, London, UK, 1 August–3 September 2020. [Google Scholar]
- European Commission: Mergers: Joint Control of INWIT by Telecom Italia and Vodafone. 2022. Available online: https://ec.europa.eu/commission/presscorner/detail/en/ip_20_414 (accessed on 15 June 2022).
- Rost, P.; Bernardos, C.J.; Domenico, A.D.; Girolamo, M.D.; Lalam, M.; Maeder, A.; Sabella, D.; Wübben, D. Cloud technologies for flexible 5G radio access networks. IEEE Commun. Mag. 2014, 52, 68–76. [Google Scholar] [CrossRef]
- Sabella, D.; de Domenico, A.; Katranaras, E.; Imran, M.A.; di Girolamo, M.; Salim, U.; Lalam, M.; Samdanis, K.; Maeder, A. Energy Efficiency Benefits of RAN-as-a-Service Concept for a Cloud-Based 5G Mobile Network Infrastructure. IEEE Access 2014, 2, 1586–1597. [Google Scholar] [CrossRef] [Green Version]
- Kassis, M.; Costanzo, S.; Yassin, M. Flexible Multi-Operator RAN Sharing: Experimentation and Validation Using Open Source 4G/5G Prototype. In Proceedings of the 2021 Joint European Conference on Networks and Communications & 6G Summit (EuCNC/6G Summit), Porto, Portugal, 8–11 June 2021; pp. 205–210. [Google Scholar] [CrossRef]
- Hossain, M.M.A.; Cavdar, C.; Björnson, E.; Jäntti, R. Energy Saving Game for Massive MIMO: Coping with Daily Load Variation. IEEE Trans. Veh. Technol. 2018, 67, 2301–2313. [Google Scholar] [CrossRef]
- Chavarria-Reyes, E.; Akyildiz, I.F.; Fadel, E. Energy-Efficient Multi-Stream Carrier Aggregation for Heterogeneous Networks in 5G Wireless Systems. IEEE Trans. Wirel. Commun. 2016, 15, 7432–7443. [Google Scholar] [CrossRef]
- Oh, E.; Son, K.; Krishnamachari, B. Dynamic Base Station Switching-On/Off Strategies for Green Cellular Networks. IEEE Trans. Wirel. Commun. 2013, 12, 2126–2136. [Google Scholar] [CrossRef]
- Liu, J.; Krishnamachari, B.; Zhou, S.; Niu, Z. DeepNap: Data-Driven Base Station Sleeping Operations Through Deep Reinforcement Learning. IEEE Internet Things J. 2018, 5, 4273–4282. [Google Scholar] [CrossRef]
- Miao, Y.; Yu, N.; Huang, H.; Du, H.; Jia, X. Minimizing Energy Cost of Base Stations with Consideration of Switching ON/OFF Cost. In Proceedings of the 2016 International Conference on Advanced Cloud and Big Data (CBD), Chengdu, China, 13–16 August 2016; pp. 310–315. [Google Scholar]
- Peesapati, S.K.G.; Olsson, M.; Masoudi, M.; Andersson, S.; Cavdar, C. Q-learning based Radio Resource Adaptation for Improved Energy Performance of 5G Base Stations. In Proceedings of the 2021 IEEE 32nd Annual International Symposium on Personal, Indoor and Mobile Radio Communications (PIMRC), Helsinki, Finland, 13–16 September 2021; pp. 979–984. [Google Scholar] [CrossRef]
- Peesapati, S.K.G.; Olsson, M.; Masoudi, M.; Andersson, S.; Cavdar, C. An Analytical Energy Performance Evaluation Methodology for 5G Base Stations. In Proceedings of the 2021 17th International Conference on Wireless and Mobile Computing, Networking and Communications (WiMob), Bologna, Italy, 11–13 October 2021; pp. 169–174. [Google Scholar] [CrossRef]
- Peesapati, S.K.G.; Olsson, M.; Andersson, S. A Multi-Strategy Multi-Objective Hierarchical Approach for Energy Management in 5G Networks. In Proceedings of the 2022 IEEE Global Communications Conference: Green Communication Systems and Networks (Globecom 2022 GCSN), Rio de Janeiro, Brazil, 4–8 December 2022. [Google Scholar]
- Nachum, O.; Tang, H.; Lu, X.; Gu, S.; Lee, H.; Levine, S. Why Does Hierarchy (Sometimes) Work So Well in Reinforcement Learning? arXiv 2019, arXiv:cs.LG/1909.10618. [Google Scholar]
- Pateria, S.; Subagdja, B.; Tan, A.h.; Quek, C. Hierarchical Reinforcement Learning: A Comprehensive Survey. ACM Comput. Surv. 2021, 54, 1–35. [Google Scholar] [CrossRef]
- Do, Q.; Koo, I. Deep Reinforcement Learning Based Dynamic Spectrum Competition in Green Cognitive Virtualized Networks. IEEE Access 2021, 9, 1. [Google Scholar] [CrossRef]
- Hossain, M.M.A.; Cavdar, C.; Björnson, E.; Jantti, R. Energy-Efficient Load-Adaptive Massive MIMO. In Proceedings of the 2015 IEEE Globecom Workshops (GC Wkshps), San Diego, CA, USA, 6–10 December 2015; pp. 1–6. [Google Scholar] [CrossRef] [Green Version]
- Andersson, G.; Vastberg, A.; Devlic, A.; Cavdar, C. Energy efficient heterogeneous network deployment with cell DTX. In Proceedings of the 2016 IEEE International Conference on Communications (ICC), Kuala Lumpur, Malaysia, 22–27 May 2016; pp. 1–6. [Google Scholar] [CrossRef]
- Andersen, J.B. Array gain and capacity for known random channels with multiple element arrays at both ends. IEEE J. Sel. Areas Commun. 2000, 18, 2172–2178. [Google Scholar] [CrossRef]
- 3GPP-TS 38.331-NR-Radio Resource Control (RRC); Protocol specification. Available online: https://www.3gpp.org/dynareport/38331.htm (accessed on 15 March 2022).
- Debaillie, B.; Desset, C.; Louagie, F. A Flexible and Future-Proof Power Model for Cellular Base Stations. In Proceedings of the 2015 IEEE 81st Vehicular Technology Conference (VTC Spring), Glasgow, UK, 11–14 May 2015; pp. 1–7. [Google Scholar] [CrossRef]
- Hengst, B. Hierarchical Reinforcement Learning. In Encyclopedia of Machine Learning; Sammut, C., Webb, G.I., Eds.; Springer US: Boston, MA, USA, 2010; pp. 495–502. [Google Scholar] [CrossRef]
- Dethlefs, N.; Cuayáhuitl, D.H. Combining Hierarchical Reinforcement Learning and Bayesian Networks for Natural Language Generation in Situated Dialogue. In Proceedings of the 13th European Workshop on Natural Language Generation (ENLG), Nancy, France, 28–30 September 2011. [Google Scholar]
- Yan, Q.; Liu, Q.; Hu, D. A hierarchical reinforcement learning algorithm based on heuristic reward function. In Proceedings of the 2010 2nd International Conference on Advanced Computer Control, Shenyang, China, 27–29 March 2010; Volume 3, pp. 371–376. [Google Scholar] [CrossRef]
- Kawano, H. Hierarchical sub-task decomposition for reinforcement learning of multi-robot delivery mission. In Proceedings of the 2013 IEEE International Conference on Robotics and Automation, Karlsruhe, Germany, 6–10 May 2013; pp. 828–835. [Google Scholar] [CrossRef]
- Vezhnevets, A.S.; Osindero, S.; Schaul, T.; Heess, N.; Jaderberg, M.; Silver, D.; Kavukcuoglu, K. FeUdal Networks for Hierarchical Reinforcement Learning. arXiv 2017, arXiv:cs.AI/1703.01161. [Google Scholar]
Figure 1.
Share of ICT energy consumption by different categories.

Figure 2.
Site energy consumption composition.

Figure 3.
ClusterRAN system model.

Figure 4.
RAN as a service in ClusterRAN.

Figure 5.
Illustration of the actors in a RANaaS and RAN services.

Figure 6.
Coordination functionality required in a TowerCo RANaaS offering to independent MNO logical RANs. For a separate RAN, the indicated AI functionalities are offered by vendor-specific platforms.
Figure 6.
Coordination functionality required in a TowerCo RANaaS offering to independent MNO logical RANs. For a separate RAN, the indicated AI functionalities are offered by vendor-specific platforms.

Figure 7.
TowerCo function for RAN coordination introduction.

Figure 8.
TowerCo RANaaS simulation setup.
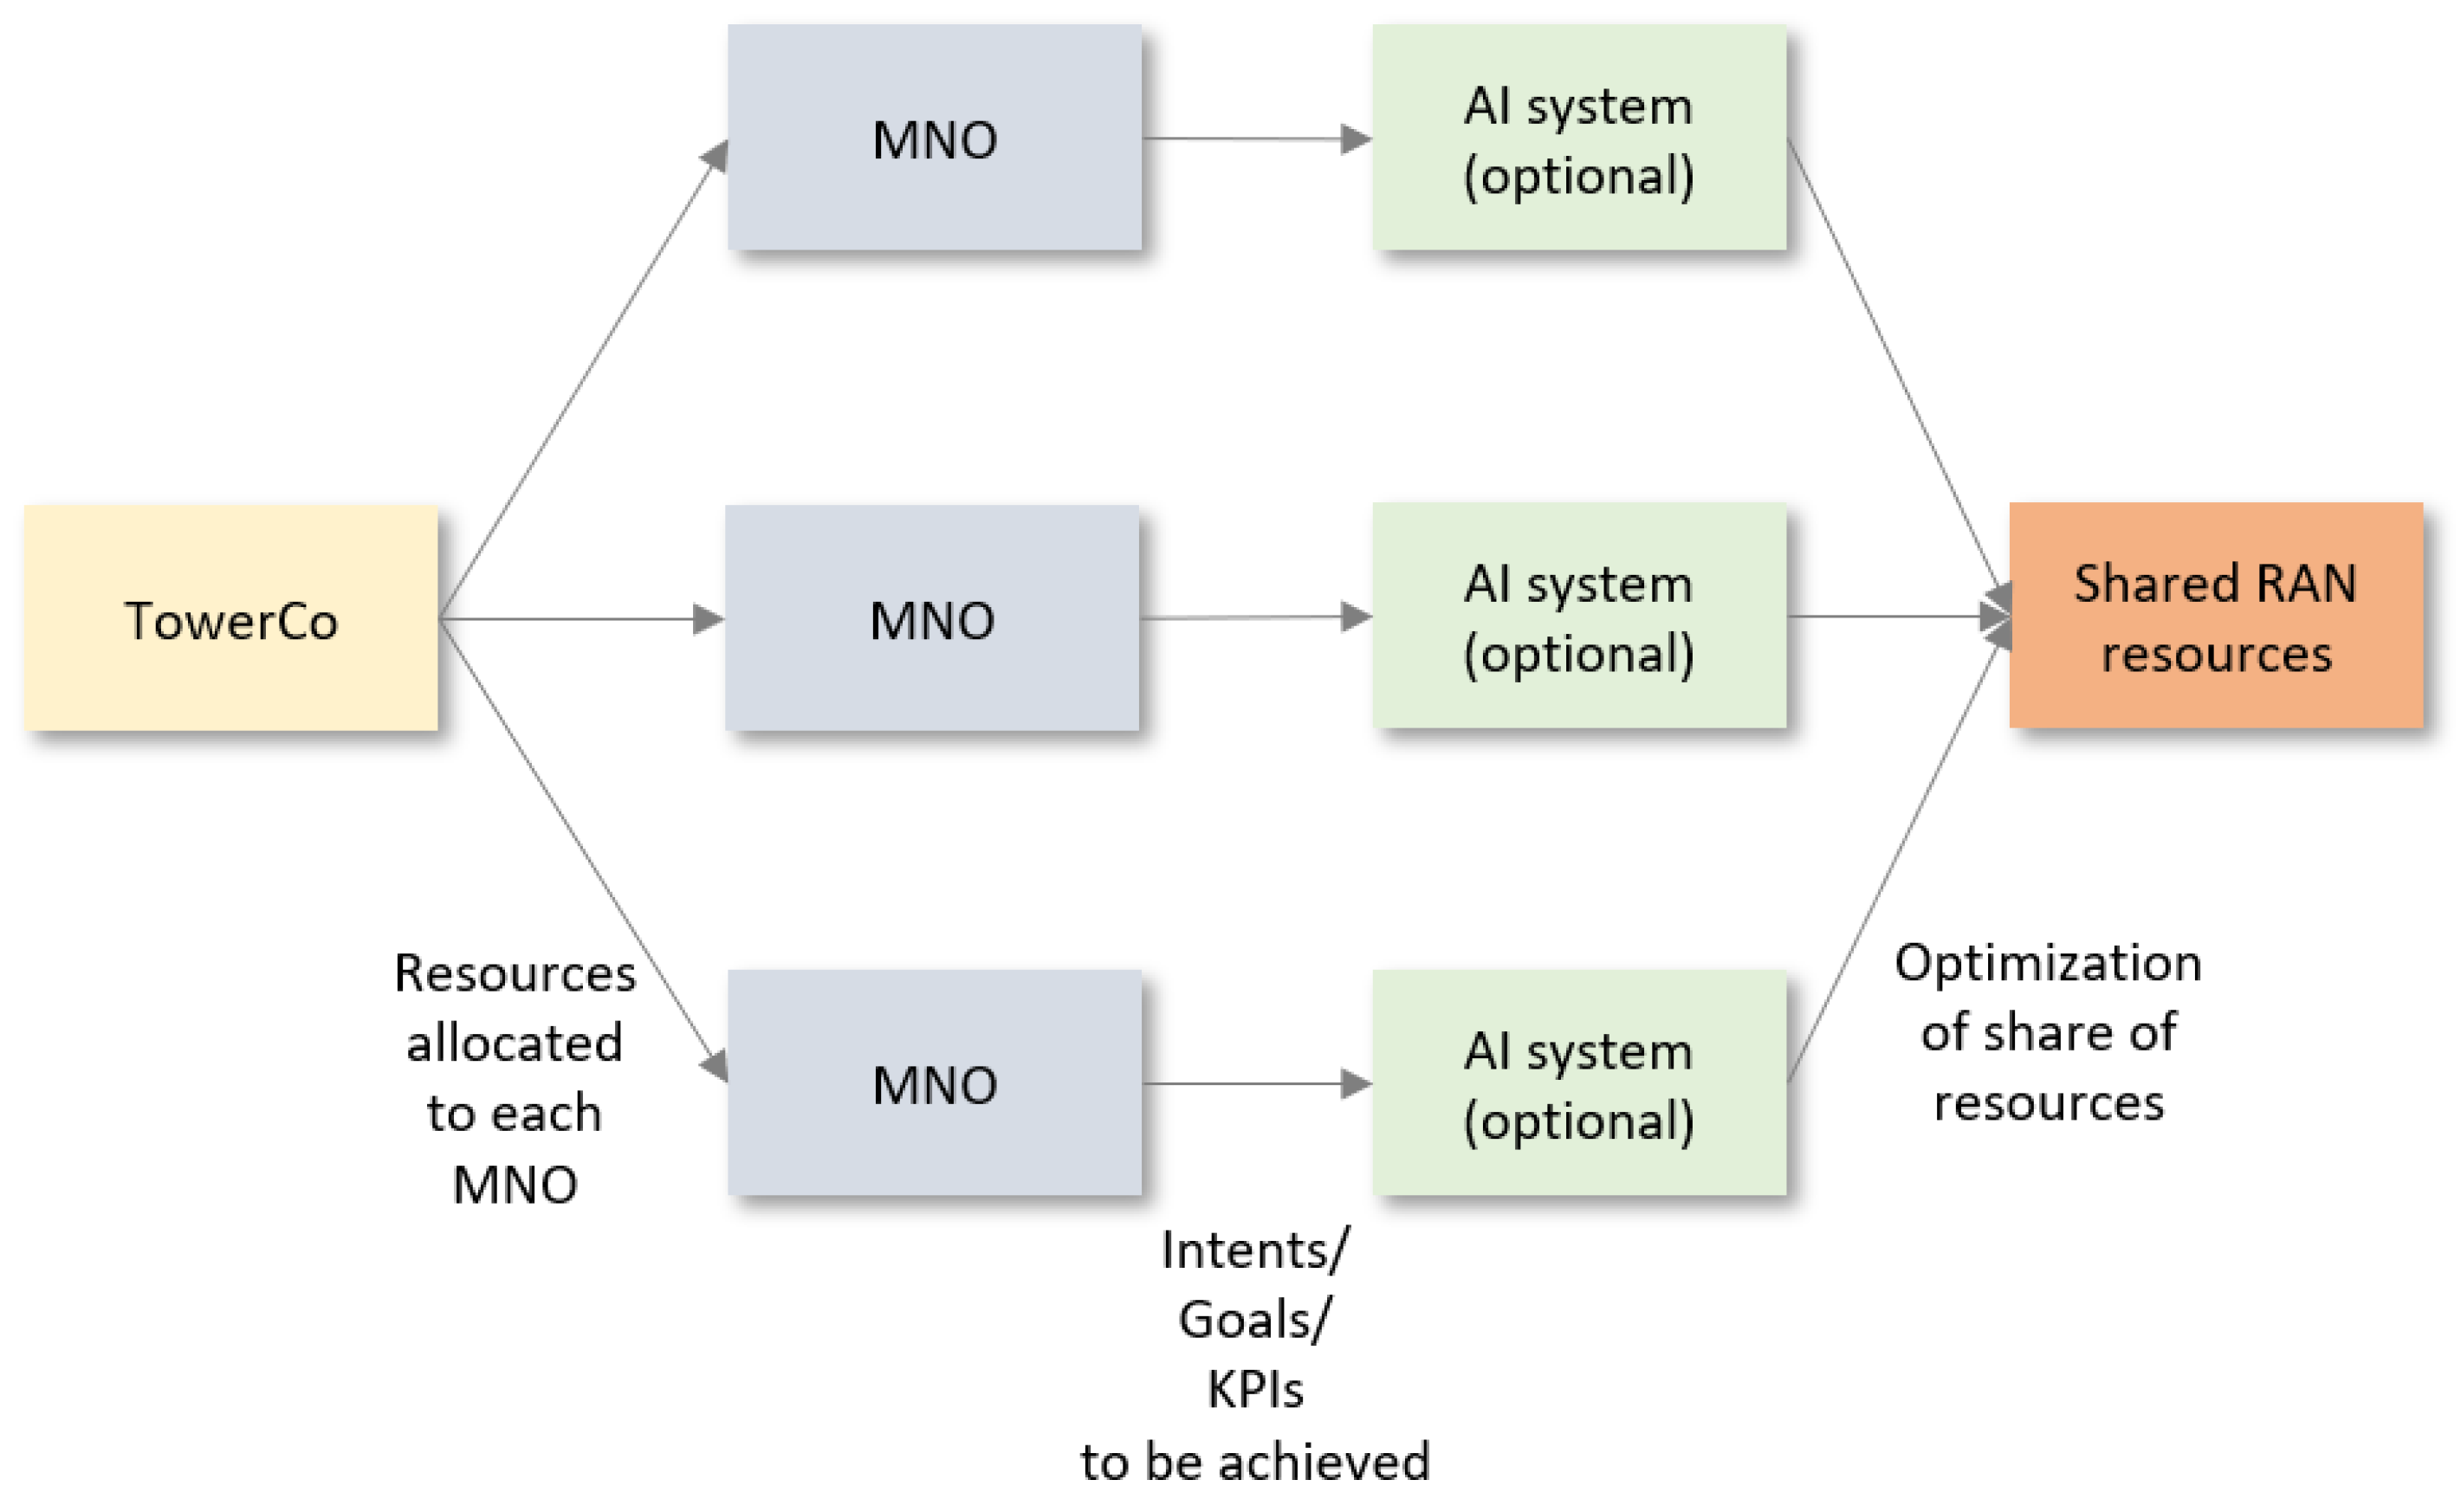
Figure 9.
Seven three-sector sites deployment scenario.

Figure 10.
Traffic demand profile over 24 h. (Note: In this plot, represents the share of active subscribers at a given hour).
Figure 10.
Traffic demand profile over 24 h. (Note: In this plot, represents the share of active subscribers at a given hour).

Figure 11.
Activity factor of a base station.

Figure 12.
Simplistic power consumption variation.

Figure 13.
Components of a logical RAN instance.

Figure 14.
Hierarchical reinforcement learning.

Figure 15.
HRL implementation.

Figure 16.
Process flow.

Figure 17.
Energy consumption per MNO in different scenarios over 24 h. (NO—network optimization and EC—energy consumption. Note: The values are scaled with respect to the highest initial energy consumption with no sleep modes).
Figure 17.
Energy consumption per MNO in different scenarios over 24 h. (NO—network optimization and EC—energy consumption. Note: The values are scaled with respect to the highest initial energy consumption with no sleep modes).

Figure 18.
Outcome probabilities for an operator under varying throughput degradation limits.

Figure 19.
Impact of operator requirements on the probability of turning off a different number of bands.
Figure 19.
Impact of operator requirements on the probability of turning off a different number of bands.

Figure 20.
Percentage of overlapping actions falling under each TowerCo’s category across all simulation scenarios.
Figure 20.
Percentage of overlapping actions falling under each TowerCo’s category across all simulation scenarios.

Figure 21.
Number of overlapped carrier adaptation actions and their impact on the TowerCo’s outcome category (0 percent TDL-S1). (Note: TC_x refers to TowerCo category x or ).
Figure 21.
Number of overlapped carrier adaptation actions and their impact on the TowerCo’s outcome category (0 percent TDL-S1). (Note: TC_x refers to TowerCo category x or ).

Figure 22.
Number of overlapped carrier adaptation actions and their impact on the TowerCo’s outcome category (mixed TDL-S3). (Note: TC_x refers to TowerCo category x or ).
Figure 22.
Number of overlapped carrier adaptation actions and their impact on the TowerCo’s outcome category (mixed TDL-S3). (Note: TC_x refers to TowerCo category x or ).

Figure 23.
Number of overlapped carrier adaptation actions and their impact on the TowerCo’s outcome category (20 percent TDL-S2). (Note: TC_x refers to TowerCo category x or ).
Figure 23.
Number of overlapped carrier adaptation actions and their impact on the TowerCo’s outcome category (20 percent TDL-S2). (Note: TC_x refers to TowerCo category x or ).

Figure 24.
Average energy savings from different activations. (Note: Here, the different colours as we move from the left (symbol sleep) to the right indicate the additional energy savings obtained by activating more features. For instance, magenta—the energy savings obtained by enabling symbol sleep; green—additional energy savings obtained from enabling deeper sleep modes; magenta + green + gray—energy savings due to network optimization).

Table 1.
A summary of the related works in the years 2020–2023.
| Year | Papers | Area/Key Points |
|---|---|---|
| 2020 | [1,10] | |
| 2021 | [3,14,20,21,24,25] |
|
| 2022 | [4,22] |
|
Table 2.
RL Agent description.
| Agent | No. of Features | No. of Actions | Type of Agent | Description/Actions |
|---|---|---|---|---|
| A1: Strategy selector | 152 | 3 | Network-level | Identifies the optimal selection sequence of different optimization strategies for a given network scenario. Actions include calls to lower-level agents that perform user–cell association, carrier shutdown, or site-level RRA. |
| A2: Carrier adapter | 66 | 15 | Network-level | Switches on or off the capacity layers at different sites depending on the network scenario. |
| A3: Site selector for RRA | 72 | 8 | Network-level | Identifies the sites where RRA could lead to energy savings without negatively impacting the user throughput. |
| A4: Site-level RRA or local configuration adapter | 22 | 13 | Site-level | Performs antenna and bandwidth adaptation at the site selected by A4 depending on the network scenario, the number of connected users, and other site-level metrics. |
Table 3.
List of features.
| Feature | Input to Agent |
|---|---|
| Overall activity factor | 1–4, 5 * |
| Channel conditions | (1–4) , 5 * |
| Number of connected users | 1–4, 5 * |
| Number of users per band at each site | 1–4, 5 * |
| Average SINR | 1–4, 5 * |
| Carrier state at each site | 1–4, 5 * |
| Antenna configuration | 1–4, 5 * |
| Bandwidth utilized | 1–4, 5 * |
| Statistics of the user with lowest SINR | 1, 2 |
| Permissible throughput degradation | 1–5 |
| Current throughput degradation | 1–5 |
| Network energy consumption | 1–5 |
*: values pertaining to a single site, : values pertaining to the three bands at a site. Note: unless explicitly stated, the values are separate for the three bands.
Table 4.
MNO resource allocation.
| Band | Frequency (MHz) | MNO Bandwidth (MHz) | TowerCo Bandwidth (MHz) | Type of Band | Possible Antenna Configurations | Possible Sleep Levels | Sleep Deltas |
|---|---|---|---|---|---|---|---|
| 1 | 700 | 10 | 30 | Coverage | 4, 2 | SM1, SM2, SM3 | 0.84, 0.69, 0.50 |
| 2 | 2100 | 20 | 60 | Capacity | 4, 2 | SM1, SM2, SM3 | 0.84, 0.69, 0.50 |
| 3 | 3500 | 100 | 300 | Capacity | 64, 32, 16 | SM1, SM2, SM3 | 0.84, 0.69, 0.50 |
Table 5.
Reinforcement learning parameters.
| Parameter | Value |
|---|---|
| Replay memory size | 100,000 |
| Minibatch size | 64 |
| Learning rate | 0.001 |
| Discount factor () | 0.9 |
| Optimizer | Stochastic gradient descent |
| Activation function | tanh/softmax |
| Loss function | Mean squared error |
Table 6.
TowerCo’s outcome categories.
| Category | Both KPIs Met? | All Operators? | Description |
|---|---|---|---|
| 1 | Yes | Yes | Energy savings are obtained and throughput change is within permissible limits for all the operators |
| 2 | Yes | No | Both the KPIs are fulfilled for a few of the operators |
| 2 | No | Yes | Only one of the KPIs has been fulfilled for all the operators |
| 3 | No | No | Neither KPIs are fulfilled for all the operators |
Table 7.
MNO optimization’s outcome categories.
| Category | Energy Savings? | Throughput Change within Permissible Limits? | Description |
|---|---|---|---|
| 1 | Yes | Yes | Obtained energy savings and the throughput change is within permissible limits |
| 2 | Yes | No | Obtained energy savings at the cost of throughput degradation beyond permissible limits |
| 3 | No | Yes | No energy savings obtained but throughput change is within limits |
| 4 | No | No | No energy savings obtained and throughput degradation is beyond limits |
| 5 | * | * | A special case where the agent does not take any action resulting in no change in the network energy consumption and throughput |
Table 8.
Simulation cases.
| Parameter | MNO | Scenario 1 (S1) | Scenario 2 (S2) | Scenario 3 (S3) |
|---|---|---|---|---|
| Throughput degradation limit, % | 1 | 0 | 20 | 0 |
| 2 | 0 | 20 | 0 | |
| 3 | 0 | 20 | 20 |
Table 9.
Share of outcomes for an operator and a TowerCo across three simulation scenarios S1, S2, and S3.
Table 9.
Share of outcomes for an operator and a TowerCo across three simulation scenarios S1, S2, and S3.
| S.No | Parameter | Unit | S1 | S2 | S3 |
|---|---|---|---|---|---|
| 1 | Total simulation instances | 1000 | 1000 | 1000 | |
| 2 | Total simulation outcomes (from an operator’s perspective) falling under | ||||
| => Category 1 | % | 77.7 | 94.59 | 83.35 | |
| => Category 2 | % | 19.10 | 1.76 | 12.80 | |
| => Category 3 | % | 0.36 | 1.76 | 1.23 | |
| => Category 4 | % | 2.84 | 1.86 | 2.60 | |
| 3 | Total simulation outcomes (TowerCo’s perspective) falling under | ||||
| => Category 1 | % | 39.0 | 84.8 | 64.2 | |
| => Category 2 | % | 60.9 | 15.2 | 35.6 | |
| => Category 3 | % | 0.1 | 0 | 0.2 |
Table 10.
Probability of turning off a different number of bands across all simulation cases (operator’s perspective).
Table 10.
Probability of turning off a different number of bands across all simulation cases (operator’s perspective).
| S.No | Parameter | Unit | S1 | S2 | S3 |
|---|---|---|---|---|---|
| 1 | Total simulation instances | 1000 | 1000 | 1000 | |
| 2 | Total simulation instances when carrier adaptation was invoked | % | 26.5 | 26.8 | 26.9 |
| 3 | Total simulation instances when carrier adaptation was invoked and had a positive contribution towards energy savings | % | 82.6 | 85.0 | 76.2 |
| 4 | Total simulation instances when carrier adaptation was invoked and simulation outcome category was | % | 57.6 | 94.3 | 69.8 |
| 5 | Probability of turning off | ||||
| => 1 band | % | 84.91 | 83.52 | 83.98 | |
| => 2 bands | % | 13.48 | 14.86 | 15.10 | |
| => 3 bands | % | 1.35 | 1.45 | 0.92 | |
| => 4 bands | % | 0 | 0.16 | 0 | |
| => 5 bands | % | 0.27 | 0 | 0 | |
| 6 | Average energy savings by turning off | ||||
| => 1 band | % | 3.9 | 4.9 | 3.9 | |
| => 2 bands | % | 8.5 | 5.5 | 5.4 | |
| => 3 bands | % | 10.0 | 9.9 | 3.7 | |
| => 4 bands | % | 0 | 12.0 | 0 | |
| => 5 bands | % | 3.1 | 0 | 0 |
Table 11.
Common actions taken by MNOs in different cases.
| S.No | Parameter | Unit | S1 | S2 | S3 |
|---|---|---|---|---|---|
| 1 | Total simulation instances | 1000 | 1000 | 1000 | |
| 2 | Instances when carrier adaptation has been invoked by one or more MNOs (overlapping and non-overlapping actions) | % | 60.1 | 60.7 | 60.7 |
| 3 | Action overlapping instances of the total invocation instances | % | 30.0 | 27.6 | 28.8 |
| 4 | Non-overlapping action instances of the total invocation instances | % | 70.0 | 72.4 | 71.2 |
| 5 | Overlapping actions that resulted in a | ||||
| - positive outcome for all MNOs | % | 40.0 | 73.8 | 42.2 | |
| - positive outcome for one or two MNOs | % | 47.2 | 24.4 | 49.7 | |
| - negative outcome for all MNOs | % | 12.8 | 1.7 | 8.0 | |
| 6 | Instances when “X” MNOs were involved in a common action | ||||
| => X = 2 MNOs | % | 92.2 | 88.1 | 89.7 | |
| => X = 3 MNOs | % | 7.8 | 11.9 | 10.2 | |
| 7 | Total number of overlapping and non-overlapping actions | 865 | 851 | 835 | |
| 8 | Percentage of actions that resulted in | ||||
| - positive outcome for all MNOs | % | 45.0 | 74.0 | 54.0 | |
| - positive outcome for one or two MNOs | % | 10.0 | 5.0 | 10.0 | |
| - negative outcome for all MNOs | % | 45.0 | 22.0 | 35.0 |
Disclaimer/Publisher’s Note: The statements, opinions and data contained in all publications are solely those of the individual author(s) and contributor(s) and not of MDPI and/or the editor(s). MDPI and/or the editor(s) disclaim responsibility for any injury to people or property resulting from any ideas, methods, instructions or products referred to in the content. |
© 2023 by the authors. Licensee MDPI, Basel, Switzerland. This article is an open access article distributed under the terms and conditions of the Creative Commons Attribution (CC BY) license (https://creativecommons.org/licenses/by/4.0/).
Share and Cite
MDPI and ACS Style
Peesapati, S.K.G.; Olsson, M.; Andersson, S.; Qvarfordt, C.; Dahlen, A. AI-Assisted Multi-Operator RAN Sharing for Energy-Efficient Networks. Telecom 2023, 4, 334-368. https://doi.org/10.3390/telecom4020020
AMA Style
Peesapati SKG, Olsson M, Andersson S, Qvarfordt C, Dahlen A. AI-Assisted Multi-Operator RAN Sharing for Energy-Efficient Networks. Telecom. 2023; 4(2):334-368. https://doi.org/10.3390/telecom4020020
Chicago/Turabian StylePeesapati, Saivenkata Krishna Gowtam, Magnus Olsson, Sören Andersson, Christer Qvarfordt, and Anders Dahlen. 2023. "AI-Assisted Multi-Operator RAN Sharing for Energy-Efficient Networks" Telecom 4, no. 2: 334-368. https://doi.org/10.3390/telecom4020020