
Constant-pH Simulations of a Coarse-Grained Model of Polyfunctional Weak Charged Biopolymers
by
 , , and
David Naranjo
1,2,
Pablo M. Blanco
1,3,
Josep L. Garcés
4,
Sergio Madurga
1,* and
Francesc Mas
1,* 1
Department of Material Science and Physical Chemistry, Institute of Theoretical and Computational Chemistry (IQTC), University of Barcelona (UB), 08028 Barcelona, Catalonia, Spain
2
Department of Chemical Engineering, Center for Research in Multiscale Science and Engineering (CCEM), Polytechnic University of Catalonia (UPC), 08019 Barcelona, Catalonia, Spain
3
Department of Physics, Faculty of Natural Sciences, Norwegian University of Science and Technology (NTNU), 7034 Trondheim, Norway
4
Department of Chemistry, Physics and Environmental and Soil Sciences & Agrotecnio, University of Lleida (UdL), 25003 Lleida, Catalonia, Spain
*
Authors to whom correspondence should be addressed.
Biophysica 2024, 4(1), 107-127; https://doi.org/10.3390/biophysica4010008
Submission received: 17 January 2024
/
Revised: 21 February 2024
/
Accepted: 26 February 2024
/
Published: 28 February 2024
(This article belongs to the Special Issue Molecular Structure and Simulation in Biological System 2.0)
Abstract
:A coarse-grained model of linear polyfunctional weak charged biopolymers was implemented, formed of different proportions of acid-base groups resembling the composition of humic substances. These substances are mainly present in dissolved organic matter in natural water. The influence of electrostatic interactions computing methods, factors concerning the structure of the chain, different functional groups, and the ionic strength on polyelectrolytes were studied. Langevin dynamics with constant pH simulations were performed using the ESPResSO package and the Python-based Molecule Builder for ESPResSo (pyMBE) library. The coverage was fitted to a polyfunctional Frumkin isotherm, with a mean-field interaction between charged beads. The composition of the chain affects the charge while ionic strength affects both the charge and the radius of gyration. Additionally, the parameters intrinsic to the polyelectrolyte model were well reproduced by fitting the polyfunctional Frumkin isotherm. In contrast, the non-intrinsic parameters depended on the ionic strength. The method developed and applied to a polyfunctional polypeptide model, that resembles a humic acid, will be very useful for characterizing biopolymers with several acid-base functional groups, where their structure, the composition of the different functional groups, and the determination of the main intrinsic proton binding constants and their proportion are not exactly known.
1. Introduction
Charged biopolymers are polyelectrolytes whose repeating units bear ionizable functional groups [1,2,3,4]. These ionizable groups dissolve in the presence of polar solvents such as water, producing an electrical charge on the chain and the release of counterions into the solution [2,3].
Understanding the behaviour of polyelectrolytes is challenging, mainly due to the theoretical difficulty of dealing with long-range electrostatic interactions and the practical challenges in their experimental characterization [2,3,5,6,7]. For example, spatial conformation of polyelectrolytes is a result of long-range electrostatic interactions between charges in the solution and on the chain, as well as short-range interactions between uncharged monomer units [1,2,4,7]. Consequently, conformations are difficult to explain using straightforward scaling equations, i.e., dependent on the number of ionizable functional groups.
From an experimental approach, the polyelectrolyte phenomena are governed by too many variables [2,4], for example pH, ionic strength, acidity constants of each acid/base functional groups, etc. Due to the nonlinear coupling between these variables, it is difficult to understand the system conceptually since every molecule in the system is intimately acquainted with every other molecule in the system due to the strong intrinsic correlation [2,3,7,8].
Many biopolymers are polyelectrolytes with different weak acid-base groups (polysaccharides, proteins, etc.), and they have a great variety of environmental, agri-food, cosmetic, and biomedical applications [9,10,11]. Most are found in aquatic natural systems as dissolved organic matter (DOM) [12,13]. Humic substances (HS) constitute about 75% of DOM [12,13,14] and have been thoroughly investigated for their environmental, biochemical, and medicinal properties [15,16,17].
As depicted in Figure 1, HS are a complex mixture of different molecules based on aromatic nuclei with phenolic and carboxylic substituents linked to them [18]. These are the predominant functional groups in HSs, leading them to be designated as polyanions or polyacids. For this reason, HS are also referred to as humic acids (HAs) [12,13,14,18,19,20].
In this sense, the behaviour of HAs, like other monoprotic acids, can be described by the reaction shown in Equation (1), in which a weak acid () forms its conjugate base () and releases a proton (counterion) to the solution,
In the ideal case, i.e., not accounting for intermolecular interactions, the Henderson–Hasselbalch equation [3,4], Equation (2), describes the ionization of a weak acid, which relates the and the acidity constant of a weak acid, , , with its degree of ionization,
where accounts for the number of a determined acid-base functional group (ionized or unionized) and the sum in the denominator is the total number of protonable groups in the solution [3,4,21,22,23]. Nevertheless, being considered polyacids, HAs possess a high number of ionizable groups. Therefore, different distributions of ionized groups on the same molecular chain can produce the same degree of ionization, leading to O(2Nac) different ionization states for a polyacid with Nac ionizable groups [3,4,7,21,22,23]. As a result, the titration curves of HAs are smooth, far from the typical sigmoidal behavior, making it impossible to assign precise values to different ionization states [3,4].
Additionally, weak polyacids exhibit highly non-ideal behaviour at any dilution because the linkage of the macromolecule keeps the ionized groups close to one another, significantly promoting intramolecular interactions [3,4]. the non-ideal behaviour can be expressed as an apparent dissociation constant of the acid, [4,7,21,22,23,24,25], described by:
On the other hand, there are some weak polyelectrolytes with basic groups. In these cases, the ionization process is described by Equation (4), where a weak base (B) takes a proton to become its conjugate acid (),
Then, the corresponding apparent dissociation constant, , depends on the degree of basic ionization,
Moreover, when considering a polyelectrolyte composed of acid and basic units, it is possible to determine the total dimensionless charge (in units of e) of the chain as a function of the pH, , according to Equation (5),
where , , and are the ionic charge, the degree of ionization of an individual ionizable acid, and of an individual ionizable basic group in the chain, respectively. Again, due to molecular interactions, charge variation with pH of a polyelectrolyte deviates from ideal behaviour [3,4,7,21,22,23].
To describe the acid-base behavior of a polyelectrolyte with different acid and basic groups, it is best to do so in terms of the coverage of protons on the functional groups of the polyelectrolyte, , which is the ratio between the number of protons bound to a site and all possible binding sites. Moreover, it is possible to relate to the degree of ionization of the functionals groups, but it is necessary to differentiate acid and basic groups. In the case of acid groups (carboxylic and phenolic), their charge is 0 when they are protonated, whereas basic groups (other functional groups associated with nitrogen) have charge +1 when protonated. Consequently, the coverage can be computed as:
Then, the value of the global apparent dissociation constant, , will be computed according to a generalization of Equation (3) for acid groups and Equation (5) for basic groups in terms of the proton coverage, [4,21,22,23,24],
In the limiting cases of all the functional acid-base groups being ideal, it is possible to generalize the HH Equation (2) in terms of a weighted set of Langmuir isotherms [24]:
where and are the proton binding association constants for any acid-basic functional group, and their proportion. For this heterogeneous ideal case, is the dissociation constant, which is a function of pH.
In respect to HAs, the fundamental mechanisms at the molecular level that control their activity are still incompletely understood [14,19,20,26,27]. Due to idealizing assumptions in the theory as well as a lack of thorough control over the experimental system, it is frequently impractical to directly test the theoretical concepts using experiments [20,23,28]. In this context, computer simulation appears as a handy tool for bridging the theoretical and experimental approaches.
Molecular Dynamics and Monte Carlo techniques are often used to simulate weak polyelectrolytes [1,2,3,4,29,30,31,32,33,34]. However, HAs have notable diversity and a complex composition, which makes their computational modelling approach scarcer [19,27]. Nonetheless, different approaches have been used up to this point, including several models consisting of a single structure that represents the different kind of humic acids [35,36] as well as coarse-grained models [37], both yielding promising results concerning HAs simulation.
In this work, a coarse-grained model of linear polyelectrolytes was implemented with different proportions of ionizable groups (carboxylic and phenolic) and the effect of other functional groups associated with nitrogen, resembling the composition of HAs. Constant pH [4] and Langevin dynamics simulations were performed, using the ESPResSo package [38,39] and the Python-based Molecule Builder for ESPREesSO (pyMBE) library [40], to study the effect of electrostatic interaction computing methods, ionic strength, size, and chain composition on polyelectrolytes’ conformation and charge regulation [4,7]. Moreover, a generalized polyfunctional Frumkin isotherm, used to determine the main intrinsic proton binding constants and their proportion of the simulated titration curves, has been developed. This study can be useful to assist in physicochemical and structural characterizations of the behavior of the natural biopolymers that present different weak acid-base functional groups, whose properties are essential to improve their potential applications.
2. Results and Discussion
In this section, the different factors and parameters involved in the simulation have been studied to see their effect in the variation with pH of the total charge and the radius of gyration of the polyelectrolytes.
2.1. Effect of the Electrostatic Interaction Methodology
The most important simplifications in the computational model used here involve coarse graining to describe the different atomic groups of the biopolymer and the omission of explicit solvent. However, the presence of ions in solution requires careful consideration of electrostatic interactions due to their high computational cost.
Within the ESPResSo software, various approaches can be used to deal with electrostatic interactions [38,39], including the Particle-Particle Particle-Mesh (P3M) method and the Debye–Hückel screened potential (see Section 3.2). The P3M method considers ions explicitly and, for relatively high ionic strengths, it requires a substantial number of ions surrounding the biopolymer, resulting in increased computational time.
To assess the impact of different electrostatic interaction models, a set of simulations have been conducted to compare both electrostatic models for different configurations of a polyelectrolyte and several ionic strengths. It was observed that, for low ionic strengths (10−3 and 10−2 M), no significant differences were found, either in the net charge or in the radius of gyration, when employing DH potential or P3M method. It is not surprising that these results, obtained from both methods, are consistent for these cases of study, since for ionic strengths below 10−2 M, they are within the range of applicability of the mean field description of the DH theory.
Figure 2 shows an example of these simulations for a case of a polyanion of 10 monomers with a proportion D:Y = 7:3 and a diblock configuration at I = 0.01 M.
This is an interesting result since, despite being a mean force with effective potential, the DH method yields very similar results to those of the more accurate P3M method, and deviates from the ideal case described by the Henderson–Hasselbalch equation (Equation (3)). This is an advantage since the elapsed time in a simulation employing P3M is around six times the corresponding value when DH potential is applied. This correspondence is observed in other studied cases, which was an indicator that, at the given conditions of the simulations of this work, the DH potential shows results as accurate as those derived from P3M. Consequently, the following simulations were performed using the DH potential.
2.2. Effect of the Size, Proportion, and Distribution of D:Y Functional Groups
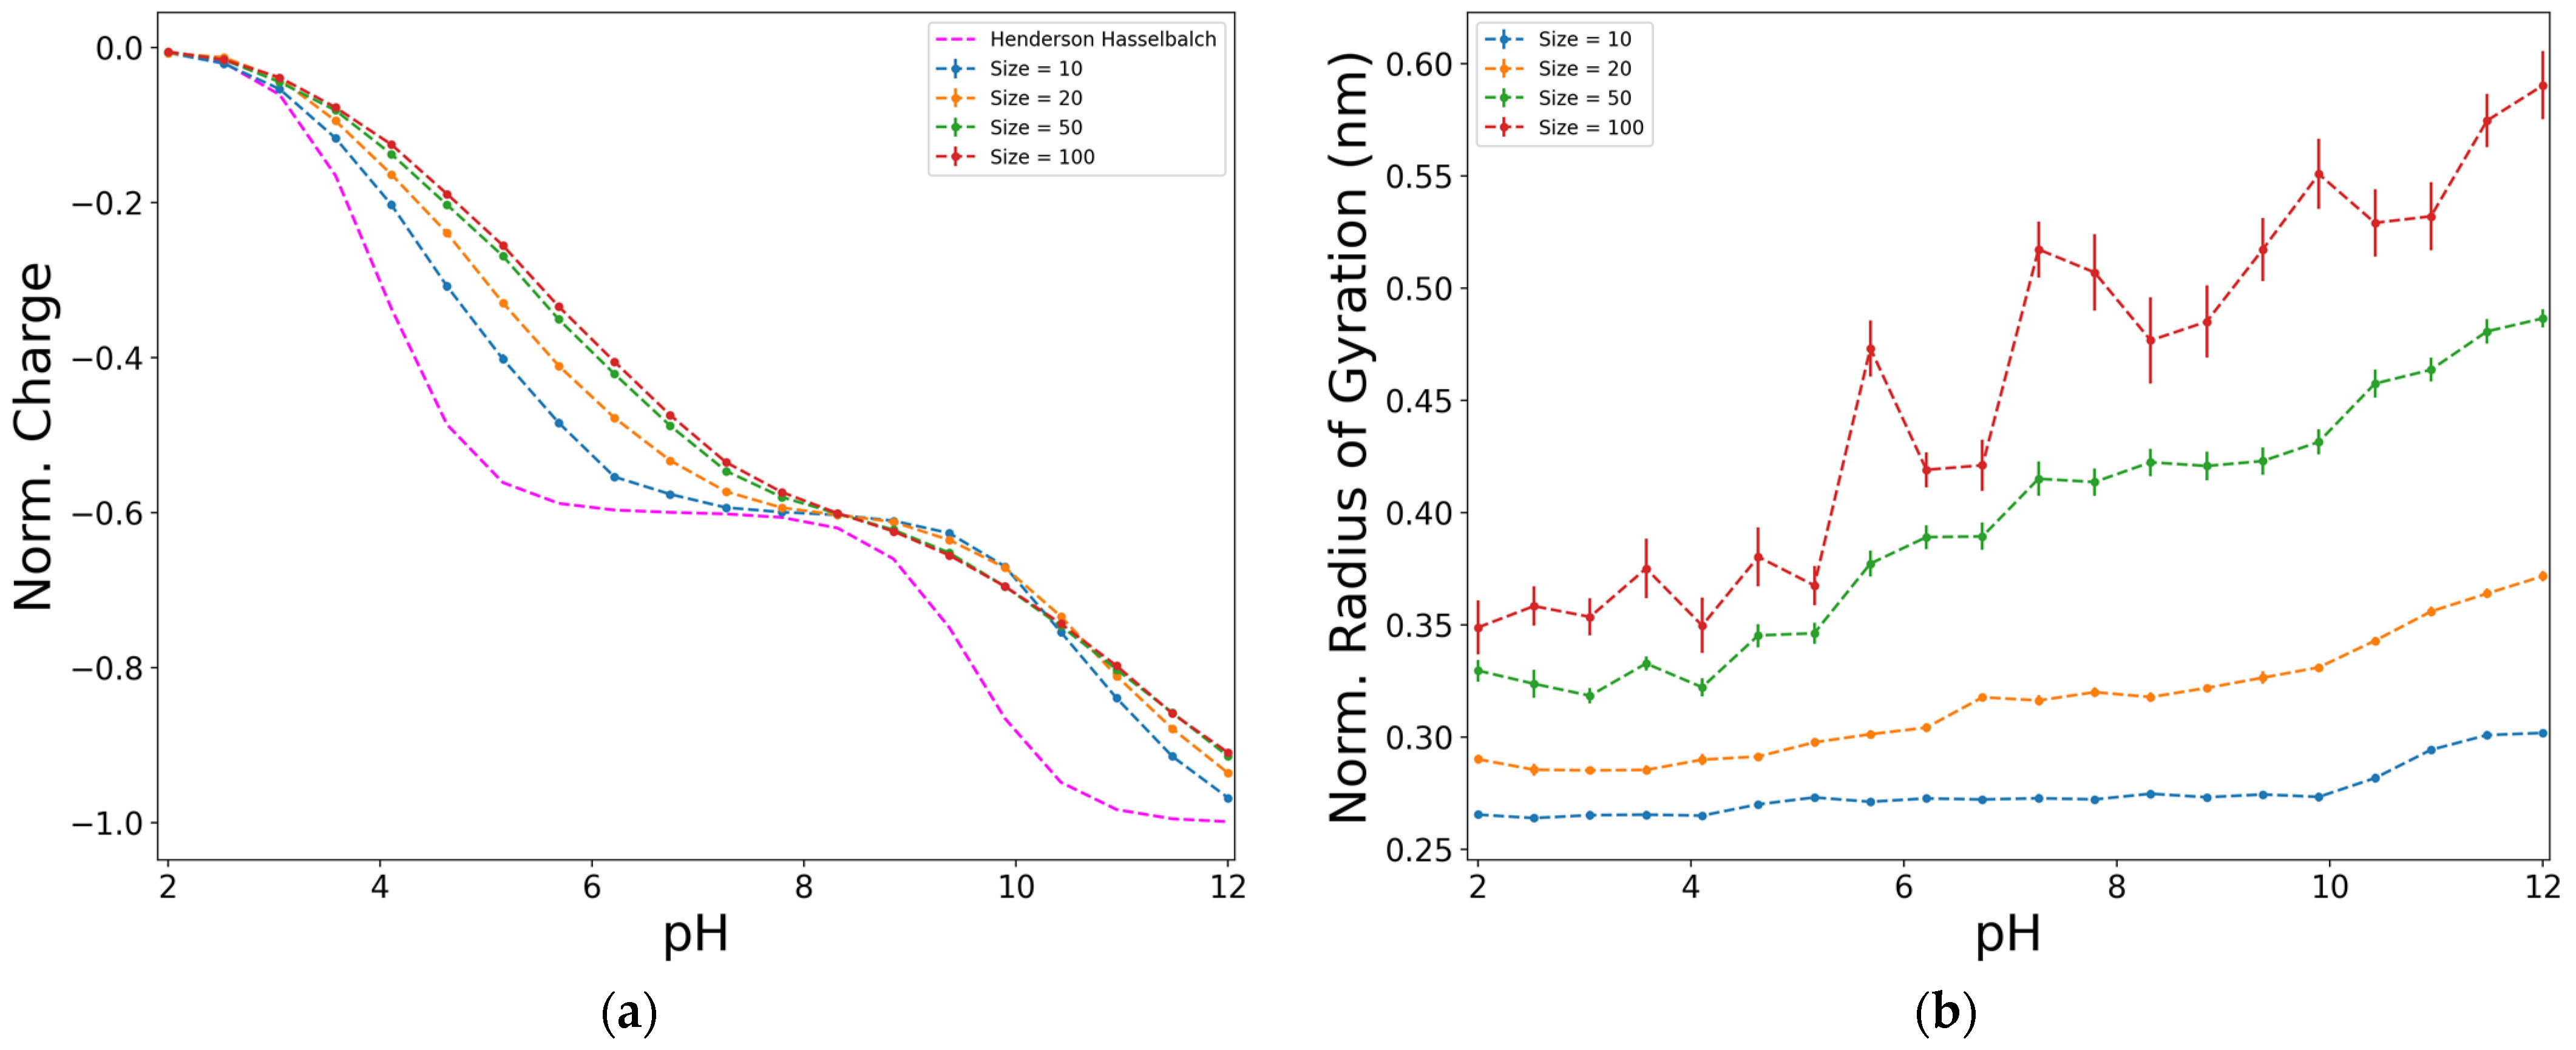
The effect of the number of functional acid groups (Nac) in the response functions are shown in Figure 3 for a particular case of diblock configuration (proportion D:Y = 6:4 and I = 0.01 M). Figure 3a shows the variation of the normalized charge in respect to the pH, observing a deviation from the ideal behaviour that increases as the size of the chain increases. This characteristic has been observed on synthetic weak electrolytes [41], where authors have found that such behaviour is especially noticeable for rather short chains (when the number of ionizable group is less than 50).
For long enough polymer chains (those with more than 50 monomers), we observe no significant effect of the chain length on the normalized charge of the biopolymer. For this reason, we fix the chain length to 50 as a compromise between the computational cost of the simulation and a model with a long enough polymer chain.
The value of the radius of gyration depends on the size of the simulated model. This could be seen in Figure 3b, where the normalized radius of gyration is plotted with respect to the value of FJC [4]. However, contrary to the normalized charge, the deviations that the normalized curves of the radius of gyration present, although showing a similar trend, are much more pronounced when the pH increases. This could be a consequence derived directly from the structure of the model. Though this behaviour is similar to the FJC model [4], there are other factors to be considered that could influence the behaviour resulting from the simulations, such as the effect of the excluded volume, the fact that each functional group is represented by two beads, and the presence of electrostatic interactions in the system. Nonetheless, as stated before for the normalized charge (Figure 3a), the tendencies remain similar between the different sizes, and for the radius of gyration curves, they tend to resemble each other as size increases.
Figure 3.
Effect of the size of the chain on the normalized charge (dividing by ) (a), and on the normalized radius of gyration (dividing by ) (b), for a diblock model, D:Y = 6:4, at ionic strength of 0.01 M, electrostatics computed with Debye–Hückel potential.
Figure 3.
Effect of the size of the chain on the normalized charge (dividing by ) (a), and on the normalized radius of gyration (dividing by ) (b), for a diblock model, D:Y = 6:4, at ionic strength of 0.01 M, electrostatics computed with Debye–Hückel potential.
Regarding the factors concerning the structure of the chain, Figure 4a shows that the proportion of carboxylic and phenolic groups (D and Y, respectively) changes the shape of both the ideal Henderson–Hasselbalch and simulation curves. It is noticeable that in all the cases, the simulated curves show a significant deviation from the ideal ones, which is a consequence of intermolecular interactions of non-ideal systems.
The observed tendencies are similar in all cases. At the lowest value of pH, the functional groups are unionized, and consequently the charge of the chain is zero. As the pH increases, the dissociation increases and the charge of the chain becomes more negative, until, in the ideal case, its absolute dimensionless value is equal to the number of functional groups. There is a plateau at intermediate values of pH that indicates that no net changes on the charge are observed. In the ideal case, the length and position of this plateau depends on the pki difference between functional groups. In addition, the shape of the charge curve changes since the carboxylic and phenolic functional groups have different values of pki.
The carboxylic group (D) has a lower pki (pkD = 4.0) than the phenolic group (Y) (pkY = 9.6). In the ideal curve, this means that at values of pH on the plateau, the charge of the chain is more negative when the proportion of D is higher, since there are more groups that have dissociated from pH = 4.0. In the simulated cases, this tendency remains but there is a shift of the plateau that is related to the apparent dissociation constant of the functional groups.
The radius of the gyration curves, seen in Figure 4b, shows a quite consistent behaviour with that of the charge. When the functional groups in the chain start to dissociate, they become negatively charged, increasing the electrostatic repulsion among the same-charged beads. Consequently, the chain rearranges to a conformation that reduces repulsive effects. This is observed in the simulations since, as the pH increases, the electrostatic repulsion becomes higher, and the chain must place its beads as far apart as possible, causing an increase in the radius of gyration, which reaches it maximum value when the charge of the chain reaches the most negative value. There is also a plateau for the radius of gyration at the zone where no charge change is observed. Again, this behaviour is consistent because not having variation in the charge of the chain requires no rearranging of its conformation.
With respect to the distribution of functional groups along the chain, two different simulations were performed: diblock or alternating (Figure 5). Both distributions show a similar deviation of the charge curves from the ideal case, although they exhibit slightly different behaviour between them. The main difference is that the alternating structure shows a plateau both in the charge (Figure 5a) and in the radius of gyration (Figure 5b) curves, whereas the diblock structure more closely resembles the smooth and curved titration curve related to HAs structure. However, although they do not reach complete dissociation in either of the two models, the phenolic groups dissociate to a greater extent in the diblock model.
The phenolic groups dissociate at higher values of pH than the carboxylic groups. In the case of the alternating structure at low values of pH, the phenolic groups could act as a separation between the ionizable groups, which would eventually lead to the plateau observed in the ideal case. The studied case is the one with the largest proportion of carboxylic functional groups, which could also lead to the charge of the chain curve resembling the carboxylic groups charge. Nevertheless, this behaviour was also observed for other D:Y proportions, where the plateau was only reached when the simulations were performed on the alternating model.
2.3. Effect of the Ionic Strength
The effect of the ionic strength on the variation of the charge with pH in shown in Figure 6a. The deviation from the ideal curve increases as the ionic strength decreases. This result is consistent with those observed in previous studies, as the effects of adding salt in a simulation of weak polyelectrolytes were one of the first to be studied [3,4,42].
To explore the effect of ionic strength on weak polyelectrolyte titration curves, Ullner et al. [42] used the Debye–Hückel screened potential and changed the screening length. They noticed that the shift in the apparent dissociation constant becomes smaller as the Debye screening length decreases (which is related to an increasing in ionic strength), and practically disappears around a salt concentration of 1 M [42]. However, it is important to note that they found significant differences between simulations with the screening potential and simulations with explicit ions. At low ionic strengths, they attribute these differences to the fact that at high degrees of ionization, the DH screening potential is inadequate to describe counterion condensation. On the other hand, at high ionic strengths, they found differences between the two methods over the full range of degrees of ionization. They attribute these differences to the DH potential underestimating the concentration of ions close to the polyelectrolyte. Nonetheless, in the conditions of the simulations included this work, none of these differences were observed.
Regarding the behaviour of the radius of gyration among the values of pH (Figure 6b), more significant variations are observed at low ionic strengths. This could be because higher ionic strengths imply the presence of more ions in the medium. Although the ions are not explicitly included in the simulation box when employing the DH method, their effect is reflected in the screened potential. Therefore, the higher the ionic strength, the more the electrostatic repulsion among charges is minimized, and the shape of the chain becomes more compact, reducing the radius of gyration.
2.4. Effect of a Third Functional Group Associated with Nitrogen (H)
Accounting for the composition of the chain, Figure 7 shows the effect of including other functional groups associated with nitrogen, represented by a histidine bead (H). One of the main differences between the charge curves (Figure 7a) is that when H is included in the structure of the chain, the charge is not zero but positive at the lowest value of pH. This is because, at low pH, H groups have a hydrogen ion attached to their structure and consequently become positively charged. Another difference is found in the shape of the curve. The plateau observed when no H groups were in the chain (Figure 6a) is lost when they are included in the chain structure. This occurs because the pkH value of histidine is 6.8 (Table 1). In the same region where, in the D-Y chains, emerged a plateau, the dissociation of H groups occurs in the D-Y-H chains, resulting in a curve that is much more reminiscent of the D-Y diblock curve (Figure 5a).
As in the results presented above, an analogous behaviour between the charge and the radius of gyration curves can be seen. When the chain contains H groups, no plateau is observed on the charge curve (Figure 7a); this means that the charge of the chain is still changing among the variation of pH, which, when translated to the radius of gyration terms, implies that the molecule is continuously rearranging its conformation. Consequently, there is no plateau on the radius of the gyration curve (Figure 7b).
2.5. Description of the Protonation Process Using a Frumkin Isotherm
The hydrogen coverage, , given by Equation (7), can be obtained from the degree of ionization of the different functionals groups at different pHs and ionic strengths. The value of the global apparent dissociation constant, , will be computed from Equation (8).
One of the most relevant ways to describe the binding of protons to the acid-base functional groups of weak polyelectrolytes is by using adsorption/complexation isotherms. Among the most used for parameters with a physical meaning, which have a microscopic interpretation, is the Frumkin isotherm, Equation (10), which is derived from a mean-field approximation of the interactions between pairs of charged groups, like the Bragg–Williams approximation of the Ising model [6,24,26,29].
where , is the dimensionless interaction parameter (in terms of thermal energy, ) and and are the proton binding association constant for an acid or a basic functional groups, respectively.
The reason for having two different expressions for the Frumkin isotherm is because of the different behaviours between acid and basic groups in terms of coverage. Thus, in the ideal case, acid groups have a charge equal to zero, i.e., they are completely protonated at . Basic groups, meanwhile, are completely discharged at .
For a general case of a polyelectrolyte with different functional groups acid and basic , there are different values of interaction terms , which performs a symmetric matrix of different interaction coefficients (). Then, a generalized Frumkin isotherm [24], with different fraction, , of functional groups, can be considered as:
Normally, there is not enough experimental accuracy to fit those different interaction parameters, and it would be a good approximation to consider that all the interaction coefficients are equal (), because, in a coarse-grained description, the electrostatic contribution to the interaction energy is only due to the ionic charge of the functional group. Then, Equation (11) can be simplified as:
where, for a , Equation (10) for the basic case is recovered, and for a , Equation (10) for the acid case is recovered.
To describe the variation of the protonation process, a fitting procedure to Frumkin isotherm (10) was conducted using two different kinds of Frumkin isotherms (11)–(12). In the case of chains composed of carboxylic and phenolic functional groups (D-Y), a two-term isotherm was employed so that each of the fitted parameters was associated with a specific functional group. In the case of chains composed of carboxylic, phenolic, and other functional groups associated with nitrogen (D-Y-H), both a three-term and a two-term isotherm were employed.
For cases of titration curves obtained with D-Y description of the polyelectrolyte, the fitting curve to the coverage using a two-acid terms of Frumkin isotherm (11)–(12) was produced. Figure 8a shows an example of fitted curves. The general expression (11), though with different parameters, , was used, giving an acceptable fit with reasonable parameter values but with a large imprecision. For this reason, a new fitting procedure was produced using the approximation of considering a unique interaction parameter, , in the Frumkin isotherm (12), giving a good fit (Figure 8a) with the fitted parameters for the different cases studied, as shown in Table 1.
The values of the interaction parameters, , are positive in all cases, and they are similar for the different proportions D-Y considered for each ionic strength. This means that all the interactions are repulsive, and they do not depend on the chemical nature of the functional group. This is consistent with considering the functional groups as beads, where they are only characterized by their charge and the value, both of which reflect their chemical nature. The interaction parameters also strongly correlate with the ionic strength because the former decrease as the latter increases.
Moreover, the values of , , and are very close to those intrinsic values to the model, i.e., those established for building the coarse-grained approximation, and they practically remain constant among variations of the ionic strength. This result validates the use of the Frumkin isotherm to describe the protonation process and the sense of the interaction parameter as a mean field parameter that mainly depends on the ionic strength considered.
In respect to the corresponding value (Figure 8b), the values are very similar at intermediate pH values, and deviate from the ideal case at basic pHs, with a small increase for lower ionic strength. However, they reach the ideal value at acid pHs, as expected for a polyelectrolyte with acid functional groups that are fully protonated, i.e., discharged, at acid pHs, as expected according to Frumkin isotherm for acid case (10). The limiting value of at acid pHs can be obtained in the limit of high proton concentration for an ideal heterogeneous Langmuir isotherm [24]. In this limit, the ideal heterogeneous ionization constant (9), for a general case of two kind of functional groups, gives the following limiting value,
For the case plotted in Figure 8, this limiting value is 4.30, which coincides with the simulated value, as expected.
On the other hand, in limit at zero coverage, for basic pHs, when the polyelectrolyte is fully deprotonated and has the highest charge value, the apparent dissociation constant deviates from the ideal behaviour. This ideal behaviour coincides with the average value of the logarithm of the binding association constants of all the functional groups, [24]. For the case of two kind of functional groups, this limit is given by . In the case plotted in Figure 9, it has the value of 9.30, which is lower than the simulated one, indicating the importance of the repulsive electrostatic interactions between functional acid groups.
For cases of titration curves obtained for a D-Y-H chain (Figure 9a), the presence of few basic functional groups with intermediate , between and , causes the plateau at intermediate pHs (Figure 8a) to disappear. These simulated values were fitted to two kinds of Frumkin isotherms (12), considering a unique value for the electrostatic interaction parameter, , one for a two-acid terms (Table 2) and another one for a two-acid and one-basic terms (Table 3).
The fitted coverage-pH curves to a two-acid term isotherm (12) show a good similarity with the simulated curves (Figure 9a), but the values obtained by and are lower than those intrinsic to the model, which could be an effect given by the presence of others functional groups associated with nitrogen (H) in the chain. The value of is also smaller but less than for the case of D-Y chain (Table 1). These values would be an indicator that the presence of other functional groups associated with nitrogen in the chain more substantially affect the values of the fitted protonation constants than the value of the proportion of carboxylic groups. Again, , , and do not show a dependence on the ionic strength, while the electrostatic interaction parameter, , is positive, indicating an overall repulsive character that is dependent on ionic strength, as in the case of D-Y chain (Table 1).
Concerning the fitting to a two-acid and one-basic terms of Frumkin isotherm (12), the fitted coverage-pH curves (Figure 9a) give a very closed concordance with the simulated ones, as the reduced chi-squared, , value indicates, which is lower (Table 3) in respect to the similar case of two-acid terms (Table 2). Moreover, the values of , , , , and are closer to the values the intrinsic parameters of the simulation and independent of the ionic strength considered. The electrostatic interaction parameter, , is positive, indicating an overall repulsive character dependent on ionic strength and not dependent of the proportion of acid functional groups, as in the case of D-Y chain (Table 1). It is important to remark that the values of the electrostatic interaction parameter, , has a higher value than the case of D-Y chain; this is possible since there are more interactions (attractive and repulsive).
Concerning to the corresponding value (Figure 9b), the values are very similar at intermediate pH values, and behave like those that occur in the case of the D-Y chain. However, in this case, no ideal behaviour can be achieved at both limits, since there a mixing of acid and basic functional groups. Although the proportion of basic groups is very low (9%), this case could be like the case of D-Y chain (Figure 8b), achieving the ideal case at low pHs with a value of [24]. The case plotted in Figure 9b, which has the value of 9.26, lower than the simulated one but with a small increase for lower ionic strength, indicates the importance of the repulsive electrostatic interactions between functional acid groups.
However, they cannot reach the ideal value at acid pHs, as expected for a polyelectrolyte with acid functional groups that are fully protonated, i.e., discharged, since the presence of basic functional groups, which are protonated at low pHs, causes a repulsive electrostatic interaction between them. If we compare the limiting value of at acid pHs with the obtained for an ideal heterogeneous Langmuir isotherm of three kind of functional groups [24],
which, for the case plotted in Figure 9, has a limiting value of 4.34, we find a lower deviation. This is in accordance with the repulsive electrostatic interaction between basic groups, which has a lower increase for lower ionic strength.
Despite this, when looking at the well-fitted curves in Figure 9 and accounting for the low values of reduced chi-squared, , it is noticeable that the simulated system could be described as a proton binding process from a mean-field approach given by the two-acid and one-basic terms of Frumkin isotherm (12).
3. Methodology
3.1. The Model
To represent a general charged weak biopolymer, and for the case of HAs, a coarse-grained 2-bead-spring model was implemented, derived from the results reported from polypeptide simulations by Lunkad et al. [21,22]. HAs behaviour could be approached as a mixture of two kinds of acid molecular moieties, one with a for carboxylic groups protonation and another with a for phenolic groups protonation [27,35,36].
The functional groups present in HAs were represented by aspartic acid (D) for carboxylic substituents and tyrosine (Y) for phenolic substituents since the values are 4.0 and 9.6, respectively [21,22]. In addition, in some simulations a bead of histidine (H), with a value of 6.8 (see Table 4), was employed to study the effects of other functional groups associated with nitrogen that can be present in the HAs structure.
A schematic representation of the model is shown in Figure 10, consisting of a polymer chain with two beads per monomer. Each monomer consists of a backbone bead (C) and a side-chain bead representing the functional group (either carboxylic, phenolic, or other associated with nitrogen) [43]. The bonds between beads are modelled using a harmonic potential
where nm−2 is the harmonic constant for all bonds, is the equilibrium bond length, and r is the distance between the bonded particles. The values of for each bond type are reported in Table 4 (C-bond length). The model does not include any bending or torsional potential.

Table 4.
Parameters of the beads employed in simulations: aspartic acid (D), tyrosine (Y), histidine (H), central bead (C) [21,22]. C-bond length is the distance between a central bead and its side chain (C-D, C-Y, and C-H), and between two central beads (C-C).
| Bead | Functional Group | Diameter (nm) | C-Bond Length (nm) | pki |
|---|---|---|---|---|
| D | Carboxylic | 0.35 | 0.329 | 4.0 |
| Y | Phenolic | 0.35 | 0.648 | 9.6 |
| H | Other associated with N | 0.35 | 0.452 | 6.8 |
| C | Central bead | 0.35 | 0.382 | - |
| Na | Cation | 0.35 | - | - |
| Cl | Anion | 0.35 | - | - |
Steric hindrance in the polymer chain is included in the model through the pair-wise Weeks–Chandler–Andersen (WCA) potential
where nm is the particle diameter and is the depth of the potential well. For simplicity, the model assumes that all particles, including polymer beads and small ions in solution, have the same WCA parameters, as reported in Table 4. These parameters are arbitrarily chosen to match values commonly used in coarse-grained models of polymers [21,22].
Four different levels of D:Y proportion were set in order to study its influence on HAs conformation and charge regulation. For each proportion of functional groups, a diblock and alternating sequence were modelled to study the effect of the substituent’s distribution along the chain. Diblock is the model where all D substituents were grouped in a block at one side of the chain and bonded to an analogous block of grouped Y substituents on the other side of the chain. Alternating refers to the model where Y substituents where symmetrically placed between D substituents along the chain. Moreover, four different chain sizes were modelled to study the effect of varying the number of substituents while keeping a constant proportion.
3.2. Electrostatic Interactions
To simulate the protonation of a weak polyelectrolyte in solution in the presence of other ions, the electrostatic interaction of all electric charges between the ions in the medium and the charged groups of the polyelectrolyte should be considered by means of a summation of all pair interactions according to Coulomb’s law,
where is the permittivity of the medium, the distance between particle i and particle j, and and are their ionic charges, respectively. This treatment requires performing the simulation with all explicit particles, which comes at a high computational cost.
Different approximations can be considered when simplifying the simulation [38,44], including the Particle-Particle Particle-Mesh (P3M) method and the Debye–Hückel screened potential.
3.2.1. P3M Method
The P3M method, closely related to the Ewald summation method, is based on the idea that the long-range inter-particle interactions can be calculated as the sum of two parts: the short-range part, which has a rapid variation and is cancelled after a certain cut-off radius, and the reference part, which slowly varies and is smooth enough over a long distance and can be roughly approximated on a mesh [44,45].
In this way, the P3M allows us to compute electrostatic interactions from a mixed approach, i.e., combining the accuracy derived from a particle-particle method with the rapid convergence of a particle-mesh approach.
3.2.2. Debye–Hückel Potential
The screened Coulomb potential, which is based on the Debye–Hückel (DH) theory of diluted solutions of simple electrolytes [3,4,6,29,46,47], can be used in the situation of small, charged particles with an electrostatic interaction lower than the thermal energy, . For punctual particles, the electrostatic interaction energy, based on the DH screened potential, can be expressed as:
where, , is the Debye screening length, as a measure of the diffusion layer, which depends on the ionic strength, I, the temperature, and the dielectric constant of the medium:
where is the Avogadro constant.
The Debye–Hückel approximation breaks down for systems formed by monovalent electrolyte solutions at high concentrations since ion-ion correlations are too strong. When considering divalent and higher valency ions, only the qualitative behaviour remains accurate. However, in the case of systems containing multivalent ions, the Debye–Hückel theory fails quantitatively, even at relatively low salt concentrations [3].
3.3. Computational Details
Computer simulations were performed using a combined scheme of Langevin Dynamics (LD), to sample the configuration space, and constant pH Monte Carlo (cpH) [48], to sample the reaction space of the acid-base reactions. Each simulation cycle consisted of LD integration steps and cpH steps, after which all relevant quantities were measured. This scheme is designed to efficiently sample the thermodynamic equilibrium of the system at the cost of losing information about its dynamics. The latter is due to inclusion of the Monte Carlo moves, which do not describe the actual mechanism of the reaction. The time series of the quantities were stored during the simulation for later post-processing and the first third was discarded as equilibration. Statistical uncertainty was calculated using the block analysis method [49]. LD was performed at a temperature of 300 K and a damping constant of with a time step of dt = 0.01τ, where . The value of the particle mass m is arbitrary, and it has no effect on the thermodynamic properties at equilibrium.
In each Monte Carlo trial move, the chemical identity of one of the acid or base groups was randomly changed and its charge was switched accordingly, following the chemical reactions
is a generic neutralizing ion, whose chemical identity should not be confused with that of proton ions [3,4]. In the cpH method, the pH is implicit, and it enters the simulation scheme as a direct input of the acceptance probability of the trial Monte Carlo moves.
where is the change in the potential energy of the system due to the trial move and ξ is the extent of the reaction which is +1 in the forwards direction and −1 in the reverse direction. In Equation (21), we have not corrected the excess chemical potential of X+ [50]. However, for dilute solutions of polyelectrolytes, this omission should only have a small impact on its properties [51].
All computer simulations were conducted using the Extensible Simulation Package for Research on Soft Matter (ESPResSo) [38,39]. ESPResSo is an open-source software for Molecular Dynamics and Monte Carlo simulation, especially well-suited for coarse-grained models of macromolecular and colloidal systems. ESPResSo features various Monte Carlo methods designed to sample reversible chemical reactions in macromolecular systems, including the constant pH Monte Carlo method employed in this study. To build the coarse-grained models of the molecules and to set-up the constant pH method in ESPResSo, we used the module python-based Molecular Brewer for Espresso (pyMBE), developed by Blanco et al. [40]. The module pyMBE provides several tools to aid the setup of coarse-grained models of molecules with complex topologies in ESPResSo such as polyelectrolytes, peptides, and globular proteins. The module is especially designed to set-up Monte Carlo simulations of systems with many different reactive groups, making it a convenient tool to set-up the simulations performed here.
The input parameters were the composition of the HAs chain, the ionic strength, the pH, and the method for computing the electrostatic interactions. The system consisted of one polymer chain and several small ions. The simulation box was a cube of size L = 114.31 nm. The system was initialized in a random configuration. When using the Debye–Hückel method for electrostatics, only counter-ions were added to the system; the rest of the added salt ions were only implicitly considered. When using the P3M method for electrostatics, explicit Na+ and Cl− particles were added to match the input ionic strength. The built-in function of ESPResSo was used to tune down the parameters of the P3M method with an accuracy of 10−3 [39].
3.4. Magnitudes
From the simulations, total charge (6), coverage (7), global apparent dissociation constant (8), and the radius of gyration (22) were computed by averaging different simulations.
During the simulation, ESPResSo collects the value of the charge of the chain. In those cases where different chain sizes were compared, the charge of the chain was normalized by dividing its value between the total number of functional groups of the chain.
The radius of gyration, [4], was the parameter used for studying the conformation of the chain, where is the distance between beads in the chain.
In the cases where different chain sizes were compared, the radius of gyration was normalized according to the FJC [4] approach, which relates the radius of gyration with the size of the chain as , where is the number of units that make up the chain, and is the distance between units.
3.5. Fitting Procedure
The simulated curves of the coverage, θ, vs. pH were fitted to the generalized Frumkin isotherm (Equation (12)) with two terms accounting for acid functional groups (Figure 8a and Figure 9a) and one term accounting for a basic functional group (Figure 9a), with three and five fitting parameters, respectively. We used the Levenberg–Marquardt non-linear regression method [52,53]. This algorithm obtains the best parameter values in an iterative process of minimization of the reduced chi-squared, parameter, which quantifies the difference between the simulated values and the predicted by the Frumkin isotherm ones.
The fitting procedure was implemented in a Python script using the NumPy and the SciPy.optimize libraries. Standard errors of the fitted parameters are obtained from the covariance matrix of the fitting procedure.
4. Conclusions
In this work, a coarse-grained, 2-bead model of polyelectrolyte chains resembling HAs structure was implemented as an example of a polyfunctional weak charged biopolymer. Through constant-pH and Langevin dynamics simulations, we studied the effect of ionic strength on the charge and radius of gyration of the weak polyelectrolyte. These properties emerge from the electrostatic interactions, which are influenced by factors related to the structure of the chain and the ionic composition of the solution.
Within the range of ionic strength and size of the studied systems, no significant differences were found between the results obtained by P3M method and Debye–Hückel potential.
The influence of chain composition and ionic strength on the charge and radius of gyration of polyelectrolyte chains arises mainly from the electrostatic interactions within the system. Polyelectrolyte chains contain charged functional groups, such as carboxylic and phenolic groups, which can ionize in solution, leading to the formation of charged sites along the chain. The charge on these sites interacts with the charges of other sites and with surrounding ions in the solution, resulting in electrostatic interactions that affect the conformation of the chain. Polyelectrolytes with a more negative charge, at a particular pH, exhibit a greater radius of gyration due to the intramolecular repulsion of charges. However, the effect of ionic strength diminishes this repulsion, thereby reducing the increase in radius of gyration. On the other hand, the composition of the polyelectrolyte chain, particularly the types and distribution of charged functional groups, significantly influences its behavior. For example, the presence of alternating carboxylic and phenolic groups may lead to specific charge distribution patterns, resulting in distinct conformational changes compared to chains with other compositions. Once again, at a particular pH, compositions that result in a greater negative charge led to a greater radius of gyration.
The proportion of carboxylic and phenolic groups as well as the presence of other functional groups associated with nitrogen modifies the shape of the charge curve. A plateau is reached when the chain is composed only of alternating carboxylic and phenolic groups, which is related to the apparent dissociation constant. When other basic functional groups associated with nitrogen are present in the chain, the charge curve appears smoother and more curved.
For the case of two-acid functional groups (D-Y), the parameters intrinsic to the polyelectrolyte model are very similar to those obtained by fitting the coverage to a two-acid terms of Frumkin isotherm. In contrast, the non-intrinsic parameters depend on the ionic strength. In this case, the ideal limit of a heterogeneous Langmuir isotherm is achieved at low pHs, and deviates from the ideality to basic pHs, due to the repulsive electrostatic interactions of the acid functional groups.
For the case of the presence of other basic functional groups associated with nitrogen are present in the chain, the parameters intrinsic to the polyelectrolyte model are very similar to those obtained by fitting the coverage to two terms associated with acidic groups and one term associated with basic groups Frumkin isotherm. In contrast, the non-intrinsic parameters depend on the ionic strength. In this case, the limit achieved at low pHs deviate from the ideality, since the presence of the charged protonated basic groups, and, also, at basic pHs, due the presence of the charged dissociated acid groups.
The fitting procedure to the simulated system tell us that the proton binding process can be described in terms of a mean-field approach given by the two terms associated with acidic groups and one term associated with basic groups Frumkin isotherm. Once we have validated this fitting procedure by comparing it with the detailed information from the computer simulation developed in this work, it can be applied to interpret experimental data from potentiometric titration of humic acids or other biopolymers, which is often complex to rationalize.
Summarizing, the main contributions of the computational study developed here, using a combined scheme of Langevin Dynamics and constant pH Monte Carlo, are, for one hand, the validity of this simulation model to describe the polyelectrolytic behavior of natural biopolymers in solution, when varying the pH and ionic strength, and, for the other hand, the use of polyfunctional Frumkin isotherms to describe the proton binding to different acid-base groups of the biopolymer, as well as obtaining mean field parameters that give us an idea of the intramolecular electrostatic interactions between the charged groups of the biopolymer and the ions of the solution.
Furthermore, the results of this work give some insights of the factors that influence the behaviour of HAs and other natural biopolymers. Future work could focus on modelling larger systems, to test the validity of the findings beyond the boundaries defined in this study. Studying systems with different HAs models (size and composition) interacting in the same simulation box would yield results that could be related to experimental data.
Author Contributions
Conceptualization, S.M. and F.M.; methodology, S.M., F.M. and J.LG.; software, D.N., P.M.B. and S.M.; formal analysis, D.N., J.L.G., S.M. and F.M.; investigation, D.N., S.M. and F.M.; resources, P.M.B., S.M. and F.M.; data curation, D.N., J.L.G., S.M. and F.M.; writing—original draft preparation, D.N., S.M. and F.M.; writing—review and editing, D.N., P.M.B., J.L.G., S.M. and F.M.; visualization, D.N., S.M. and F.M.; project administration, S.M. and F.M.; funding acquisition, S.M. and F.M. All authors have read and agreed to the published version of the manuscript.
Funding
P.M.B.: S.M. and F.M. acknowledge the financial support from Generalitat de Catalunya (Grant 2021SGR00350). S.M. and F.M. acknowledge Spanish Structures of Excellence María de Maeztu program through Grant CEX2021-001202-M. J.L.G. also acknowledges the Spanish Ministry of Science and Innovation (Project PID2022-140312NB-C21), and P.M.B. the financial support from the Spanish Ministry of Universities (Margarita Salas Grant MS98) and the funding from the European Union’s Horizon Europe research and innovation programme under the Marie-Skłodowska Curie grant agreement No 101062456.
Data Availability Statement
The data that support the findings of this study are available on request from the corresponding authors.
Conflicts of Interest
The authors declare no conflicts of interest.
References
- Holm, C.; Joanny, J.F.; Kremer, K.; Netz, R.R.; Reineker, P.; Seidel, C.; Vilgis, T.A.; Winkler, R.G. Polyelectrolyte Theory. In Advances in Polymer Science; Springer: Berlin/Heidelberg, Germany, 2004; pp. 67–111. [Google Scholar] [CrossRef]
- Muthukumar, M. 50th Anniversary Perspective: A Perspective on Polyelectrolyte Solutions. Macromolecules 2017, 50, 9528–9560. [Google Scholar] [CrossRef]
- Landsgesell, J.; Nová, L.; Rud, O.; Uhlík, F.; Sean, D.; Hebbeker, P.; Holm, C.; Košovan, P. Simulations of ionization equilibria in weak polyelectrolyte solutions and gels. Soft Matter 2019, 15, 1155–1185. [Google Scholar] [CrossRef]
- Blanco, P.M.; Narambuena, C.F.; Madurga, S.; Mas, F.; Garcés, J.L. Unusual Aspects of Charge Regulation in Flexible Weak Polyelectrolytes. Polymers 2023, 15, 2680. [Google Scholar] [CrossRef]
- Liu, S.; Ghosh, K.; Muthukumar, M. Polyelectrolyte Solutions with Added Salt: A Simulation Study. J. Chem. Phys. 2003, 119, 1813–1823. [Google Scholar] [CrossRef]
- Koper, G.J.; Borkovec, M. Proton binding by linear, branched, and hyperbranched polyelectrolytes. Polymer 2010, 51, 5649–5662. [Google Scholar] [CrossRef]
- Blanco, P.M.; Madurga, S.; Narambuena, C.F.; Mas, F.; Garcés, J.L. Role of Charge Regulation and Fluctuations in the Conformational and Mechanical Properties of Weak Flexible Polyelectrolytes. Polymers 2019, 11, 1962. [Google Scholar] [CrossRef]
- Lyulin, A.V.; Dünweg, B.; Borisov, O.V.; Darinskii, A.A. Computer Simulation Studies of a Single Polyelectrolyte Chain in Poor Solvent. Macromolecules 1999, 32, 3264. [Google Scholar] [CrossRef]
- Udayakumar, G.P.; Muthusamy, S.; Selvaganesh, B.; Sivarajasekar, N.; Rambabu, K.; Sivamani, S.; Sivakumar, N.; Maran, J.P.; Hosseini-Bandegharaei, A. Ecofriendly biopolymers and composites: Preparation and their applications in water-treatment. Biotech. Adv. 2021, 52, 107815. [Google Scholar] [CrossRef]
- Baranwal, J.; Barse, B.; Fais, A.; Delogu, G.L.; Kumar, A. Biopolymer: A Sustainable Material for Food and Medical Applications. Polymers 2022, 14, 983. [Google Scholar] [CrossRef]
- Perera, K.Y.; Jaiswal, A.K.; Jaiswal, S. Biopolymer-Based Sustainable Food Packaging Materials: Challenges, Solutions, and Applications. Foods 2023, 12, 2422. [Google Scholar] [CrossRef]
- Buffle, J. Complexation Reactions in Aquatic Systems: An Analytical Approach; Ellis Horwood Ltd.: Chichester, UK, 1988. [Google Scholar]
- Stumm, W.; Morgan, J.J. Aquatic Chemistry: Chemical Equilibria and Rates in Natural Waters; Wiley: Hoboken, NJ, USA, 1996. [Google Scholar]
- Inselsbacher, E. Recovery of Individual Soil Nitrogen Forms after Sieving and Extraction. Soil Biol. Biochem. 2014, 71, 76–86. [Google Scholar] [CrossRef]
- Peña-Méndez, E.M.; Havel, J.; Patočka, J. Humic substances-compounds of still unknown structure: Applications in agriculture, industry, environment, and biomedicine. J. Appl. Biomed. 2005, 3, 13–24. [Google Scholar] [CrossRef]
- de Melo, B.A.G.; Motta, F.L.; Santana, M.H.A. Humic acids: Structural properties and multiple functionalities for novel technological developments. Mater. Sci. Eng. C 2016, 62, 967–974. [Google Scholar] [CrossRef] [PubMed]
- Bezuglova, O.; Klimenko, A. Application of Humic Substances in Agricultural Industry. Agronomy 2022, 12, 584. [Google Scholar] [CrossRef]
- Yikrazuul. Hypothetical Chemical Structure of an Imaginary Humic Acid. Wikimedia Commons. 2009. Available online: https://commons.wikimedia.org/wiki/File:Humic_acid.svg (accessed on 15 December 2023).
- Pernet-Coudrier, B.; Companys, E.; Galceran, J.; Morey, M.; Mouchel, J.M.; Puy, J.; Ruiz, N.; Varrault, G. Pb-Binding to Various Dissolved Organic Matter in Urban Aquatic Systems: Key Role of the Most Hydrophilic Fraction. Geochim. Cosmochim. Acta 2011, 75, 4005–4019. [Google Scholar] [CrossRef]
- Petrov, D.; Tunega, D.; Gerzabek, M.H.; Oostenbrink, C. Molecular Dynamics Simulations of the Standard Leonardite Humic Acid: Microscopic Analysis of the Structure and Dynamics. Environ. Sci. Technol. 2017, 51, 5414–5424. [Google Scholar] [CrossRef] [PubMed]
- Lunkad, R.; Murmiliuk, A.; Tošner, Z.; Štěpánek, M.; Košovan, P. Role of pKA in Charge Regulation and Conformation of Various Peptide Sequences. Polymers 2021, 13, 214. [Google Scholar] [CrossRef]
- Lunkad, R.; Murmiliuk, A.; Hebbeker, P.; Boublík, M.; Tošner, Z.; Štěpánek, M.; Košovan, P. Quantitative Prediction of Charge Regulation in Oligopeptides. Mol. Syst. Des. Eng. 2021, 6, 122–131. [Google Scholar] [CrossRef]
- Lunkad, R.; Biehl, P.; Murmiliuk, A.; Blanco, P.M.; Mons, P.; Štěpánek, M.; Schacher, F.H.; Košovan, P. Simulations and Potentiometric Titrations Enable Reliable Determination of Effective pKa Values of Various Polyzwitterions. Macromolecules 2022, 55, 7775–7784. [Google Scholar] [CrossRef]
- Garcés, J.L.; Mas, F.; Cecília, J.; Companys, E.; Galceran, J.; Salvador, J.; Puy, J.; Galceran, J. Complexation isotherms in metal speciation studies at trace concentration levels. Voltammetric techniques in environmental samples. Phys. Chem. Chem. Phys. 2002, 4, 3764–3773. [Google Scholar] [CrossRef]
- Nagasawa, M.; Murase, T.; Kondo, K. Potentiometric titration of stereoregular polyelectrolytes. J. Phys. Chem. 1965, 69, 4005–4012. [Google Scholar] [CrossRef]
- Companys, E.; Garcés, J.L.; Salvador, J.; Galceran, J.; Puy, J.; Mas, F. Electrostatic and specific binding to macromolecular ligands A general analytical expression for the Donnan volume. Coll. Surf. A Physicochem. Eng. Asp. 2007, 306, 2–13. [Google Scholar] [CrossRef]
- Goli, E.; Hiemstra, T.; Rahnemaie, R. Interaction of Boron with Humic Acid and Natural Organic Matter: Experiments and Modeling. Chem. Geol. 2019, 515, 1–8. [Google Scholar] [CrossRef]
- Liu, S.; Muthukumar, M. Langevin Dynamics Simulation of Counterion Distribution around Isolated Flexible Polyelectrolyte Chains. J. Chem. Phys. 2002, 116, 9975–9982. [Google Scholar] [CrossRef]
- Borkovec, M.; Jönsson, B.; Koper, G.J.M. Ionization Processes and Proton Binding in Polyprotic Systems: Small Molecules, Proteins, Interfaces, and Polyelectrolytes. In Surface and Colloid Science; Matijevic, E., Ed.; Springer: Boston, MA, USA, 2001; pp. 99–339. [Google Scholar] [CrossRef]
- Jusufi, A.; Likos, C.N.; Löwen, H. Conformations and Interactions of Star-Branched Polyelectrolytes. Phys. Rev. Lett. 2002, 88, 018301. [Google Scholar] [CrossRef]
- Dobrynin, A.V.; Rubinstein, M. Theory of polyelectrolytes in solutions and at surfaces. Prog. Polym. Sci. 2005, 30, 1049–1118. [Google Scholar] [CrossRef]
- Hofzumahaus, C.; Hebbeker, P.; Schneider, S. Monte Carlo simulations of weak polyelectrolyte microgels: pH-dependence of conformation and ionization. Soft Matter 2018, 14, 4087–4100. [Google Scholar] [CrossRef] [PubMed]
- Hofzumahaus, C.; Strauch, C.; Schneider, S. Monte Carlo simulations of weak polyampholyte microgels: pH-dependence of conformation an ionization. Soft Matter 2021, 17, 6029–6043. [Google Scholar] [CrossRef]
- Strauch, C.; Schneider, S. Ionisation and swelling behaviour of weak polyampholyte core–shell networks–a Monte Carlo study. Soft Matter 2023, 19, 938–950. [Google Scholar] [CrossRef]
- Diallo, M.S.; Simpson, A.; Gassman, P.; Faulon, J.L.; Johnson, J.H.; Goddard, W.A.; Hatcher, P.G. 3-D Structural Modeling of Humic Acids through Experimental Characterization, Computer Assisted Structure Elucidation and Atomistic Simulations. 1. Chelsea Soil Humic Acid. Environ. Sci. Technol. 2003, 37, 1783–1793. [Google Scholar] [CrossRef]
- Albers, C.N.; Banta, G.T.; Jacobsen, O.S.; Hansen, P.E. Characterization and Structural Modelling of Humic Substances in Field Soil Displaying Significant Differences from Previously Proposed Structures. Eur. J. Soil. Sci. 2008, 59, 693–705. [Google Scholar] [CrossRef]
- Feng, H.; Zhang, H.; Cao, H.; Sun, Y.; Zhang, A.; Fu, J. Application of a Novel Coarse-Grained Soil Organic Matter Model in the Environment. Environ. Sci. Technol. 2018, 52, 14228–14234. [Google Scholar] [CrossRef] [PubMed]
- Weik, F.; Weeber, R.; Szuttor, K.; Breitsprecher, K.; deGraaf, J.; Kuron, M.; Landsgesell, J.; Menke, H.; Sean, D.; Holm, C. ESPResSo 4.0—An extensible software package for simulating soft matter systems. Eur. Phys. J. Spec. Top. 2019, 227, 1789–1816. [Google Scholar] [CrossRef]
- Weeber, R.; Grad, J.N.; Beyer, D.; Blanco, P.M.; Kreissl, P.; Reinauer, A.; Tischler, I.; Košovan, P.; Holm, C. ESPResSo, a Versatile Open-Source Software Package for Simulating Soft Matter Systems. In “ESPResSo, a Versatile Open-Source Software Package for Simulating Soft Matter Systems,” in Comprehensive Computational Chemistry, 1st ed.; Yáñez, M., Boyd, R.J., Eds.; Elsevier: Oxford, UK, 2024; pp. 578–601. [Google Scholar] [CrossRef]
- Beyer, D.; Torres, P.B.; Pineda, S.P.; Narambuena, C.F.; Grad, J.N.; Košovan, P.; Blanco, P.M. pyMBE: The Python-based Molecule Builder for ESPResSo. arXiv preprint. arXiv 2024, arXiv:2401.14954. [Google Scholar] [CrossRef]
- Barr, S.A.; Panagiotopoulos, A.Z. Conformational Transitions of Weak Polyacids Grafted to Nanoparticles. J. Chem. Phys. 2012, 137, 144704. [Google Scholar] [CrossRef] [PubMed]
- Ullner, M.; Woodward, C.E. Simulations of the Titration of Linear Polyelectrolytes with Explicit Simple Ions: Comparisons with Screened Coulomb Models and Experiments. Macromolecules 2000, 33, 7144–7156. [Google Scholar] [CrossRef]
- Tanford, C. Physical Chemistry of Macromolecules; John Wiley & Sons, Inc.: Hoboken, NJ, USA, 1961. [Google Scholar]
- Burak, Y.; Netz, R.R. Charge Regulation of Interacting Weak Polyelectrolytes. J. Phys. Chem. B 2004, 108, 4840–4849. [Google Scholar] [CrossRef]
- Payamyar, P.; King, B.T.; Öttinger, H.C.; Schlüter, A.D. Two-Dimensional Polymers: Concepts and Perspectives. Chem. Commun. 2016, 52, 18–34. [Google Scholar] [CrossRef]
- Kozynchenko, A.I.; Kozynchenko, S.A. About Improving Efficiency of the P3M Algorithms When Computing the Inter-Particle Forces in Beam Dynamics. Comput. Phys. Commun. 2017, 212, 47–54. [Google Scholar] [CrossRef]
- Pollock, E.L.; Glosli, J. Comments on P3M, FMM, and the Ewald Method for Large Periodic Coulombic Systems. Comp. Phys. Commun. 1996, 95, 93–110. [Google Scholar] [CrossRef]
- Reed, C.E.; Reed, W.F. Monte Carlo study of titration of linear polyelectrolytes. J. Chem. Phys. 1992, 96, 1609. [Google Scholar] [CrossRef]
- Janke, W. Statistical Analysis of Simulations: Data Correlations and Error Estimation. In Quantum Simulations of Complex Many-Body Systems: From Theory to Algorithms; Grotendorst, J., Marx, D., Muramatsu, A., Eds.; Lecture Notes: Jülich, Germany, 2002; Volume 10, pp. 423–445. [Google Scholar]
- Labbez, C.; Jönsson, B. Applied Parallel Computing. State of the Art in Scientific Computing; Kågström, B., Elmroth, E., Dongarra, J., Waśniewski, J., Eds.; Springer: Berlin/Heidelberg, Germany, 2007; Volume 4699, pp. 66–72. [Google Scholar]
- Košovan, P.; Landsgesell, J.; Nová, L.; Uhlík, F.; Beyer, D.; Blanco, P.M.; Staňo, R.; Holm, C. Reply to the ‘Comment on “Simulations of ionization equilibria in weak polyelectrolyte solutions and gels” by J. Landsgesell, L. Nová, O. Rud, F. Uhlík, D. Sean, P. Hebbeker, C. Holm and P. Košovan, Soft Matter, 2019, 15, 1155–1185’. Soft Matter 2023, 19, 3522–3525. [Google Scholar] [CrossRef]
- Levenberg, K. A Method for the Solution of Certain Problems in Least Squares. Q. Appl. Math. 1944, 2, 164–168. [Google Scholar] [CrossRef]
- Marquardt, D. An Algorithm for Least-Squares Estimation of Nonlinear Parameters. SIAM J. Appl. Math. 1963, 11, 431–441. [Google Scholar] [CrossRef]
Figure 1.
A hypothetical example of a structure of humic acid [18].
Figure 1.
A hypothetical example of a structure of humic acid [18].
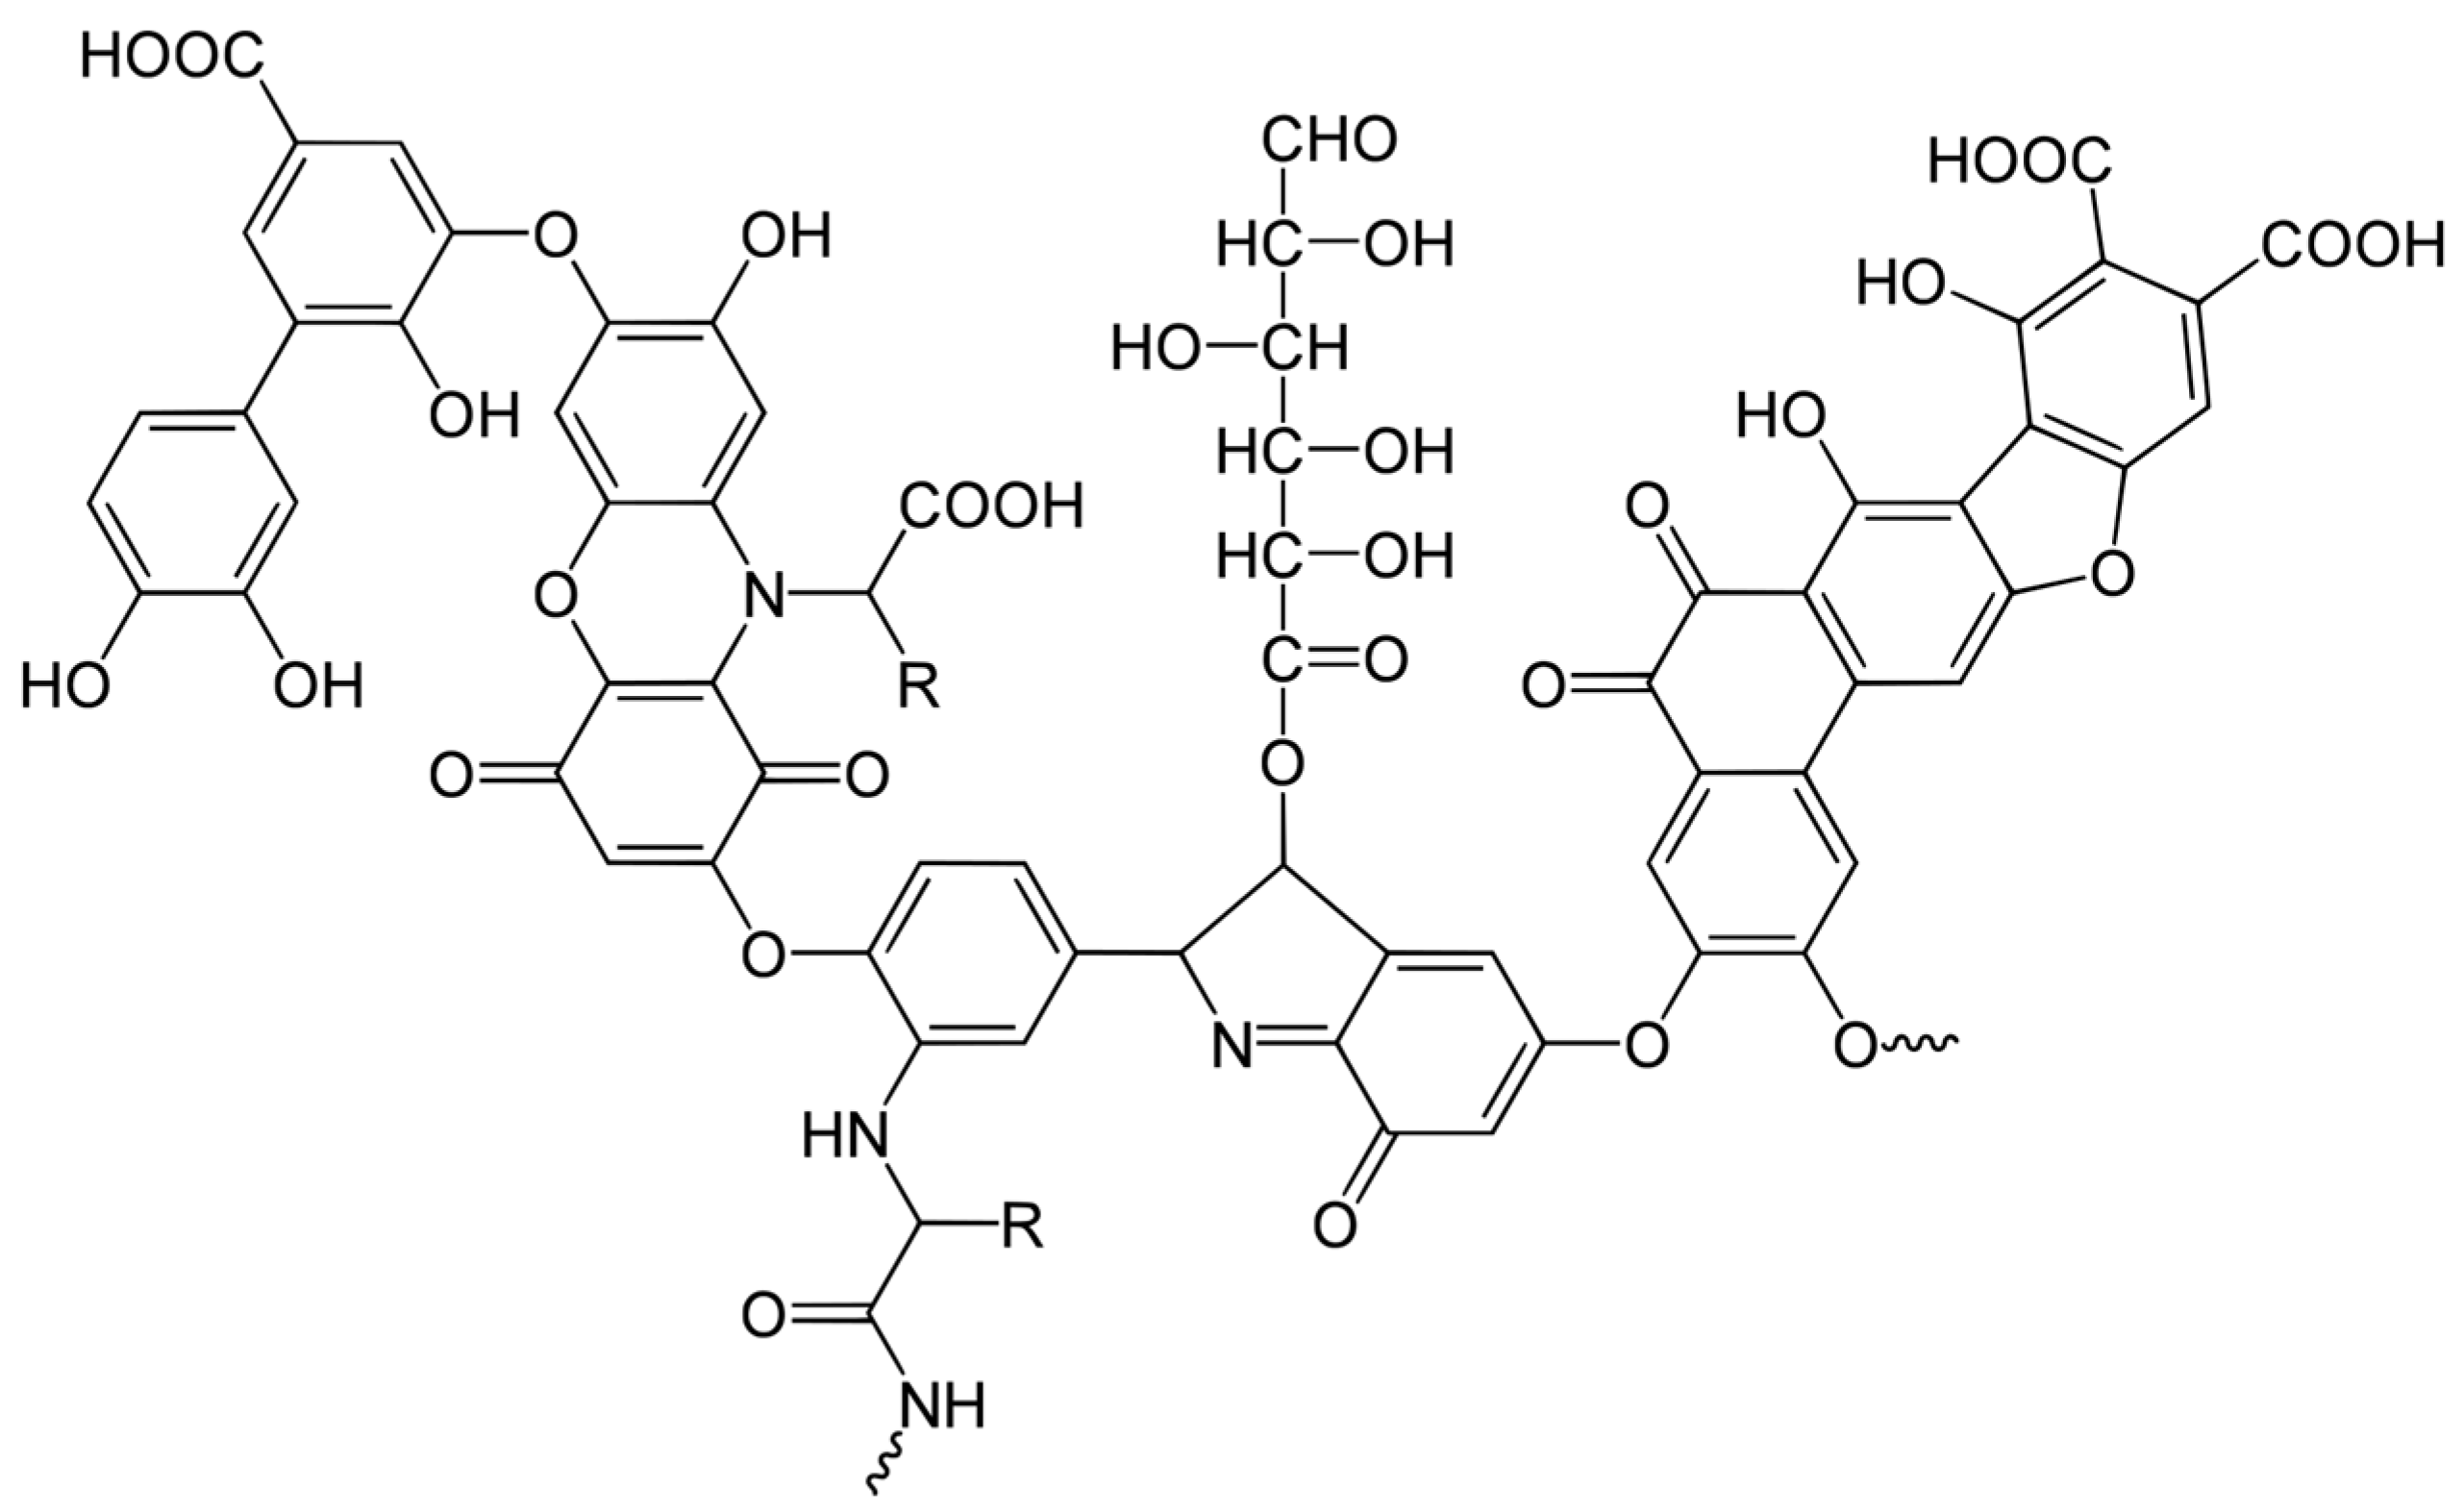
Figure 2.
Effect of the electrostatic interactions computing method on the charge (a), and on the radius of gyration (b), for a diblock model of 10 units, D:Y = 7:3, at ionic strength of 0.01 M.
Figure 2.
Effect of the electrostatic interactions computing method on the charge (a), and on the radius of gyration (b), for a diblock model of 10 units, D:Y = 7:3, at ionic strength of 0.01 M.
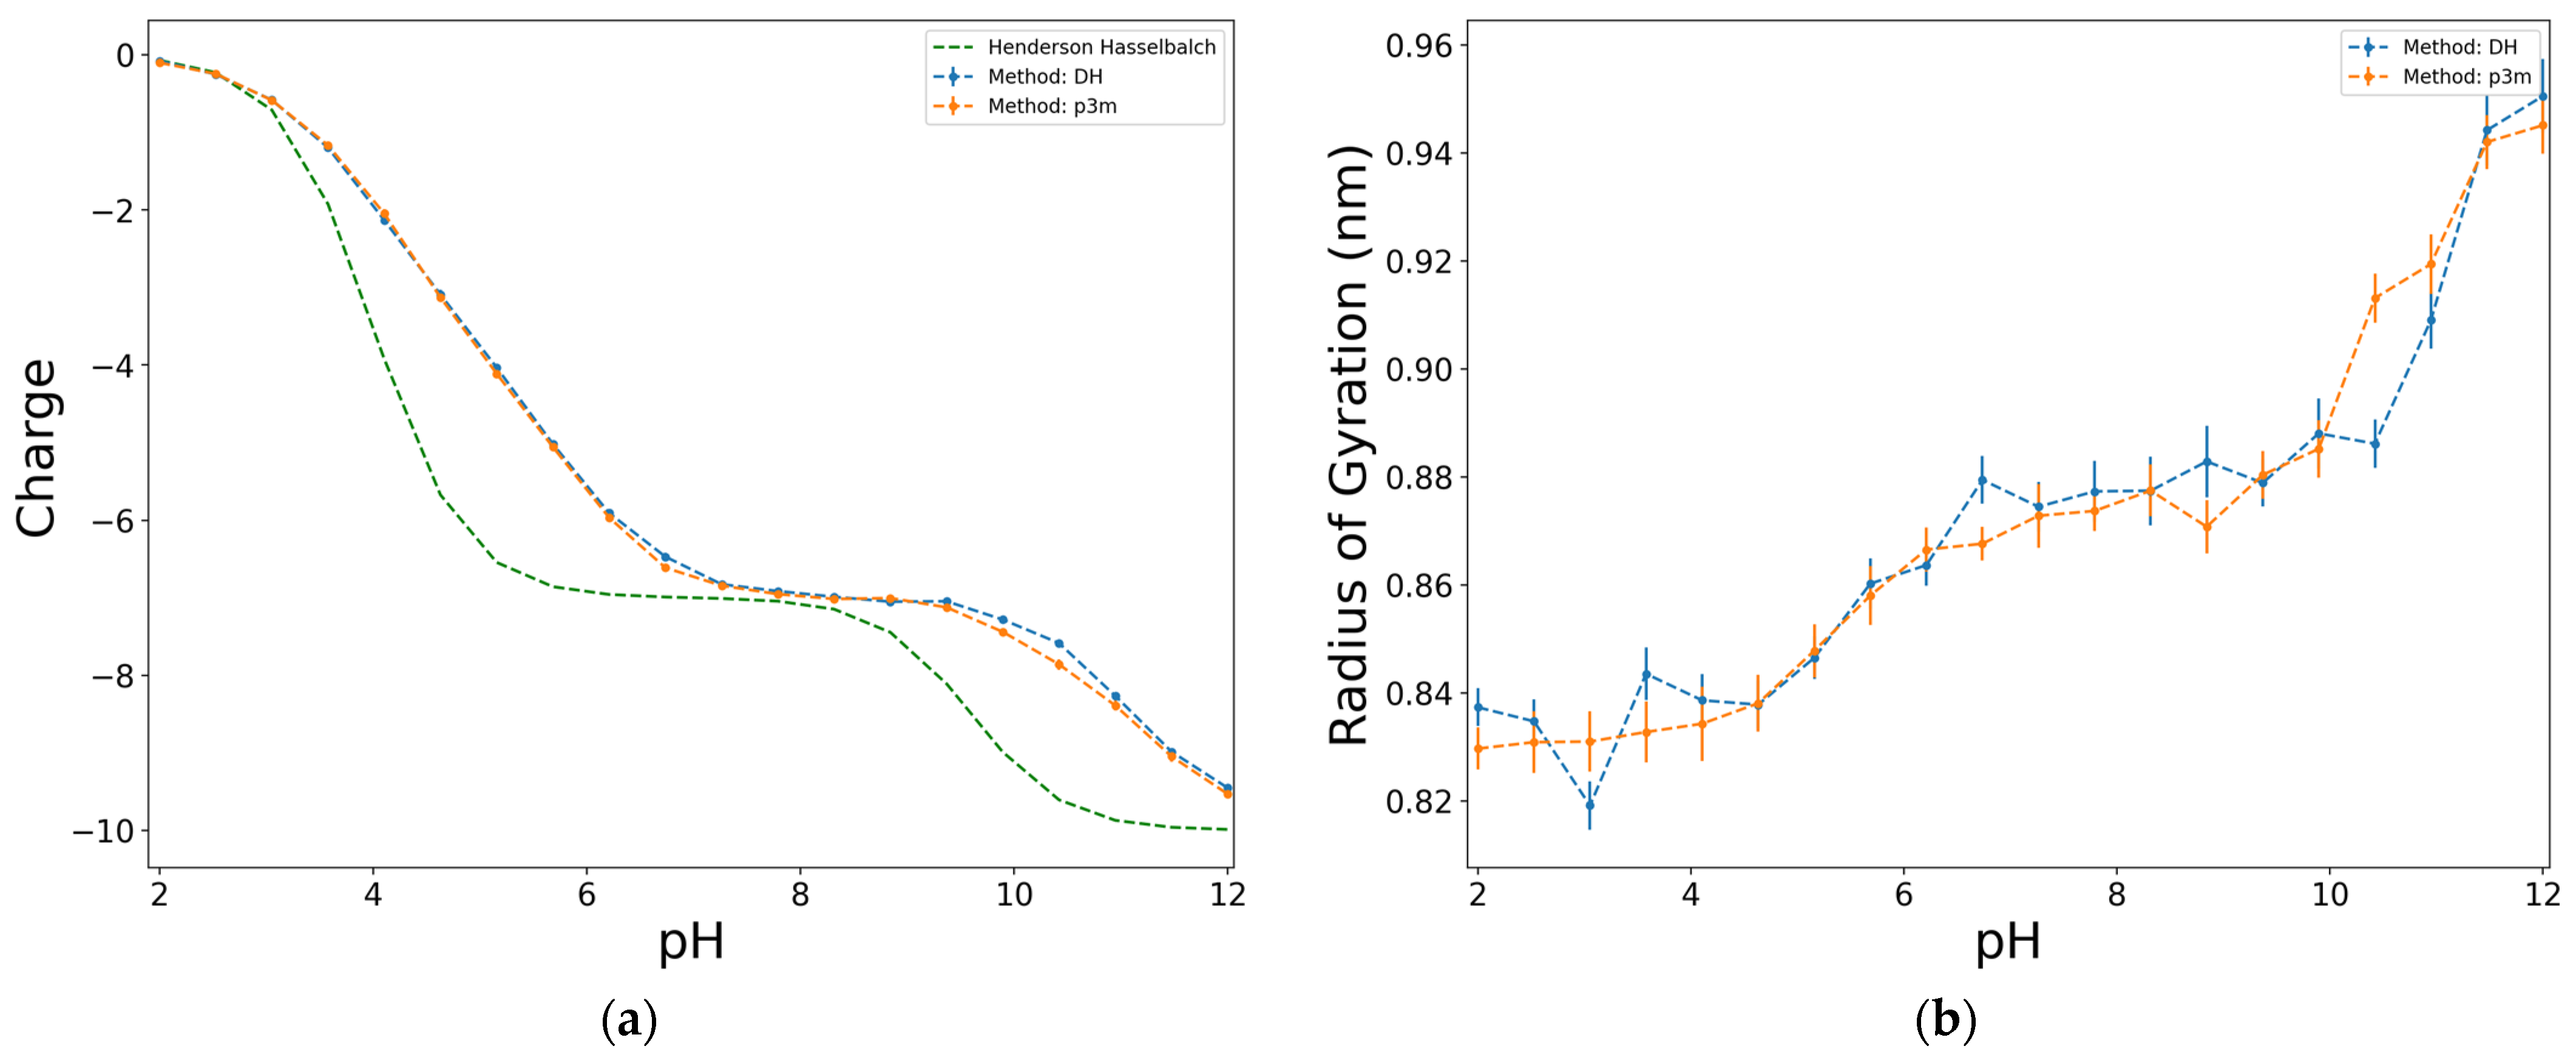
Figure 4.
Effect of the D:Y proportion on the dimensionless charge, in terms of e (a), and on the radius of gyration (b), for an alternating model of 50 units, at I = 0.01 M, and electrostatics computed with Debye–Hückel potential.
Figure 4.
Effect of the D:Y proportion on the dimensionless charge, in terms of e (a), and on the radius of gyration (b), for an alternating model of 50 units, at I = 0.01 M, and electrostatics computed with Debye–Hückel potential.
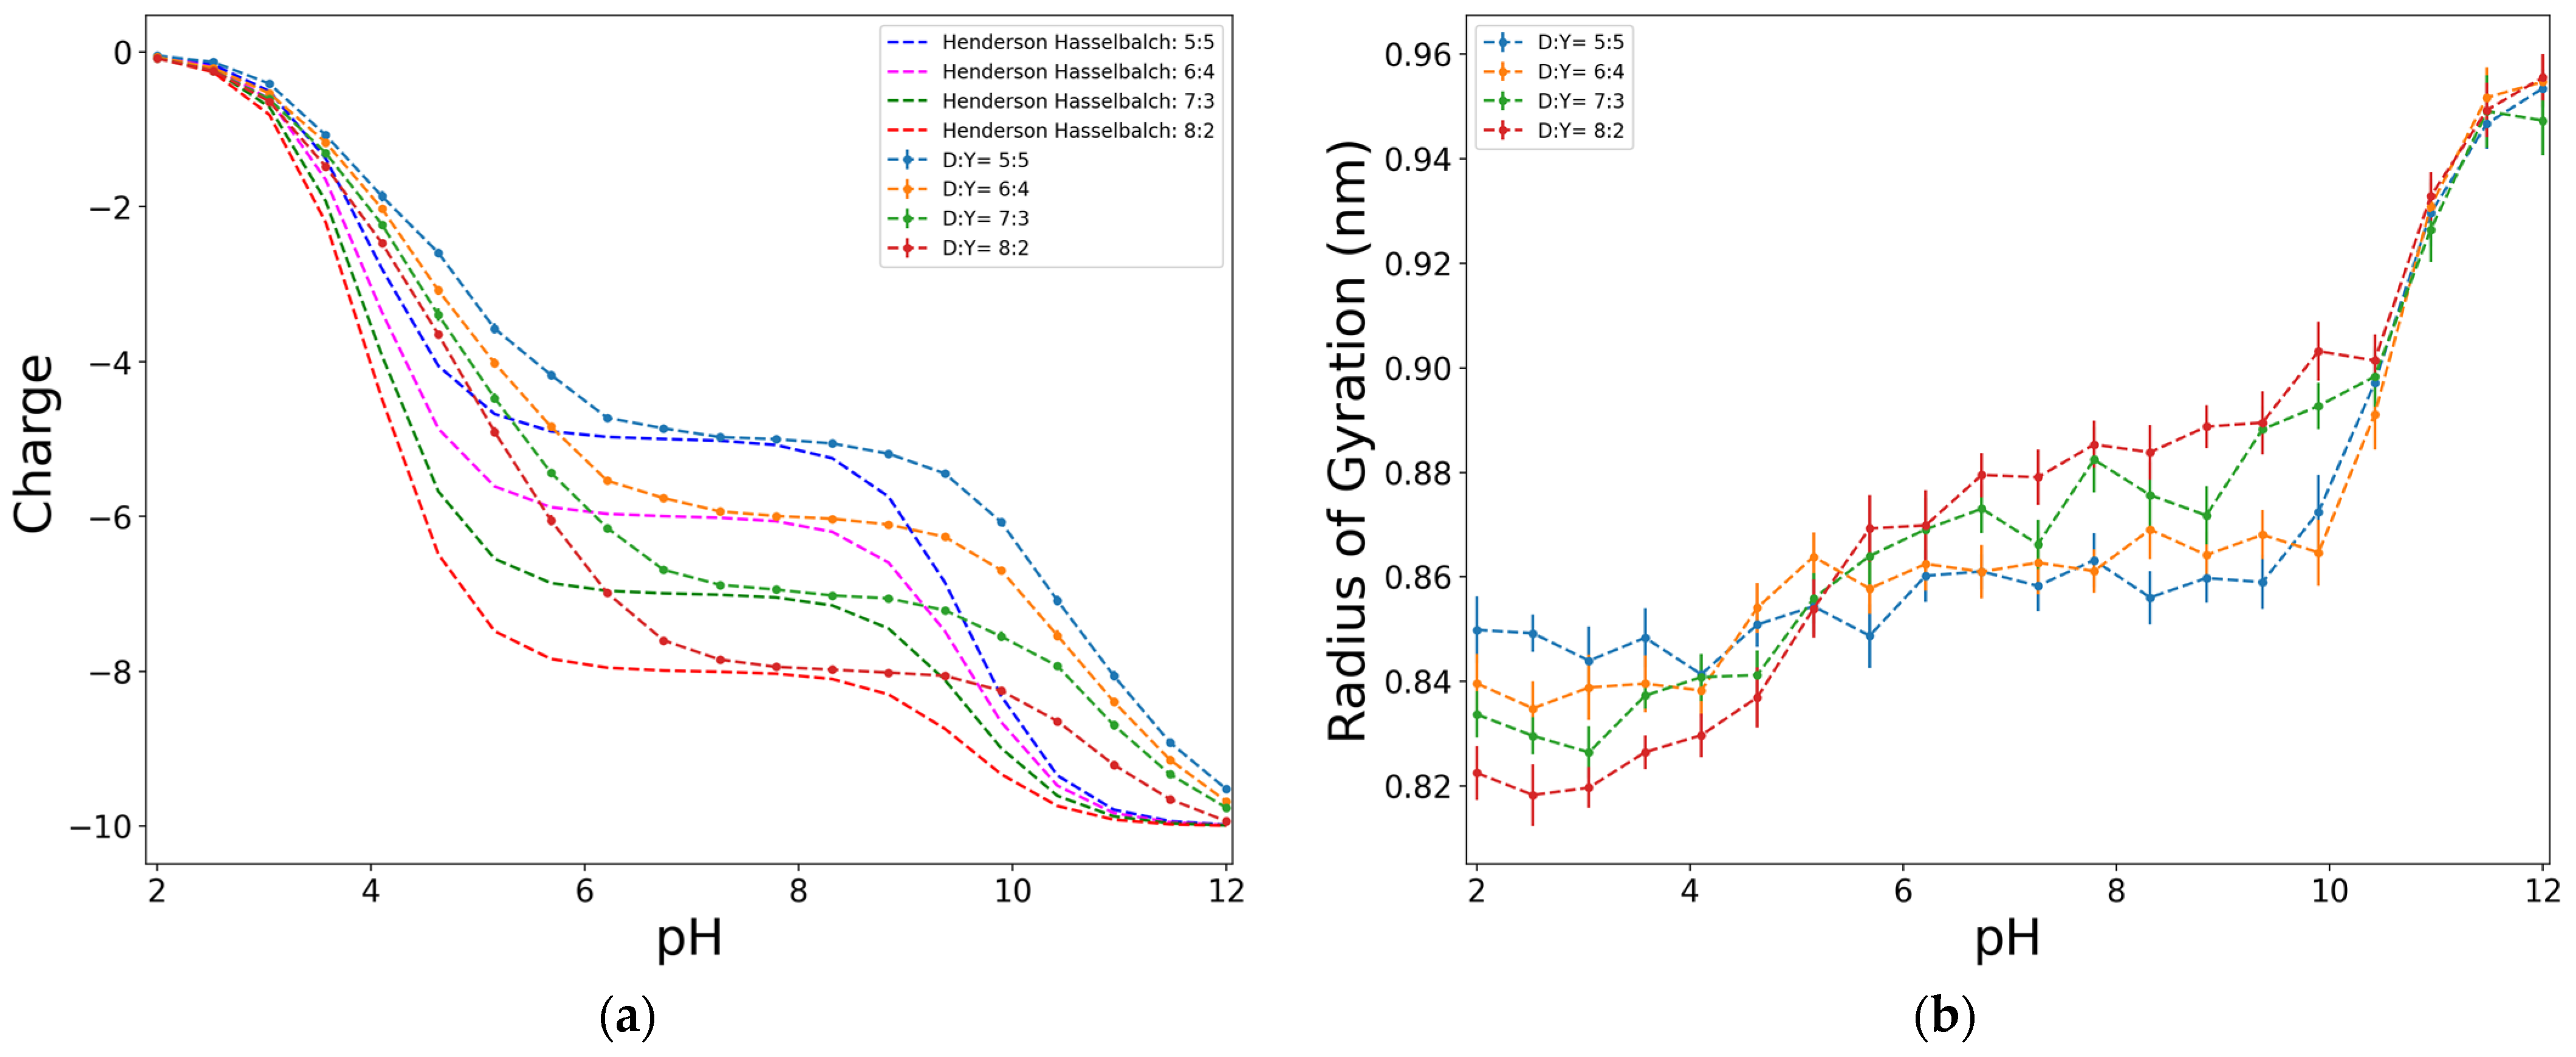
Figure 5.
Effect of the distribution of substituents along the chain on the dimensionless charge, in terms of e (a), and on the radius of gyration (b), for a model of 50 units, D:Y = 8:2, at ionic strength of 0.001 M, electrostatics computed with Debye–Hückel potential.
Figure 5.
Effect of the distribution of substituents along the chain on the dimensionless charge, in terms of e (a), and on the radius of gyration (b), for a model of 50 units, D:Y = 8:2, at ionic strength of 0.001 M, electrostatics computed with Debye–Hückel potential.
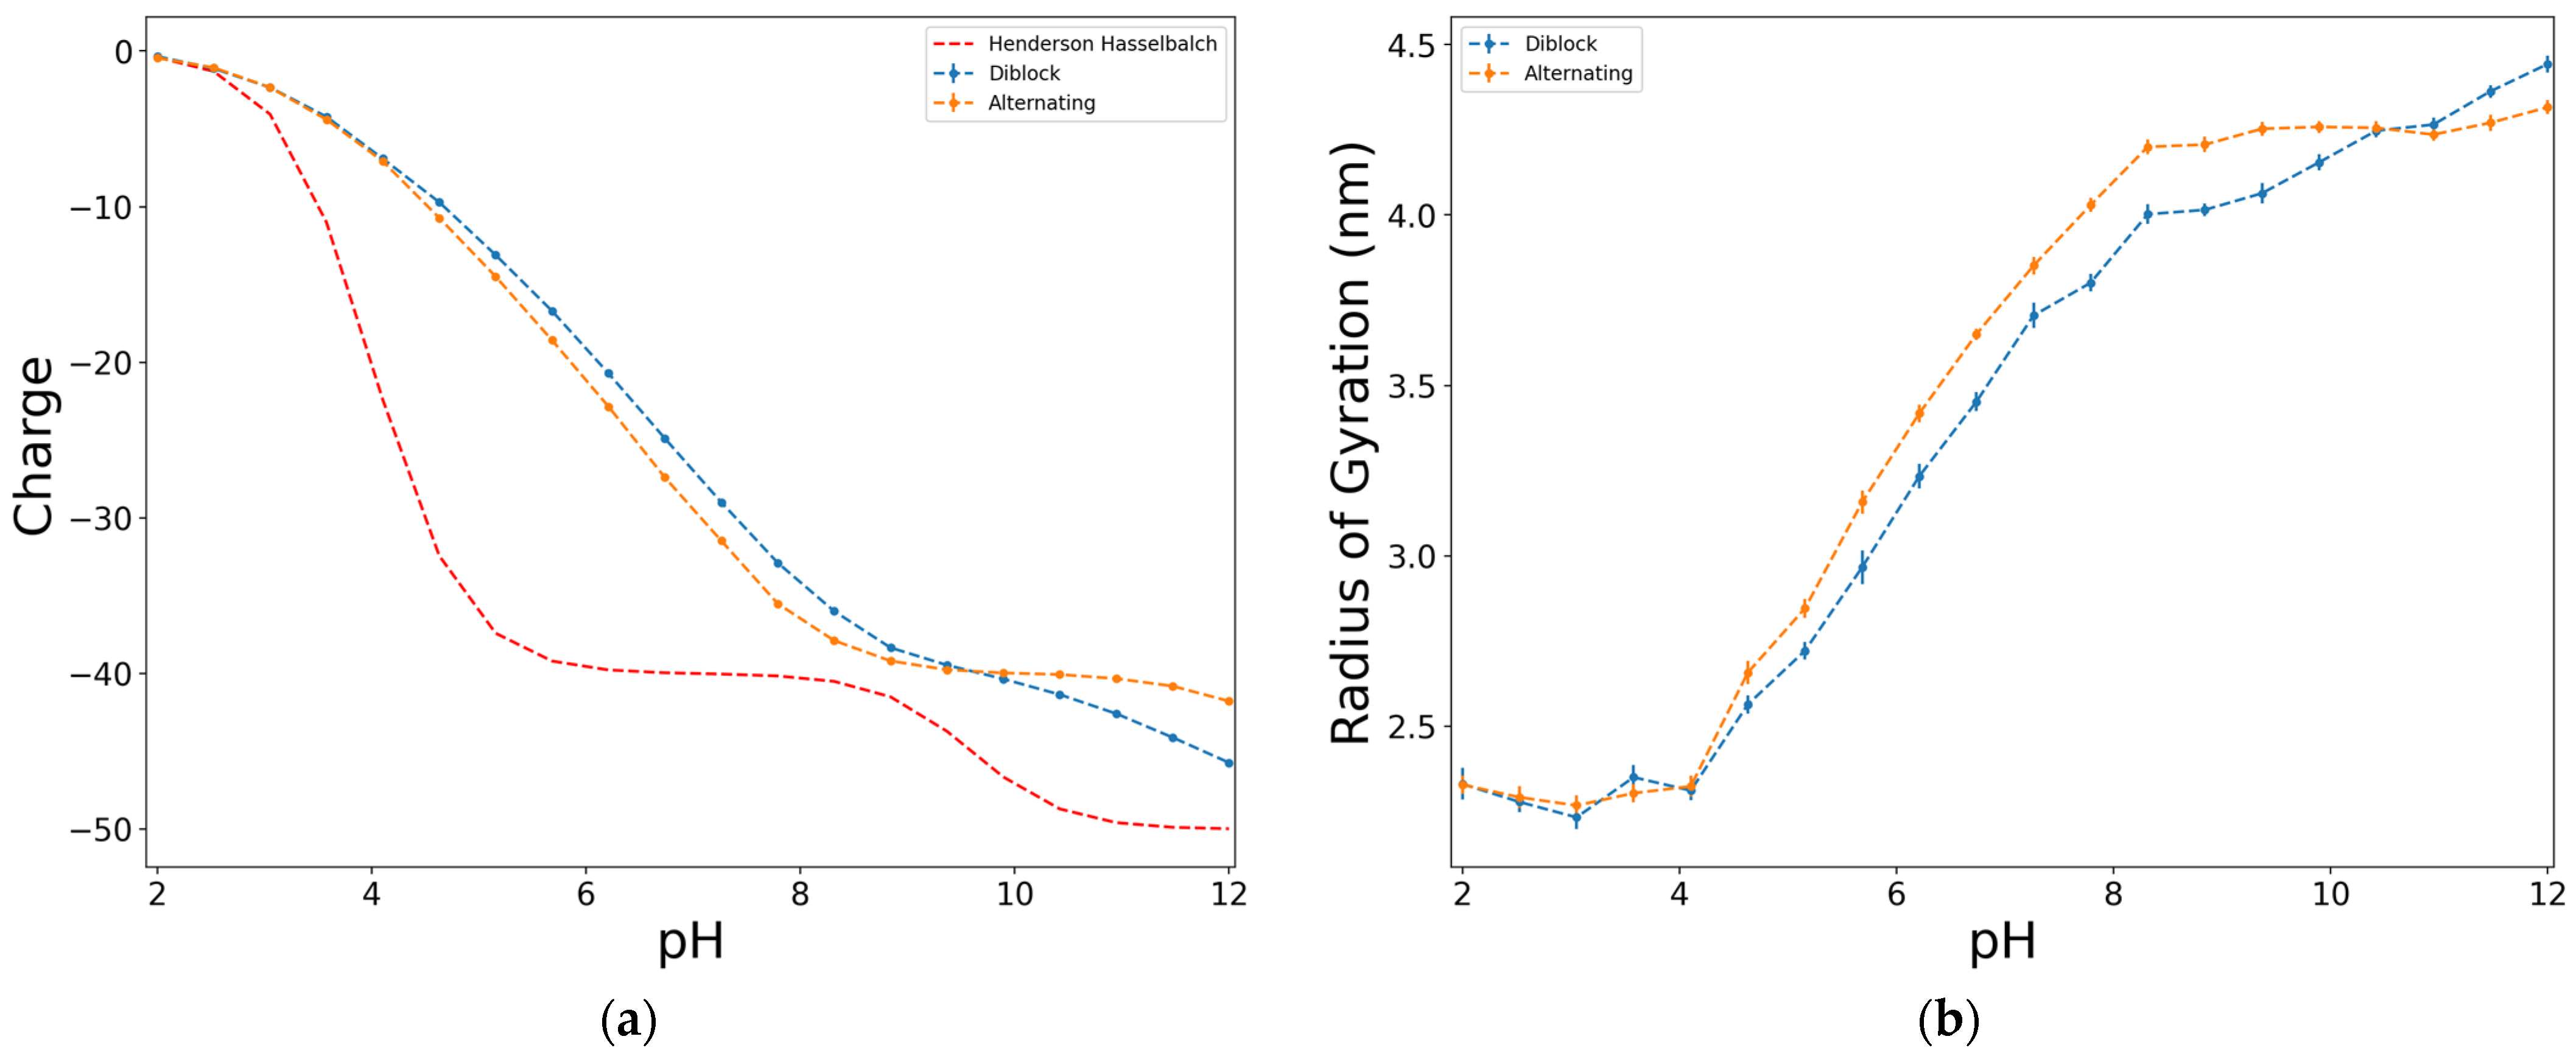
Figure 6.
Effect of the ionic strength on the dimensionless charge, in terms of e (a), and on the radius of gyration (b), for an alternating model of 10 units, D:Y = 6:4, electrostatics computed with Debye–Hückel potential.
Figure 6.
Effect of the ionic strength on the dimensionless charge, in terms of e (a), and on the radius of gyration (b), for an alternating model of 10 units, D:Y = 6:4, electrostatics computed with Debye–Hückel potential.
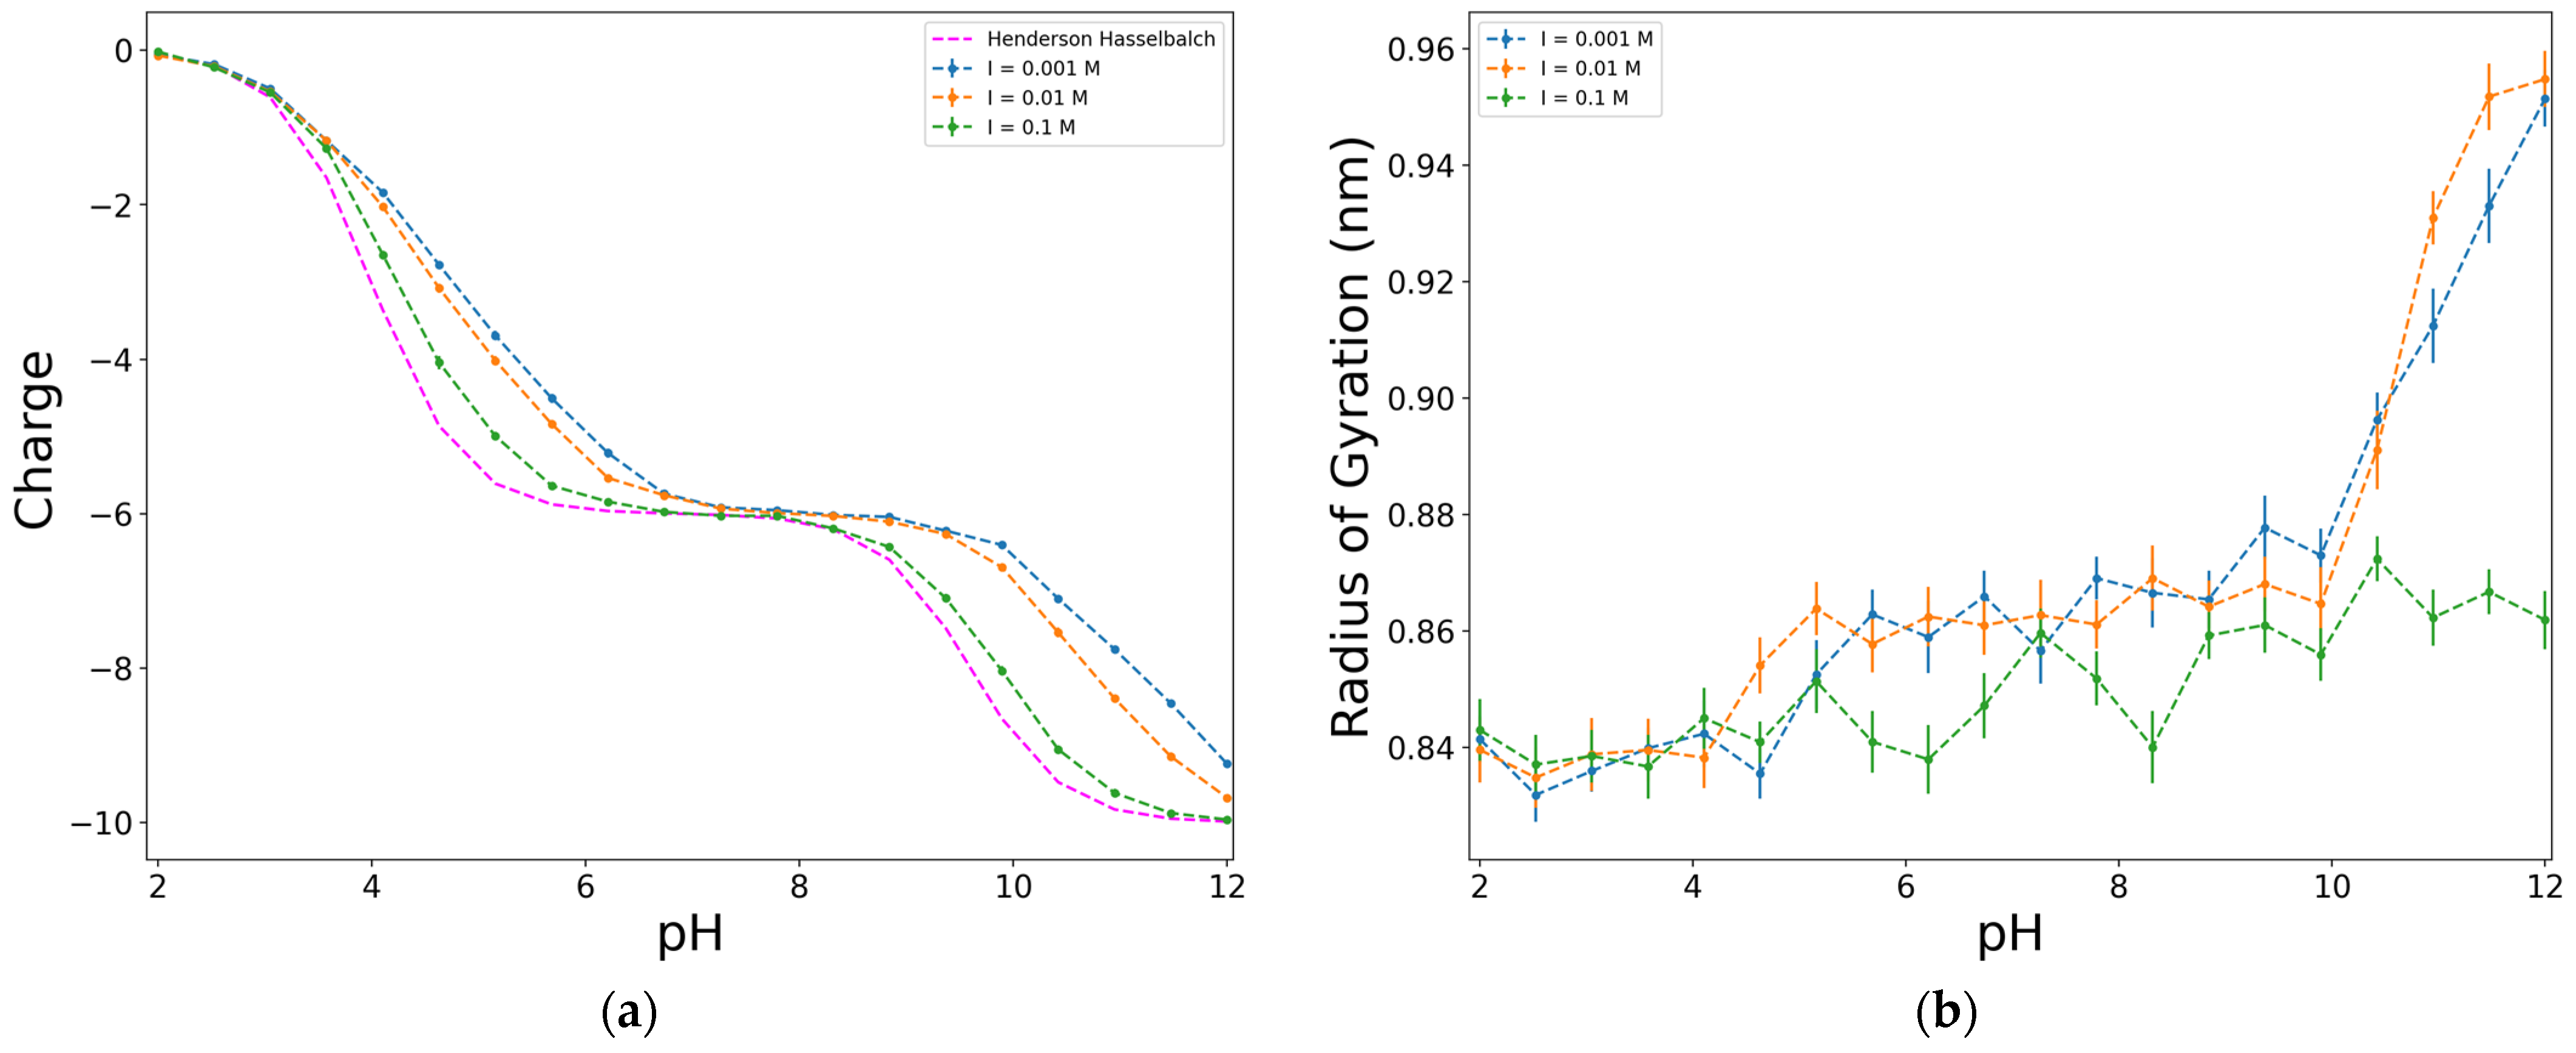
Figure 7.
Effect of the presence of other functional groups associated with nitrogen on the dimensionless charge, in terms of e (a), and on the radius of gyration (b), for an alternating model of 50 units, D:Y = 5:5, at ionic strength of 0.01 M, electrostatics computed with Debye–Hückel potential.
Figure 7.
Effect of the presence of other functional groups associated with nitrogen on the dimensionless charge, in terms of e (a), and on the radius of gyration (b), for an alternating model of 50 units, D:Y = 5:5, at ionic strength of 0.01 M, electrostatics computed with Debye–Hückel potential.
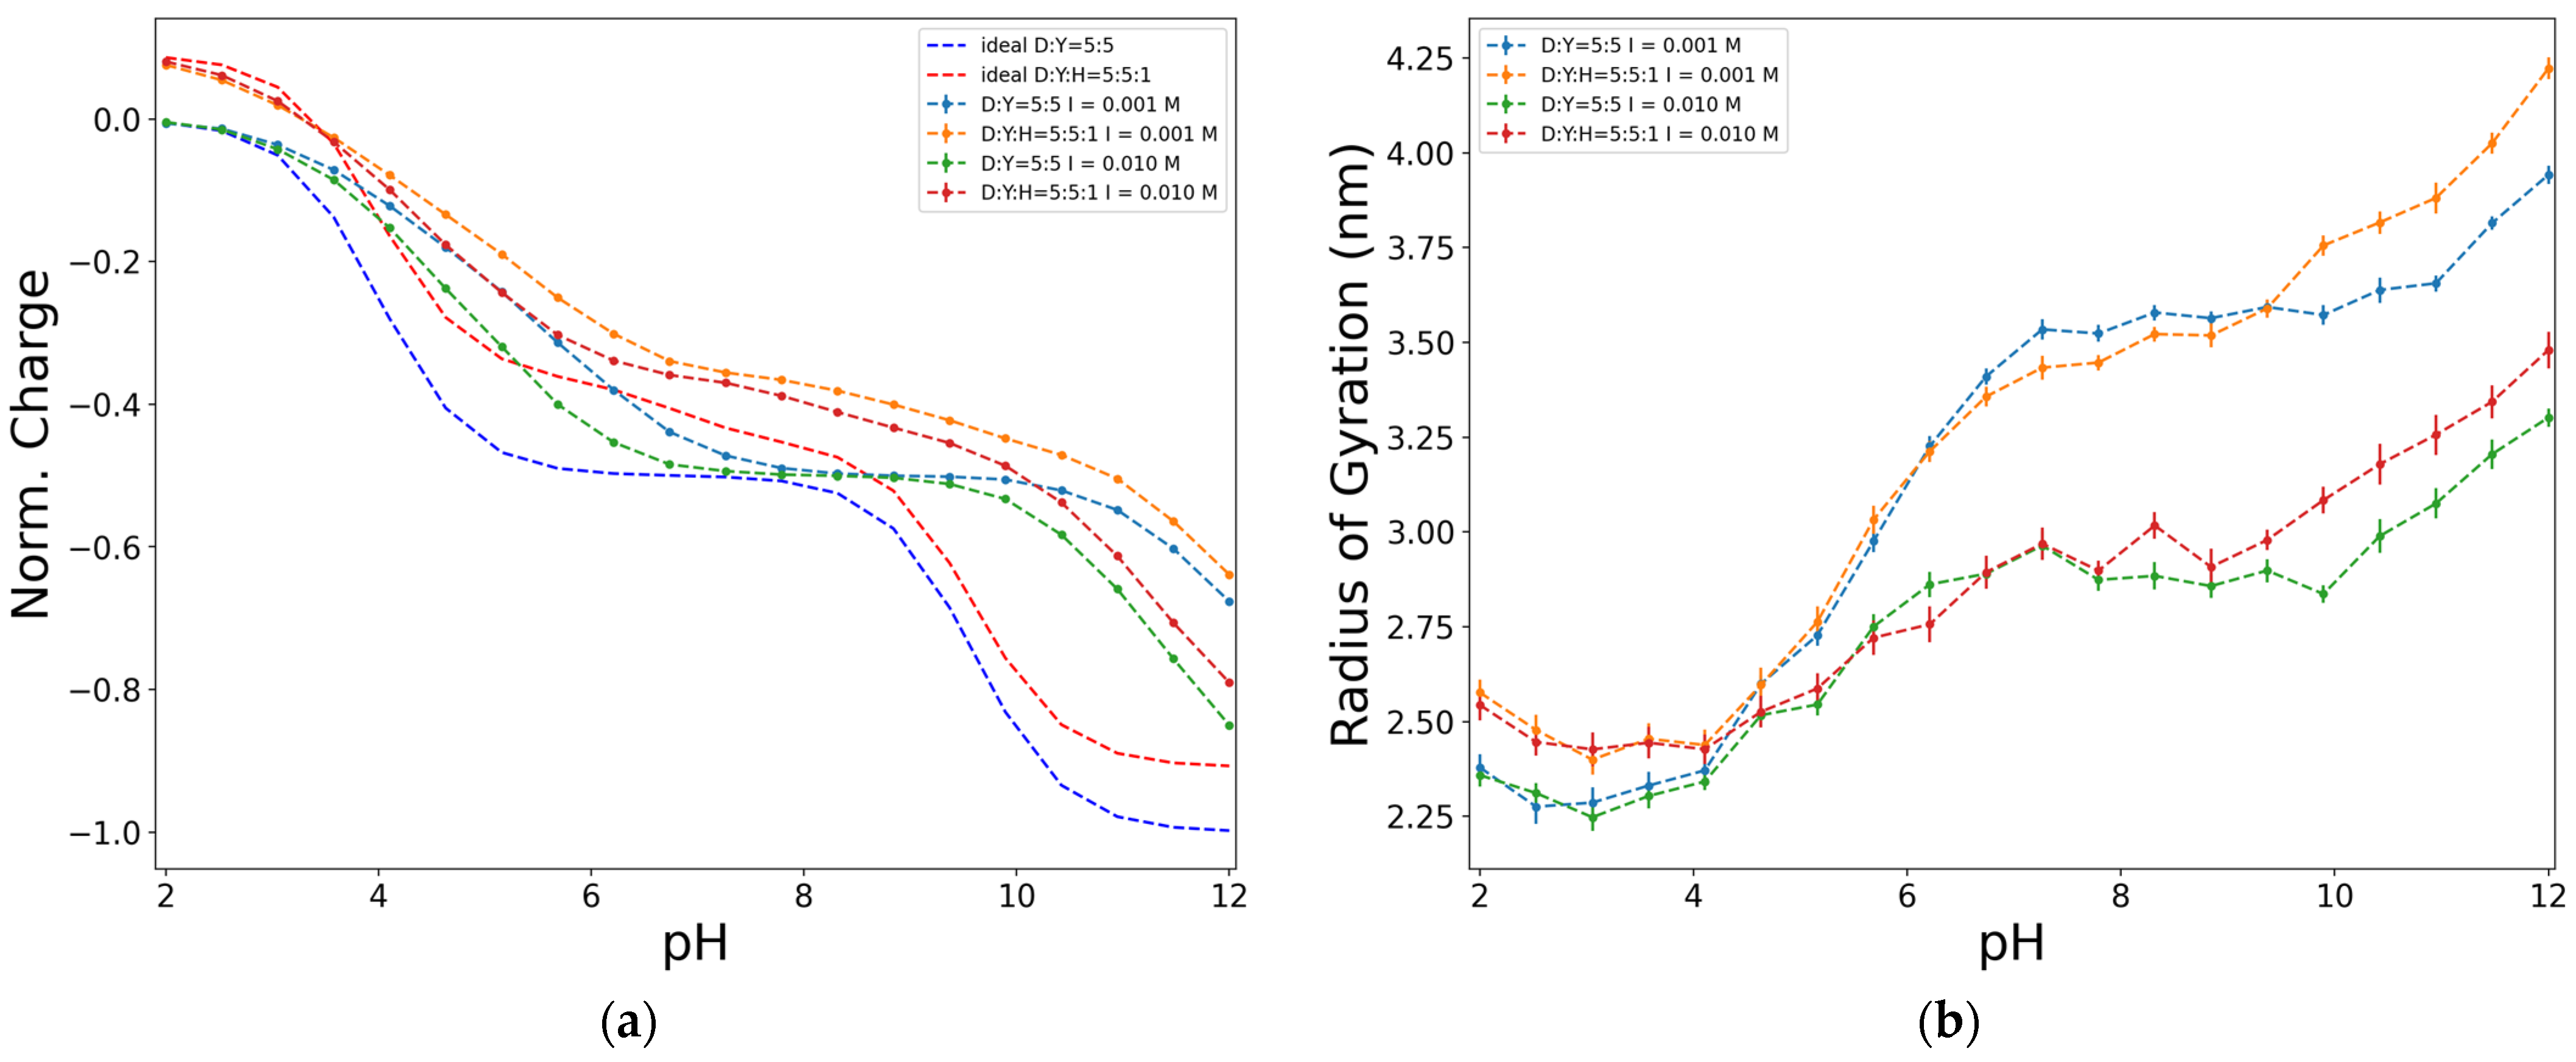
Figure 8.
Fitted coverage-pH curves to two-acid terms of Frumkin isotherm (a), and the corresponding (b), for and alternating model of 50 units, D:Y = 5:5, at two ionic strengths, electrostatics computed with Debye–Hückel potential.
Figure 8.
Fitted coverage-pH curves to two-acid terms of Frumkin isotherm (a), and the corresponding (b), for and alternating model of 50 units, D:Y = 5:5, at two ionic strengths, electrostatics computed with Debye–Hückel potential.

Figure 9.
Fitted coverage-pH curves to two different Frumkin isotherms, one of two-acid terms and another of two-acid and 1-basic terms (a), and the corresponding (b), for and alternating model of 55 units, D:Y:H = 5:5:1, at two ionic strengths, electrostatics computed with Debye–Hückel potential.
Figure 9.
Fitted coverage-pH curves to two different Frumkin isotherms, one of two-acid terms and another of two-acid and 1-basic terms (a), and the corresponding (b), for and alternating model of 55 units, D:Y:H = 5:5:1, at two ionic strengths, electrostatics computed with Debye–Hückel potential.
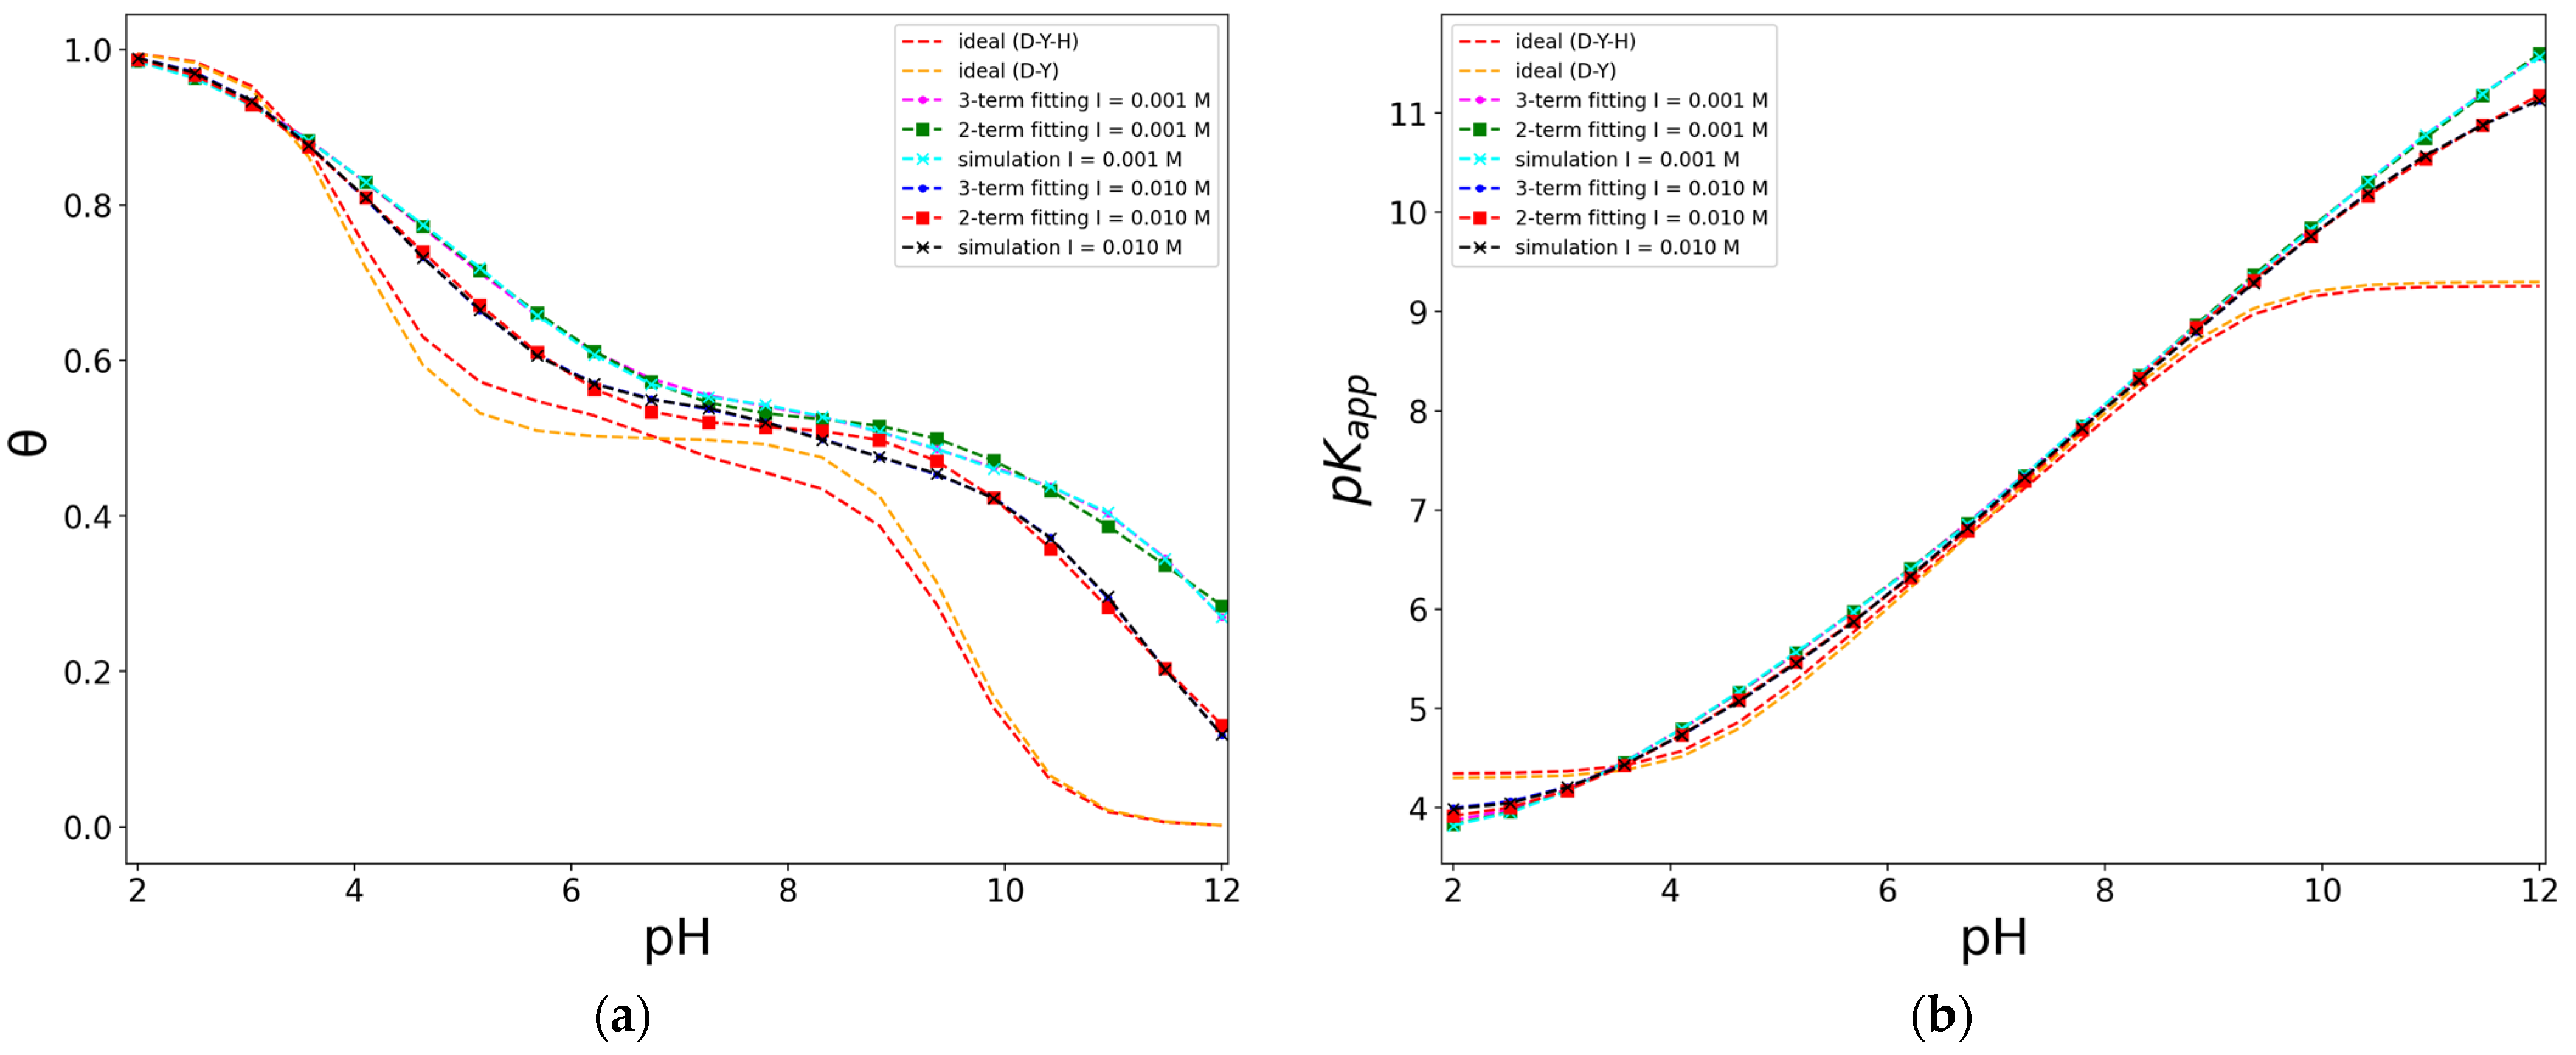
Figure 10.
Example of the coarse-grained model where aspartic acid (D) and tyrosine (Y) represent the carboxylic and phenolic substituents in the HA structure with a D:Y proportion of 5:5 and 10 substituents. The structure is simplified in a 2-bead model, where C is the central bead, that represents the peptide bond, and the substituents are represented for another beads, either green (D) or pink (Y).
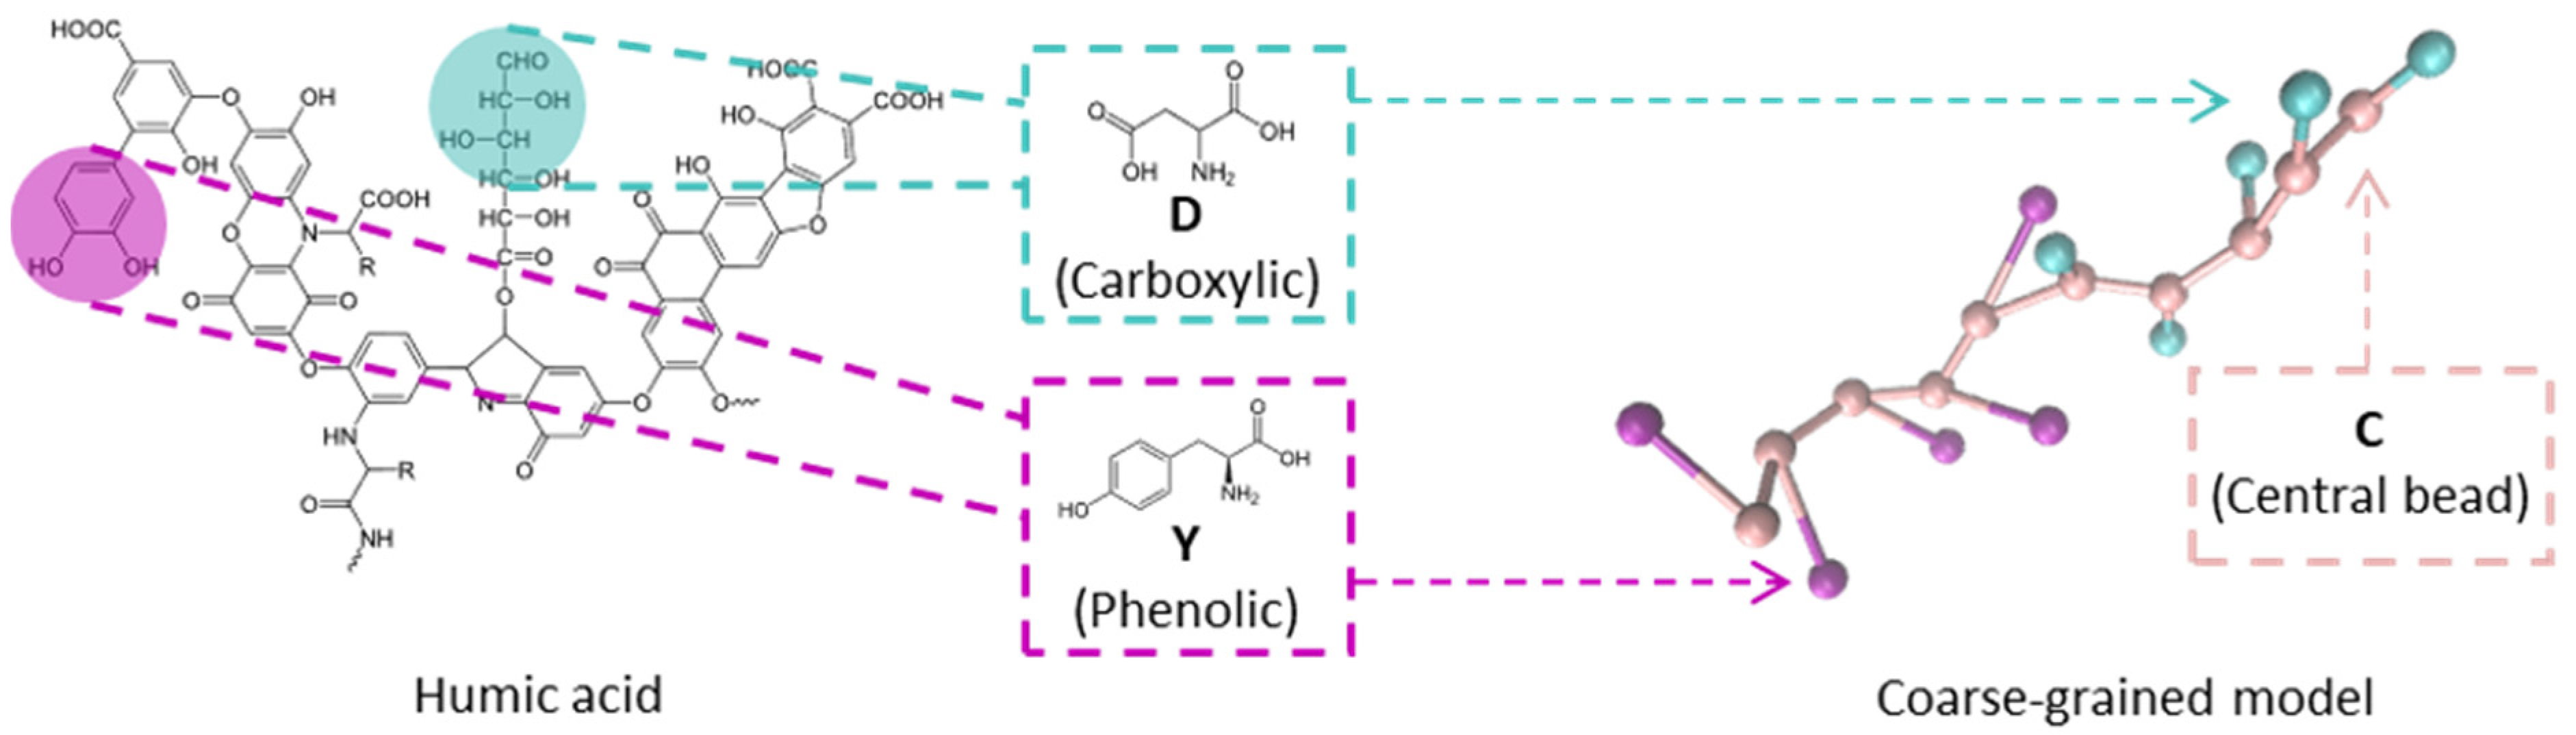
Table 1.
Fitted parameters of coverage-pH curves to two-acid terms of Frumkin isotherms for different D-Y proportions and different ionic strengths. In all cases the simulation was made for a case of 50 units and the electrostatics computed with Debye–Hückel potential.
Table 1.
Fitted parameters of coverage-pH curves to two-acid terms of Frumkin isotherms for different D-Y proportions and different ionic strengths. In all cases the simulation was made for a case of 50 units and the electrostatics computed with Debye–Hückel potential.
| Units/pi | I (mol/L) | βδ | pkD | pkY | pD | |
|---|---|---|---|---|---|---|
| 25:25 (0.5:0.5) | 0.001 | 4.78 ± 0.15 | 4.12 ± 0.04 | 9.53 ± 0.08 | 0.499 ± 0.002 | 2.4 × 10⁻⁵ |
| 0.01 | 2.70 ± 0.11 | 4.11 ± 0.03 | 9.70 ± 0.07 | 0.497 ± 0.002 | 2.3 × 10⁻⁵ | |
| 30:20 (0.6:0.4) | 0.001 | 4.85 ± 0.10 | 4.15 ± 0.03 | 9.38 ± 0.06 | 0.601 ± 0.002 | 1.8 × 10⁻⁵ |
| 0.01 | 3.17 ± 0.09 | 4.05 ± 0.03 | 9.34 ± 0.06 | 0.598 ± 0.002 | 2.1 × 10⁻⁵ | |
| 35:15 (0.7:0.3) | 0.001 | 4.52 ± 0.11 | 4.18 ± 0.04 | 9.66 ± 0.10 | 0.702 ± 0.003 | 4.3 × 10⁻⁵ |
| 0.01 | 3.05 ± 0.07 | 4.07 ± 0.02 | 9.48 ± 0.05 | 0.699 ± 0.002 | 1.9 × 10⁻⁵ | |
| 40:10 (0.8:0.2) | 0.001 | 4.54 ± 0.09 | 4.23 ± 0.04 | 9.45 ± 0.15 | 0.804 ± 0.004 | 4.7 × 10⁻⁵ |
| 0.01 | 3.07 ± 0.06 | 4.09 ± 0.02 | 9.37 ± 0.06 | 0.802 ± 0.002 | 2.5 × 10⁻⁵ |
Table 2.
Fitted parameters of coverage-pH curves to two-acid of Frumkin isotherms for different D-Y-H proportions and different ionic strengths. In all cases the simulation was made for a case of 55 units and the electrostatics computed with Debye–Hückel potential.
Table 2.
Fitted parameters of coverage-pH curves to two-acid of Frumkin isotherms for different D-Y-H proportions and different ionic strengths. In all cases the simulation was made for a case of 55 units and the electrostatics computed with Debye–Hückel potential.
| Units/pi | I (mol/L) | βδ | pkD | pkY | pD | |
|---|---|---|---|---|---|---|
| 25:25:5 (0.455:0.455:0.090) | 0.001 | 6.6 ± 0.3 | 3.39 ± 0.07 | 7.9 ± 0.2 | 0.480 ± 0.005 | 8.0 × 10⁻⁵ |
| 0.01 | 4.2 ± 0.3 | 3.60 ± 0.07 | 8.4 ± 0.2 | 0.481 ± 0.006 | 1.4 × 10⁻⁴ | |
| 30:20:5 (0.545:0.364:0.091) | 0.001 | 6.3 ± 0.2 | 3.45 ± 0.06 | 7.9 ± 0.1 | 0.577 ± 0.005 | 7.8 × 10⁻⁵ |
| 0.01 | 4.2 ± 0.3 | 3.61 ± 0.07 | 8.3 ± 0.2 | 0.577 ± 0.006 | 1.3 × 10⁻⁴ | |
| 35:15:5 (0.636:0.273:0.091) | 0.001 | 5.8 ± 0.2 | 3.50 ± 0.07 | 8.1 ± 0.2 | 0.668 ± 0.006 | 1.2 × 10⁻⁴ |
| 0.01 | 3.9 ± 0.2 | 3.62 ± 0.07 | 8.4 ± 0.2 | 0.672± 0.006 | 1.5 × 10⁻⁴ | |
| 40:10:5 (0.727:0.182:0.091) | 0.001 | 5.6 ± 0.2 | 3.58 ± 0.06 | 7.8 ± 0.2 | 0.763 ± 0.007 | 1.2 × 10⁻⁴ |
| 0.01 | 3.9 ± 0.2 | 3.65 ± 0.06 | 8.3 ± 0.1 | 0.765 ± 0.006 | 1.4 × 10⁻⁴ |
Table 3.
Fitted parameters of coverage-pH curves to two-acid and one-basic terms of Frumkin isotherms for different D-Y-H proportions and different ionic strengths. In all cases the simulation was made for a case of 55 units and the electrostatics computed with Debye–Hückel potential.
Table 3.
Fitted parameters of coverage-pH curves to two-acid and one-basic terms of Frumkin isotherms for different D-Y-H proportions and different ionic strengths. In all cases the simulation was made for a case of 55 units and the electrostatics computed with Debye–Hückel potential.
| Units/pi | I (mol/L) | βδ | pkD | pkY | pkH | pD | pY | |
|---|---|---|---|---|---|---|---|---|
| 25:25:5 (0.455:0.455:0.090) | 0.001 | 5.8 ± 0.3 | 3.80 ± 0.08 | 8.8 ± 0.2 | 6.6 ± 0.3 | 0.456 ± 0.007 | 0.482 ± 0.012 | 3.5 × 10⁻⁵ |
| 0.01 | 3.2 ± 0.2 | 3.91 ± 0.04 | 9.4 ± 0.1 | 6.7 ± 0.2 | 0.445 ± 0.006 | 0.479 ± 0.007 | 3.3 × 10⁻⁵ | |
| 30:20:5 (0.545:0.364:0.091) | 0.001 | 5.8 ± 0.2 | 3.88 ± 0.06 | 8.8 ± 0.1 | 6.7 ± 0.3 | 0.552 ± 0.006 | 0.377 ± 0.011 | 2.1 × 10⁻⁵ |
| 0.01 | 3.4 ± 0.2 | 3.93 ± 0.04 | 9.2 ± 0.1 | 6.8 ± 0.2 | 0.545 ± 0.006 | 0.382 ± 0.008 | 3.1 × 10⁻⁵ | |
| 35:15:5 (0.636:0.273:0.091) | 0.001 | 5.5 ± 0.2 | 3.94 ± 0.08 | 9.1 ± 0.2 | 7.0 ± 0.3 | 0.645 ± 0.007 | 0.27 ± 0.02 | 4.1 × 10⁻⁵ |
| 0.01 | 3.4 ± 0.1 | 3.92 ± 0.03 | 9.2 ± 0.1 | 7.0 ± 0.1 | 0.640 ± 0.004 | 0.284 ± 0.006 | 1.4 × 10⁻⁵ | |
| 40:10:5 (0.727:0.182:0.091) | 0.001 | 5.4± 0.1 | 4.06 ± 0.14 | 9.3 ± 0.8 | 7.2 ± 0.5 | 0.745 ± 0.008 | 0.16 ± 0.03 | 5.8 × 10⁻⁵ |
| 0.01 | 3.5 ± 0.1 | 3.95 ± 0.03 | 9.1 ± 0.1 | 7.0 ± 0.1 | 0.734 ± 0.004 | 0.186 ± 0.006 | 1.5 × 10⁻⁵ |
Disclaimer/Publisher’s Note: The statements, opinions and data contained in all publications are solely those of the individual author(s) and contributor(s) and not of MDPI and/or the editor(s). MDPI and/or the editor(s) disclaim responsibility for any injury to people or property resulting from any ideas, methods, instructions or products referred to in the content. |
© 2024 by the authors. Licensee MDPI, Basel, Switzerland. This article is an open access article distributed under the terms and conditions of the Creative Commons Attribution (CC BY) license (https://creativecommons.org/licenses/by/4.0/).
Share and Cite
MDPI and ACS Style
Naranjo, D.; Blanco, P.M.; Garcés, J.L.; Madurga, S.; Mas, F. Constant-pH Simulations of a Coarse-Grained Model of Polyfunctional Weak Charged Biopolymers. Biophysica 2024, 4, 107-127. https://doi.org/10.3390/biophysica4010008
AMA Style
Naranjo D, Blanco PM, Garcés JL, Madurga S, Mas F. Constant-pH Simulations of a Coarse-Grained Model of Polyfunctional Weak Charged Biopolymers. Biophysica. 2024; 4(1):107-127. https://doi.org/10.3390/biophysica4010008
Chicago/Turabian StyleNaranjo, David, Pablo M. Blanco, Josep L. Garcés, Sergio Madurga, and Francesc Mas. 2024. "Constant-pH Simulations of a Coarse-Grained Model of Polyfunctional Weak Charged Biopolymers" Biophysica 4, no. 1: 107-127. https://doi.org/10.3390/biophysica4010008