Article

The Effect of Barley Bran Polyphenol-Rich Extracts on the Development of Nonalcoholic Steatohepatitis in Sprague–Dawley Rats Fed a High-Fat and High-Cholesterol Diet

1
Department of Nutritional Science, Faculty of Nursing and Nutrition, University of Nagasaki, 1-1-1 Manabino, Nagayo-cho, Nishisonogi-gun, Nagasaki 851-2195, Japan
2
Division of Human Health Science, Graduate School of Regional Design and Creation, University of Nagasaki, 1-1-1 Manabino, Nagayo-cho, Nishisonogi-gun, Nagasaki 851-2195, Japan
3
Department of Pathology and Laboratory Medicine, Graduate School of Biomedical Sciences, Tokushima University, 3-18-15 Kuramoto-cho, Tokushima-City, Tokushima 770-8503, Japan
*
Author to whom correspondence should be addressed.
Livers 2024, 4(2), 193-208; https://doi.org/10.3390/livers4020015
Submission received: 28 February 2024 / Revised: 26 March 2024 / Accepted: 10 April 2024 / Published: 24 April 2024

Abstract

:
Oxidative stress and inflammation play a central role in the progression of nonalcoholic steatohepatitis (NASH), which can lead to liver cirrhosis. Barley bran has potential bioactivities due to its high content of functional substances, such as anthocyanins, with anti-inflammatory and anti-oxidative properties. Here, we investigated whether barley bran polyphenol-rich extracts (BP) can prevent NASH in Sprague–Dawley rats fed a high-fat and high-cholesterol diet including 1.25% or 2.5% cholesterol for 9 weeks. In the rat model of NASH with advanced hepatic fibrosis, BP prevented NASH development by ameliorating the histopathological findings of lobular inflammation. The BP also tended to attenuate serum aspartate aminotransferase level in this model. In the rat model of NASH with mild-to-moderate hepatic fibrosis, BP tended to attenuate the serum levels of transaminases. BP-dose-dependent effects were revealed for several parameters, including monocyte chemoattractant protein-1, transforming growth factor-β, and manganese superoxide dismutase gene expressions in the liver. These results suggest that BP may prevent NASH development or progression, presumably due to its anti-inflammatory and anti-oxidative properties.

1. Introduction

Nonalcoholic fatty liver disease (NAFLD) is recognized as the most common cause of chronic liver diseases in many countries, and it affects more than 30% of the global population [1]. A nomenclature change has been proposed for the term NAFLD to be replaced by metabolic dysfunction-associated steatotic liver disease (MAFLD) [2]. Nonalcoholic steatohepatitis (NASH) is the inflammatory subtype of NAFLD with the accumulation of fat in the liver, necroinflammation, hepatocellular injury, and fibrosis. A nomenclature change has also been proposed for the term NASH to be replaced by metabolic dysfunction-associated steatohepatitis (MASH) [2]. NASH can progress to cirrhosis, liver failure, and occasionally hepatocellular carcinoma [3]. The pathogenesis of NASH is thought to be multifactorial, and oxidative stress and the activation of inflammatory cytokines may play an important role in the progression of NASH [4,5]. Although effective treatments for preventing NASH development and/or progression have been anticipated, there are currently no approved drugs for treating the condition [6].
Barley, which was domesticated around 8000 BCE, is one of the first grains to be cultivated by humans [7]. It has been widely used as a staple food, in beer, and in animal feed, and it has been reported to alleviate both lipid peroxidation and oxidative stress induced by hypercholesterolemia [8,9]. Barley contains large amounts of soluble fiber β-glucan, and has also been reported to ameliorate liver function, hepatic fat accumulation, and hepatic fibrosis in human and animal studies, presumably due to its beneficial effects on glucose metabolism, energy expenditure, and the gut microbiota [10,11,12,13]. In humans, barley bran, which is a byproduct of barley processing, has been reported to have a better protective effect against cardiovascular diseases and atherosclerosis than whole grains, because barley bran has a high content of functional substances, including polyphenols, such as anthocyanins, with potential bioactivities [14,15,16]. Due to these functional substances and their anti-oxidative properties, barley bran may provide a potential dietary strategy for the prevention of NASH.
We previously reported that the administration of a high-fat and high-cholesterol (HFC) diet containing 1.25% or 2.5% cholesterol to Sprague–Dawley (SD) rats induced NASH with mild-to-moderate hepatic fibrosis or advanced fibrosis, respectively, within the relatively short period of 9 weeks, although this rat model did not show obesity with an increased visceral fat volume [17]. In the present study, we evaluated whether polyphenol-rich extracts of barley bran (barley polyphenol; BP), which was refined by Ito Barley Processing Co., Ltd., Isahaya City, Nagasaki, Japan, had protective effects against NASH progression in SD rats fed an HFC diet containing 1.25% or 2.5% cholesterol. The mechanisms underlying the effects of BP, specifically in relation to lipid and cholesterol metabolism, inflammation, fibrogenesis, and oxidative stress in the liver, were also investigated.

2. Materials and Methods

2.1. Preparation of BP

Barley (Hordeum vulgare) was ground with a stamping machine, and the polyphenol-rich fraction containing the outer layer of bran was obtained with a 90–98% (w/w) yield ratio. The extracts were concentrated with ethanol and sterilized, then dissolved with dextrin, and dried. The resulting powder was used as the BP. The BP contained 5.2 g of water, 12.2 g of protein, 2.3 g of lipid, 4.0 g of ash, 76.3 g of carbohydrate (including 2.0 g of dietary fiber), 47.1 mg of sodium, 1200 mg of polyphenol, and 371 kcal of energy per 100 g.

2.2. Animals and Experimental Design

Eight-week-old male SD rats were purchased from Japan SLC (Hamamatsu, Japan), and housed individually in a temperature- and humidity-controlled room (22–24 °C, 50–60% relative humidity) with a 12 h light/dark cycle. After 1 week of acclimatization with standard rodent chow (MF; Oriental Yeast, Tokyo, Japan) and water ad libitum the rats were randomly divided into seven groups: the control group (n = 5) was fed MF as a normal diet for 9 weeks; the mild-to-moderate NASH model without BP (MO) group (n = 5) was fed an HFC1.25% diet (69.5% MF, 28.75% palm oil, 1.25% cholesterol, and 0.5% sodium cholate) for 9 weeks; the mild-to-moderate NASH model with a low amount of BP (ML) group (n = 5) was fed an HFC1.25% diet supplemented with 0.7% (w/w) BP for 9 weeks; the mild-to-moderate NASH model with a high amount of BP (MH) group (n = 6) was fed an HFC1.25% diet supplemented with 2.0% (w/w) BP for 9 weeks; the progressed NASH model without BP (PO) group (n = 5) was fed an HFC2.5% diet (68.0% MF, 27.5% palm oil, 2.5% cholesterol, and 2% sodium cholate) for 9 weeks; the progressed NASH model with a low amount of BP (PL) group (n = 5) was fed an HFC2.5% diet supplemented with 0.7% (w/w) BP for 9 weeks; and the progressed NASH model with a high amount of BP (PH) group (n = 6) was fed an HFC2.5% diet supplemented with 2.0% (w/w) BP for 9 weeks. The number of rats per group was set as follows: In our previous study, hepatic triglyceride (TG) concentration, which is frequently accumulated in NAFLD/NASH liver, was 68.7 ± 22.6 mg/g liver in the rat model of NASH with mild-to-moderate hepatic fibrosis and 12.0 ± 7.0 mg/g liver in the control group [18]. When an α-error of 0.05 and a power of 80% were set, minimum required rat number was estimated to be three. In our present study, the number of rats per group was set to be 5 or 6 in order to deal with unexpected death during the rearing period.
The daily doses of BP in this study were determined based on the human dose provided from the manufacturer of the BP, i.e., 3.5 g of BP per day for 60 kg of human body weight (approximately 58.3 mg/kg). Based on the dose conversion rate between rats and humans of 6.2 [19], dose of BP was set as 362 mg/kg body weight of the rats. Because the body weight of the rats between 9 and 18 weeks of age was expected to be 300–500 g, 109–181 mg/day of BP was given to each rat. The daily food intake was expected to be 20–25 g/day during rearing period. Therefore, the supplementation of approximately 0.7% (w/w) BP in the HFC diets would be equivalent to the daily dose in humans. In addition to the 0.7% (w/w) BP dose, we also used a 2.0% (w/w) BP dose as a dose that is roughly threefold that of the human equivalent dose. The proximate composition of each diet fed to the rats is shown in Table 1. The daily energy intake and body weight of the rats were monitored throughout the study. The food efficacy of each rat was calculated as the body weight gain (g)/cumulative energy intake (kcal) during the rearing period. At 18 weeks of age, the rats were fasted for at least 9 h, then euthanized under inhalation anesthesia with isoflurane (approximately 0.6 mL of liquid isoflurane per liter of chamber volume, but there were considerable individual differences). Blood was collected from the inferior vena cava or heart of the rats, then centrifuged at 1000× g for 10 min at 4 °C, and the supernatant was collected as a serum sample. The epididymal fat pad and liver were removed, washed in cold saline, and weighed. Liver tissues were either placed in 10% neutral buffered formalin or snap-frozen in liquid nitrogen and stored at −80 °C until further analysis.
All animal procedures were approved by the Animal Use Committee of University of Nagasaki (approval number: R04-12), and the animals were maintained in accordance with the University of Nagasaki guidelines for the care and use of laboratory animals.

2.3. Serum Biochemical and Hepatic Lipid Analyses

The serum levels of TG, total cholesterol (TC), and free fatty acid (FFA) were determined using the Triglyceride E-test Wako, Cholesterol E-test Wako, and NEFA C-test Wako (FUJIFILM Wako Pure Chemical Co., Osaka, Japan), respectively. The serum leptin and adiponectin levels were measured using a mouse/rat leptin enzyme-linked immunosorbent assay kit (Morinaga Institute of Biological Science Inc., Yokohama, Japan) and a mouse/rat adiponectin enzyme-linked immunosorbent assay kit (Otsuka Pharmaceuticals Co., Ltd., Tokyo, Japan), respectively. The serum aspartate aminotransferase (AST) and alanine aminotransferase (ALT) activities were determined using the Transaminase C II-test Wako (FUJIFILM Wako Pure Chemical Co.). Hepatic lipids were extracted from frozen liver samples using the method of Folch et al. [20]. The extracts were dissolved in isopropanol and analyzed for hepatic TG and TC contents using kits, as described above.

2.4. Histopathological Assessment of the Liver

Liver tissues stored in 10% neutral-buffered formalin were embedded in paraffin, sectioned at 4 μm, and processed for hematoxylin and eosin staining for histopathological examination. Histological steatosis (scored from 0 to 3), lobular inflammation (scored from 0 to 3), and hepatocyte ballooning (scored from 0 to 2) were assessed semi-quantitatively to determine the NAFLD activity score (NAS) according to the criteria of Kleiner et al. [21]. The final NAS ranged from 0 to 8. A NAS ≥ 5 and a NAS ≤ 2 were considered to be diagnostic and not diagnostic, respectively, of steatohepatitis. Liver fibrosis (scored from 0 to 4) was also assessed by Azan staining. For the immunohistochemical analysis of thioredoxin (TRX), which plays a key role in the defense against oxidative stress [22], an enhanced immunostaining method was performed using deparaffinized liver sections. After blocking the endogenous peroxidase with a hydrogen peroxide solution, the antigen was activated by incubation in Immunosaver (Nisshin EM Co., Ltd., Tokyo, Japan), a solution for antigen retrieval, with heating in a microwave oven. TRX polyclonal antibody (1:200 dilution; Proteintech Group Inc., Rosemont, IL, USA) was used as the primary antibody. For the subsequent reactions, Envision-PO for rabbit polyclonal antibodies (Agilent Technologies, Santa Clara, CA, USA) was used as the secondary antibody, and 3,3′-diaminobenzidine (Agilent Technologies) was used for color development. The intensity of TRX staining in the liver was classified into five categories: negative staining (score of 0); positive staining in the cytoplasm of a single neutrophil (score of 1); mild staining in the cytoplasm of neutrophils or monocytes in the inflammatory foci (score of 2); apparent positive staining in the cytoplasm of neutrophils or monocytes in the inflammatory foci (score of 3); and positive staining in the Kupffer cells in sinusoids with a score 3 appearance (score of 4). All histopathological findings were evaluated by a pathologist (K.T.) in a blinded manner.

2.5. Quantification of mRNA Using Real-Time Reverse Transcription Polymerase Chain Reaction (PCR)

Total RNA was extracted from the liver using RNAiso Plus (Takara Bio Inc., Otsu, Japan) according to the manufacturer’s instructions. RNA was reverse transcribed to cDNA templates using a commercial kit (PrimeScript RT Master Mix; Takara Bio Inc.). Real-time reverse transcription PCR analysis was performed as described previously [17]. Specific primers were designed using the primer-designing tool Primer-BLAST (National Center for Biotechnology Information, Bethesda, MD, USA) and synthesized by Greiner Bio-One Japan (Tokyo, Japan). The levels of mRNA relative to those of internal control acidic ribosomal phosphoprotein (36B4) mRNA (Rplp0) were determined using the 2−ΔΔCt method.
For the rat studies, the hepatic expression levels of genes involved in lipid metabolism [Mttp encoding microsomal triglyceride transfer protein (MTP); Fasn encoding fatty acid synthase (FAS); Cpt1a encoding carnitine palmitoyltransferase-1 (CPT-1); and Srebf1 encoding sterol regulatory element-binding protein-1c (SREBP-1c)], cholesterol metabolism [Nr1h3 encoding liver X receptor-α (LXR-α); and Nr1h4 encoding farnesoid X receptor (FXR)], inflammation [Ccl2 encoding monocyte chemoattractant protein-1 (MCP-1); Il6 encoding interleukin-6 (Il-6); and Nfkb1 encoding nuclear factor-κB (NF-κB)], fibrosis [Col1a1 encoding collagen type I alpha 1 (COL1A1); Tgfb1 encoding transforming growth factor-β (TGF-β); and Acta2 encoding α-smooth muscle actin (α-SMA)], and oxidative stress [Cyp2e1 encoding cytochrome P450 family 2 subfamily E polypeptide 1 (CYP2E1); Gpx1 encoding glutathione peroxidase-1 (GPX-1); and Sod2 encoding manganese superoxide dismutase (Mn-SOD)] were quantified. The primers are listed in Table 2. All data are expressed as the fold-change relative to the control group.

2.6. Statistical Analysis

All values are expressed as the mean ± standard error (SE). The statistical significance of differences between groups was tested using one-way analysis of variance followed by Bonferroni’s post-hoc test, chi-square test, or Fisher’s exact probability test. All analyses were performed using the IBM SPSS statistics software program, version 29 (IBM, Chicago, IL, USA) on a Windows computer. p values less than 0.05 were considered to be statistically significant.

3. Results

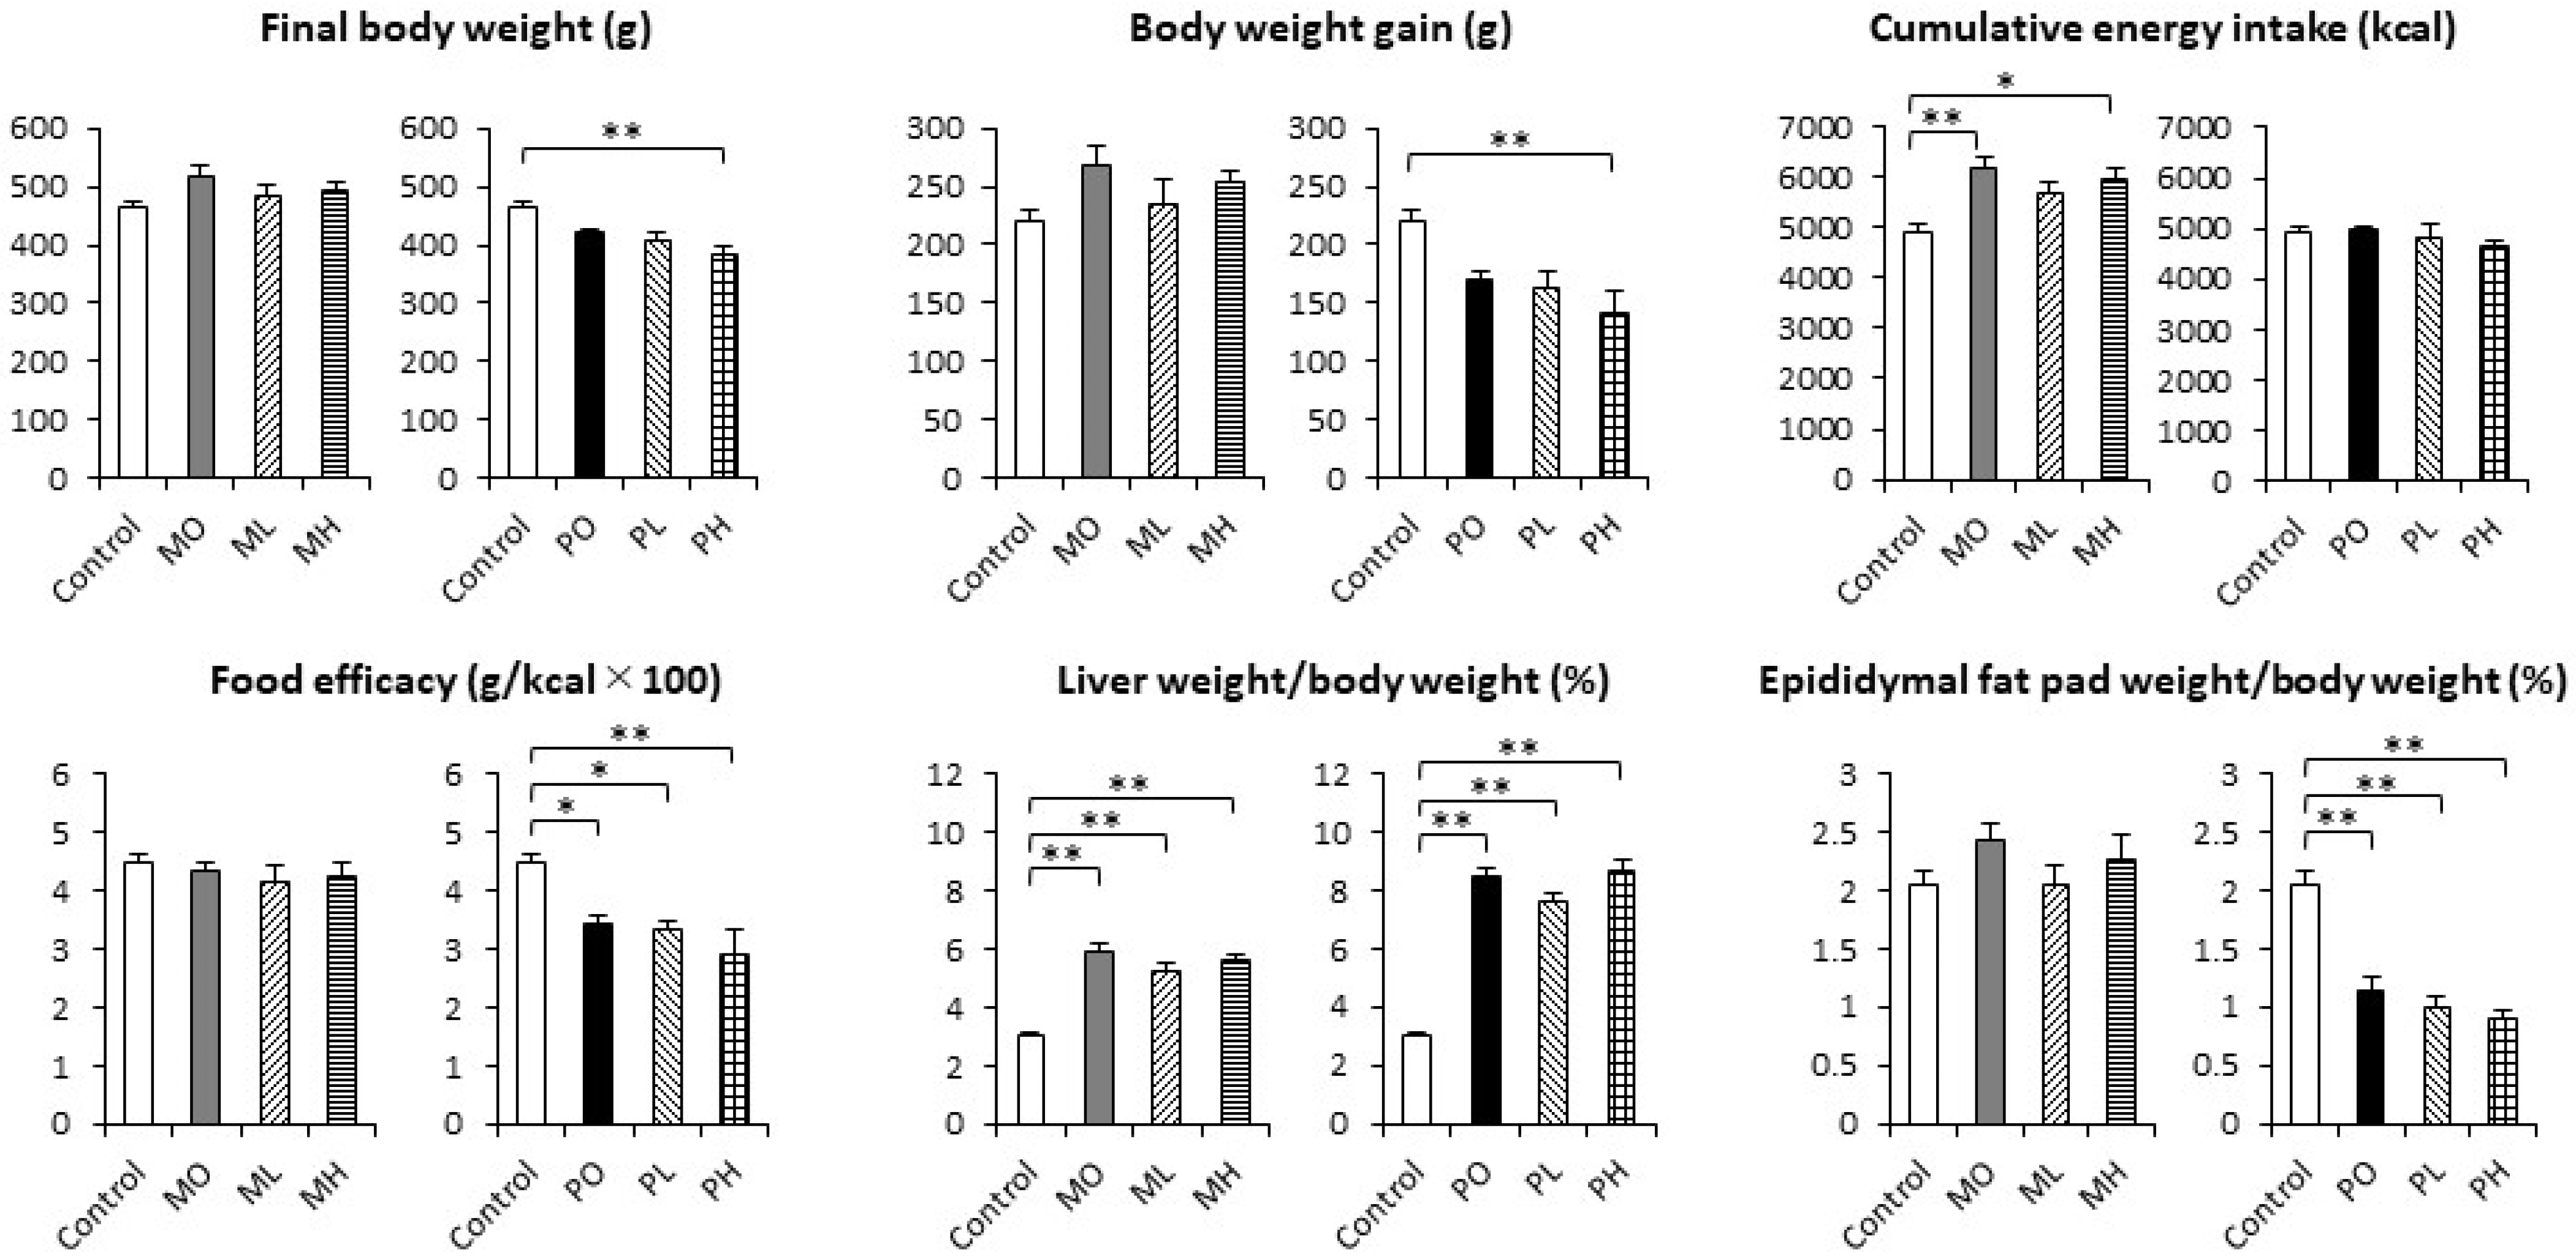
3.1. The Final Body Weight, Body Weight Gain, Cumulative Energy Intake, Food Efficacy, and Relative Organ Weights

The final body weight at 18 weeks of age, the body weight gain and food efficacy during the 9-week rearing period, and the epididymal fat pad weight-to-body weight ratio at 18 weeks of age did not differ significantly among the control, MO, ML, and MH groups. The cumulative energy intake during the rearing period was significantly higher in the MO and MH groups than in the control group (p = 0.003 and p = 0.010, respectively). The liver weight-to-body weight ratio at 18 weeks of age was significantly higher in the MO, ML, and MH groups than in the control group (p < 0.001 each).
The final body weight at 18 weeks of age and the body weight gain during the 9-week rearing period were significantly lower in the PH group than in the control group (p = 0.003 and p = 0.004, respectively). The cumulative energy intake during the rearing period did not differ significantly among the control, PO, PL, and PH groups. The food efficacy during the 9-week rearing period was significantly lower in the PO, PL, and PH groups than in the control group (p = 0.042, p = 0.028, and p = 0.002, respectively). At 18 weeks of age, the liver weight-to-body weight ratio was significantly higher, and the epididymal fat pad weight-to-body weight ratio was significantly lower in the PO, PL, and PH groups than in the control group (p < 0.001 each).
Overall, there were no significant differences among the MO, ML, and MH groups, or among the PO, PL, and PH groups in the final body weight, body weight gain, cumulative energy intake, food efficacy, and relative organ weights (Figure 1).

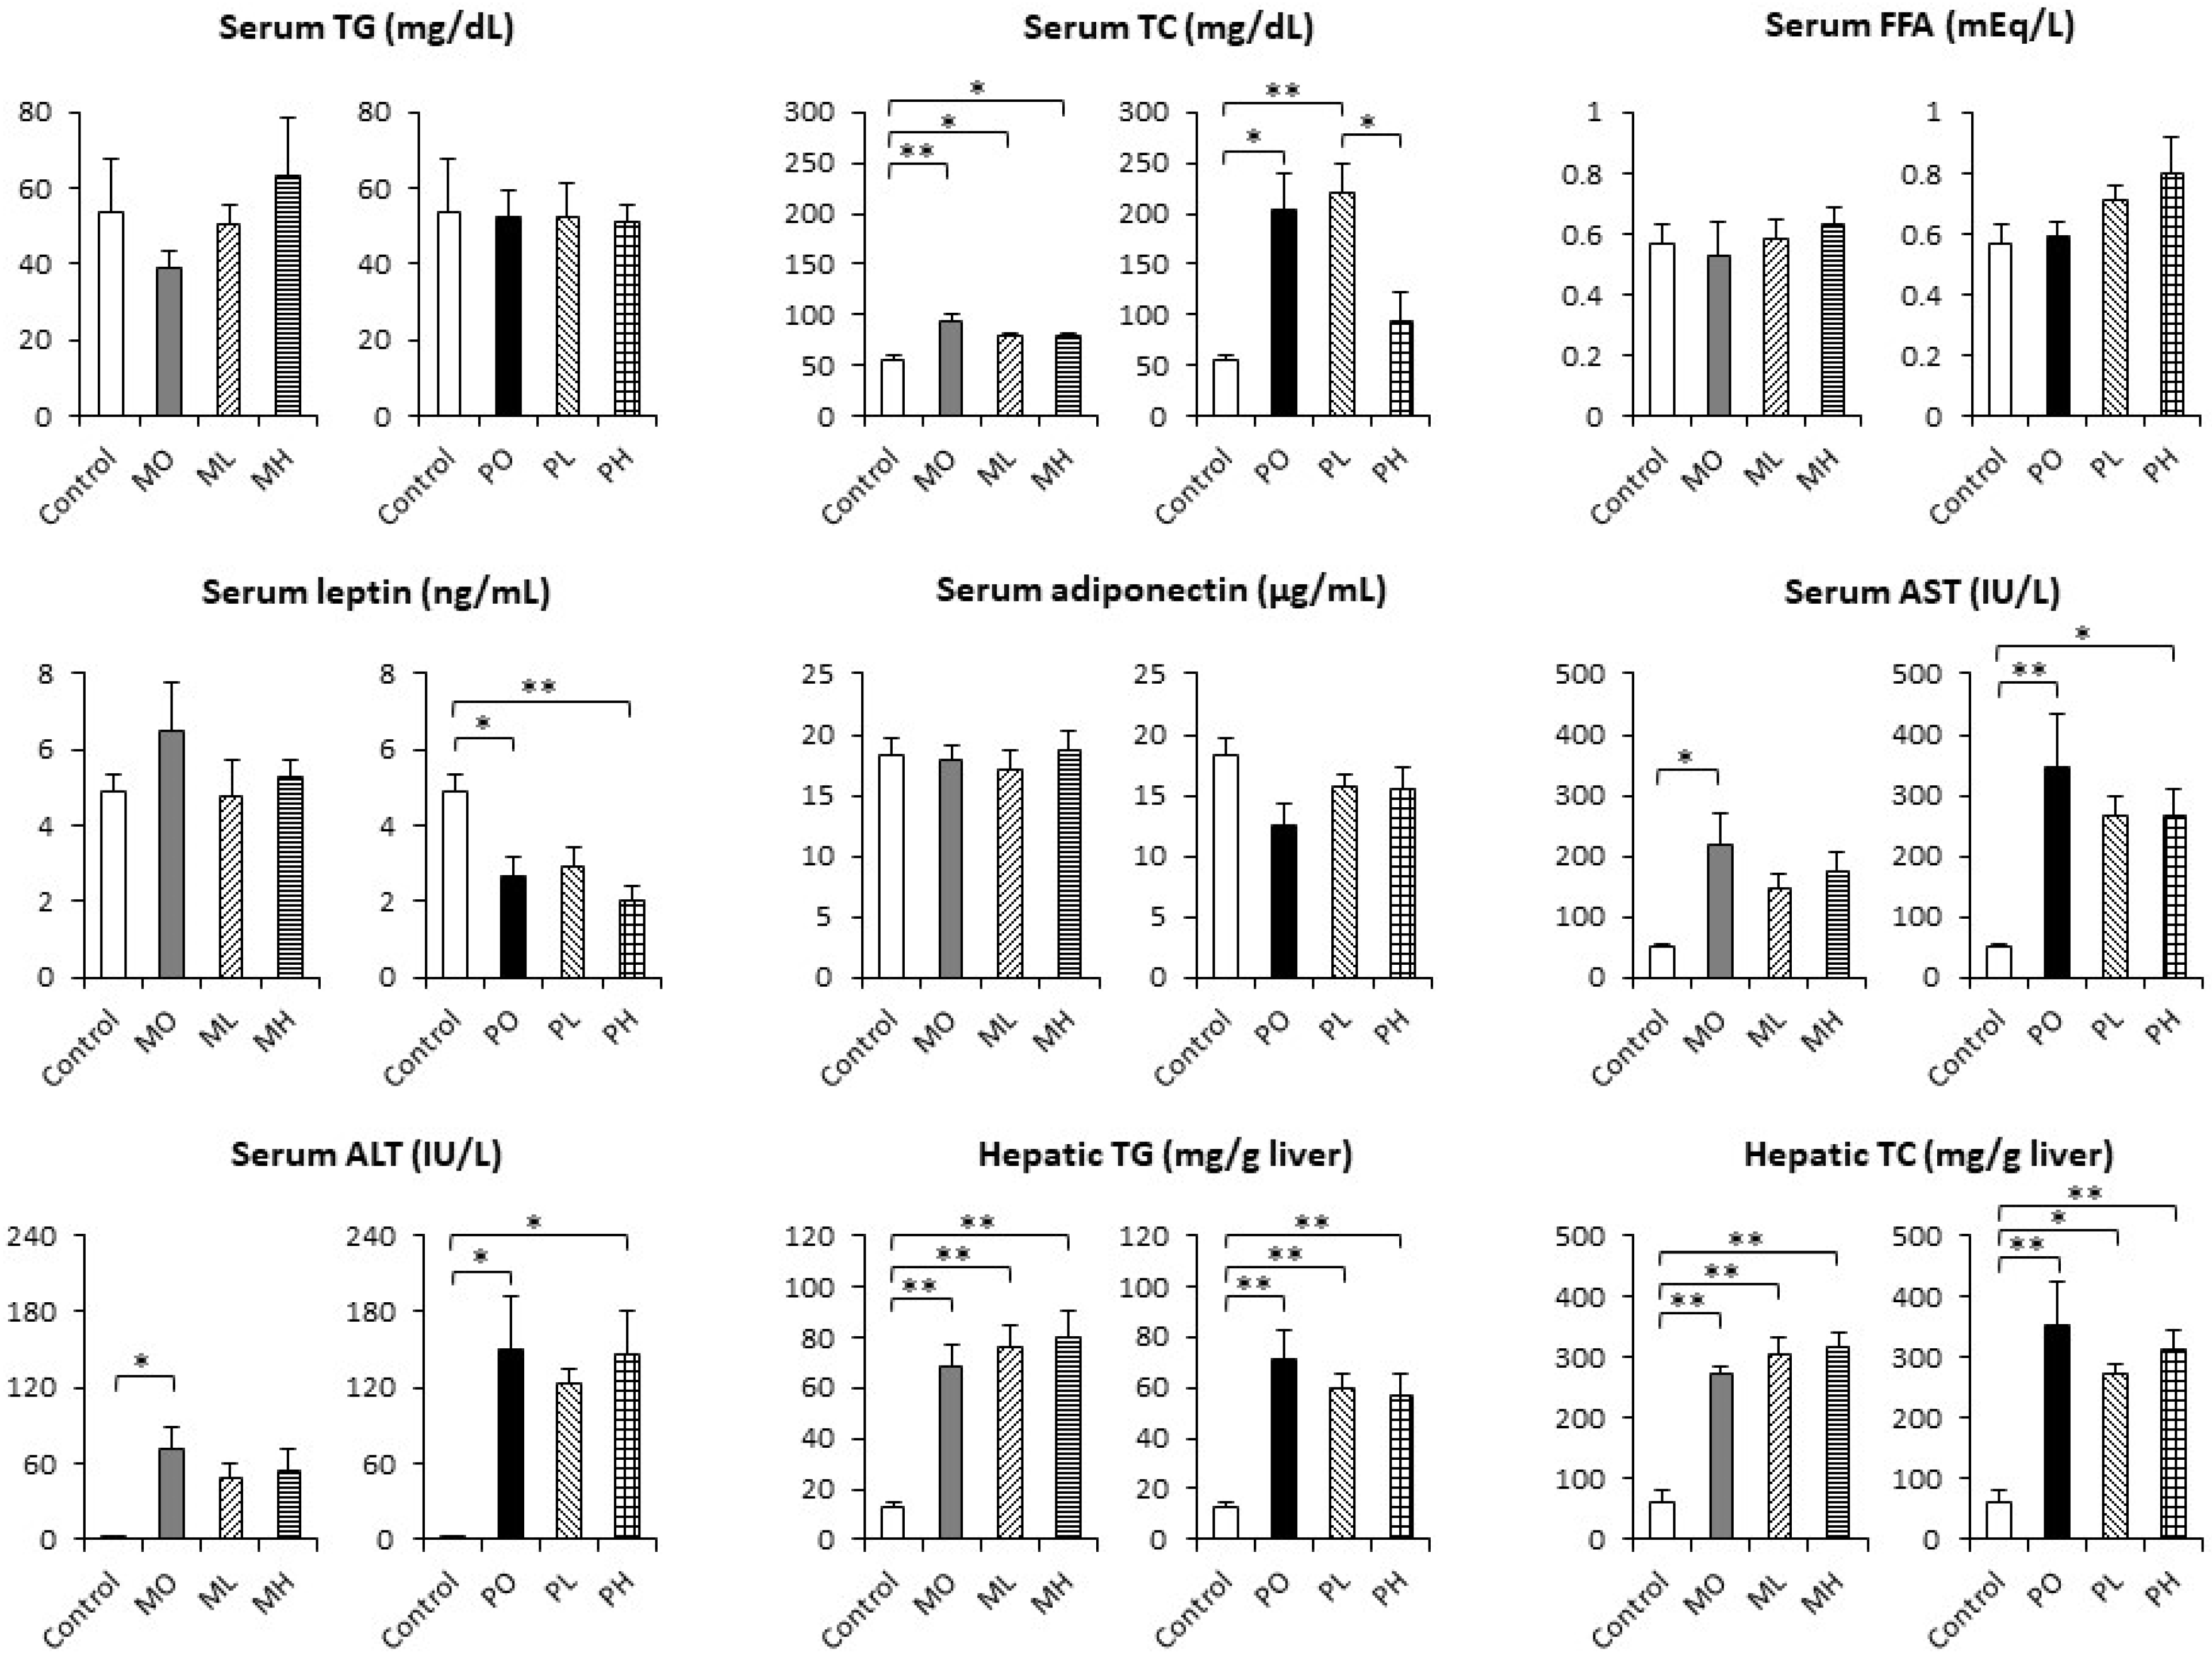
3.2. Serum Biochemical Parameters and Hepatic Lipid Concentrations

The serum TG, FFA, leptin, and adiponectin levels did not differ significantly among the control, MO, ML, and MH groups. The serum AST and ALT levels were significantly higher in the MO group than in the control group (p = 0.020 and p = 0.016, respectively). The serum TC level was significantly higher in the MO, ML, and MH groups than in the control group (p < 0.001, p = 0.029, and p = 0.015, respectively). The hepatic TG and TC concentrations were also significantly higher in the MO, ML, and MH groups than in the control group (p < 0.001 each). Overall, there were no significant differences among the MO, ML, and MH groups in these serum biochemical parameters and hepatic lipid concentrations. Among the control, PO, PL, and PH groups, the serum TG, FFA, and adiponectin levels did not differ significantly. The serum TC level was significantly higher in the PO and PL groups than in the control group (p = 0.010 and p = 0.004, respectively), and was significantly lower in the PH group than in the PL group (p = 0.024). The serum leptin level was significantly lower in the PO and PH groups than in the control group (p = 0.019 and p = 0.002, respectively). The serum AST and ALT levels were significantly higher in the PO and PH groups than in the control group (p = 0.005 and p = 0.044, respectively, for the serum AST; p = 0.014 and p = 0.013, respectively, for the serum ALT). The hepatic TG and TC concentrations were significantly higher in the PO, PL, and PH groups than in the control group (p < 0.001, p = 0.004, and p = 0.004, respectively, for the hepatic TG; p < 0.001, p = 0.014, and p = 0.002, respectively, for the hepatic TC). Overall, there were no significant differences among the PO, PL, and PH groups in these serum biochemical parameters and hepatic lipid concentrations, except for the serum TC level between the PL and PH groups (Figure 2).

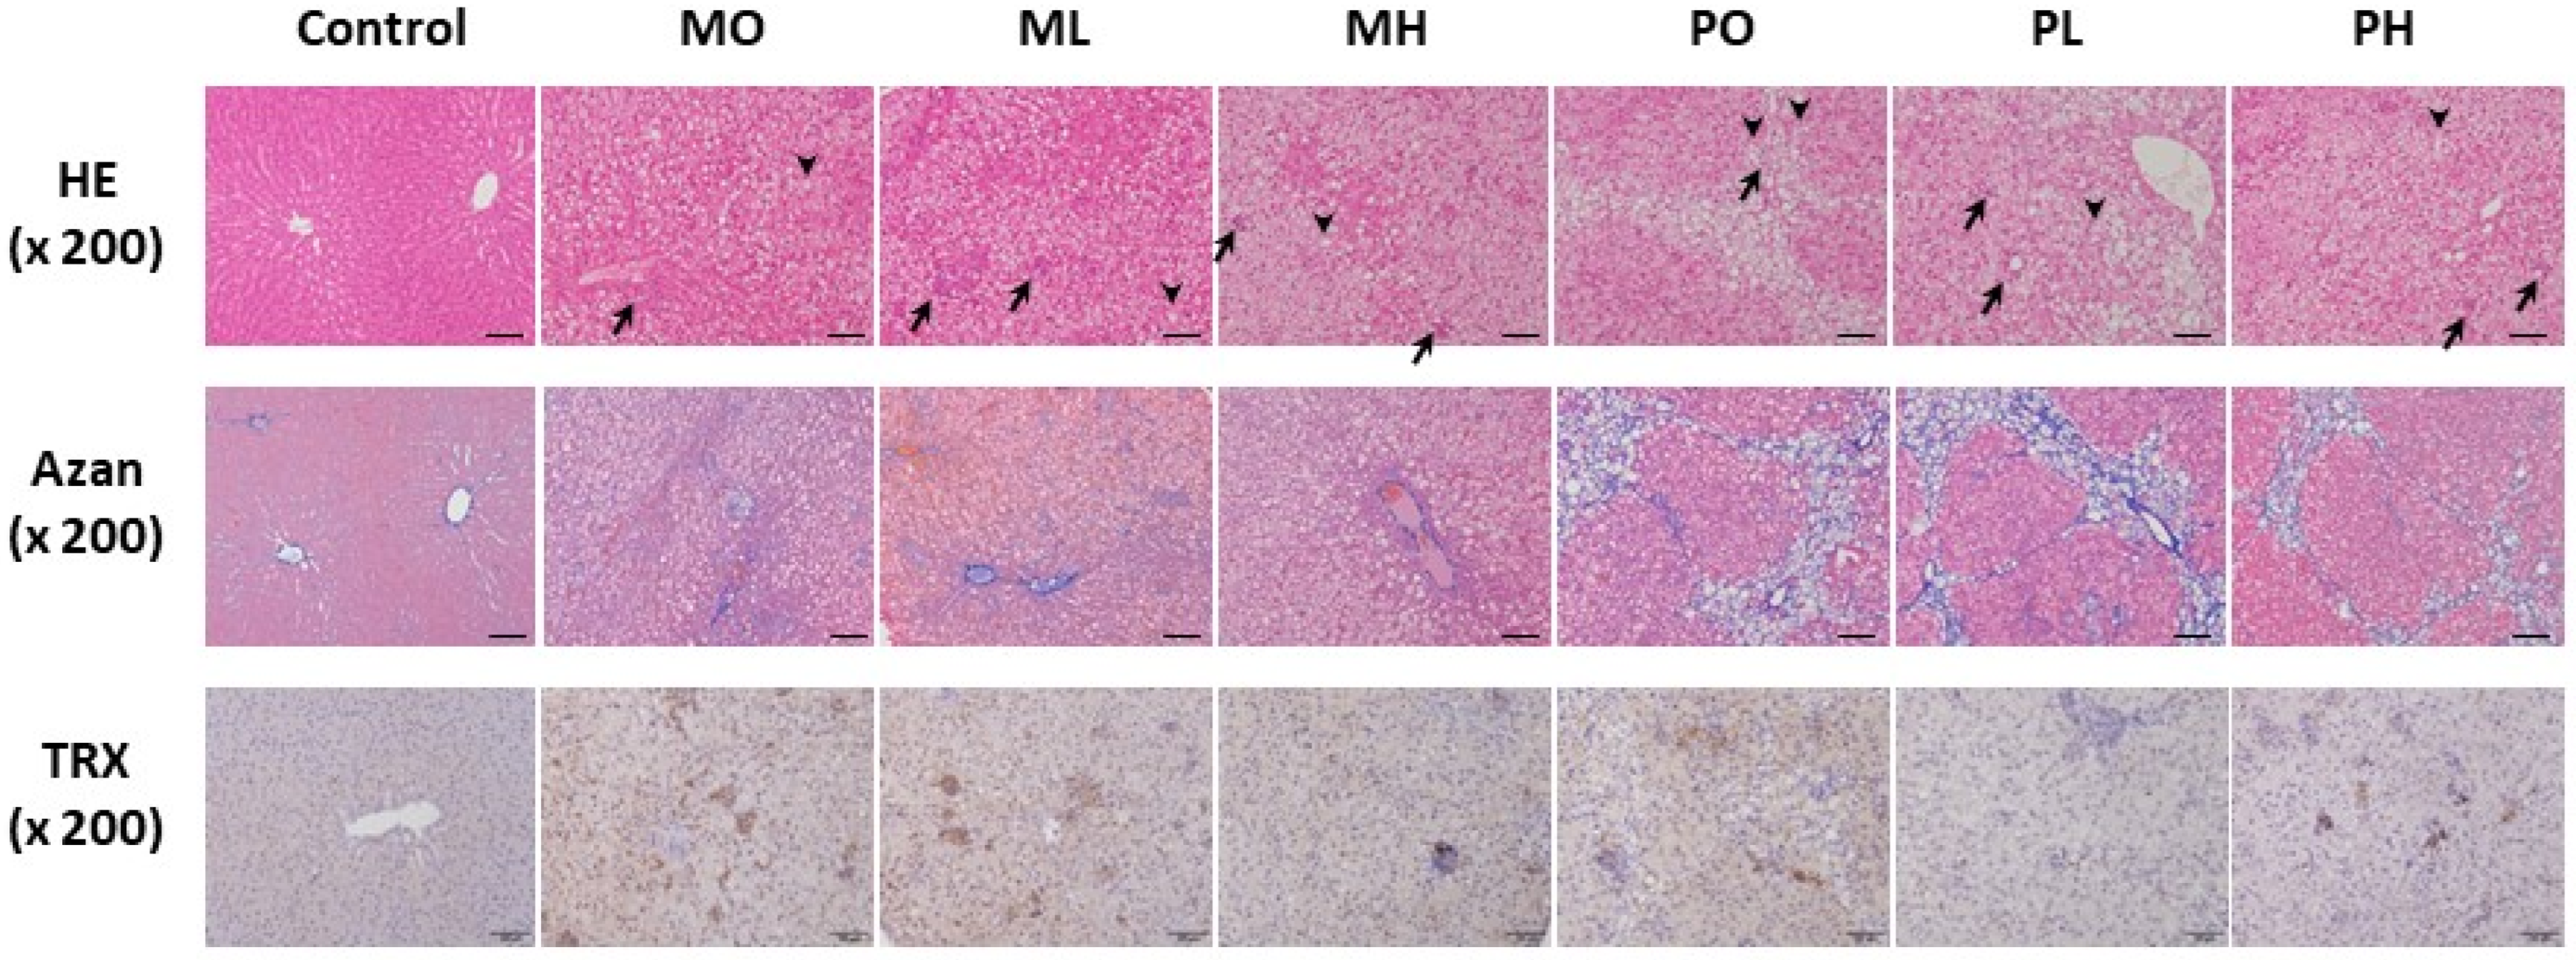
3.3. Histopathological Findings of the Liver

Table 3 shows the liver assessments according to the NASH Clinical Research Network Scoring System [21] and the immunohistochemical assessments of TRX staining. Figure 3 shows representative histopathological images of rat livers from the control, MO, ML, MH, PO, PL, and PH groups. No obvious findings of hepatic steatosis, lobular inflammation, hepatocyte ballooning, or fibrosis were seen in any of the five rats in the control group, and all of them showed score 1 TRX staining. Severe steatosis (score 3) was observed in 31 of the 32 rats in the MO, ML, MH, PO, PL, and PH groups; in the remaining rat that was in the ML group, moderate steatosis (score 2) was observed. Moderate to severe lobular inflammation (score 2 or 3) was observed in 27 (84.4%) of the 32 rats in the MO, ML, MH, PO, PL, and PH groups; among the remaining 5 rats, mild lobular inflammation (score 1) was observed in 1 (20%) of the 5 rats in the PL group, and in 4 (66.7%) of the 6 rats in the PH group. Lobular inflammation score was significantly lower in the PH group than in the PO group (p = 0.046). In the MO, ML, PO, and PL groups, a few ballooned hepatocytes (score 1) or many ballooned hepatocytes (score 2) were observed in two or three rats (40% or 60%) of the five rats in each group. In contrast, a few ballooned hepatocytes (score 1) or many ballooned hepatocytes (score 2) were observed in only one (16.7%) of the six rats in each of the MH and PH groups. As a result, all five rats in the control group had an NAS of 0 (not diagnostic for NASH), and all 10 rats in the MO and PO groups had an NAS of 5 to 8 (diagnostic for NASH). All 11 rats in the ML and MH groups also had an NAS of 5 to 7 (diagnostic for NASH). In contrast, four (80%) of the five rats in the PL group and two (33.3%) of the six rats in the PH group had an NAS of 6 to 8 (diagnostic for NASH); the remaining one (20%) rat in the PL group and four (66.7%) rats in the PH group had an NAS of 4, which indicated borderline NASH, and they were not diagnosed with definite NASH. The rats that were diagnosed with definite NASH were significantly fewer in the PH group than in the PO group (p = 0.022). Score 1 or 2 hepatic fibrosis was seen in all five rats in the MO group. In the ML and MH groups, 6 (54.5%) of the 11 rats had score 1 or 2 hepatic fibrosis, and no hepatic fibrosis was observed among the remaining 5 rats (2 rats in the ML group, and 3 rats in the MH group). Bridging fibrosis or cirrhosis was observed in four (80%) of the five rats in the PO group, three (60%) of five the rats in the PL group, and four (66.7%) of the six rats in the PH group. In the TRX immunohistochemical analysis, apparent positive staining (score 3 or 4) was observed in two (40%) of the five rats in the MO group, two (40%) of the five rats in the ML group, none (0%) of the six rats in the MH group, four (0%) of the five rats in the PO group, three (60%) of the five rats in the PL group, and five (83.3%) of the six rats in the PH group.

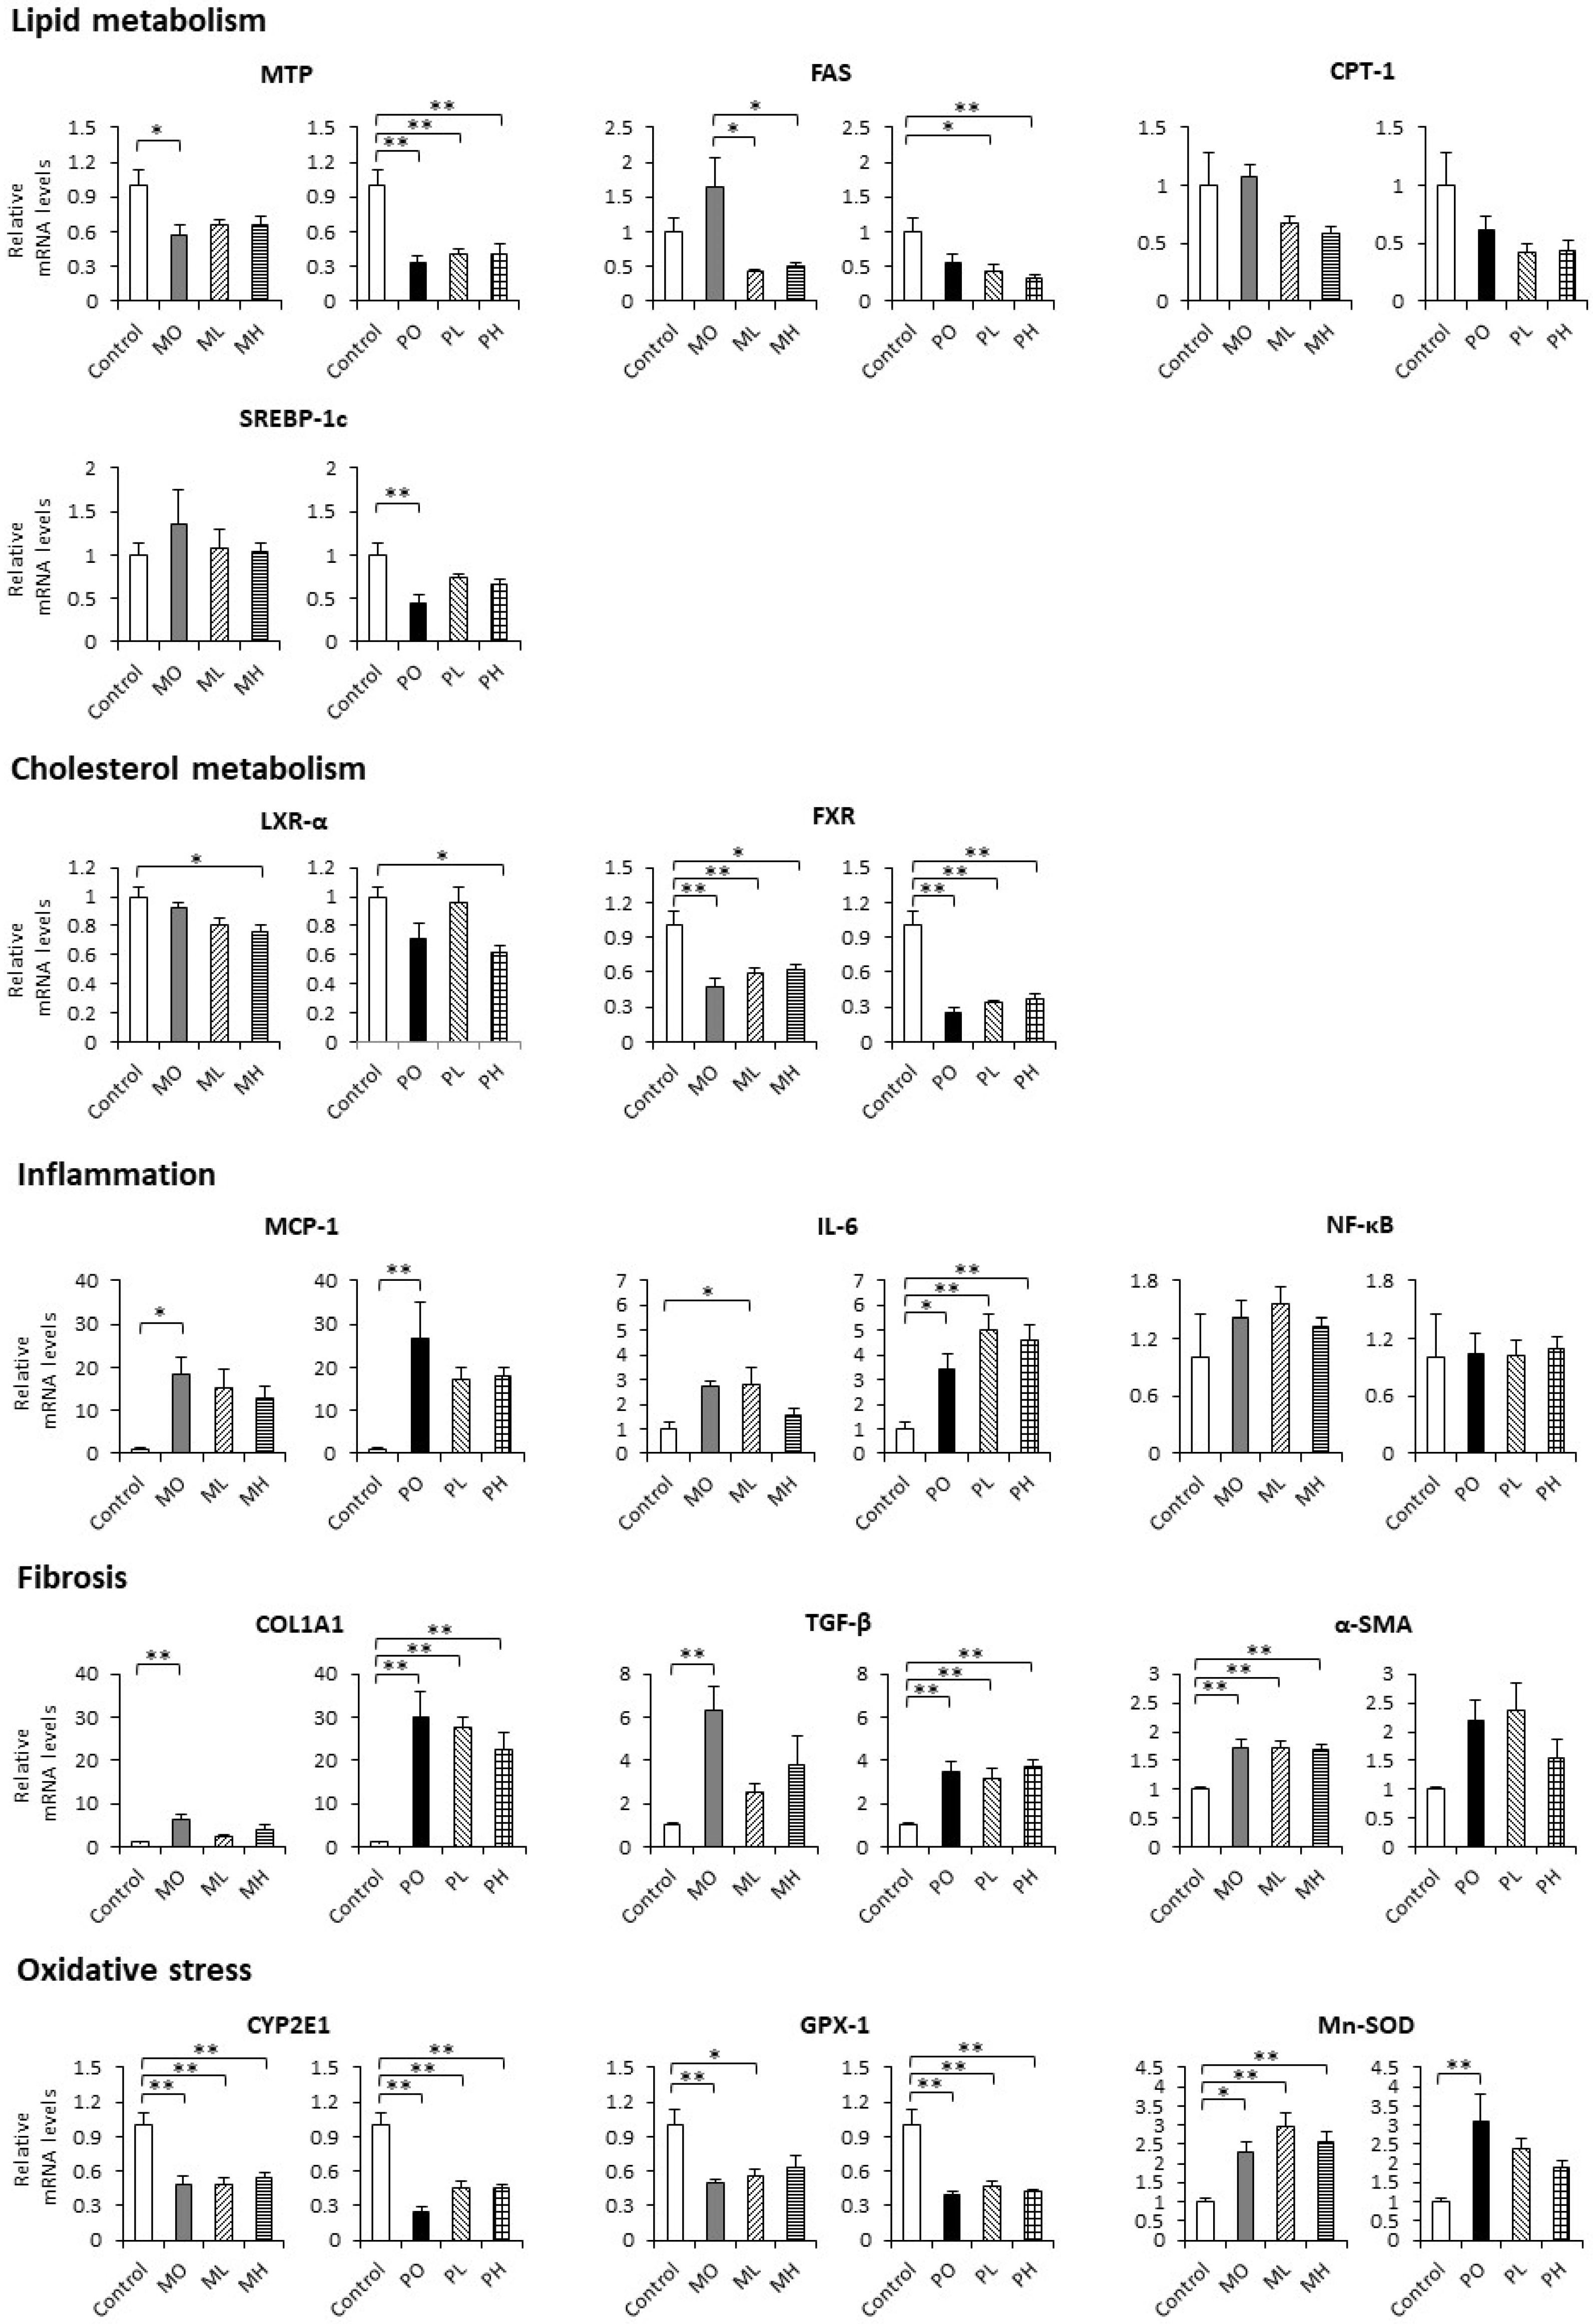
3.4. Hepatic mRNA Expression
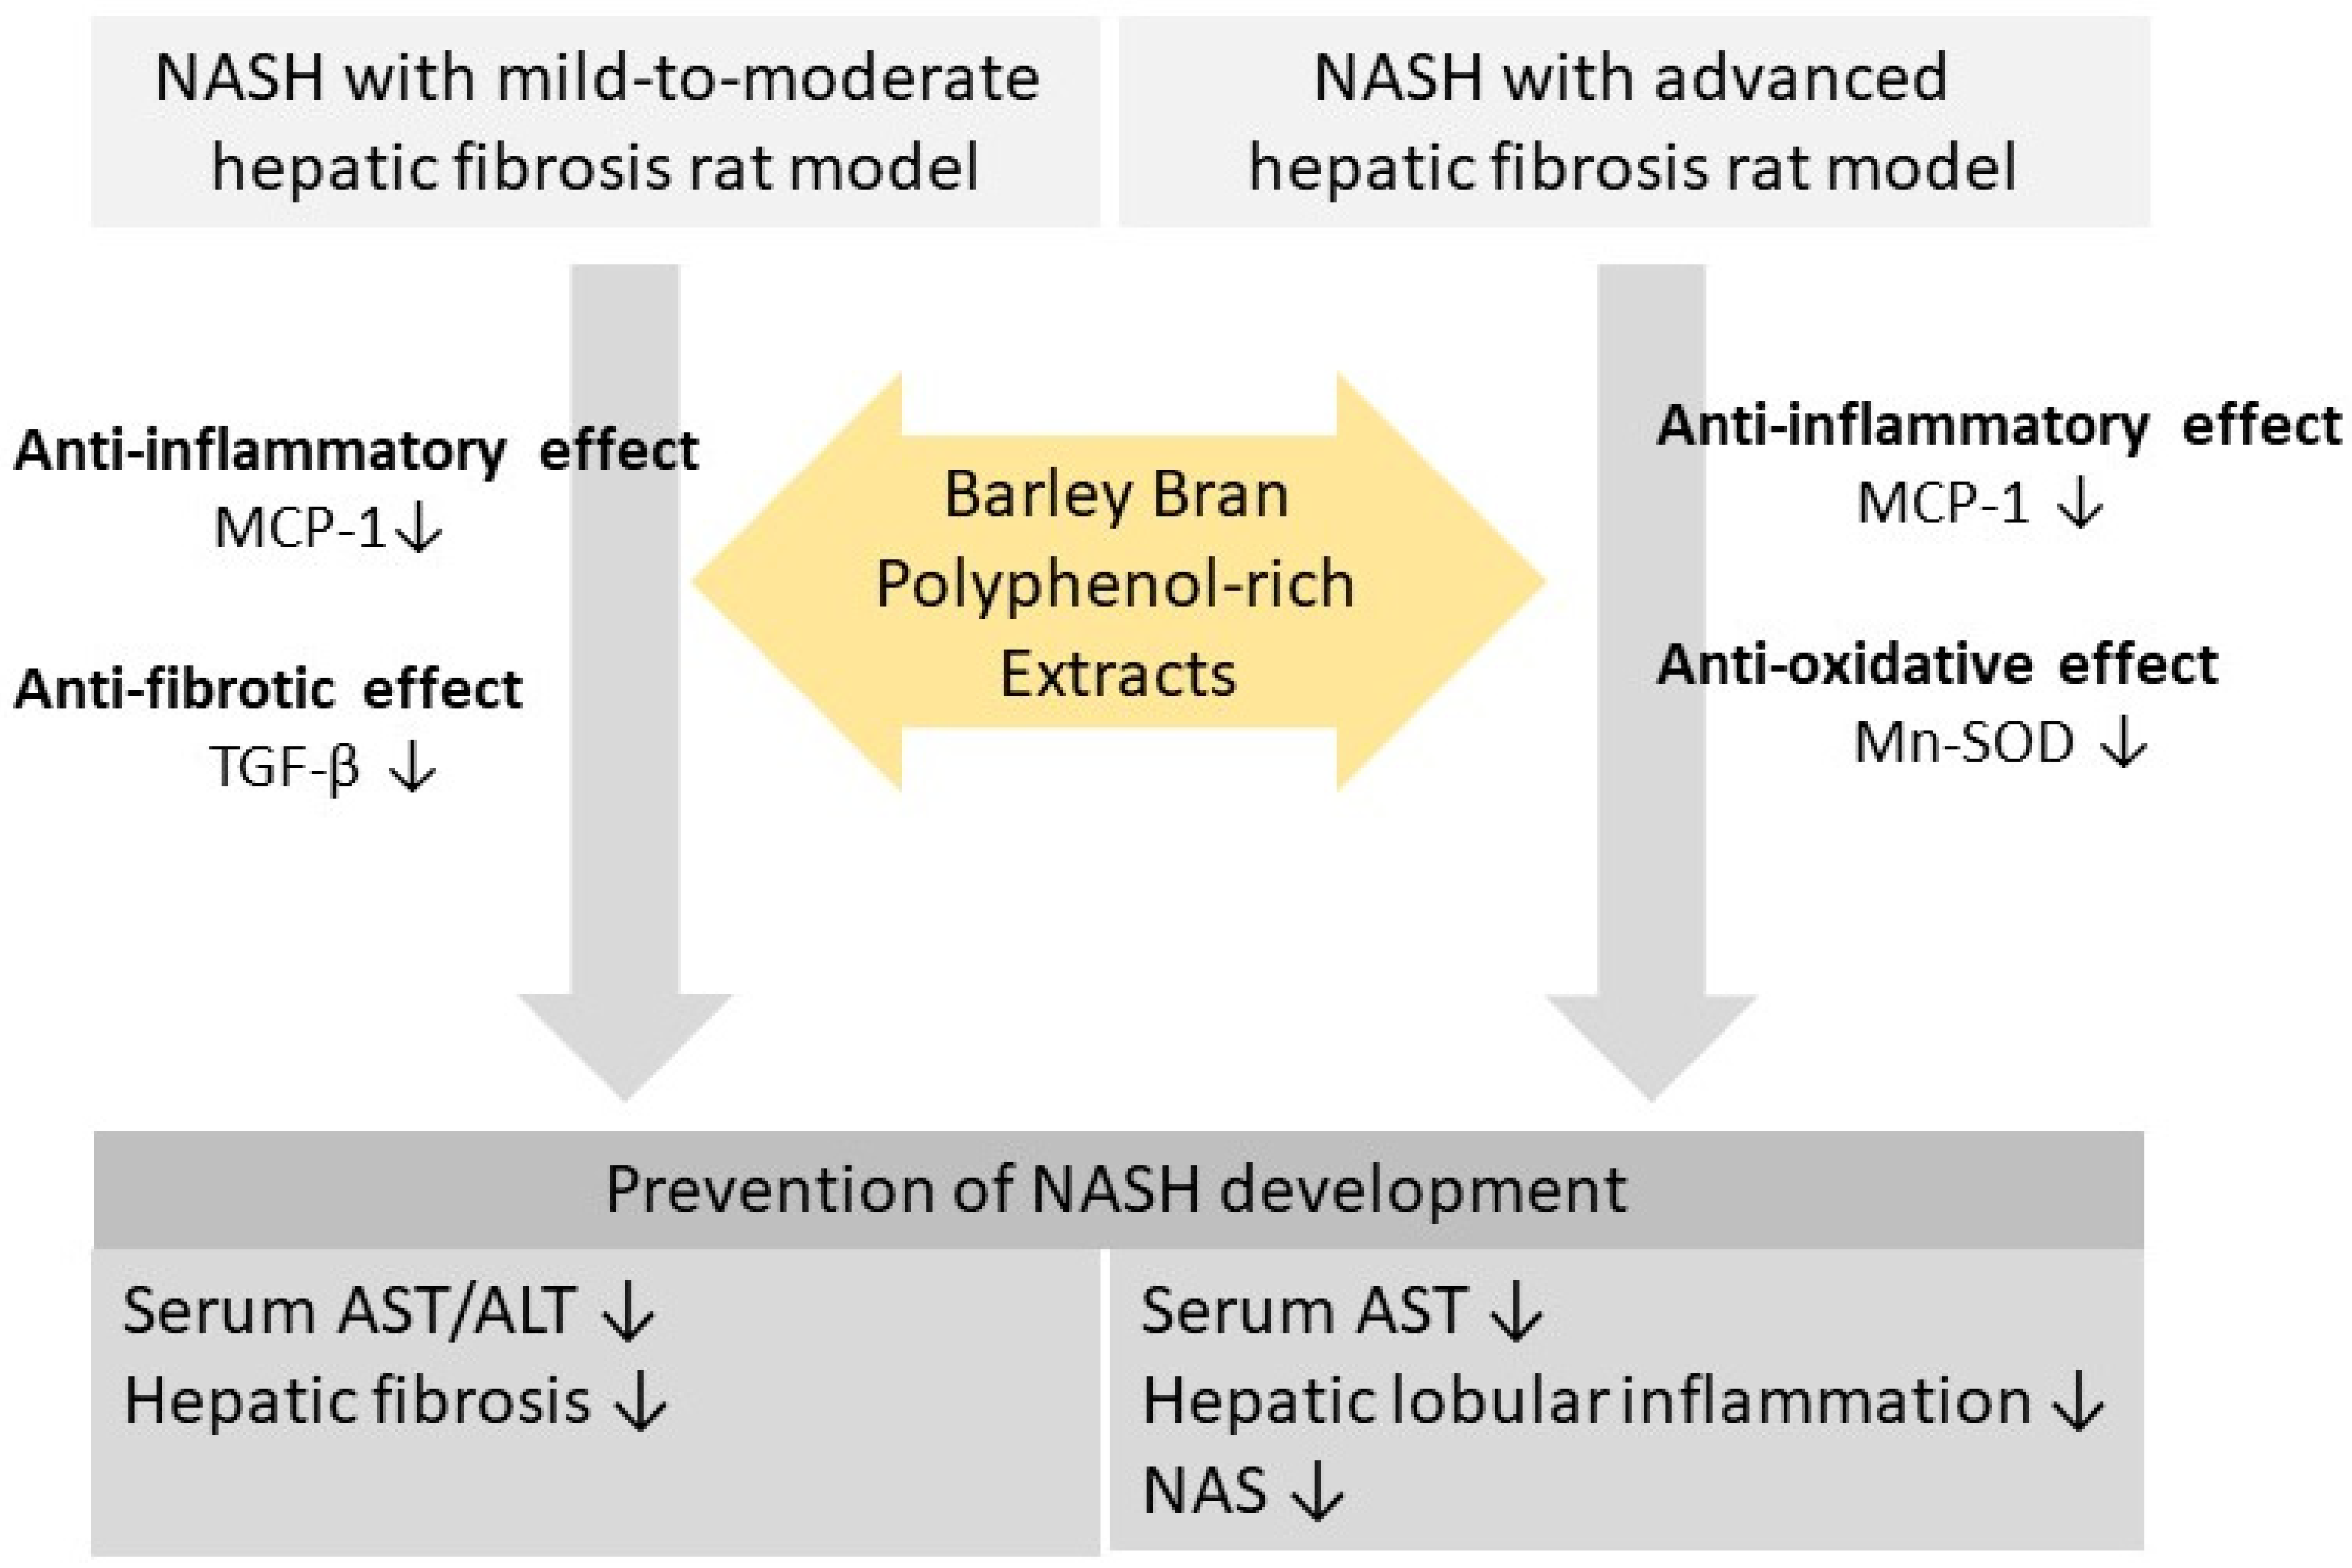
The level of mRNA encoding MTP (Mttp), which is involved in lipid metabolism, was significantly lower in the MO group than in the control group (p = 0.025), and it was also significantly lower in the PO, PL, and PH groups than in the control group (p < 0.001, p = 0.002, and p = 0.002, respectively). Regarding the levels of mRNA encoding FAS (Fasn), CPT-1 (Cpt1a), and SREBP-1c (Srebf1), which are also involved in lipid metabolism, the MO and PO groups showed inconsistent results in comparison to the control group. However, the levels of mRNA encoding FAS (Fasn) and CPT-1 (Cpt1a) were lower in the ML and MH groups than in the MO group, and these levels were also lower in the PL and PH groups than in the PO group, but not always at a statistically significant level. The level of mRNA encoding LXR-α (Nr1h3), which is involved in cholesterol metabolism, was significantly lower in the MH group than in the control group (p = 0.012), and it was also significantly lower in the PH group than in the control group (p = 0.028). The level of mRNA encoding FXR (Nr1h4), which is also involved in cholesterol metabolism, was significantly lower in the MO, ML, and MH groups than in the control group (p = 0.001, p = 0.009, and p = 0.010, respectively), and it was also significantly lower in the PO, PL, and PH groups than in the control group (p < 0.001 each). The level of mRNA encoding MCP-1 (Ccl2), which is involved in inflammation, was significantly higher in the MO group than in the control group (p = 0.016), and it was also significantly higher in the PO group than in the control group (p = 0.006). The level of mRNA encoding IL-6 (Il6), which is also involved in inflammation, was significantly higher in the ML group than in the control group (p = 0.041), and it was also significantly higher in the PO, PL, and PH groups than in the control group (p = 0.035, p < 0.001, and p < 0.001, respectively). The levels of mRNA encoding COL1A1 (Col1a1) and TGF-β (Tgfb1), which are responsible for fibrogenesis, were significantly higher in the MO group than in the control group (p = 0.008 each), and they were also significantly higher in the PO, PL, and PH groups than in the control group (p < 0.001, p < 0.001, and p = 0.005, respectively, for COL1A1; p < 0.001, p = 0.003, and p < 0.001, respectively, for TGF-β). The level of mRNA encoding α-SMA (Acta2), which is also responsible for fibrogenesis, was significantly higher in the MO, ML, and MH groups than in the control group (p = 0.002 each). The level of mRNA encoding CYP2E1 (Cyp2e1), which is a marker of oxidative stress, was significantly lower in the MO, ML, and MH groups than in the control group (p < 0.001 each), and it was also significantly lower in the PO, PL, and PH groups than in the control group (p < 0.001 each). The level of mRNA encoding GPX-1 (Gpx1), which is also a marker of oxidative stress, was significantly lower in the MO and ML groups than in the control group (p = 0.008 and p = 0.024, respectively), and it was also significantly lower in the PO, PL, and PH groups than in the control group (p < 0.001 each). The level of mRNA encoding Mn-SOD (Sod2), which is also a marker of oxidative stress, was significantly higher in the MO, ML, and MH groups than in the control group (p = 0.024, p < 0.001, and p = 0.004, respectively), and it was also significantly higher in the PO group than in the control group (p = 0.006). Overall, there were no significant differences among the MO, ML, and MH groups, or among the PO, PL, and PH groups in these hepatic mRNA expression levels (Figure 4).

4. Discussion

Barley contains more bioactive components than wheat, and these physiologically active substances including β-glucan, arabinoxylans, phenols, anthocyanins, flavonoids, and selenium in barley are expected to confer anti-inflammatory and anti-atherosclerotic effects [8,23]. Most anthocyanins (anthocyanidins with sugar moieties) are localized in the outer parts of grains and are distributed with bran during the pearling process [24]. In the present study, barley was ground with a stamping machine, and we obtained the polyphenol-rich fraction of the outer layer of bran (the BP) with a 90–98% (w/w) yield ratio. The major polyphenols in barley are proanthocyanidins, which are high molecular weight polymers or complex flavan-3-ol polymers that consist mainly of catechins and epicatechins. Proanthocyanidins have a wide range of health benefits, including anti-oxidant, anti-bacterial, anti-viral, anti-carcinogenic, anti-inflammatory, anti-allergic, and vasodilatory actions [16,25,26]. Procyanidins (PAs) are members of the proanthocyanidin class of flavonoids [27]. Barley is rich in polyphenols such as PAs, which are the oligomeric or polymeric forms of catechin and epicatechin [28,29,30]. Phenolic compounds are important bioactive substances since they have strong anti-oxidant activities, which can reduce the risk of cardiovascular disease, glucose intolerance, obesity, and cancer, and slow the aging process [31,32,33].
In the present study, BP did not have a lowering effect on the body weight gain, cumulative energy intake, food efficacy, or relative organ weights. Also, there were no significant differences among the PO, PL, and PH groups in the serum biochemical parameters and hepatic lipid concentrations, except for the serum TC level between the PL and PH groups. However, the final body weight, food efficacy, and epididymal fat pad weight-to-body weight ratio were lowest in the PH group. This suggests that a high dose of BP may have a lowering effect on these parameters in advanced NASH. In addition, high-dose BP tended to suppress the serum AST level, and low-dose BP tended to suppress the serum AST and ALT levels, although there were no significant differences. Histopathologically, BP did not have a reducing effect on hepatic steatosis, but high-dose BP significantly reduced lobular inflammation score in advanced NASH, and as a result, the rats that were diagnosed with definite NASH were significantly fewer in the PH group than in the PO group. These results suggest that high-dose BP prevented NASH development by ameliorating the histopathological findings of lobular inflammation in the rat model of NASH with advanced hepatic fibrosis. The BP may also attenuate serum AST level in this model. In the rat model of NASH with mild-to-moderate hepatic fibrosis, BP may attenuate the serum levels of transaminases, although there were no significant differences.
Regarding the hepatic mRNA expression levels of genes involved in inflammation, BP may have a reducing effect on the gene expression of MCP-1, which is a chemokine that regulates the migration and infiltration of monocytes/macrophages—in the MO, ML, and MH groups as well as the PO, PL, and PH groups—although the differences were not statistically significant. NASH is characterized by the presence of inflammatory cells in the liver including monocyte-derived macrophages. These macrophages may be attributed by increased expression of MCP-1. Indeed, serum MCP-1 is associated with NASH severity and the risk of progression to cirrhosis [34]. Therefore, MCP-1 attenuation is one of the possible properties of BP, which ameliorates the histopathological findings of lobular inflammation and serum levels of transaminases.
BP may also have a reducing effect on the gene expression of TGF-β in the MO, ML, and MH groups, although the differences were not statistically significant. TGF-β signaling participates in fibrogenic response through hepatic stellate cell activation. In NASH, this signaling plays an important role in the progression of fibrosis [35]. Therefore, BP can ameliorate the histopathological severity of fibrosis by reducing the gene expression of TGF-β in the rat model of NASH with mild-to-moderate hepatic fibrosis.
Oxidative stress causes NASH liver injury [36]. The activity of Mn-SOD, which is a member of the iron/manganese superoxide dismutase family for scavenging reactive oxygen species, has been reported to be impaired in NAFLD in several studies. However, other studies described raised levels of this enzyme in NAFLD. These discrepant results may be due to a response to increased reactive oxygen species [37]. In the present study, BP may have a reducing effect on the gene expression of Mn-SOD in the rat model of NASH with advanced hepatic fibrosis, although the differences were not statistically significant. Yang et al. reported that procyanidin B2 (PA-B2) significantly decreased the histopathological hepatic abnormalities in a mouse model of CCL4-induced hepatic injury, and they concluded that PA-B2 had a protective effect on hepatic injury by elevating the anti-oxidative defense potential, and consequently suppressing the inflammatory response of liver tissue [38]. Guan et al. also demonstrated the potential beneficial effects of fermented black barley on ameliorating oxidative stress in SD rats that were fed a high-fat diet for 12 weeks [26]. Our results are in line with these observations; BP may have a protective effect on NASH liver injury due to its anti-inflammatory and anti-oxidative properties.
There were several limitations to the present study. First, there was no positive control group of rats fed a drug or phytoproduct with hepatoprotective and anti-oxidant properties. Because there are currently no approved drugs or phytoproducts for NASH treatment, it would be difficult to make strict comparison between BP and other known hepatoprotective or anti-oxidant agents. Second, the BP prepared is crude, and therefore, the exact amounts of the effective ingredients, such as proanthocyanidins and PAs, included in the BP were not confirmed. Proanthocyanidin has been reported to have extremely low bioavailability due to its chemical instability in gastrointestinal fluids [16]. In addition, PAs are classified into monomers, dimers, trimers, or tetramers, according to the degree of polymerization (DP). PAs with a DP > 4 are considered to be oligomers, and those with a DP > 10 are considered to be polymers. Although PA polymers and oligomers are not directly absorbed in vivo, it has been reported that small amounts of methylated and glucuronidated PA monomers and dimers can be detected in plasma [39]. Therefore, further studies are necessary to clarify which chemical compound in BP has a beneficial effect against NASH. Third, we did not examine the serum glucose levels, insulin levels, and insulin resistance in the present study, because our NASH model rats (the MO and PO groups) did not show any glucose metabolism abnormality, including insulin resistance [17]. In addition, anesthesia with isoflurane can raise the serum glucose level [40]. A better method of anesthesia or euthanasia by decapitation, which does not affect blood glucose metabolism, should be used in future studies.
In conclusion, there is no significant difference among MO, ML, and MH groups and among PO, PL, and PH groups in almost all tested parameters in the present study. However, in the rat model of NASH with advanced hepatic fibrosis, high-dose BP prevented NASH development by ameliorating the histopathological findings of lobular inflammation. Also, BP tended to attenuate serum aspartate aminotransferase level in this model. In the rat model of NASH with mild-to-moderate hepatic fibrosis, BP tended to attenuate the serum levels of transaminases and ameliorated hepatic fibrosis, although there were no statistical differences. Also, BP-dose-dependent effects were revealed for several parameters, including MCP-1, TGF-β, and Mn-SOD gene expressions in the liver, although there were no statistical differences. Therefore, BP may prevent NASH development or progression, presumably due to its anti-inflammatory and anti-oxidative properties (Figure 5).

Author Contributions

Conceptualization and original draft preparation, K.O.; methodology and formal analysis, J.I., K.M., R.A. and M.Y.; investigation, J.I., K.M., M.Y., B.S. and N.S.; PCR experiments for mRNA expression and data interpretation, K.S.; interpretation of the data and review of original draft, K.K.; histopathological assessments and data validation, M.I.-S. and K.T. All authors have read and agreed to the published version of the manuscript.

Funding

This research received no external funding.

Institutional Review Board Statement

The Animal Use Committee of the University of Nagasaki approved the experimental protocol; the approval number is R04-12.

Informed Consent Statement

Not applicable.

Data Availability Statement

All data are presented in this manuscript.

Acknowledgments

The authors thank Seiichiro Ito, Ito Barley Processing Co., Ltd., Isahaya city, Nagasaki, Japan and Hideki Ito, Research and Development Support Office, PIIF The Foundation of Encourage Nagasaki Industry, Nagasaki city, Nagasaki, Japan, for preparing and providing BP and for their helpful advice.

Conflicts of Interest

The authors declare no conflicts of interest.

References

  1. Henry, L.; Paik, J.; Younossi, Z.M. Review article: The epidemiologic burden of non-alcoholic fatty liver disease across the world. Aliment. Pharmacol. Ther. 2022, 56, 942–956. [Google Scholar] [CrossRef] [PubMed]
  2. Rinella, M.E.; Lazarus, J.V.; Ratziu, V.; Francque, S.M.; Sanyal, A.J.; Kanwal, F.; Romero, D.; Abdelmalek, M.F.; Anstee, Q.M.; Arab, J.P.; et al. A multisociety Delphi consensus statement on new fatty liver disease nomenclature. J. Hepatol. 2023, 79, 1542–1556. [Google Scholar] [CrossRef]
  3. Powell, E.E.; Wong, V.W.-S.; Rinella, M. Non-alcoholic fatty liver disease. Lancet 2019, 397, 2212–2224. [Google Scholar] [CrossRef] [PubMed]
  4. Day, C.P.; James, O.F.W. Steatohepatitis: A tale of two “hits”? Gastroenterology 1998, 114, 842–845. [Google Scholar] [CrossRef] [PubMed]
  5. Tilg, H.; Moschen, A.R. Evolution of inflammation in nonalcoholic fatty liver disease: The multiple parallel hits hypothesis. Hepatology 2010, 52, 1836–1846. [Google Scholar] [CrossRef] [PubMed]
  6. Harrison, S.A.; Allen, A.M.; Dubourg, J.; Noureddin, M.; Alkhouri, N. Challenges and opportunities in NASH drug development. Nat. Med. 2023, 29, 562–573. [Google Scholar] [CrossRef] [PubMed]
  7. Badr, A.; Muller, K.; Schafer-Pregl, R.; El Rabey, H.; Effgen, S.; Ibrahim, H.H.; Pozzi, C.; Rohde, W.; Salamini, F. On the origin and domestication history of barley (Hordeum vulgare). Mol. Biol. Evol. 2000, 17, 499–510. [Google Scholar] [CrossRef] [PubMed]
  8. Byun, A.R.; Chun, H.; Lee, J.; Lee, S.W.; Lee, H.S.; Shim, K.W. Effects of a dietary supplement with barley sprout extract on blood cholesterol metabolism. Evid. Based Complement. Alternat. Med. 2015, 2015, 473056. [Google Scholar] [CrossRef]
  9. El-Sayyad, H.I.H.; El-Shershaby, E.M.F.; El-Mansi, A.A.; El-Ashry, N. Anti-hypercholesterolemic impacts of barley and date palm fruits on the ovary of Wistar albino rats and their offspring. Reprod. Biol. 2018, 18, 236–251. [Google Scholar] [CrossRef]
  10. Ishiyama, S.; Kimura, M.; Umihira, N.; Matsumoto, S.; Takahashi, A.; Nakagawa, T.; Wakayama, T.; Kishigami, S.; Mochizuki, K. Consumption of barley ameliorates the diabetic steatohepatitis and reduces the high transforming growth factor β expression in mice grown in α-minimum essential medium in vitro as embryos. Biochem. Biophys. Rep. 2021, 27, 101029. [Google Scholar] [CrossRef]
  11. Zhu, C.; Guan, Q.; Song, C.; Zhong, L.; Ding, X.; Zeng, H.; Nie, P.; Song, L. Regulatory effects of Lactobacillus fermented black barley on intestinal microbiota of NAFLD rats. Food Res. Int. 2021, 147, 110467. [Google Scholar] [CrossRef]
  12. Zhao, C.-Z.; Jiang, W.; Zhu, Y.-Y.; Wang, C.-Z.; Zhong, W.-H.; Wu, G.; Chen, J.; Zhu, M.-N.; Wu, Q.-L.; Du, X.-L.; et al. Highland barley Monascus purpureus Went extract ameliorates high-fat, high-fructose, high-cholesterol diet induced nonalcoholic fatty liver disease by regulating lipid metabolism in golden hamsters. J. Ethnopharmacol. 2022, 286, 114922. [Google Scholar] [CrossRef]
  13. Liu, H.; Sun, Y.; Nie, C.; Xie, X.; Yuan, X.; Ma, Q.; Zhang, M.; Chen, Z.; Hu, X.; Li, J. Highland barley β-glucan alleviated western diet-induced non-alcoholic fatty liver disease via increasing energy expenditure and regulating bile acid metabolism in mice. Food Funct. 2022, 13, 11664–11675. [Google Scholar] [CrossRef] [PubMed]
  14. Esfandi, R.; Walters, M.E.; Tsopmo, A. Antioxidant properties and potential mechanisms of hydrolyzed proteins and peptides from cereals. Heliyon 2019, 5, e01538. [Google Scholar] [CrossRef] [PubMed]
  15. Zhao, Y.-S.; Tong, X.-M.; Wu, X.-M.; Bai, J.; Fan, S.-T.; Zhu, Y.; Zhang, J.-Y.; Xiao, X. Metabolomics reveal the regulatory effect of polysaccharides from fermented barley bran extract on lipid accumulation in HepG2 cells. Metabolites 2023, 13, 223. [Google Scholar] [CrossRef] [PubMed]
  16. Li, J.; Zhang, X.; Zhou, W.; Tu, Z.; Yang, X.; Hao, J.; Liang, F.; Chen, Z.; Du, Y. Impacts of proanthocyanidin binding on conformational and functional properties of decolorized highland barley protein. Foods 2023, 12, 481. [Google Scholar] [CrossRef] [PubMed]
  17. Ichimura, M.; Kawase, M.; Masuzumi, M.; Sakaki, M.; Nagata, Y.; Tanaka, K.; Suruga, K.; Tamaru, S.; Kato, S.; Tsuneyama, K.; et al. High-fat and high-cholesterol diet rapidly induces non-alcoholic steatohepatitis with advanced fibrosis in Sprague-Dawley rats. Hepatol. Res. 2015, 45, 458–469. [Google Scholar] [CrossRef]
  18. Omagari, K.; Maruta, A.; Yayama, N.; Yoshida, Y.; Okamoto, K.; Shirouchi, B.; Takeuchi, S.; Suruga, K.; Koba, K.; Ichimura-Shimizu, M.; et al. The effects of overnight fasting duration on glucose and lipid metabolism in a Sprague-Dawley rat model of nonalcoholic steatohepatitis with advanced fibrosis. J. Nutr. Sci. Vitaminol. 2023, 69, 357–369. [Google Scholar] [CrossRef]
  19. Nair, A.B.; Jacob, S. A simple practice guide for dose conversion between animals and human. J. Basic Clin. Pharm. 2016, 7, 27–31. [Google Scholar] [CrossRef]
  20. Folch, J.; Lees, M.; Sloane Stanley, G.H. A simple method for the isolation and purification of total lipids from animal tissues. J. Biol. Chem. 1957, 226, 497–509. [Google Scholar] [CrossRef]
  21. Kleiner, D.E.; Brunt, E.M.; Van Natta, M.; Behling, C.; Contos, M.J.; Cummings, O.W.; Ferrell, L.D.; Liu, Y.-C.; Torbenson, M.S.; Unalp-Arida, A.; et al. Design and validation of a histological scoring system for nonalcoholic fatty liver disease. Hepatology 2005, 41, 1313–1321. [Google Scholar] [CrossRef] [PubMed]
  22. Lu, J.; Holmgren, A. The thioredoxin antioxidant system. Free Radic. Biol. Med. 2014, 66, 75–87. [Google Scholar] [CrossRef] [PubMed]
  23. Xiang, X.; Juan, B.; Li, M.S.; Zhang, J.Y.; Sun, X.J.; Dong, Y. Supplementation of fermented barley extracts with Lactobacillus Plantarum dy-1 inhibits obesity via a UCP1-dependent mechanism. Biomed. Environ. Sci. 2019, 32, 578–591. [Google Scholar]
  24. Kohyama, N.; Ono, H.; Yanagisawa, T. Changes in anthocyanins in the grains of purple waxy hull-less barley during seed maturation and after harvest. J. Agric. Food Chem. 2008, 56, 5770–5774. [Google Scholar] [CrossRef] [PubMed]
  25. McMurrough, I.; Loughrey, M.J.; Hennigan, G.P. Content of (+)-catechin and proanthocyanidins in barley and malt grain. J. Sci. Food Agric. 1983, 34, 62–72. [Google Scholar] [CrossRef]
  26. Guan, Q.; Ding, X.-W.; Zhong, L.-Y.; Zhu, C.; Nie, P.; Song, L.-H. Beneficial effects of Lactobacillus-fermented black barley on high fat diet-induced fatty liver in rats. Food Funct. 2021, 12, 6526–6539. [Google Scholar] [CrossRef]
  27. Rauf, A.; Imran, M.; Abu-Izneid, T.; Ul-Haq, I.; Patel, S.; Pan, X.; Naz, S.; Silva, A.S.; Saeed, F.; Suleria, H.A.R. Proanthocyanidins: A comprehensive review. Biomed. Pharmacother. 2019, 116, 108999. [Google Scholar] [CrossRef] [PubMed]
  28. Baba, S.; Osakabe, N.; Kato, Y.; Natsume, M.; Yasuda, A.; Kido, T.; Fukuda, K.; Muto, Y.; Kondo, K. Continuous intake of polyphenolic compounds containing cocoa powder reduces LDL oxidative susceptibility and has beneficial effects on plasma HDL-cholesterol concentrations in humans. Am. J. Clin. Nutr. 2007, 85, 709–717. [Google Scholar] [CrossRef] [PubMed]
  29. Yamashita, Y.; Wang, L.; Nanba, F.; Ito, C.; Toda, T.; Ashida, H. Procyanidin promotes translocation of glucose transporter 4 in muscle of mice through activation of insulin and AMPK signaling pathways. PLoS ONE 2016, 11, e0161704. [Google Scholar] [CrossRef]
  30. Nie, C.; Wang, B.; Fan, M.; Wang, Y.; Sun, Y.; Qian, H.; Li, Y.; Wang, L. Highland barley tea polyphenols extract alleviates skeletal muscle fibrosis in mice by reducing oxidative stress, inflammation, and cell senescence. J. Agric. Food Chem. 2023, 71, 739–748. [Google Scholar] [CrossRef]
  31. Yamashita, Y.; Okabe, M.; Natsume, M.; Ashida, H. Prevention mechanisms of glucose intolerance and obesity by cacao liquor procyanidin extract in high-fat diet-fed C57BL/6 mice. Arch. Biochem. Biophys. 2012, 527, 95–104. [Google Scholar] [CrossRef] [PubMed]
  32. Shen, Y.; Zhang, H.; Cheng, L.; Wang, L.; Qian, H.; Qi, X. In vitro and in vivo antioxidant activity of polyphenols extracted from black highland barley. Food Chem. 2016, 194, 1003–1012. [Google Scholar] [CrossRef] [PubMed]
  33. Wang, B.; Nie, C.; Li, T.; Zhao, J.; Fan, M.; Li, Y.; Qian, H.; Wang, L. Effect of boiling and roasting on phenolic components and their bioaccessibilities of highland barley. Food Res. Int. 2022, 162 Pt B, 112137. [Google Scholar] [CrossRef]
  34. Kang, J.; Postigo-Fernandez, J.; Kim, K.; Zhu, C.; Yu, J.; Meroni, M.; Mayfield, B.; Bartolome, A.; Dapito, D.H.; Ferrante, A.W.J.; et al. Notch-mediated hepatocyte MCP-1 secretion causes liver fibrosis. JCI Insight 2023, 8, e165369. [Google Scholar] [CrossRef] [PubMed]
  35. Yang, L.; Roh, Y.S.; Song, J.; Zhang, B.; Liu, C.; Loomba, R.; Seki, E. TGF-β signaling in hepatocytes participates in steatohepatitis through regulation of cell death and lipid metabolism. Hepatology 2014, 59, 483–495. [Google Scholar] [CrossRef] [PubMed]
  36. Banerjee, P.; Gaddam, N.; Chandler, V.; Chakraborty, S. Oxidative stress-induced liver damage and remodeling of the liver vasculature. Am. J. Pathol. 2023, 193, 1400–1414. [Google Scholar] [CrossRef]
  37. Krautbauer, S.; Eisinger, K.; Lupke, M.; Wanninger, J.; Ruemmele, P.; Hader, Y.; Weiss, T.S.; Buechler, C. Manganese superoxide dismutase is reduced in the liver of male but not female humans and rodents with non-alcoholic fatty liver disease. Exp. Mol. Pathol. 2013, 95, 330–335. [Google Scholar] [CrossRef]
  38. Yang, B.-Y.; Zhang, X.-Y.; Guan, S.-W.; Hua, Z.-C. Protective effect of procyanidin B2 against CCl4-induced acute liver injury in mice. Molecules 2015, 20, 12250–12265. [Google Scholar] [CrossRef] [PubMed]
  39. Zhang, L.; Wang, Y.; Li, D.; Ho, C.-T.; Li, J.; Wan, X. The absorption, distribution, metabolism and excretion of procyanidins. Food Funct. 2016, 7, 1273–1281. [Google Scholar] [CrossRef]
  40. Wren-Dail, M.A.; Dauchy, R.T.; Blask, D.E.; Hill, S.M.; Ooms, T.G.; Dupepe, L.M.; Bohm Jr, R.P. Effect of isoflurane anesthesia on circadian metabolism and physiology in rats. Comp. Med. 2017, 67, 138–146. [Google Scholar]
Figure 1. Comparisons of the final body weight at 18 weeks of age, the body weight gain, cumulative energy intake, and food efficacy during the rearing period, and the liver weight-to-body weight ratio and epididymal fat pad weight-to-body weight ratio at 18 weeks of age among the control, MO, ML, and MH groups, and among the control, PO, PL, and PH groups. * p < 0.05; ** p < 0.01.
Livers 04 00015 g001
Figure 2. Comparison of the serum biochemical parameters and hepatic lipid concentrations at 18 weeks of age among the control, MO, ML, and MH groups, and among the control, PO, PL, and PH groups. * p < 0.05; ** p < 0.01.
Livers 04 00015 g002
Figure 3. Representative histopathological findings of the livers in the control, MO, ML, MH, PO, PL, and PH groups. Arrows show inflammatory foci, and arrow heads show hepatocyte ballooning. In a rat of the control group, liver steatosis, lobular inflammation, hepatocyte ballooning, and fibrosis were not observed; the NAS was 0; and the TRX staining score was 1. In a rat of the MO group, severe steatosis (score 3), moderate lobular inflammation (score 2), a few ballooned hepatocytes (score 1), and mild fibrosis (score 1) were observed; the NAS was 6; and the TRX staining score was 4. In a rat of the ML group, moderate steatosis (score 2), moderate lobular inflammation (score 2), a few ballooned hepatocytes (score 1), and no fibrosis (score 0) were observed; the NAS was 5; and the TRX staining score was 3. In a rat of the MH group, severe steatosis (score 3), moderate lobular inflammation (score 2), no ballooned hepatocytes (score 0), and no fibrosis (score 0) were observed; the NAS was 5; and the TRX staining score was 2. In a rat of the PO group, severe steatosis (score 3), moderate lobular inflammation (score 2), no ballooned hepatocytes (score 0), and cirrhosis (score 4) were observed; the NAS was 5; and the TRX staining score was 3. In a rat of the PL group, severe steatosis (score 3), mild lobular inflammation (score 1), no ballooned hepatocytes (score 0), and bridging fibrosis (score 3) were observed; the NAS was 4; and the TRX staining score was 2. In a rat of the PH group, severe steatosis (score 3), severe lobular inflammation (score 3), no ballooned hepatocytes (score 0), and cirrhosis (score 4) were observed; the NAS was 6; and the TRX staining score was 3. The steatosis, lobular inflammation, hepatocyte ballooning, and fibrosis scores were determined according to the NASH Clinical Research Network Scoring System [21]. The TRX staining scores are expressed as described in the Materials and Methods section. HE (×200): hematoxylin and eosin-stained sections (original magnification, 200×; scale bars, 100 μm); Azan (×200): Azan-stained sections (original magnification, 200×; scale bars, 100 μm); TRX (×200): thioredoxin-stained sections (original magnification, 200×; scale bars, 100 μm).
Livers 04 00015 g003
Figure 4. Comparisons of the hepatic mRNA expression levels of genes involved in lipid metabolism, cholesterol metabolism, inflammation, fibrosis and oxidative stress among the control, MO, ML, and MH groups, and among the control, PO, PL, and PH groups. The mRNA levels are expressed relative to the levels of the control group (means ± SE). * p < 0.05; ** p < 0.01.
Livers 04 00015 g004
Figure 5. The presumed mechanism of BP against NASH development in the rat model. Downward arrow represents a decrease. MCP-1: monocyte chemoattractant protein-1; TGF-β: transforming growth factor-β; Mn-SOD: manganese superoxide dismutase; NAS: the NAFLD activity score; BP: barley bran polyphenol-rich extracts.
Livers 04 00015 g005
Table 1. Proximate compositions of the diets.
Constituents/GroupControlMOMLMHPOPLPH
Water (g)7.905.495.495.485.375.375.37
Crude protein (g)23.1016.0516.0215.9715.7115.6915.64
Crude lipid (g)5.103.543.533.523.473.463.45
Crude ash (g)5.804.034.034.033.943.943.94
Crude fiber (g)2.801.951.951.951.901.901.90
Nitrogen-free extract (g)55.3038.4338.6839.1537.6037.8638.33
Palm oil (g)0.0028.7528.5528.1827.5027.3126.95
Cholesterol (g)0.001.251.241.232.502.482.45
Sodium cholate (g)0.000.500.500.492.001.991.96
Total (g)100.00100.00100.00100.00100.00100.00100.00
Protein energy ratio (%)25.7012.6212.6212.6312.7712.7812.82
Lipid energy ratio (%)12.7757.1556.8756.4056.6656.3955.89
Carbohydrate energy ratio (%)61.5330.2330.5130.9730.5730.8331.29
Energy (kcal/100 g)359.50508.60507.64505.85491.96491.11489.54
Table 2. Primer sequences for real-time reverse transcription polymerase chain reaction.
PrimerSequence (5′ to 3′)
MttpForward:CAAGCTCAAGGCAGTGGTTG
Reverse:AGCAGGTACATCGTGGTGTC
FasnForward:CAACATTGACGCCAGTTCC
Reverse:TTCGAGCCAGTGTCTTCCAC
Cpt1aForward:AACCTCGGACCCAAATTGC
Reverse:GGCCCCGCAGGTAGATATATT
Srebf1Forward:CATGGACGAGCTACCCTTCG
Reverse:GAAGCATGTCTTCGATGTCGG
Nr1h3Forward:CAGGACCAGCTCCAAGTAGA
Reverse:GAACATCAGTCGGTCGTGG
Nr1h4Forward:TGGGAATGTTGGCTGAATGTTTG
Reverse:TGCTAGCTTGGTCGTGGAG
Ccl2Forward:TCTGTCACGCTTCTGGGCCTGT
Reverse:GGGGCATTAACTGCATCTGGCTGAG
Il6Forward:GATACCACCCACAACAGACCAGTA
Reverse:TGCACAACTCTTTTCTCATTTCCA
Nfkb1Forward:TGACATCATCAACATGAGAACGA
Reverse:CCCCAACCCTCAGCAAGTC
Col1a1Forward:GCGTAGCCTACATGGACCAA
Reverse:AAGTTCCGGTGTGACTCGTG
Tgfb1Forward:CTTTGTACAACAGCACCCGC
Reverse:TAGATTGCGTTGTTGCGGTC
Acta2Forward:GCCAAGAAGACATCCCTGAAGT
Reverse:TGTGGCAGATACAGATCAAGCAT
Cyp2e1Forward:CCCATCCTTGGGAACATTTTT
Reverse:GCCAAGGTGCAGTGTGAACA
Gpx1Forward:GCTGCTCATTGAGAATGTCG
Reverse:GAATCTCTTCATTCTTGCCATT
Sod2Forward:GACCTGCCTTACGACTATG
Reverse:TACTTCTCCTCGGTGACG
Rplp0Forward:ATTGCGGACACCCTCTAGGA
Reverse:GGTGTTTGACAATGGCAGCAT
Table 3. Histopathological assessment of the livers.
Item/GroupScoreControl
(n = 5)
MO
(n = 5)
ML
(n = 5)
MH
(n = 6)
PO
(n = 5)
PL
(n = 5)
PH
(n = 6)
Steatosis *05000000
10000000
20010000
30546556
Lobular inflammation *05000000
10000014
20132220
30424322
Hepatocyte ballooning *05225325
10331030
20000201
NAFLD activity score *
(NAS)
0–25000000
3–40000014
5–80556542
Fibrosis *05023001
10332121
20201000
30000123
40000311
TRX staining **00000000
15000000
20336121
30110335
40110100
Values indicate the number of rats. * Scores were determined according to the NASH Clinical Research Network Scoring System [21]. ** Scores are expressed as described in the Materials and Methods section. TRX: thioredoxin.
Disclaimer/Publisher’s Note: The statements, opinions and data contained in all publications are solely those of the individual author(s) and contributor(s) and not of MDPI and/or the editor(s). MDPI and/or the editor(s) disclaim responsibility for any injury to people or property resulting from any ideas, methods, instructions or products referred to in the content.

