Article

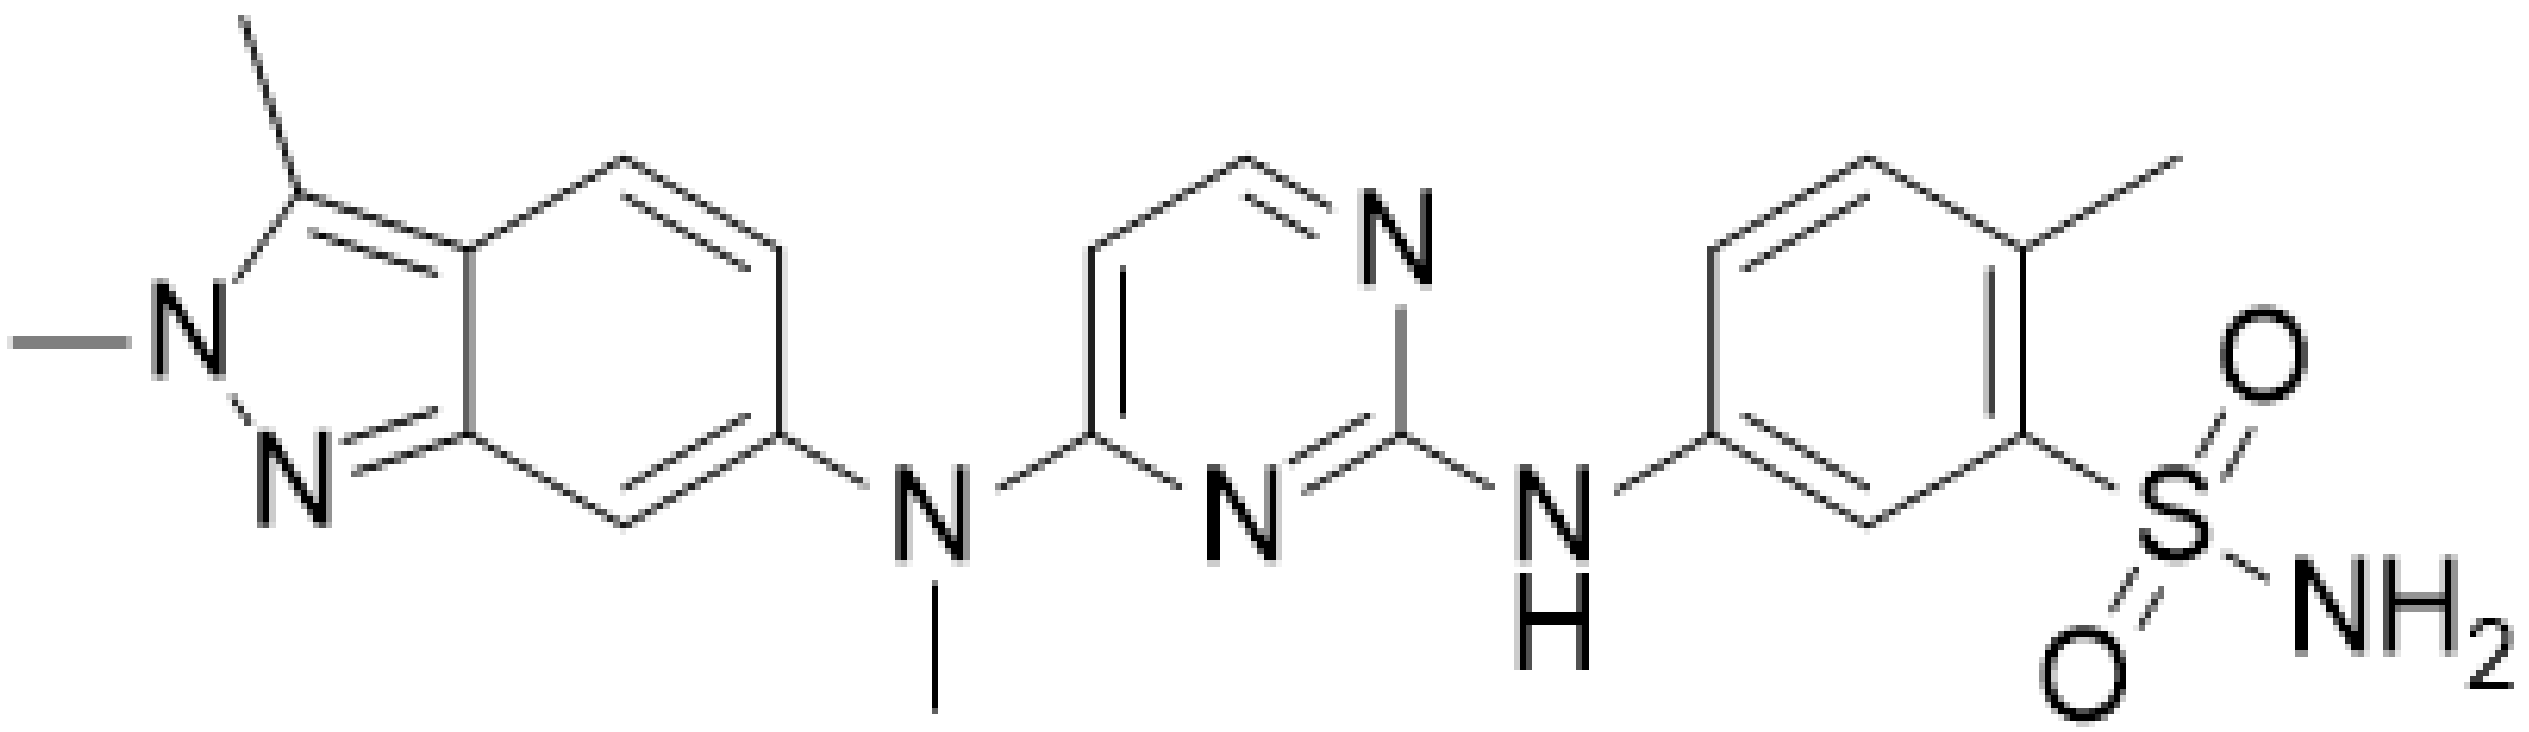
Investigation of Pazopanib and Human Serum Albumin Interaction Using Spectroscopic and Molecular Docking Approaches

1
Faculty of Pharmacy, Department of Analytical Chemistry, Ankara University, Ankara 06560, Turkey
2
Stem Cell Institute, Ankara University, Balgat, Ankara 06520, Turkey
3
UNAM-National Nanotechnology Research Center, Institute of Materials Science and Nanotechnology, Bilkent University, Ankara 06800, Turkey
4
Department of Chemical Engineering, Middle East Technical University, Ankara 06800, Turkey
5
Faculty of Biochemistry and Molecular Medicine, Faculty of Medicine, University of Oulu, 90014 Oulu, Finland
6
DEVA Holding A.S., R&D Center, Tekirdag 59510, Turkey
*
Author to whom correspondence should be addressed.
Analytica 2022, 3(1), 144-160; https://doi.org/10.3390/analytica3010011
Submission received: 13 January 2022 / Revised: 25 February 2022 / Accepted: 28 February 2022 / Published: 18 March 2022

Abstract

:
Pazopanib (PAZ), a tyrosine kinase inhibitor, is used to treat advanced renal cell carcinoma (RCC) and advanced soft tissue sarcoma (STS). The FDA approved PAZ for RCC in 2009 and for STS in 2012. The antitumor activity of pazopanib, according to the degree of inhibition, shows different results depending on the dose. Renal cell carcinoma is the most sensitive carcinoma to pazopanib, with 77% inhibition at the 10 mg/kg dose. Clinical studies have shown 53% to 65% inhibition in carcinomas such as breast carcinoma, prostate carcinoma, and melanoma. Plasma proteins such as human serum albumin (HSA) have a critical role in transporting and storing bioactive components. This feature of HSA is very important for the development of cancer therapy. Here, we investigated the interaction between PAZ and HSA to evaluate their binding strength, binding types, and conformational change in HSA. We used spectroscopic methods to assess the drug–protein interaction. Fluorescence measurements revealed that the interaction of PAZ with HSA occurred via the static quenching mechanism. The calculated binding number and binding constants were 1.041 and 1.436 × 10⁶ M−1, respectively, at 298.15 K based on fluorescence screening. The high binding constant and calculated Gibbs free energy at different temperatures showed spontaneous and strong binding. Circular dichroism measurements showed that the α-helix structure of HSA was retained as the secondary structure, with a slight reduction in its percentage after adding PAZ. Furthermore, molecular modeling studies suggested that the docking score of PAZ is higher than those of bicalutamide and ibuprofen, the drugs that were chosen as model competitors against PAZ. Accordingly, PAZ was found to replace bicalutamide and ibuprofen on the HSA binding site, which was also confirmed by UV absorption spectroscopy.

1. Introduction

Tyrosine kinase inhibitors (TKIs) are increasingly used in oncology. They are preferred over many chemotherapy drugs due to their superior efficacy and minimal side effects. Pazopanib (PAZ) is a TKI used as a first-line treatment for advanced clear cell renal cell carcinoma (ccRCC). It is a second-generation drug that limits tumor growth by acting on multiple targets, such as vascular endothelial growth factor receptor (VEGFR) and platelet-derived growth factor receptor (PDGFR). In addition, PAZ is used for the treatment of several different cancer types, such as ovarian, thyroid, breast, and cervix cancers [1,2].
Protein–drug interactions are critical for the pharmacokinetic and pharmacological properties of the drug. Drugs either bind reversibly to plasma proteins or are transported in free form in blood plasma. Human blood plasma consists of different types of proteins with various functional properties and structures, ranging from small peptides to large proteins. Plasma proteins have a substantial role in transporting and storing bioactive components. Hence, HSA has been under the spotlight for developing therapeutic substances that can be carried with this protein [3,4,5,6]. HSA consists of a single polypeptide chain with a molecular weight of 66.5 kDa containing 585 amino acid residues [3,4]. It is a macromolecule containing a helix that forms a heart-shaped structure. The macromolecule consists of three domains, which consist of two subdomains, A and B, with similar structures [3,4,5]. Seventeen disulfide bonds keep the subdomain structures in balance. Small drug molecules bind to the IIA (site 1) and IIIA (site 2) subdomains of HSA in the hydrophobic cavity [5,6]. PAZ is a synthetic small drug molecule containing indazole, pyrimidine, and benzenesulfonamide groups in its structure (Figure 1) [7]. The most important fluorophore of HSA is the Trp-214 residue, which is located in subdomain IIA and used to monitor the drug–protein interaction [4,5]. The binding of drugs to HSA may change the intermolecular forces that mediate the secondary and tertiary structures, leading to conformational changes. Alterations in HSA conformations are monitored by measuring the ellipticity using circular dichroism (CD) spectroscopy [4,5,6].
The most common methods to investigate the binding of drugs to albumin are fluorescence spectroscopy [6,8], molecular modeling [5,6,9], synchronous fluorescence [9], UV–visible absorption [8,9], and CD spectroscopy [5,6,8,9,10]. The binding of PAZ to plasma proteins has not been previously reported. This study reports the interaction between PAZ and HSA for the first time by using multispectroscopic methods. Fluorescence quenching of the Trp-214 residue was systematically measured upon the addition of PAZ. The quenching data were used to determine the quenching mechanism and calculate the binding constant for PAZ. CD measurements helped to examine the α-helix structure of HSA in the presence of PAZ. In addition, possible molecular interactions between the anticancer drug PAZ and HSA were investigated using molecular docking calculations. According to the theoretical model, hydrogen binding and pi–sulfur bonds were found to constitute the interactions. The molecular docking score of PAZ was compared to those of bicalutamide (BIC) and ibuprofen (IBU) based on the bond types mediated in the interactions.

2. Experimental Procedures

2.1. Materials and Methods

HSA (purity ≥ 96%), tris(hydroxymethyl)aminomethane (Tris), sodium chloride (NaCl), hydrochloric acid (HCl), and dimethyl sulfoxide (DMSO) were purchased from Sigma-Aldrich. PAZ (purity > 99.5%) was obtained from DEVA Holding A.S (Istanbul-Turkey). Firstly, stock solutions of 1.0 mM HSA and 1.0 mM PAZ were prepared using pH 7.4 Tris-HCl buffer solution and DMSO, respectively, and stored in a refrigerator at 4 °C. Before each experiment, all solutions were freshly prepared in tris buffer solution (0.05 M, pH 7.4, containing 0.1 M NaCl) using ultrapure water. Several protein–drug solutions containing PAZ concentrations ranging from 0.5 µM to 36.0 µM were prepared.

2.2. Fluorescence Spectroscopy Measurements

Fluorescence studies were conducted using a Varian-Cary Eclipse fluorescence spectrophotometer equipped with a Peltier temperature control unit. The samples were excited at 270 nm; both excitation and emission slits were set to 5 nm. The HSA concentration was kept constant at 20 µM, the concentrations of the added drug were calculated, and the required amount was taken from the stock solution and added directly to the cuvette. The fluorescence spectra of HSA solutions in the absence and presence of PAZ were measured at four different temperatures (288.15, 298.15, 310.15, and 318.15 K). At the beginning of the titrations, the HSA solutions were kept at equilibration for 15 min at each temperature. To eliminate the inner filter effect in HSA–PAZ interactions, corrections were made in the fluorescence measurements. The corrected fluorescence intensity (Fcor) values were calculated using the following equation [5,8,11]:
Fcor = Fabs10(Aexc + Aem)/2
where Fabs is the observed fluorescence intensity of HSA, Aexc is the absorbance value at the excitation wavelength, and Aem is the absorbance value at the emission wavelength. Corrected fluorescence values were used in all other calculations.

2.3. CD Measurements

CD spectra of HSA (66.5 kDa) before and after the addition of PAZ were recorded between 202 nm and 250 nm using a JASCO spectrometer (J-815-150S, Tokyo, Japan). A 2.5 µM HSA solution in Tris-HCl buffer (pH 7.4) was prepared for the measurements. PAZ was added from its 5 mM DMSO solution to HSA solutions to reach final PAZ concentrations of 2.5 µM and 5 µM. DMSO absorbs circularly polarized light in the far-UV region, causing a voltage increase and noisy signal. When DMSO was around 0.5% by volume, the secondary structure was not affected, but the signal within the 202–220 nm range was noisy due to the voltage rise. Therefore, DMSO was used at around 0.1%. A quartz cuvette with a 1 mm path length was used for the measurements. Scans were recorded as the average of three consecutive scans. Response time and scanning speed were set to 4 s and 100 nm/min, respectively. Mean residue ellipticity (MRE) values were calculated using amino acid number (n = 585) and ellipticity values measured in millidegrees (ϴobserved) at 208 nm according to the following equation:
MRE = ϴ o b s e r v e d c × l × 10 × n
where c is the molar protein concentration, and l is the path length in cm.
α-Helix percentages of HSA upon addition of PAZ were calculated based on the ellipticity values at 222 nm according to the following equation [12]:
%   α - Helix = MRE 3000 39500 3000 100

2.4. Molecular Docking Studies

Molecular docking experiments were conducted using the Autodock Vina software [13]. The receptor protein structure (4LA0) was retrieved from the protein database. Before docking calculations, the structure was cleaned of water and other heteroatoms. BIOVIA Discovery Studio 2021 (BIOVIA, Dassault Systèmes, Discovery Studio, 2021, San Diego: Dassault Systèmes, 2021) was used to prepare the dock and analyze the findings.

2.5. UV–Visible Spectroscopy Measurements

All UV–visible absorption experiments were performed with an Agilent Technologies Cary UV-60 spectrophotometer. The path length of the quartz cell was 10 mm, and the wavelength was 250–600 nm. Different concentrations of PAZ were added to 20 µM HSA, and absorbance spectra were collected.

3. Results and Discussion

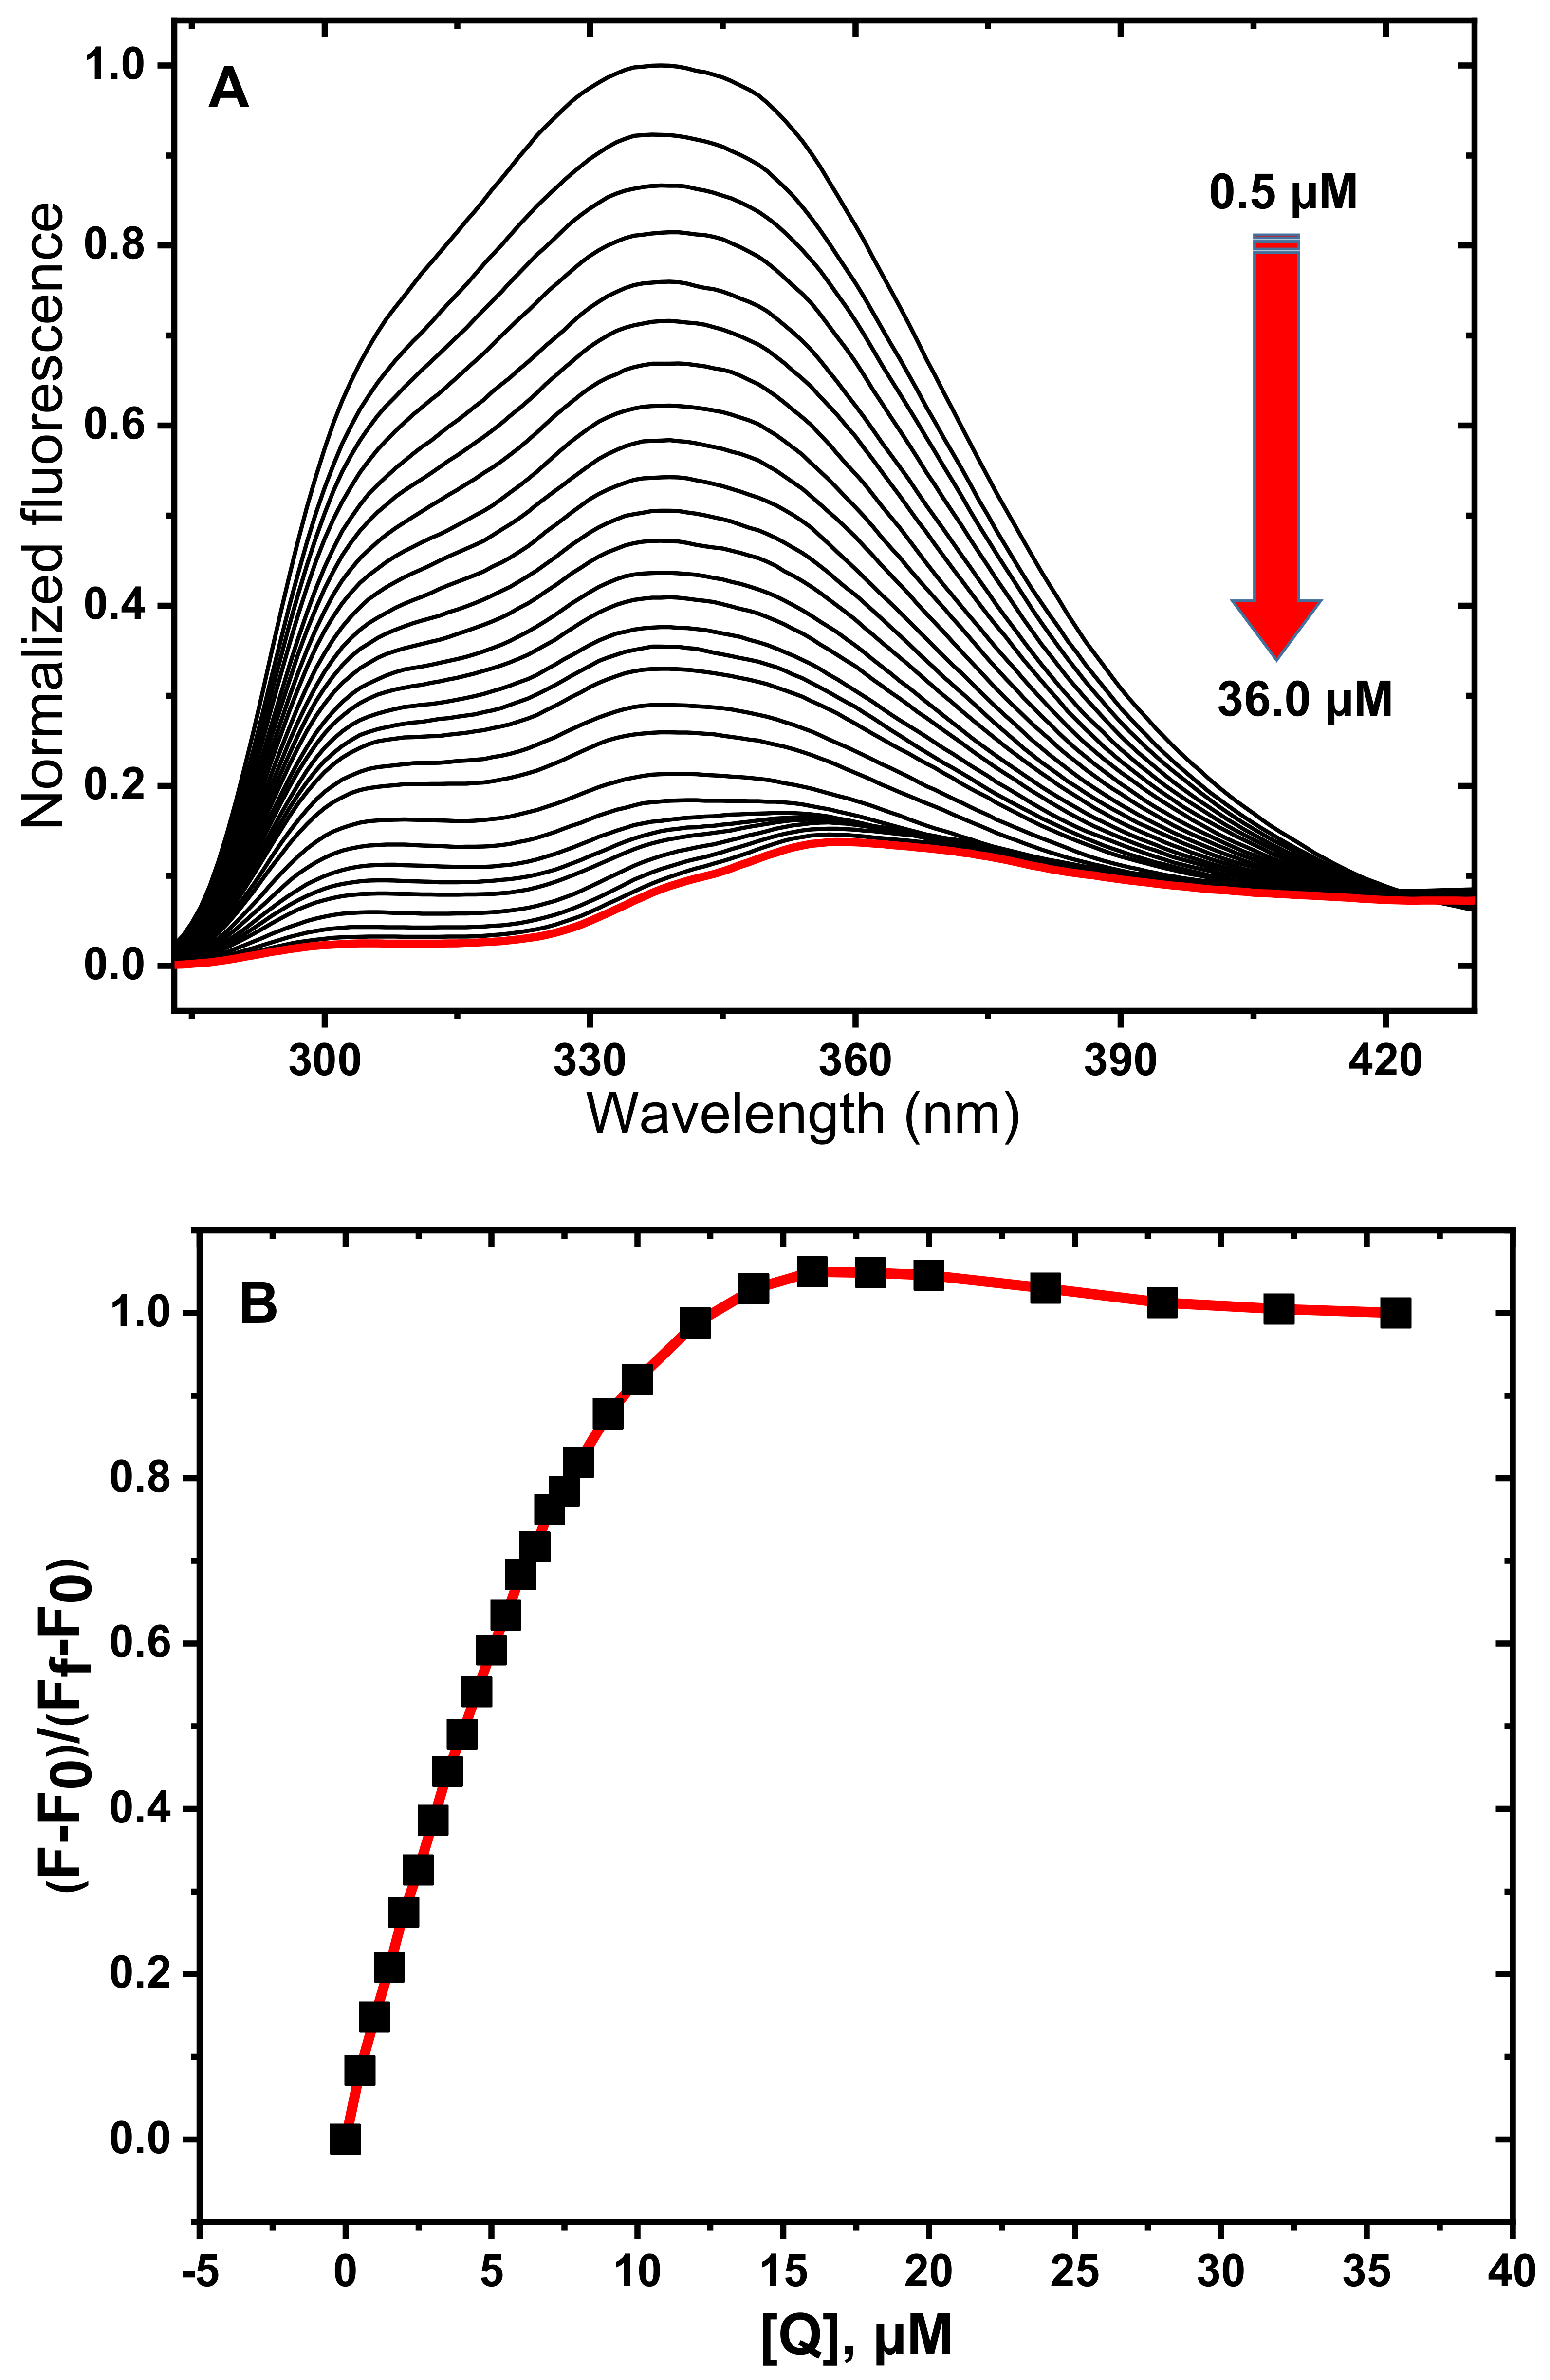
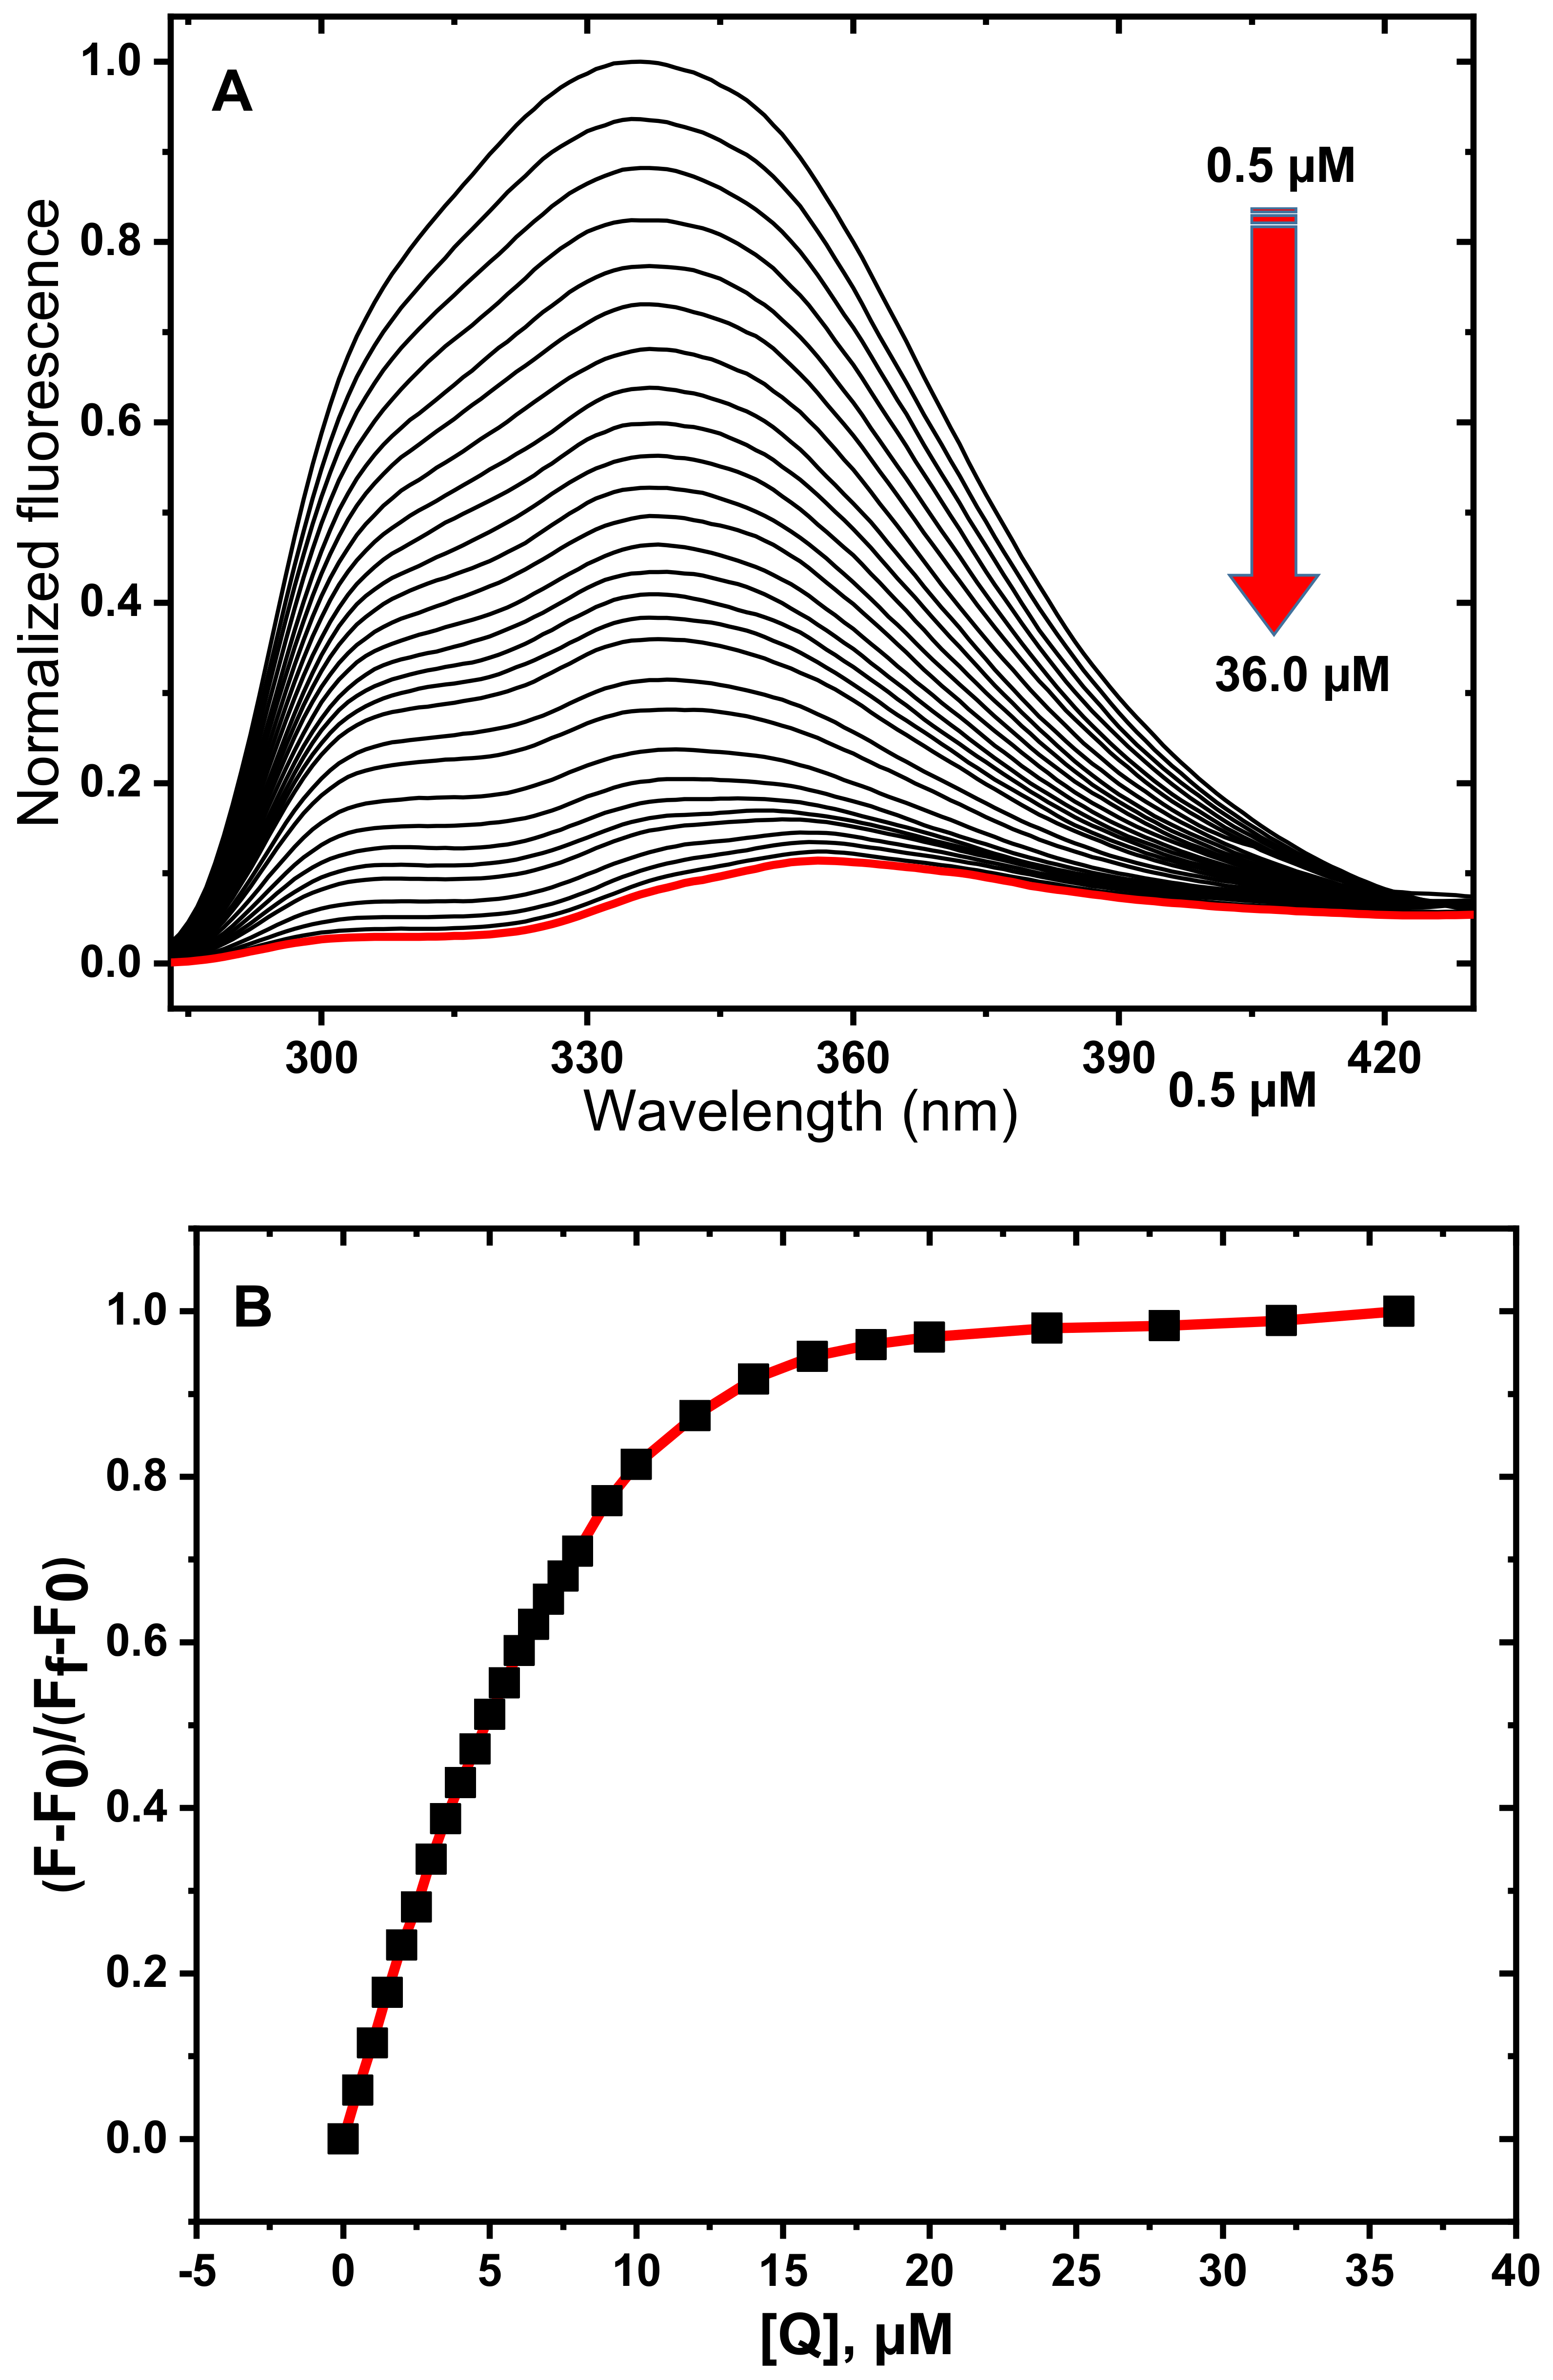
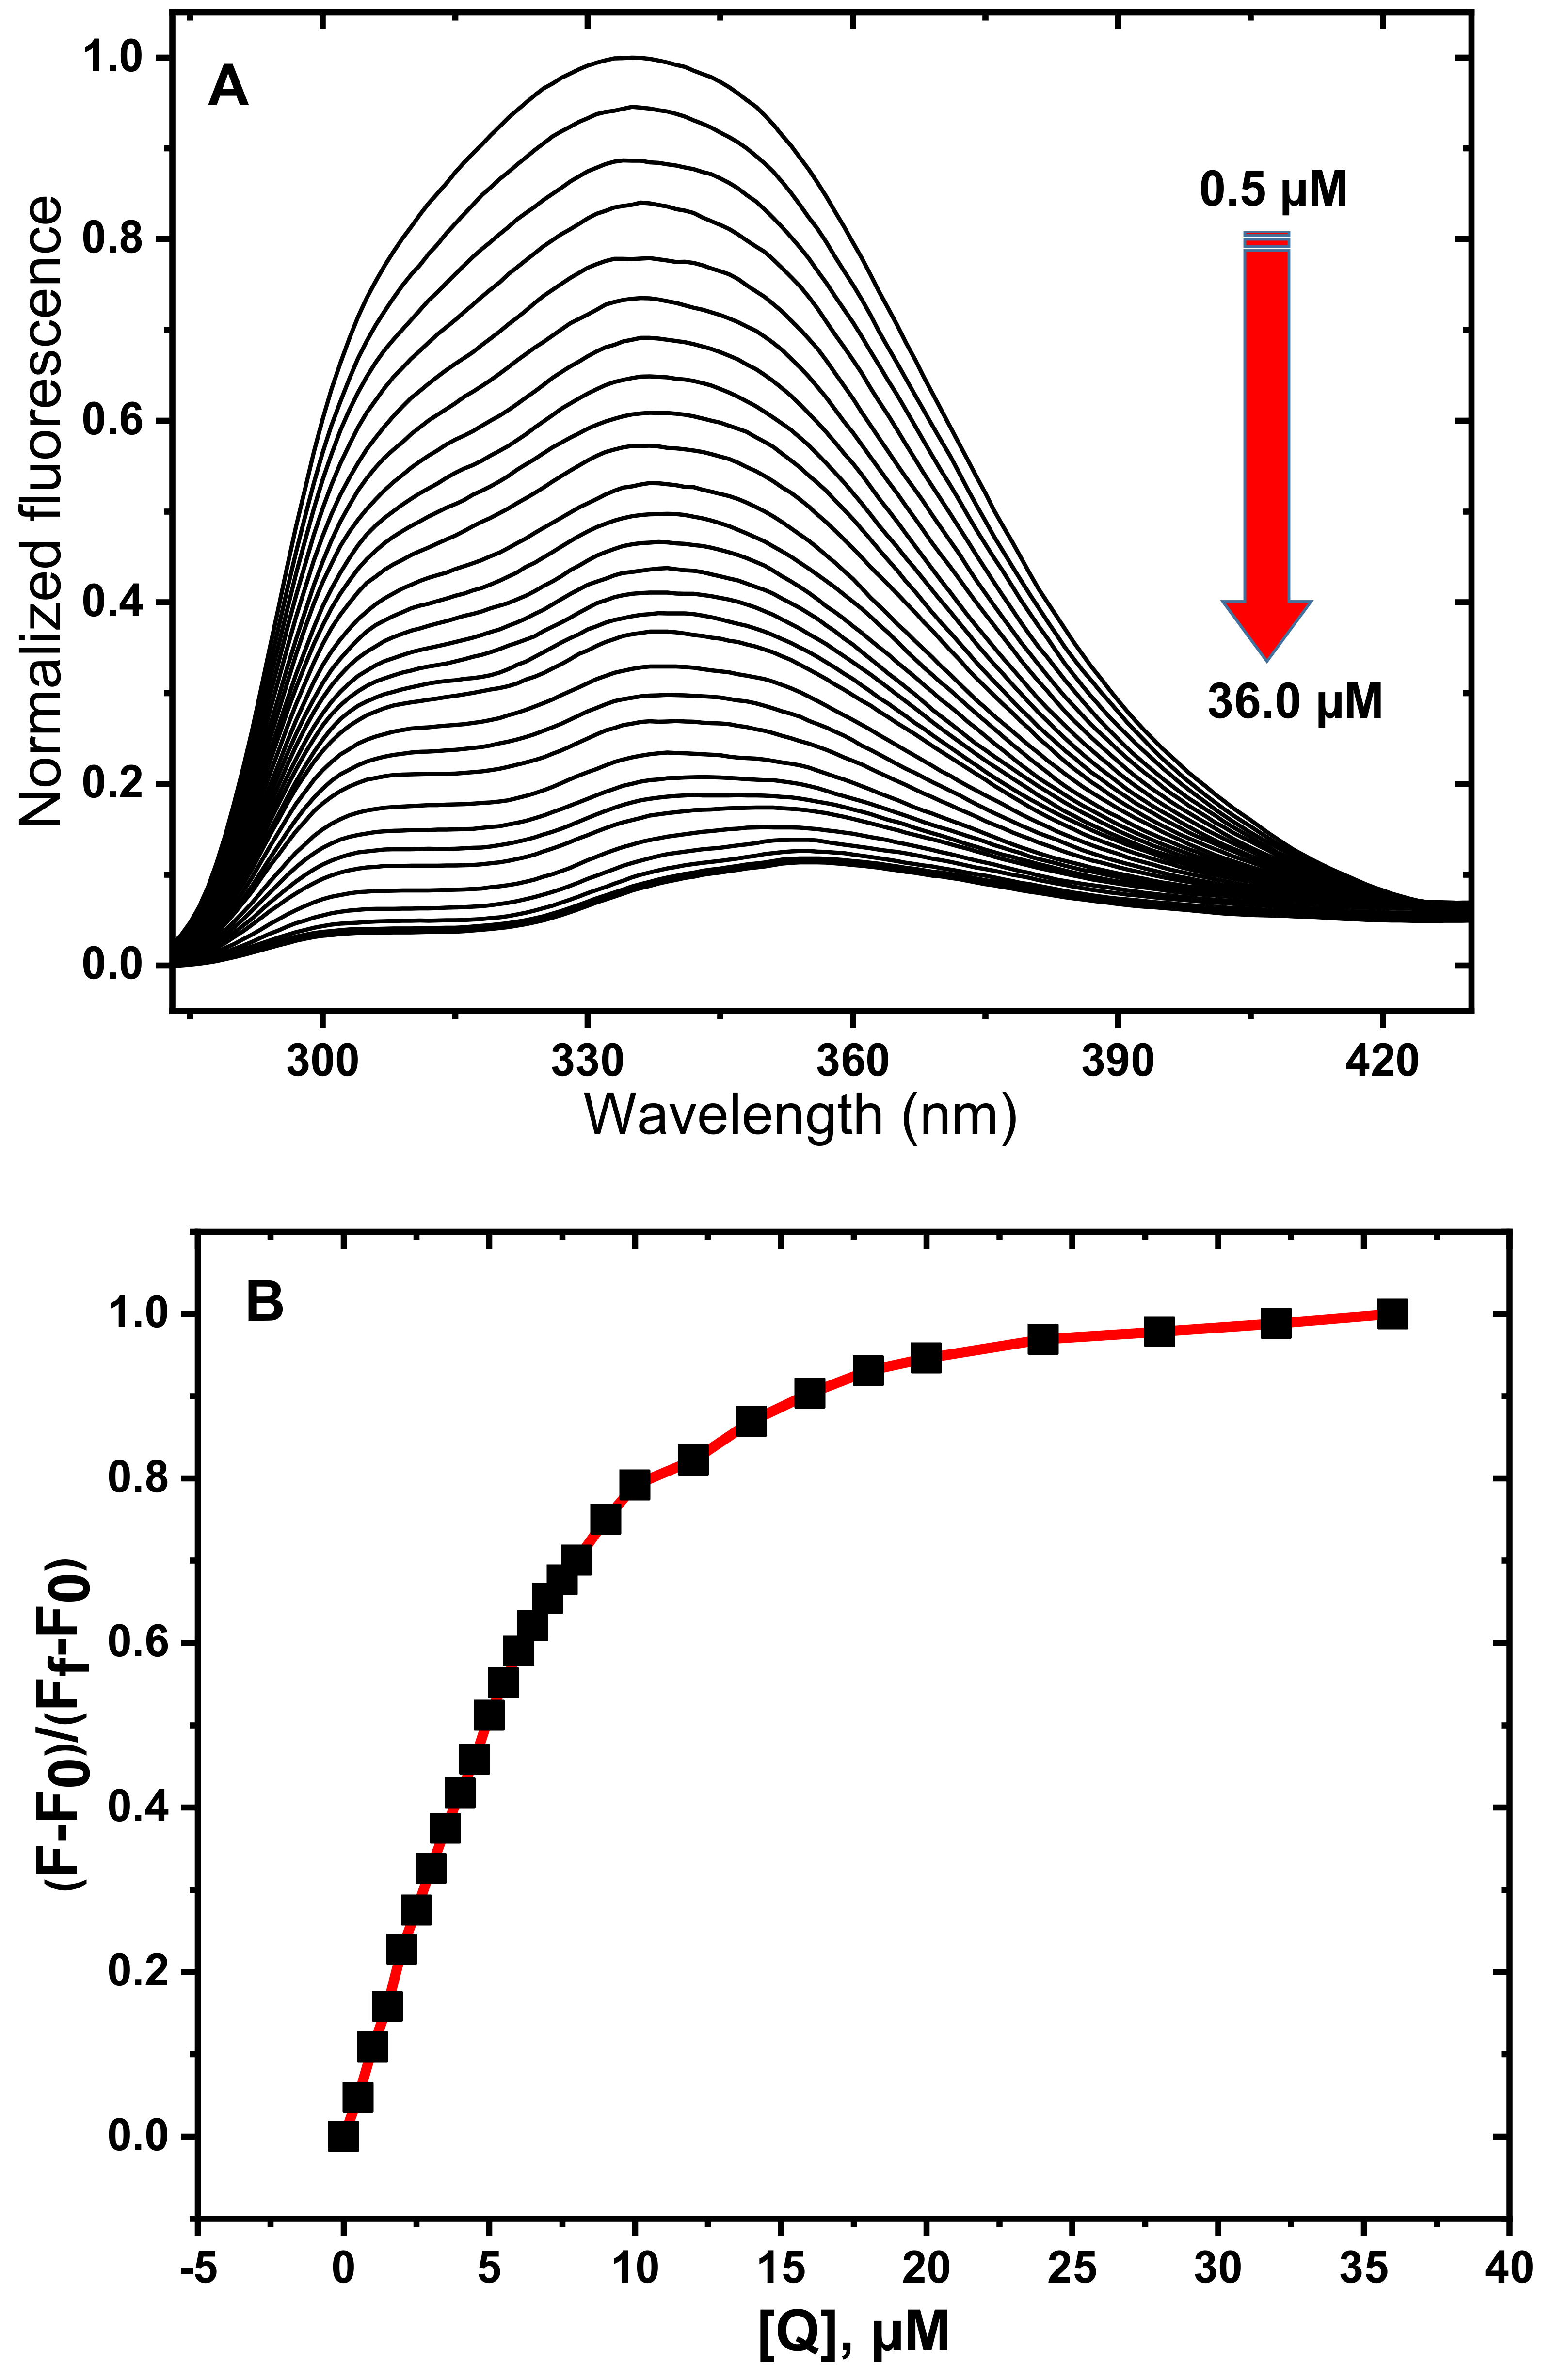
3.1. Fluorescence Spectroscopy Studies

The binding of PAZ to HSA was investigated based on fluorescence quenching of Trp-214, which is the fluorophore unit of HSA. Fluorescence measurements were performed at four different temperatures (288.15 K, 298.15 K, 310.15 K, and 318.15 K) to monitor the dependence of the interactions between HSA and PAZ on temperature. The fluorescence maximum of the HSA in the absence of PAZ was observed at 337 nm when excited at 270 nm. A gradual decrease at this band was observed upon adding PAZ with a concentration ranging from 0.5 µM to 36.0 µM. As shown in Figure 2A, the maximum emission underwent a bathochromic shift to 357 nm after the addition of 36.0 µM PAZ at 298.15 K. The fluorescence spectra and binding isotherms obtained at 288.15, 310.15, and 318.15 K are shown in Figure 3, Figure 4 and Figure 5, respectively. Association constants (Ka) were calculated using nonlinear curve fittings of binding isotherms.

3.2. Determination of Quenching Mechanism

Fluorescence quenching occurs in two ways: dynamic (collision) or static. Dynamic quenching occurs due to the collision between the fluorophore and the quencher, while static quenching is due to the formation of a complex between the fluorophore and the quencher. Generally, dynamic and static quenching can be distinguished from the response to the temperature. While the constant quenching value decreases with increasing temperature in static quenching, the opposite is true in dynamic quenching [6,8,9,11].
To determine the mechanism of quenching of HSA, fluorescence quenching constants were calculated using Stern–Volmer plots obtained at different temperatures (Figure 6) and the equation below [14]:
F0/F = 1 + kq τ0 [Q] = 1 + Ksv [Q]
where F0 and F are the fluorescence intensities of the protein in the absence and presence of ligand, respectively; τ0 is the lifetime (10−8 s) of the biomolecule in the absence of quencher; Ksv and [Q] are the Stern–Volmer quenching constant and PAZ concentration, respectively; and kq represents the quenching rate constant. KSV values were determined using the slopes of F0/F versus [Q] plots.
As seen from Table 1, the Ksv values decreased with increasing temperature, proving that the quenching by PAZ is initiated by static quenching. Therefore, it occurs through the formation of a complex between the drug and protein.

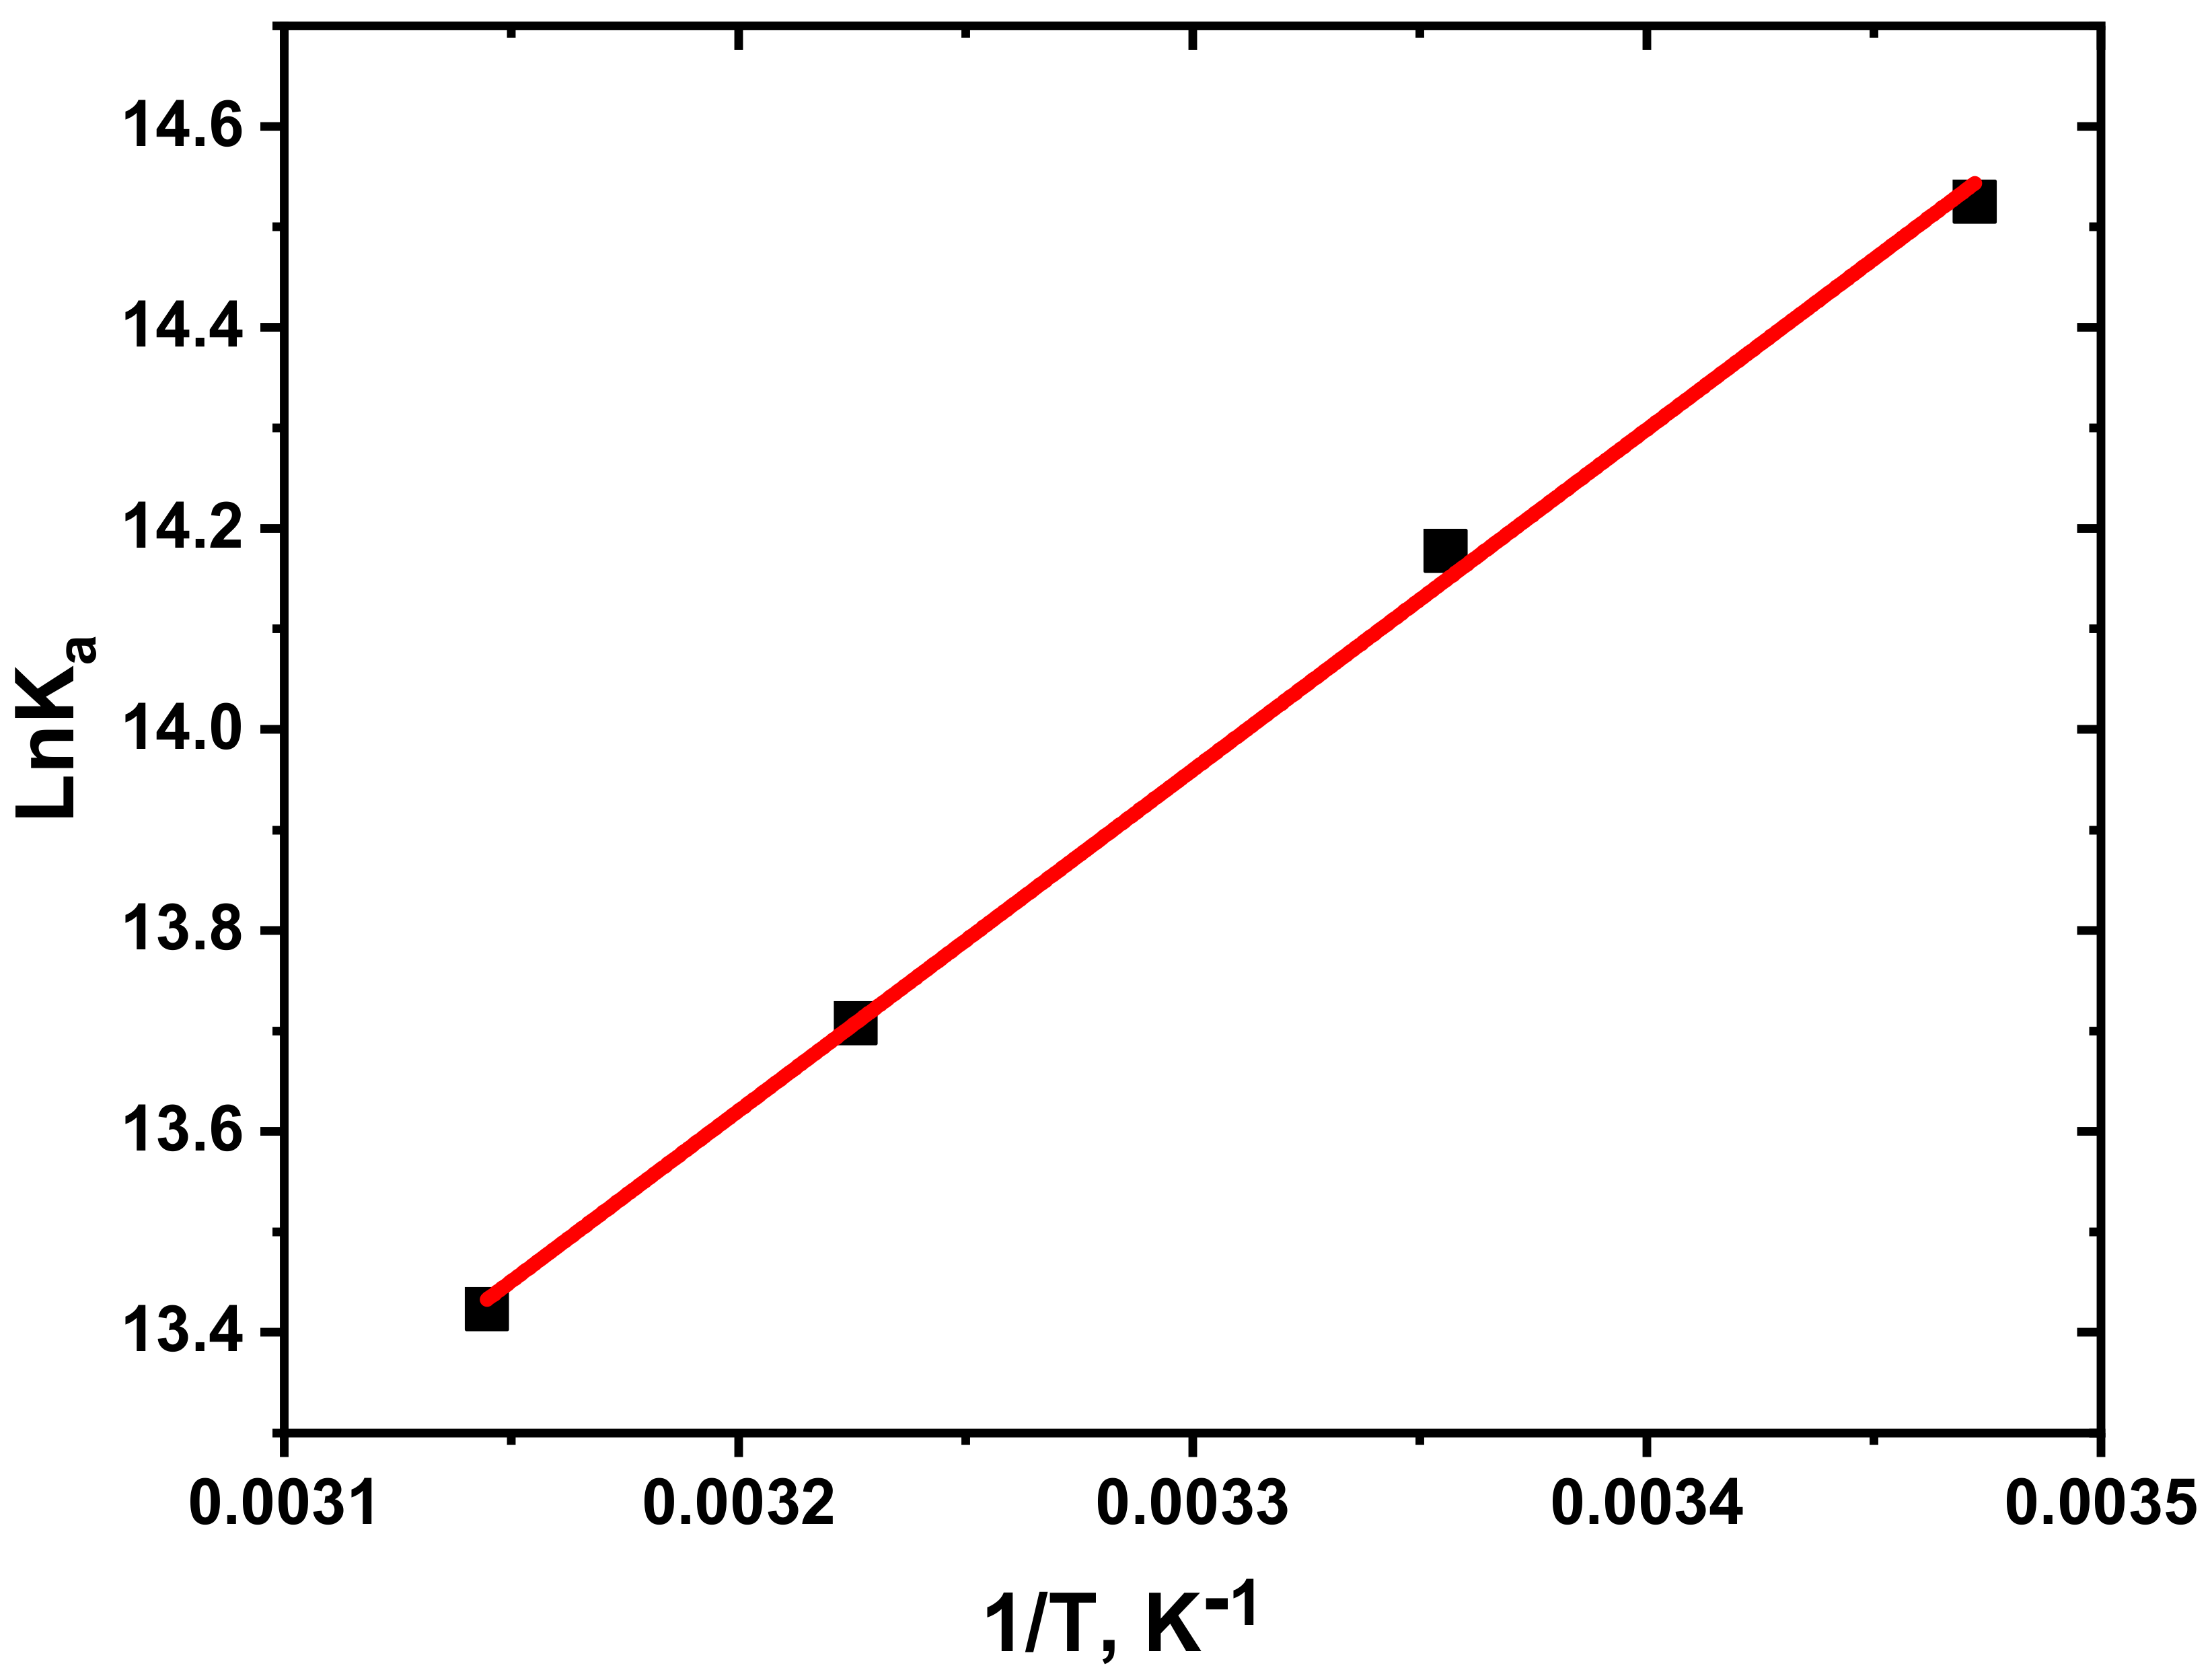
3.3. Determination of Thermodynamic Parameters and Binding Constants

Thermodynamic parameters are basic tools to determine the interactions occurring between proteins and ligands, namely, hydrogen bonding, hydrophobic interaction, and van der Waals and electrostatic forces. The nature of the HSA–PAZ interaction was determined using thermodynamic parameters such as enthalpy change (ΔH°), entropy change (ΔS°), and Gibbs free energy change (ΔG°). Values of ΔH and ΔS for the interactive process were obtained based on the Van’t Hoff equation [15]:
lnKa = −ΔH°/RT + ΔS°/R
where Ka and R are the binding constant and universal gas constant, respectively. ΔH° and ΔS° values were calculated from the slope and intercept values of the lnKa versus 1/T plot, respectively (Figure 7). Then, the value of ∆G° was calculated using the following equation:
ΔG° = ΔH° − TΔS°
The calculated parameters are shown in Table 2 for different temperatures. The negative ΔG° values and high Ka values indicate a spontaneous and strong interaction between PAZ and HSA. Since both entropy and enthalpy changes contribute to the Gibbs free energy change, the binding interaction can be regarded as both enthalpy- and entropy-driven.
Menezes et al. [16] revealed that PAZO interacts with HSA and glycine (gHSA) and quenches their fluorescence. The interactions were found to produce high and similar affinities for HSA (Ka = 6.76 × 10⁵ M−1) and gHSA (Ka = 7.76 × 10⁵ M−1) at 296 K. When the thermodynamic results obtained are examined, it is observed that HSA–PAZO interactions are governed by hydrophobic/van der Waals forces and hydrogen bonds (ΔH° < 0 and ΔS° > 0), whereas in the gHSA–PAZO interactions, only van der Waals forces and hydrogen bonds (ΔH° < 0 and ΔS° < 0) appear to be dominant. In this study, the binding coefficient of HSA–PAZ interactions at 298 K were found to be 1.436 × 10⁶ M−1, and the binding number was 1.041. Thermodynamic results were calculated as ΔH° < 0 and ΔS° < 0. These results were supported by molecular docking studies, in which van der Waals forces were more effective in drug–protein interactions.

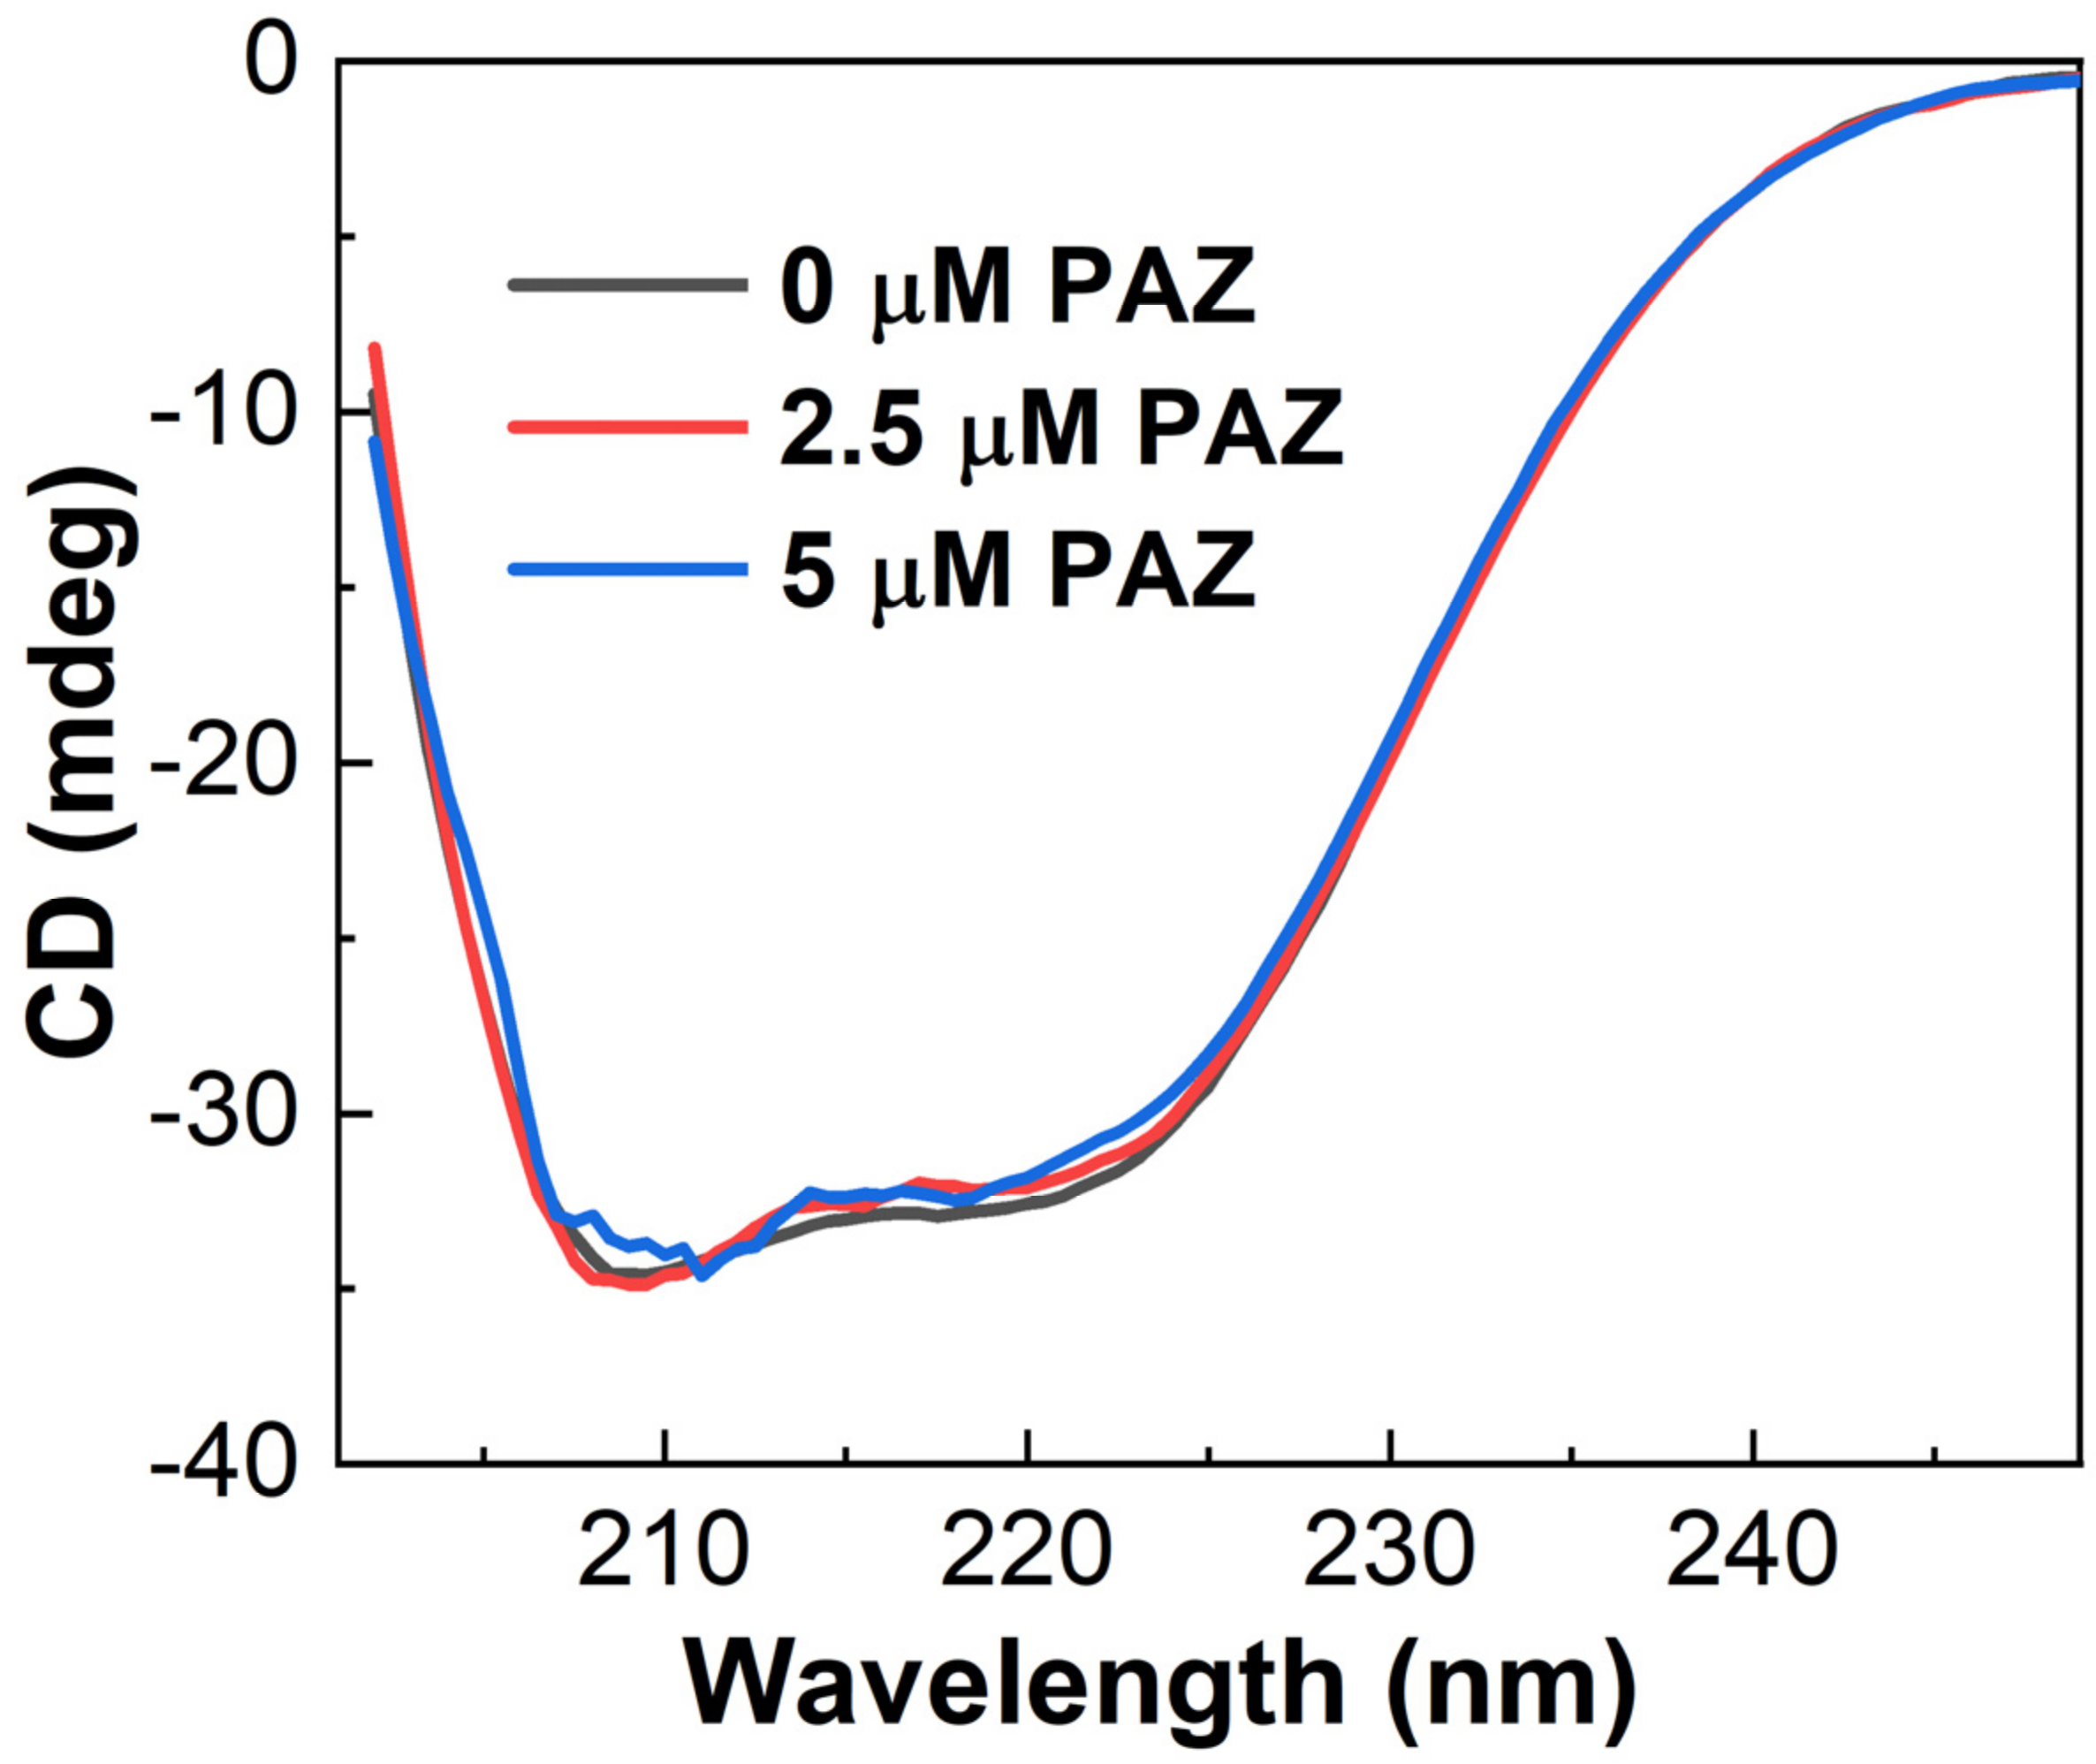
3.4. CD Spectroscopy

The secondary structure of HSA in the absence and presence of PAZ was analyzed using a circular dichroism spectrometer. Figure 8 shows the typical α-helix CD spectra of the protein with two negative minima at 208 nm and 222 nm that correspond to the п-п* and n-п* transitions, respectively [12]. The addition of PAZ slightly decreased the α-helix content, as revealed by the decrease in the peak intensity at 222 nm. The calculated α-helix content of native HSA was found to be 51.4%, which decreased to 50.5% and 49.3% after adding PAZ with concentrations of 2.5 µM and 5 µM, respectively.

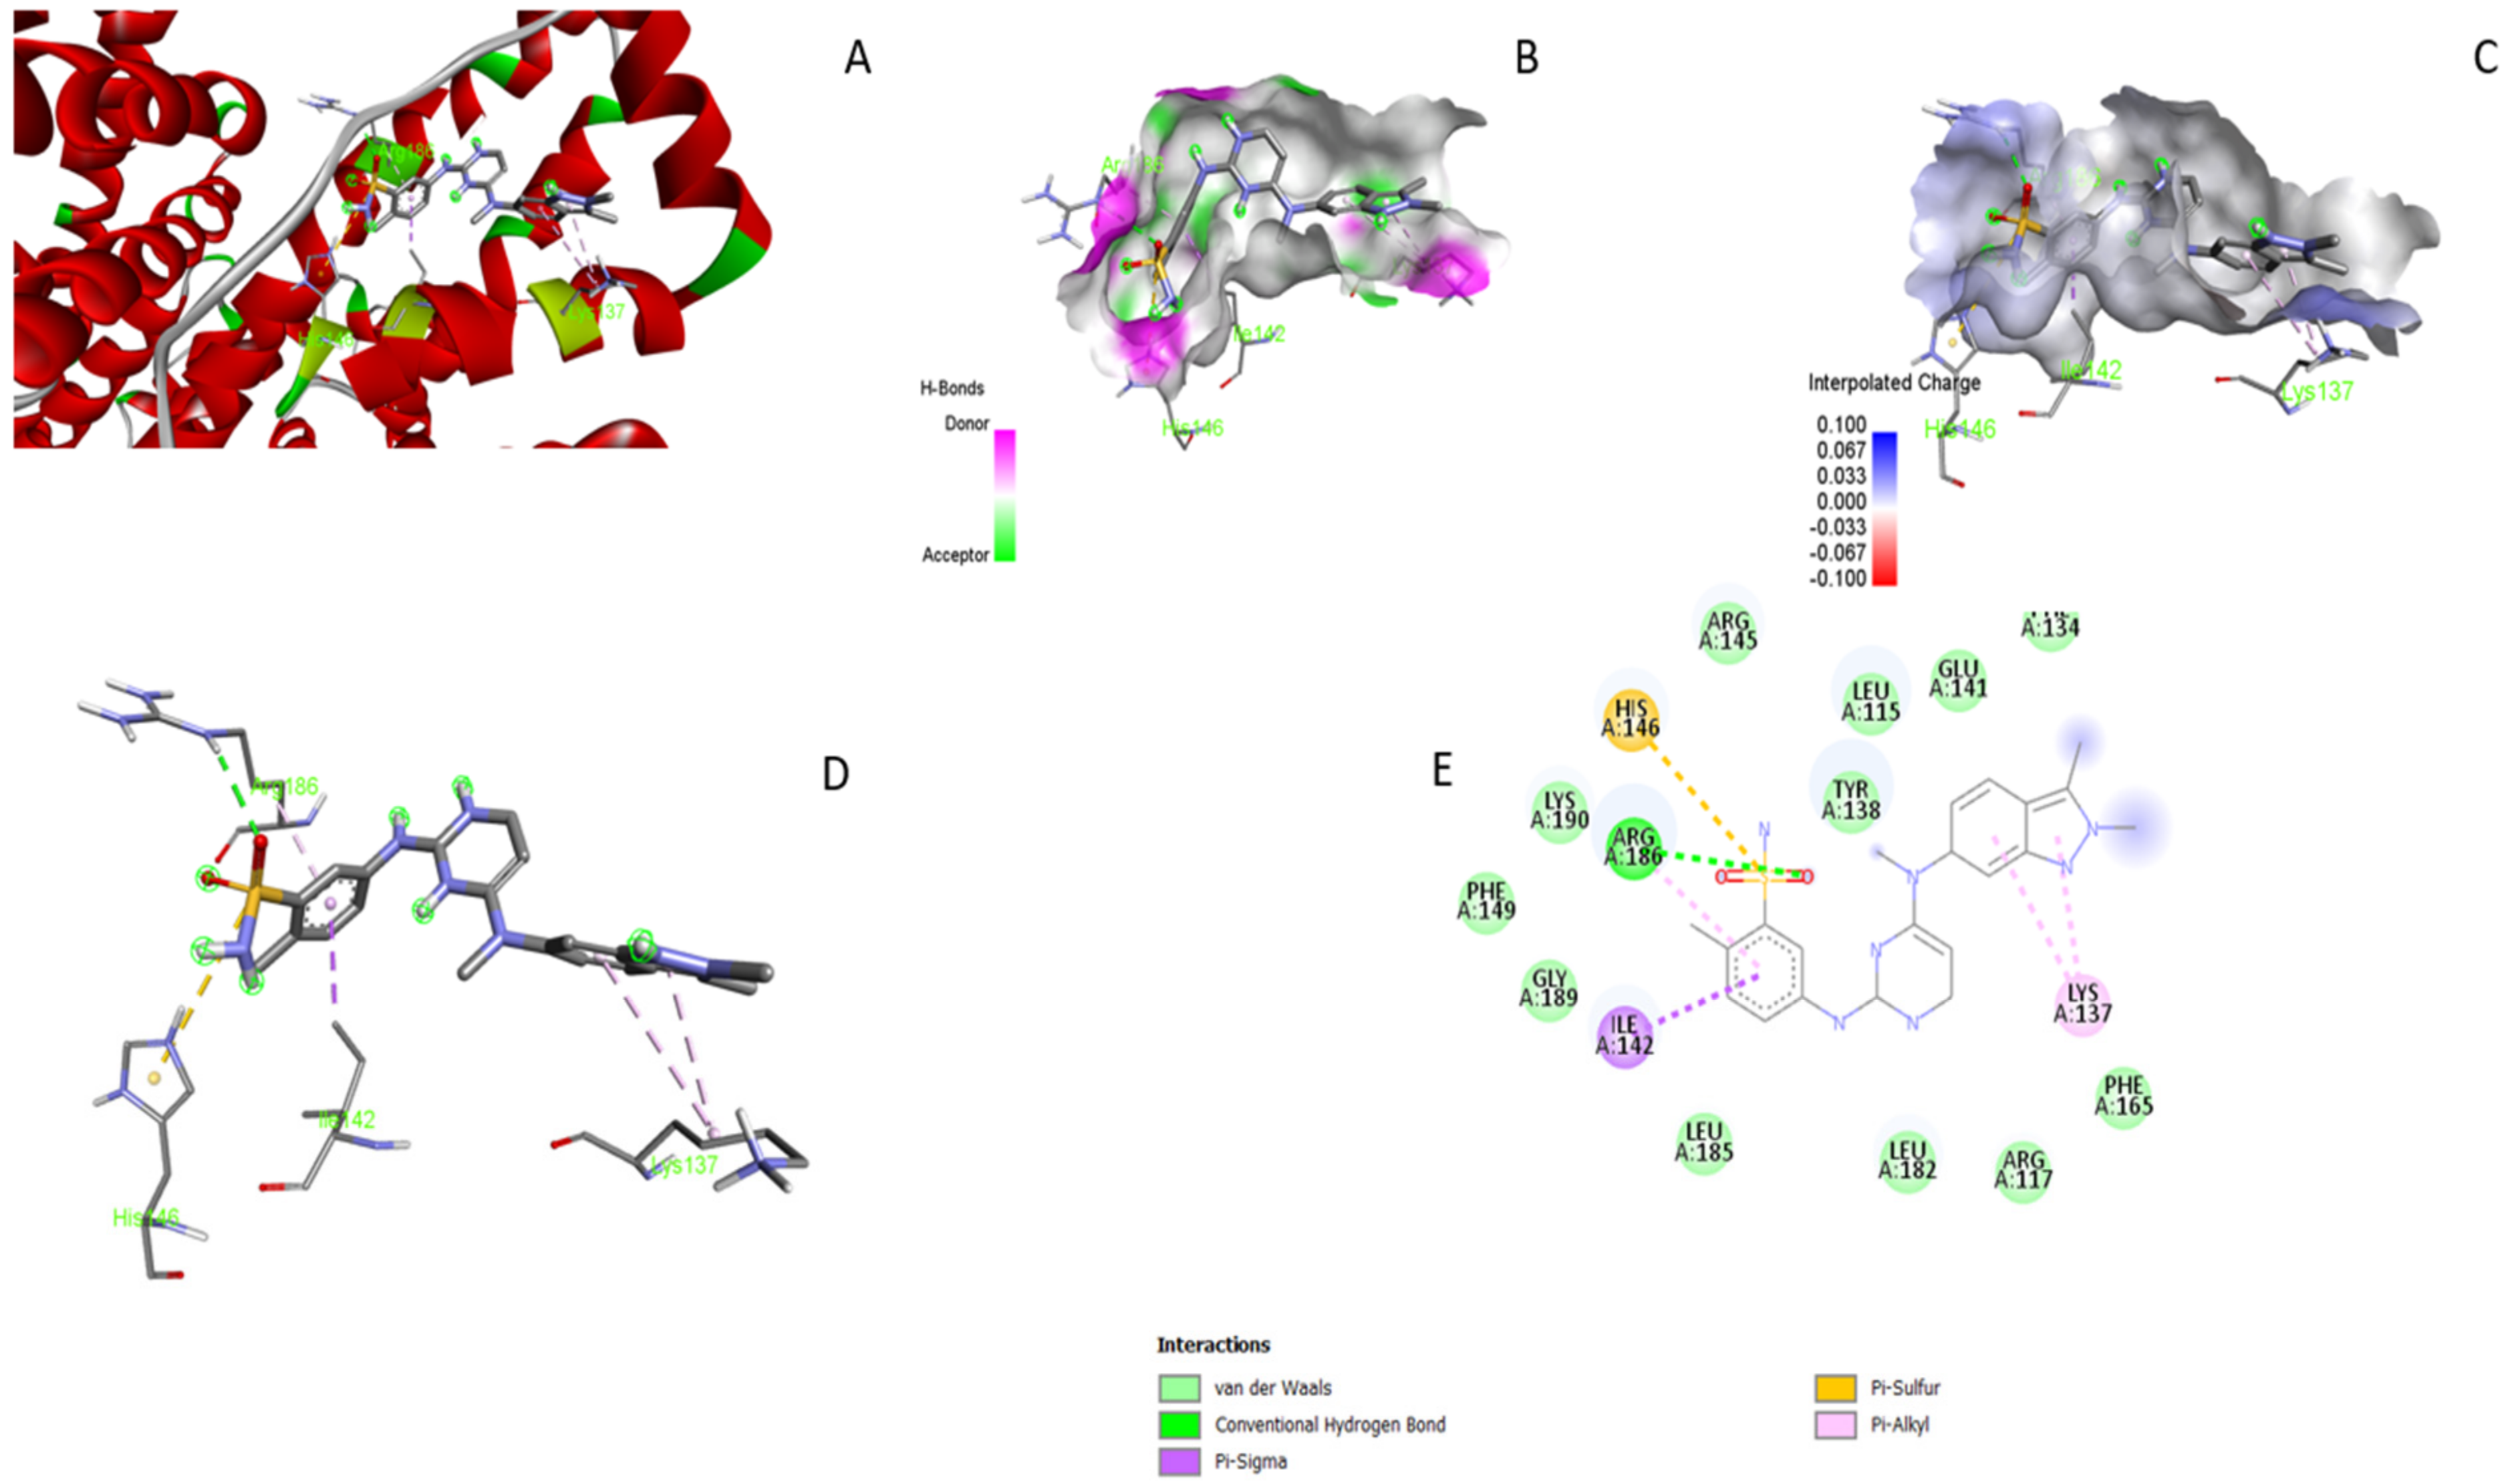
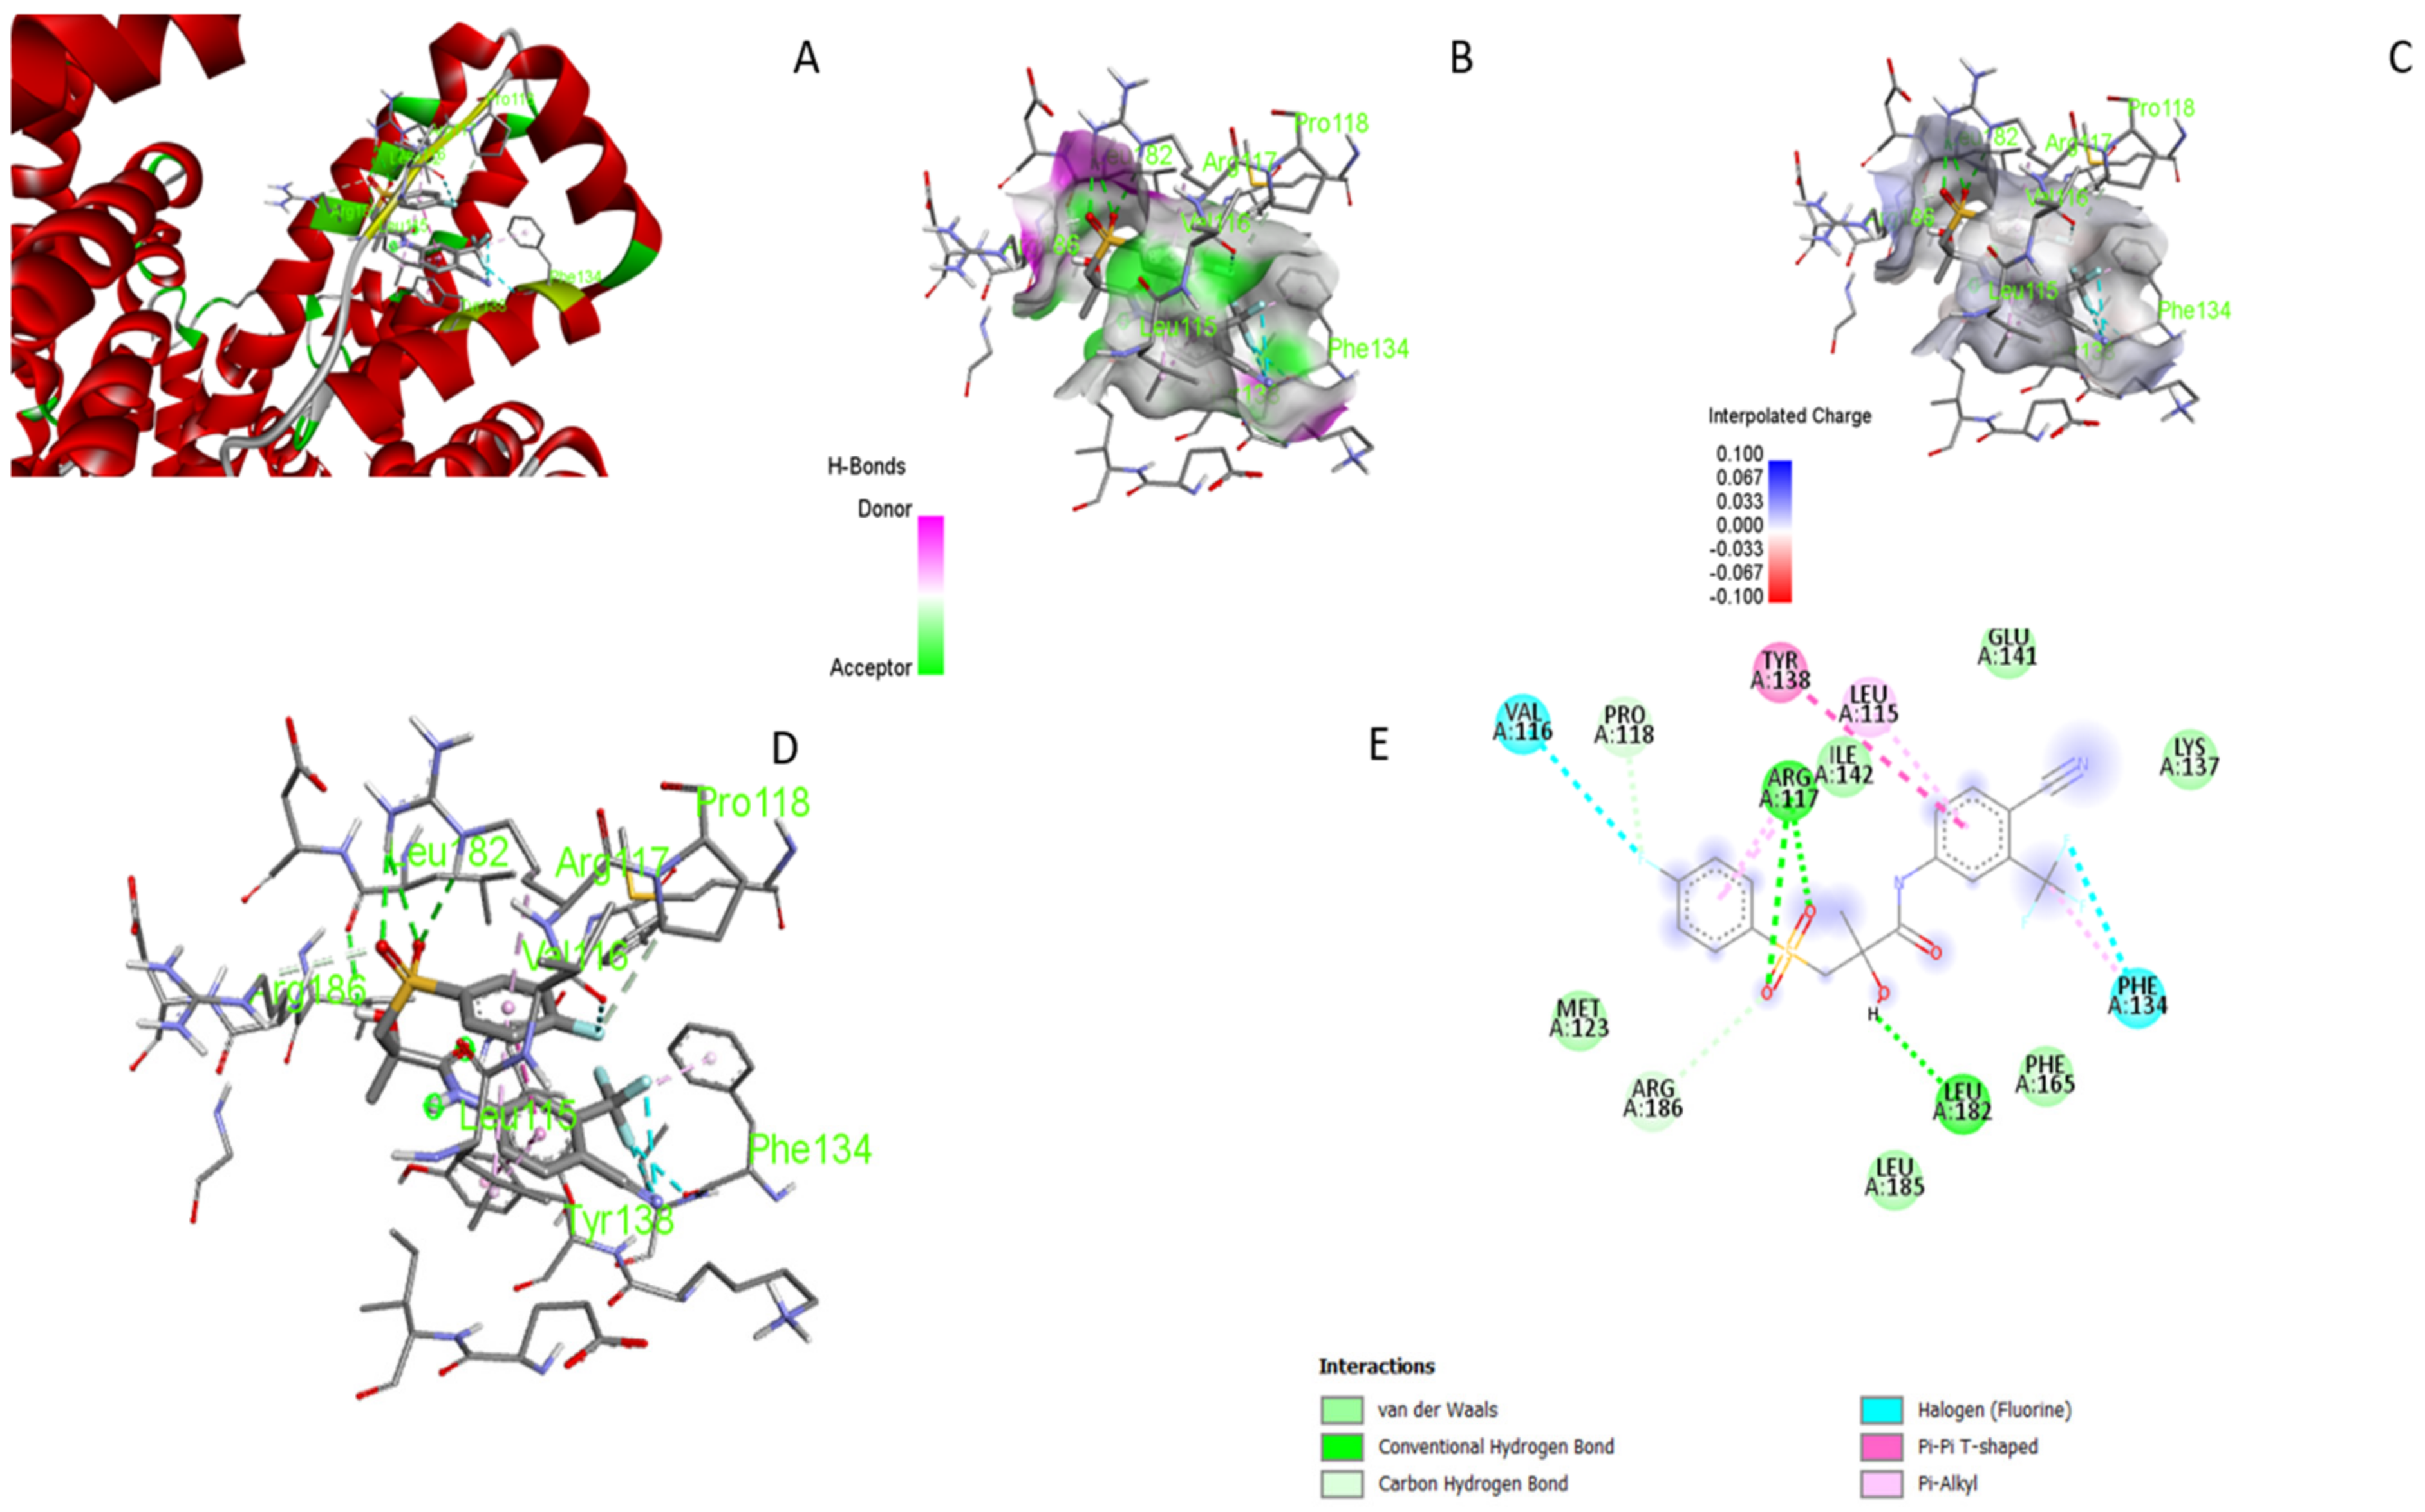
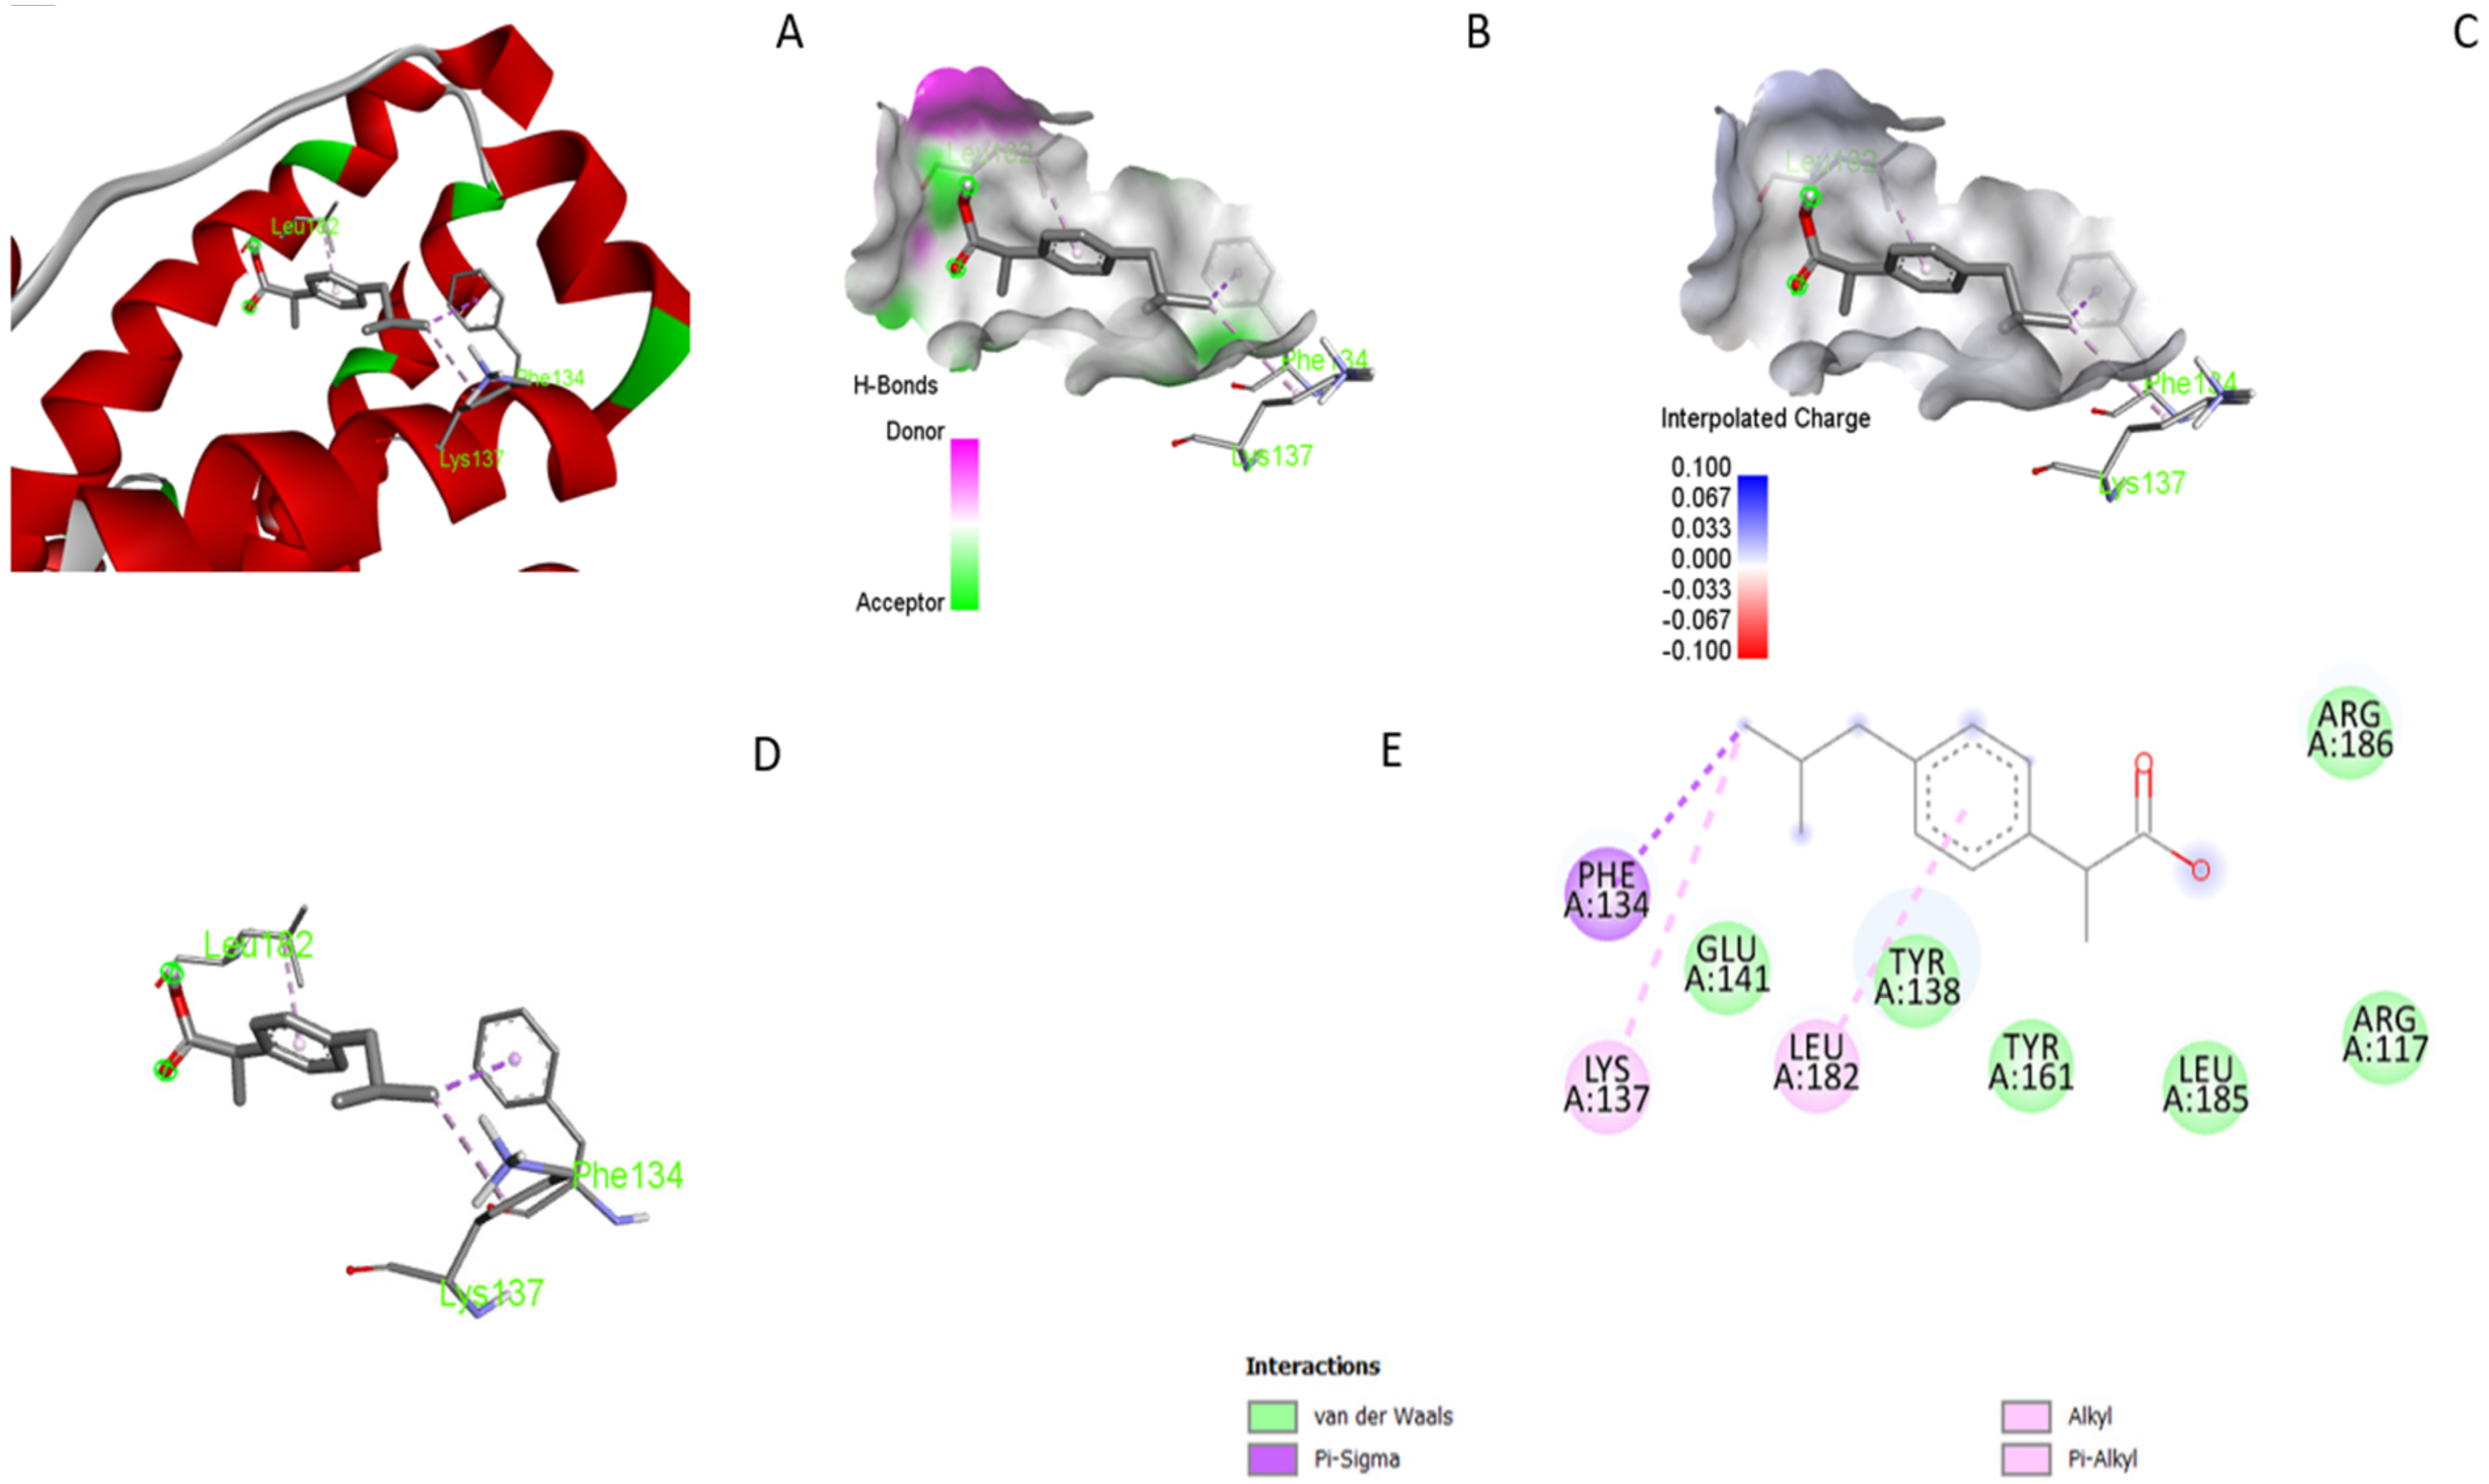
3.5. Molecular Docking

As a result of in silico evaluations with PAZ, BIC, and IBU, docking scores were found to be −10.4 kcal/mol, −9.1 kcal/mol, and −7.1 kcal/mol, respectively (Table 3). Detailed examination of the receptor-ligand interactions showed that PAZ, with the highest binding score, forms hydrogen bonds with ARG186 and HIS146 and a pi-sulfur bond (Figure 9). BIC-receptor interactions occur with ARG117 and LEU182 residues. Both residues form hydrogen bonds with the ligand. Unlike the other two drugs, BIC has fluorine atoms, and it forms halogen (fluorine) bonds with the PHE134 and VAL116 residues (Figure 10). IBU, with the lowest docking score, establishes its relationship with the receptor through van der Waals interactions (Figure 11).

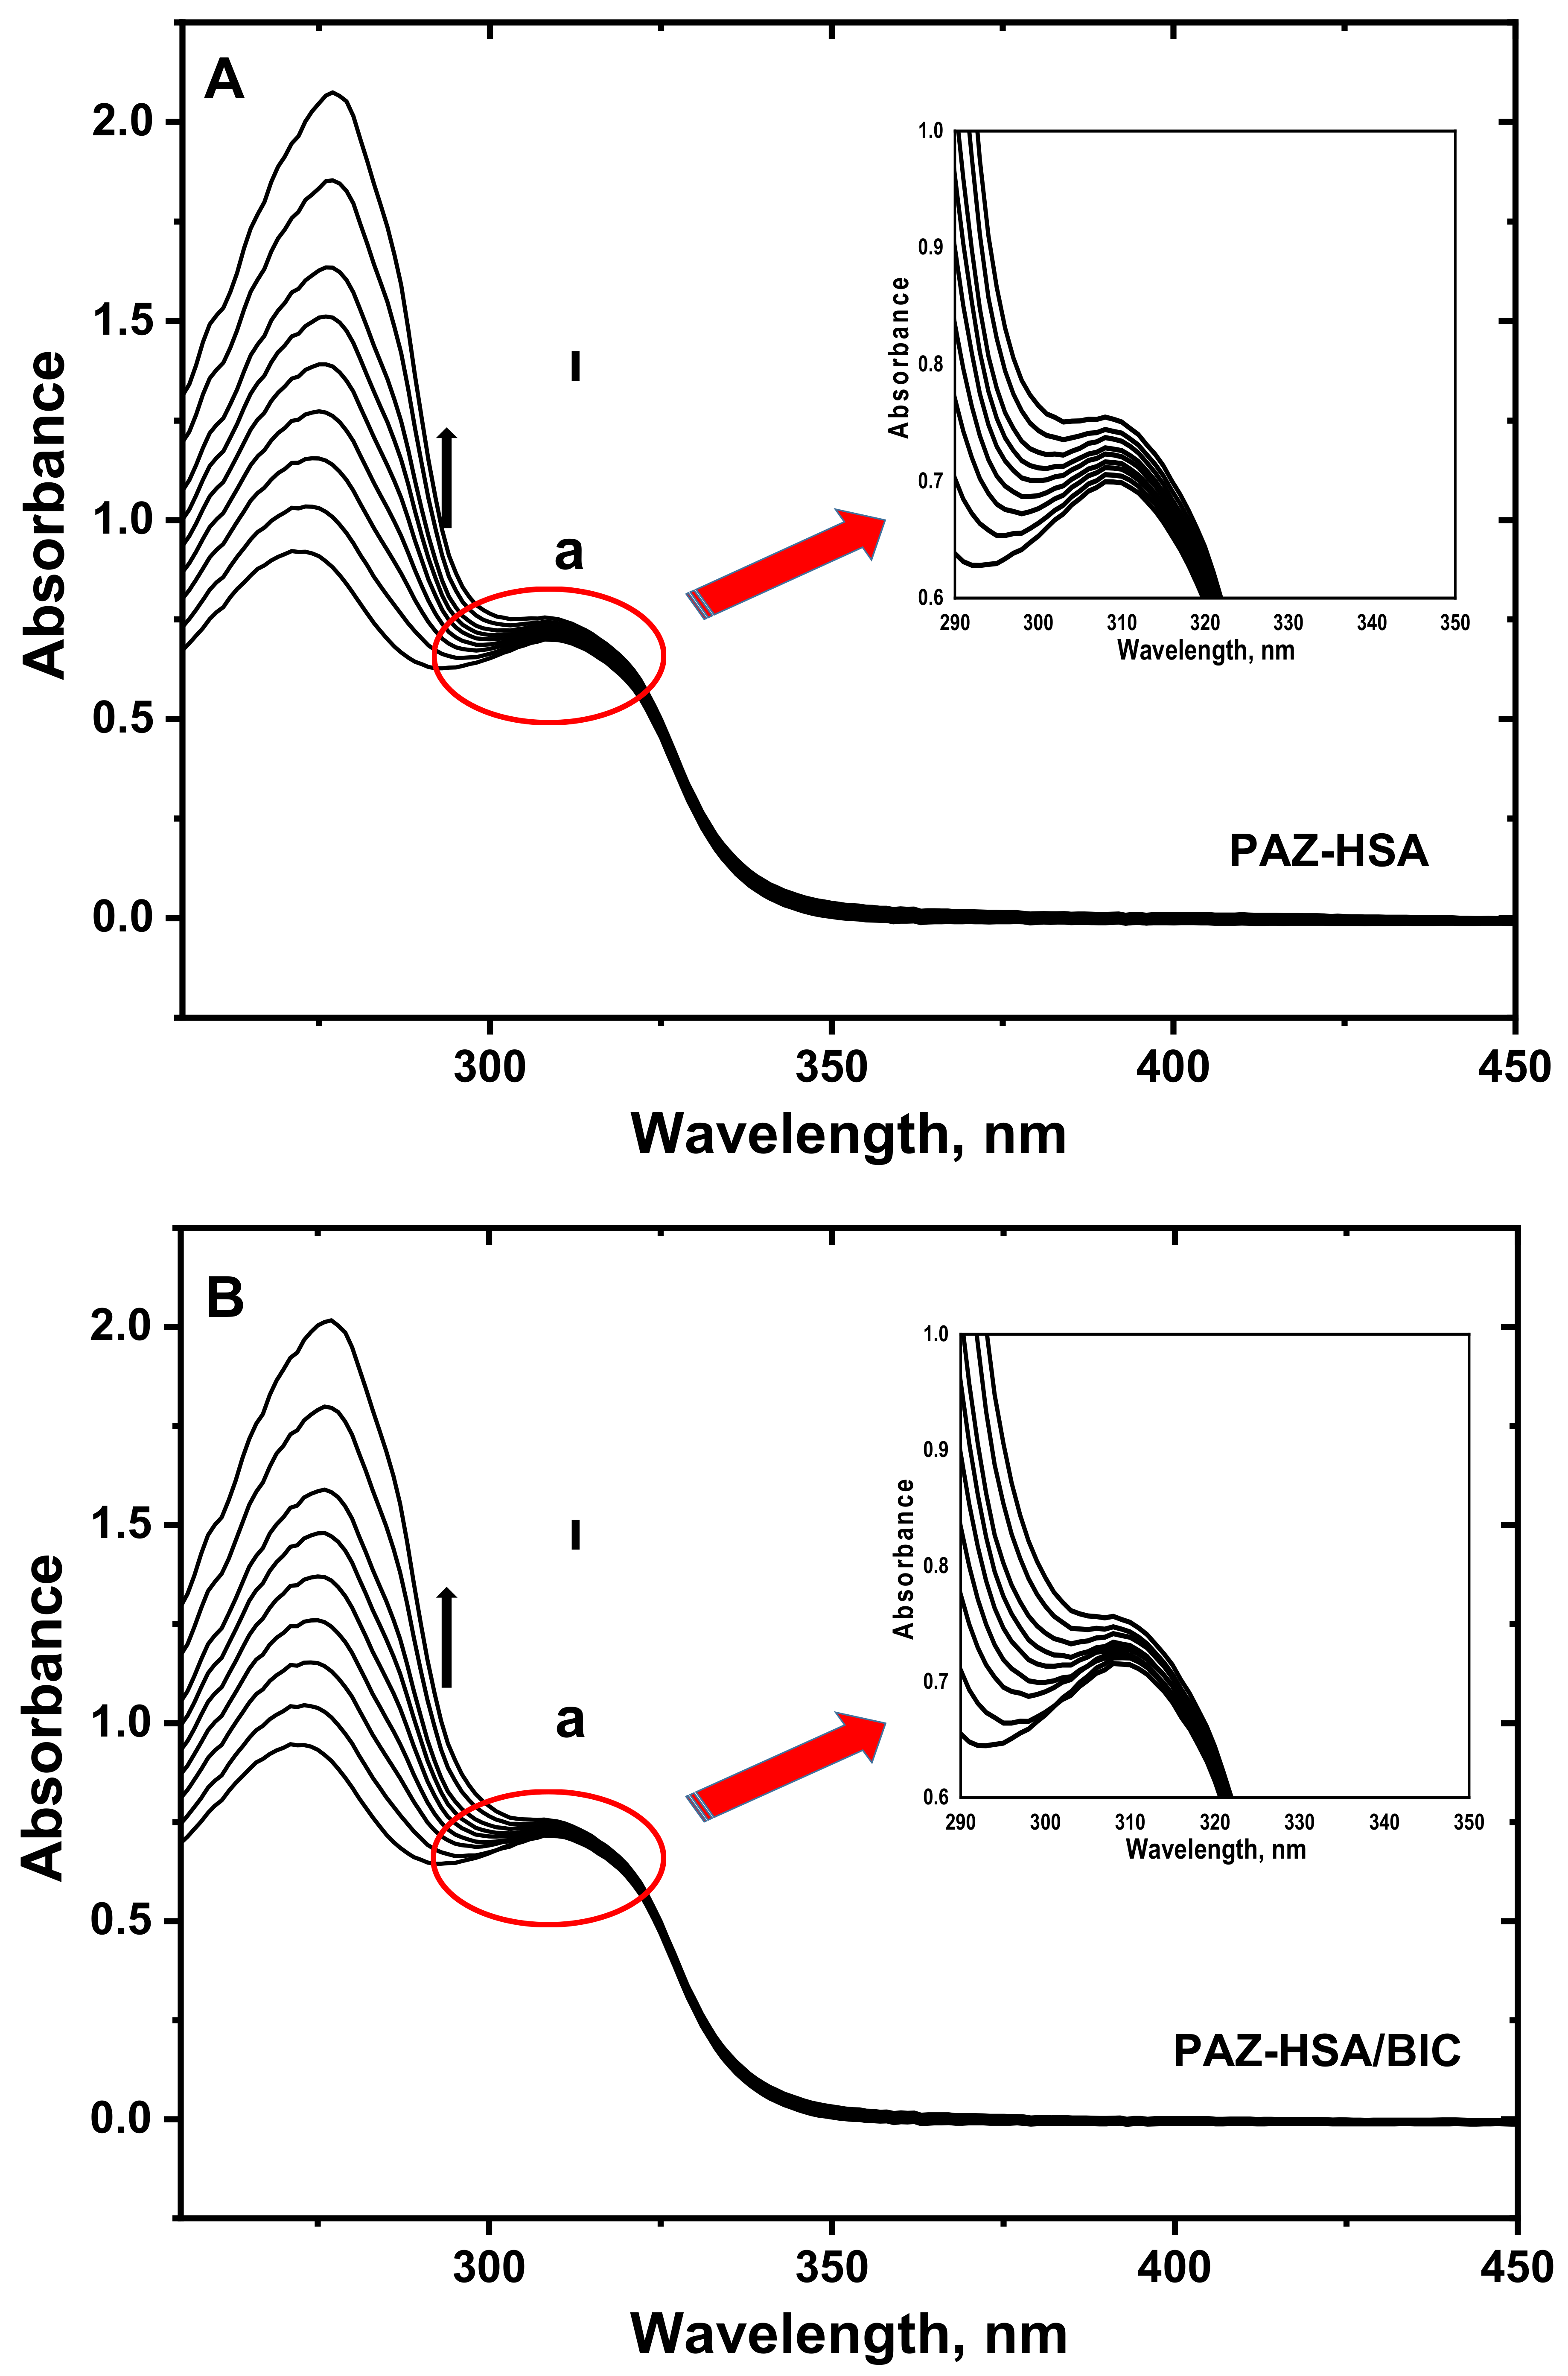
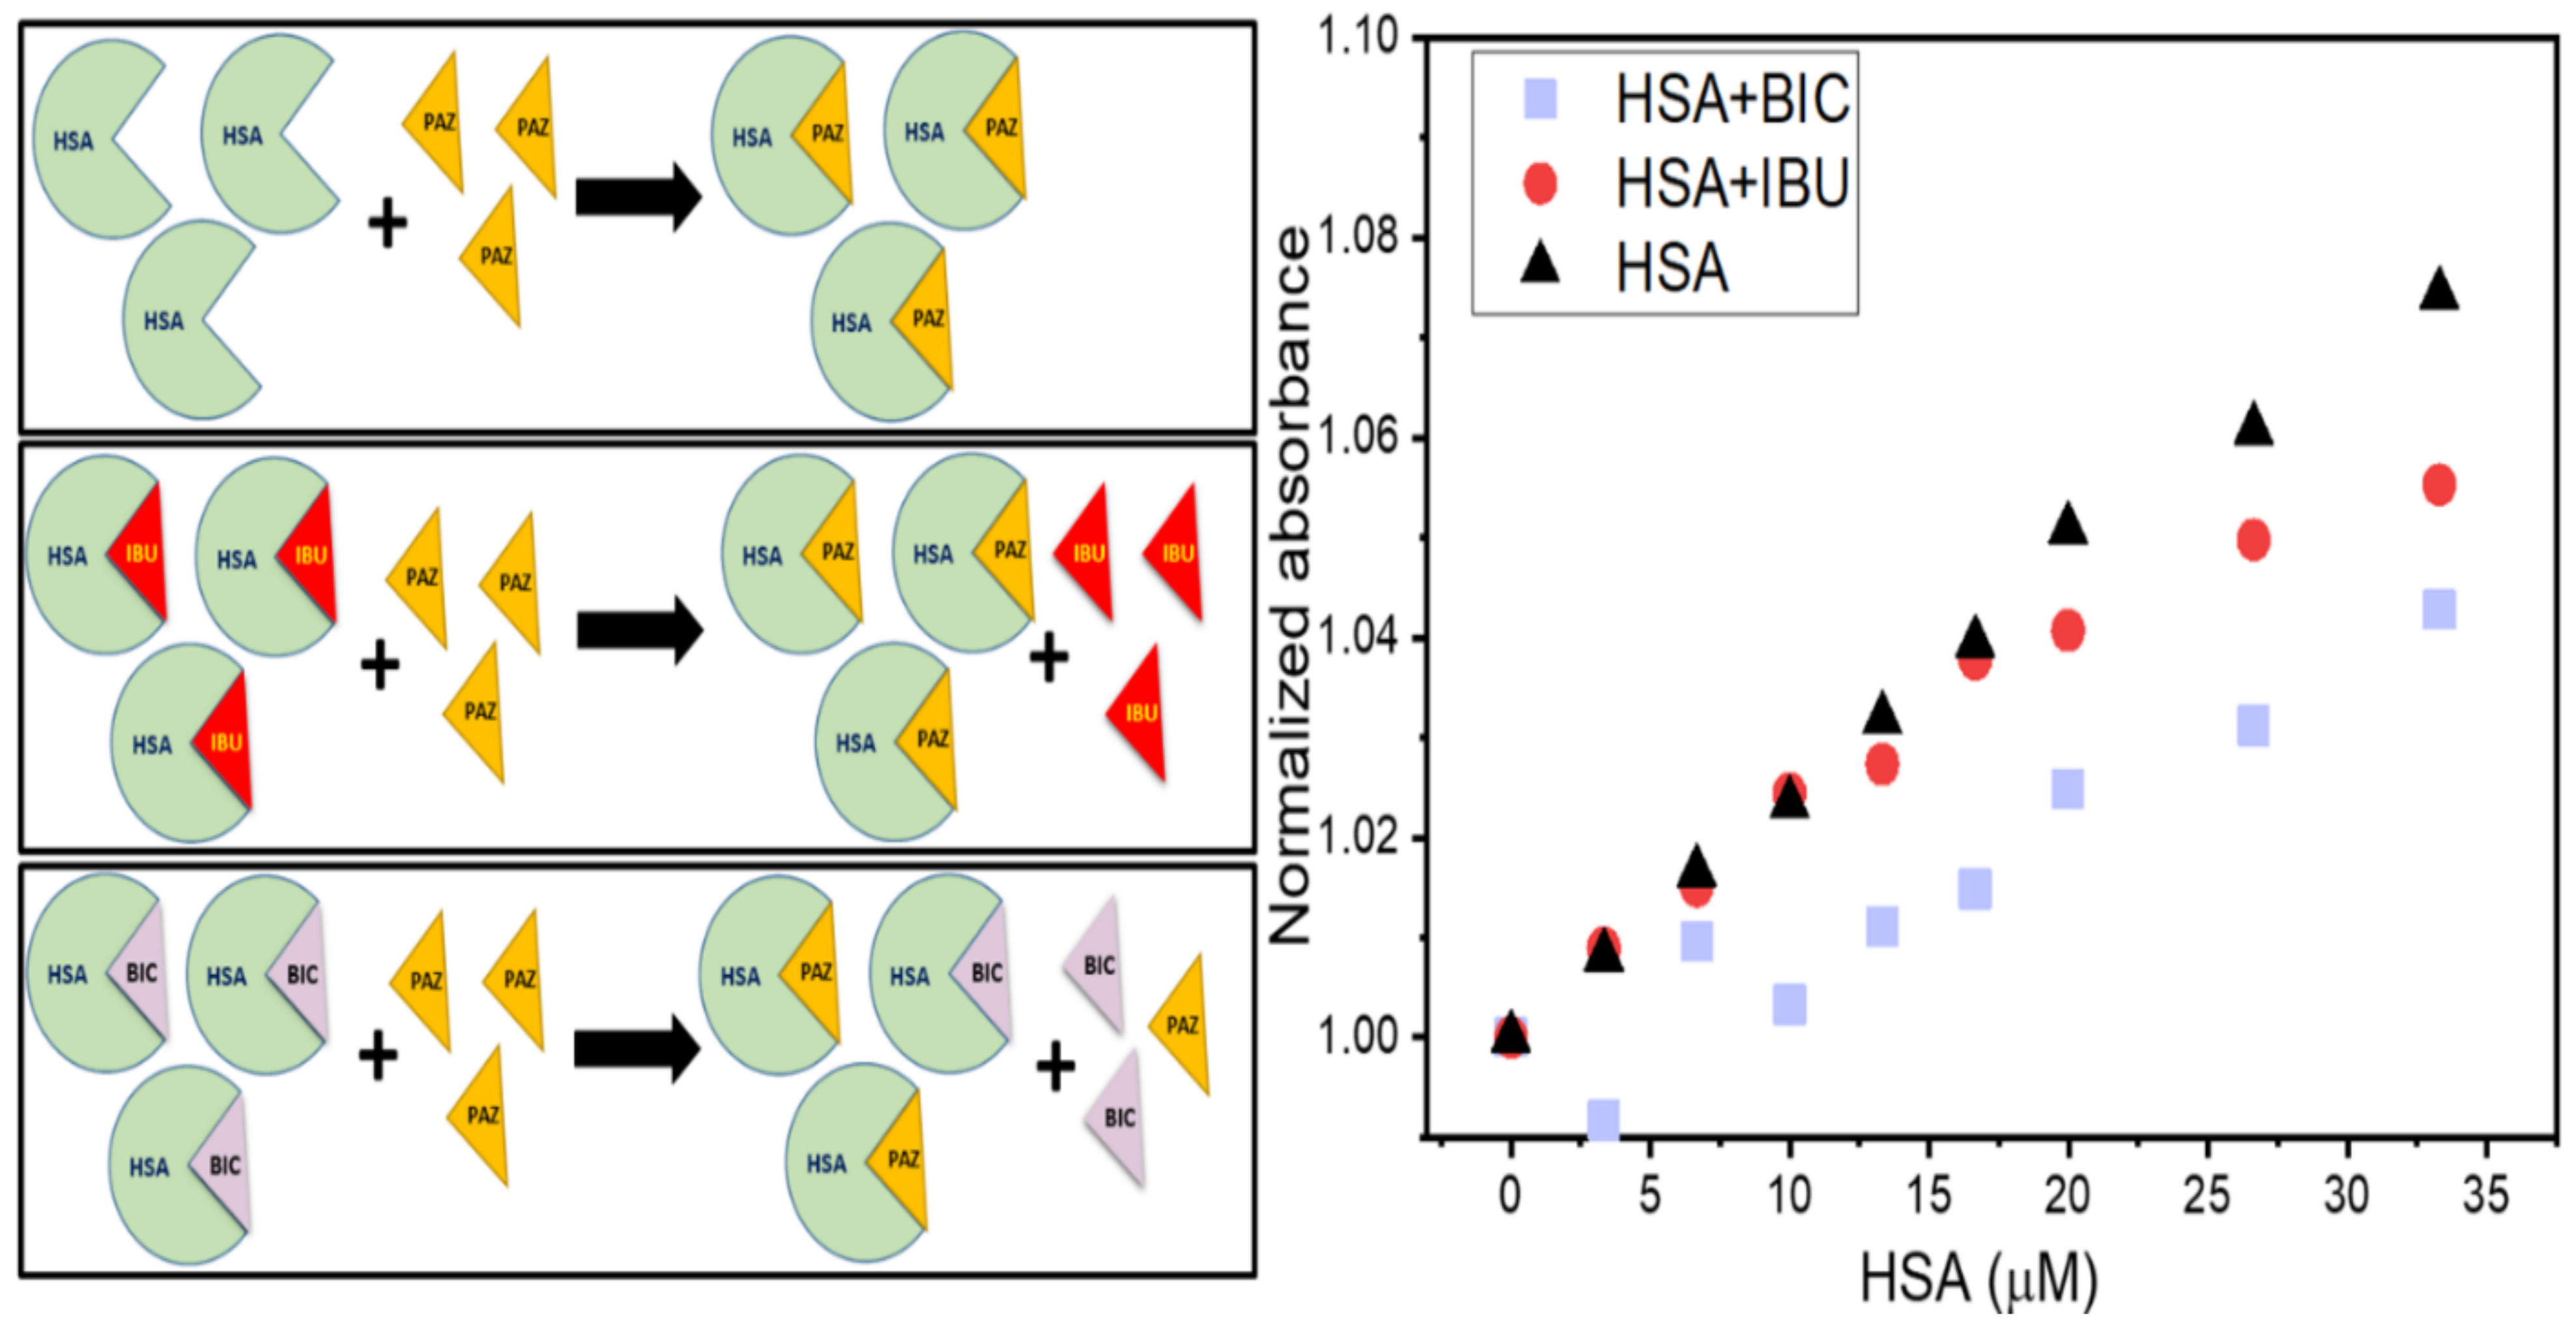
3.6. UV–Visible Absorption Spectroscopy

UV absorption spectroscopy is used to evaluate the formation of complexes between drugs and globular proteins. Two absorption maxima were observed at around 280 nm and 310 nm in the PAZ spectrum (Figure 12A), which was examined with respect to increasing HSA concentrations. Since HSA does not absorb wavelengths above 300 nm, the changes in that region were tracked to infer the binding interaction. Accordingly, the binding of PAZ to HSA caused a slight hyperchromic shift above 300 nm.
The competitive binding of PAZ to HSA was examined in the presence of two chosen model drugs, namely, IBU and BIC, which bind to HSA (Figure 13). For this analysis, high concentrations of IBU and BIC (1.0 mM) were mixed with HSA (0.9 mM) separately. Portions of these mixtures that include HSA with concentrations ranging from 3.3 µM to 33 µM and 1.1-fold competitor were then added to 30 µM PAZ, followed by the absorption measurement. The peak intensity at around 310 nm increased with HSA addition (Figure 12). Interestingly, the same peak and increase in the intensity were observed with the addition of HSA-BIC and HSA-IBU mixtures, revealing that PAZ can replace competitors on the HSA binding site (Figure 12B,C and Figure 13). The absorbance values of PAZ mixed with HSA are closer to that of PAZ mixed with HSA-IBU than that of HSA-BIC (Figure 13). This indicates a higher replacement of IBU but a lower replacement of BIC by PAZ. These results are corroborated by molecular docking calculations, where the docking scores of BIC and PAZ were found to correspond to a similar degree of affinity for HSA.

4. Conclusions

In this study, the interaction of PAZ with HSA, a transport protein, was investigated using various spectroscopic techniques. Fluorescence emission of HSA at 288 K, 298 K, 310 K, and 318 K was quenched in the presence of PAZ. The binding of PAZ to HSA was proved by thermodynamic parameters and a high binding constant calculated from fluorescence quenching data. A decrease in the binding constant with increasing temperature represents static quenching. Molecular docking calculations yielded a higher docking score for PAZ than BIC and IBU, which were chosen as model competing drugs. PAZ and BIC interact with the receptor by hydrogen bonding. IBU was found to interact with HSA only through van der Waals interactions. In addition to hydrogen bonding, PAZ and BIC form pi–sulfur and halogen bonds. The results obtained from the experimental data and theoretical calculations are in agreement. ARG186 and HIS146 residues for PAZ and ARG117, LEU182, VAL116, and PHE134 residues for BIC play an important role in receptor–ligand interactions. In particular, the roles of HIS146, with which PAZ interacts through pi–sulfur bonding, and VAL116 and PHE134, with which BIC forms halogen bonds, are critical in terms of their contribution to the interaction. A mutation in these residues will significantly affect drug interactions and, subsequently, transportation in the body.
Circular dichroism spectroscopy measurements showed that the secondary structure of HSA was slightly affected when PAZ was added at a 2-fold higher concentration with respect to HSA and retained the α-helix as the dominant conformation. This research provides fundamental insight into the molecular interaction of HSA with PAZ and may help to understand disease and therapy conditions and drug efficacy.

Author Contributions

Conceptualization, A.C., M.G.C., M.A.U., P.B.; methodology, A.C., M.G.C., M.A.U., P.B.; software, A.C., M.G.C., M.A.U., P.B.; validation, A.C., M.G.C., M.A.U.; formal analysis, A.C., M.G.C., M.A.U., P.B.; ınvestigation, A.C., M.G.C., M.A.U., P.B., resources, A.C., M.G.C., M.A.U., P.B.; data curation, A.C., M.G.C., M.A.U., P.B.; writing—original draft preparation, A.C., M.G.C., M.A.U., P.B., C.E., E.B.A.; writing—review and editing, C.E., E.B.A., S.A.O.; supervision, S.A.O.; project administration, S.A.O.; funding acquisition, S.A.O. All authors have read and agreed to the published version of the manuscript.

Funding

This research received no external funding.

Institutional Review Board Statement

Not applicable.

Informed Consent Statement

Not applicable.

Data Availability Statement

Not applicable.

Acknowledgments

Ahmet Cetinkaya thanks the Council of Higher Education 100/2000 (YOK) under the programme 100/2000 and the Scientific and Technological Research Council of Turkey (TUBITAK) under BIDEB/2211-A PhD Scholarship Programmes for financial support.

Conflicts of Interest

The authors declare no conflict of interest.

References

  1. Beljanski, V. Pazopanib. In xPharm: The Comprehensive Pharmacology Reference; Elsevier BV: Amsterdam, The Netherlands, 2010; pp. 1–5. [Google Scholar]
  2. Pazopanib. In Meyler’s Side Effects of Drugs; Elsevier BV: Amsterdam, The Netherlands, 2016; pp. 537–540.
  3. Zhang, L.; Liu, Y.; Wang, Y. Interaction between an (−)-epigallocatechin-3-gallate-copper complex and bovine serum albumin: Fluorescence, circular dichroism, HPLC, and docking studies. Food Chem. 2019, 301, 125294. [Google Scholar] [CrossRef] [PubMed]
  4. Radha, A.; Singh, A.; Sharma, L.; Thakur, K.K. Molecular interactions of acebutolol hydrochloride to human serum albumin: A combined calorimetric, spectroscopic and molecular modelling approach. Mater. Today Proc. 2021, 44, 1700–1706. [Google Scholar] [CrossRef]
  5. Singh, I.; Luxami, V.; Paul, K. Spectroscopy and molecular docking approach for investigation on the binding of nocodazole to human serum albumin. Spectrochim. Acta Part A Mol. Biomol. Spectrosc. 2020, 235, 118289. [Google Scholar] [CrossRef] [PubMed]
  6. Patel, R.; Singh, B.; Sharma, A.; Saraswat, J.; Dohare, N.; Parray, M.U.D.; Siddiquee, A.; Alanazi, A.M.; Khan, A.A. Interaction and esterase activity of albumin serums with orphenadrine: A spectroscopic and computational approach. J. Mol. Struct. 2021, 1239, 130522. [Google Scholar] [CrossRef]
  7. Sonpavde, G.; Hutson, T.E. Pazopanib: A novel multitargeted tyrosine kinase inhibitor. Curr. Oncol. Rep. 2007, 9, 115–119. [Google Scholar] [CrossRef] [PubMed]
  8. Tunç, S.; Çetinkaya, A.; Duman, O. Spectroscopic investigations of the interactions of tramadol hydrochloride and 5-azacytidine drugs with human serum albumin and human hemoglobin proteins. J. Photochem. Photobiol. B Biol. 2013, 120, 59–65. [Google Scholar] [CrossRef] [PubMed]
  9. Ariga, G.G.; Naik, P.N.; Chimatadar, S.A.; Nandibewoor, S.T. Interactions between epinastine and human serum albumin: Investigation by fluorescence, UV–vis, FT–IR, CD, lifetime measurement and molecular docking. J. Mol. Struct. 2017, 1137, 485–494. [Google Scholar] [CrossRef]
  10. Rajdev, P.; Mondol, T.; Makhal, A.; Pal, S.K. Simultaneous binding of anti-tuberculosis and anti-thrombosis drugs to a human transporter protein: A FRET study. J. Photochem. Photobiol. B Biol. 2011, 103, 153–158. [Google Scholar] [CrossRef] [PubMed]
  11. Xiong, X.; He, J.; Yang, H.; Tang, P.; Tang, B.; Sun, Q.; Li, H. Investigation on the interaction of antibacterial drug moxifloxacin hydrochloride with human serum albumin using multi-spectroscopic approaches, molecular docking and dynamical simulation. RSC Adv. 2017, 7, 48942–48951. [Google Scholar] [CrossRef] [Green Version]
  12. Wei, Y.; Thyparambil, A.; Latour, R.A. Protein helical structure determination using CD spectroscopy for solutions with strong background absorbance from 190 to 230 nm. Biochim. Biophys. Acta (BBA) Proteins Proteom. 2014, 1844, 2331–2337. [Google Scholar] [CrossRef] [PubMed] [Green Version]
  13. Martínez, L.; Andrade, R.; Birgin, E.G.; Martínez, J.M. Software News and Update Packmol: A Package for Building Initial Configurations for Molecular Dynamics Simulations. J. Comput. Chem. 2012, 30, 2157–2164. [Google Scholar] [CrossRef] [PubMed]
  14. Eftink, M.R.; Ghiron, C.A. Fluorescence quenching studies with proteins. Anal. Biochem. 1981, 114, 199–227. [Google Scholar] [CrossRef]
  15. Castellan, G.W. Physical Chemistry, 3rd ed.; Addison-Wesley Publishing Company: San Francisco, CA, USA, 1983; pp. 103–138. [Google Scholar]
  16. Menezes, T.M.; Neto, A.M.D.S.; Gubert, P.; Neves, J.L. Effects of human serum albumin glycation on the interaction with the tyrosine kinase inhibitor pazopanib unveiled by multi-spectroscopic and bioinformatic tools. J. Mol. Liq. 2021, 340, 116843. [Google Scholar] [CrossRef]
Figure 1. Chemical structure of pazopanib (PAZ).
Analytica 03 00011 g001
Figure 2. (A) Fluorescence spectra of 20.0 µM HSA in the presence of PAZ with concentrations varying from 0.5 µM to 36.0 µM at pH 7.4 and 298.15 K. (B) Corresponding binding isotherm and fitting curve (F0: initial fluorescence intensity, Ff: final fluorescence intensity).
Analytica 03 00011 g002
Figure 3. (A) Fluorescence spectra of 20.0 µM human serum albumin (HSA) in the presence of PAZ with concentrations varying from 0.5 µM to 36.0 µM at pH 7.4 and 288.15 K. (B) Corresponding binding isotherm and fitting curve (F0: initial fluorescence intensity, Ff: final fluorescence intensity).
Analytica 03 00011 g003
Figure 4. (A) Fluorescence spectra of 20.0 µM human serum albumin (HSA) in the presence of PAZ with concentrations varying from 0.5 µM to 36.0 µM at pH 7.4 and 310.15 K. (B) Corresponding binding isotherm and fitting curve (F0: initial fluorescence intensity, Ff: final fluorescence intensity).
Analytica 03 00011 g004
Figure 5. (A) Fluorescence spectra of 20.0 µM human serum albumin (HSA) in the presence of PAZ with concentrations varying from 0.5 µM to 36.0 µM at pH 7.4 and 318.15 K. (B) Corresponding binding isotherm and fitting curve (F0: initial fluorescence intensity, Ff: final fluorescence intensity).
Analytica 03 00011 g005
Figure 6. Stern–Volmer plots of HSA–PAZ interaction.
Analytica 03 00011 g006
Figure 7. Van’t Hoff plot of HSA-PAZ interaction (R: 0.999).
Analytica 03 00011 g007
Figure 8. Far-UV CD spectra of 2.5 µM HSA in Tris-HCl buffer solution (pH 7.4) in the absence and presence of 2.5 µM and 5 µM PAZ.
Analytica 03 00011 g008
Figure 9. Three-dimensional representation of the interaction of PAZ with the receptor (A,D). Interactions in this region are strong, as PAZ acts as both an acceptor and donor for hydrogen bonding (B). Receptor-ligand interaction occurs in the neutral region (C). The most significant contributor to the docking score of PAZ is the pi-sulfur bond (E) that occurs in the neutral region. Although the pi bonds are weak interactions, the pi-sulfur interaction here is quite strong since it occurs with the double bond of PAZ.
Analytica 03 00011 g009
Figure 10. Three-dimensional representation of the interaction of BIC with the receptor (A,D). BIC, like PAZ, acts as both acceptor and donor and forms hydrogen bonds with the receptor (B). Therefore, BIC also interacts strongly with the receptor. The regions where BIC and the receptor interact are neutral (C). The close docking scores of BIC and PAZ were attributed to interactions with the PHE134 and VAL116 residues (E) formed through halogen (fluorine) bond, which is also a strong bond pi-sulfur double bond observed in PAZ-HSA.
Analytica 03 00011 g010
Figure 11. Three-dimensional representation of the interaction of IBU with the receptor (A). Although the region where IBU interacts with the receptor is suitable for forming strong hydrogen bonds as both acceptor and donor (B), it cannot form a hydrogen bond with the IBU receptor, nor can interact with the electrophilic regions of the receptor (C). Instead, IBU only contributes to the docking score with van der Waals interactions, 3D (D) and 2D representation (E).
Analytica 03 00011 g011
Figure 12. UV absorption spectra of 30.0 µM PAZ in the presence of HSA with concentrations (a) to (ı): 0, 3.3, 6.6, 9.9, 13.2, 16.5, 19.8, 26.4 and 33.0 µM (A), HSA-BIC (B) and HSA-IBU (C) at 298.15 K.
Analytica 03 00011 g012aAnalytica 03 00011 g012b
Figure 13. Schematic representations of competitive binding of PAZ to HSA in the absence of competitors (above left) and in the presence of IBU (middle left) and BIC (below left); UV absorbance responses of the competitive binding at 310 nm (right).
Analytica 03 00011 g013
Table 1. Stern–Volmer quenching (KSV) constants, regression coefficients (R), and quenching rate (kq) constants at different temperatures and pH 7.4 for the interaction of PAZ with HSA.
T (K)Ksv (M−1)Rkq (M−1·s−1)
288.151.377 × 1050.9951.377 × 1013
298.151.267 × 1050.9931.267 × 1013
310.151.261 × 1050.9941.261 × 1013
318.151.198 × 1050.9931.198 × 1013
Table 2. Binding and thermodynamic parameters for the interaction of HSA with PAZ at different temperatures.
T (K)Ka (M−1)nRΔG°
(kJ mol−1)
ΔH°
(kJ mol−1)
ΔS°
(J mol−1 K−1)
288.152.032 × 1061.0640.995−34.823−28.18723.043
298.151.436 × 1061.0410.999−35.054
310.150.898 × 1061.0470.999−35.330
318.150.675 × 1061.0480.999−35.515
Ka: binding constants calculated from fluorescence titrations; n: number of binding sites calculated from fluorescence titrations.
Table 3. Molecular docking scores of receptor-ligand interactions.
Drug SubstanceDocking Score (kcal/mol)
Pazopanib−10.4
Bicalutamide−9.1
Ibuprofen−7.1
Publisher’s Note: MDPI stays neutral with regard to jurisdictional claims in published maps and institutional affiliations.

