
Signal “Off-On” Biosensor Based on Fluorescence Resonance Energy Transfer (FRET) for Detection of Sorghum Mosaic Virus


1
School of Chemistry and Chemical Engineering, Guangxi University, Nanning 530004, China
2
College of Life Science and Technology, Guangxi University, Nanning 530004, China
3
College of Agriculture, Guangxi University, Nanning 530004, China
4
Guangxi Key Laboratory of Sugarcane Biology, Guangxi University, Nanning 530004, China
*
Author to whom correspondence should be addressed.
Analytica 2022, 3(4), 385-393; https://doi.org/10.3390/analytica3040026
Submission received: 12 September 2022
/
Revised: 9 October 2022
/
Accepted: 9 October 2022
/
Published: 18 October 2022
(This article belongs to the Collection Analytical and Applied Chemistry: the challenges and opportunities for growth in the 21st century)
Abstract
:A fluorescence off-on method for the detection of Sorghum mosaic virus (SrMV) based on fluorescence resonance energy transfer (FRET) was developed in this study. The biosensor was realized by the adsorption of SrMV coat protein (CP) on gold nanoparticle (AuNP) and conjugation of anti-SrMV antibody (Ab) on cadmium telluride quantum dot (CdTe QD). The optimum quenching efficiency was about 50% obtained at a CdTe QD-Ab/AuNP-CP ratio of 1:7. Moreover, the feasibility of the developed biosensor was verified by the detection of purified CP and the limit of detection was estimated as 0.02 μg/mL. This strategy was also successfully applied to monitor SrMV CP in plant sap with a recovery rate between 97.7 and 107.4%. The developed biosensor is a simple, rapid, and efficient technique which does not need excessive washing and separation steps.
1. Introduction
Sorghum mosaic virus (SrMV) is distributed all over the world and acts as a major cause of one of the most destructive and prevalent diseases named sugarcane mosaic disease (SMD) in all the major cane-growing regions of China. SrMV is transmitted non-persistently via aphids, causing symptoms such as stunting and significant yield losses in susceptible varieties that poses a serious threat to the growth of sugarcane [1]. The high incidence of SMD resulted in low seed cane germination (10.6–35.3%), a decrease in cane yield (3–50%) and sucrose content (6–14%), causing monetary losses of USD 30 million annually which severely restricting the sustainability and stability of the sugar industry in China [2]. Considering that SMD has been a considerable challenge worldwide, the availability of rapid methods for SrMV detection is critical so that infected crops can be diagnosed in time and the scale of the epidemic can be minimized.
Currently, various techniques have been established and investigated such as enzyme-linked immunosorbent assay (ELISA) [3], gas chromatography-mass spectrometry (GC-MS), and polymerase chain reaction (PCR) [4,5]. Most of these assays showed high sensitivity and selectivity but required time-consuming washing processes or expensive equipment which greatly limited their practical applications [6]. Therefore, developing a simple, rapid screening technique has always been crucial for recommending efficient control strategies against SrMV.
Owing to the advantages of high sensitivity, good reproducibility, and rapid readout, fluorescent assays have attracted a remarkable deal of attention in recent years [7]. Most of them rely on the fluorescence resonance energy transfer (FRET) phenomenon, which occurs when the distance between the donor and acceptor is comparable to the dimensions of most biological macromolecules (2–9 nm) while the emission spectra of the donor and the absorption spectra of the acceptor are overlapped to a certain extent [8]. Quantum dot (QD) is proudly characterized by inexpensive raw materials, tunable excitation and emission, high luminous intensity, and good resistance to photo-bleaching, these attractive and outstanding properties make QD ideal donors in fluorescent biosensors [9].
On the other hand, gold nanoparticle (AuNP) has frequently functioned as fluorescence quenchers in fluorescent analysis due to its high quenching efficiency in a wide spectral range [10,11,12]. Importantly, AuNP possesses great advantages over traditional organic chromophores including excellent biocompatibility, easy modification, and extremely high extinction coefficient, designating it as a suitable acceptor for FRET [13,14].
FRET-based biosensors have been widely applied in viral agent detection [15,16,17,18,19]. Nevertheless, the study of plant viruses is relatively rare compared with the remarkable achievements in human or animal viruses [20,21]. Following this line of research, we reported a simple sensing platform for SrMV detection with a FRET strategy where cadmium telluride quantum dot (CdTe QD) and AuNP function as donor and acceptor, respectively. SrMV coat protein (CP) can be easily absorbed on the surface of AuNP through Au-S complexation while anti-SrMV antibody (Ab) was attached to CdTe QD through a covalent bond. CdTe QD-Ab and AuNP-CP were further conjugated where an obvious FRET phenomenon can be observed. In the presence of unconjugated CP, the fluorescence intensity of CdTe-QD was restored proportionally to the concentration of the target (Scheme 1). The procedure achieved the simple, sensitive quantification detection of SrMV and could be accomplished within a few minutes.
2. Materials and Methods
2.1. Materials and Apparatus
Cadmium chloride (CdCl2), mercaptoacetic acid (TGA), tellurium (Te) powder, sodium borohydride (NaBH4), 1-(3-dimethyl aminopropyl)-3-ethyl carbodiimide hydrochloride (EDC), sodium citrate, urea, thiourea were purchased from Aladdin (Shanghai, China). Tetrachloroauric acid (HAuCl4) and trisodium citrate were obtained from Beijing Chemical Reagent Company (Beijing, China). All used water was purified by an ultra-pure water purifier (Milli-Q plus 185, Millipore, Bedford, MA, USA).
Transmission electron microscopy (TEM) images of CdTe and AuNP were acquired on a TECNAI G2 F30 (FEI, Hillsboro, OR, USA). Fluorescence spectra were performed with a G9800A Cary Eclipse fluorescence spectrophotometer (Agilent Technologies, Santa Clara, CA, USA). UV–vis absorption spectra were performed using a Shimadzu UV-1800 Ultraviolet-visible spectroscopy spectrophotometer (Shimadzu, Kyoto, Japan). Fourier Transform Infrared (FT-IR) spectra were obtained from Nicolet iS50 (Thermo Scientific, Waltham, MA, USA).
2.2. Synthesis of CdTe QD
CdTe QD in a thiol-capped form was synthesized according to the previous report [22]. 0.3 g NaBH4 was mixed with 0.1 g Te powder in 10 mL water in a reflux system to prepare fresh NaHTe solution. Then, 250 μL TGA and 0.4 g CdCl2·2.5H2O were dissolved in 100 mL water and the mixture was adjusted stepwise to pH 10 by using 1 M NaOH. The freshly prepared NaHTe was added to the above mixture and refluxed at 92 °C for 1 h to obtain CdTe QD. All reflux reactions were carried out in a nitrogen atmosphere. The obtained orange product was purified by deposited with ethanol three times, and finally re-dispersed in 250 mL water and kept at 4 °C in the dark.
2.3. Synthesis of AuNP
AuNP was synthesized according to the Turkevich method [23]. All glassware used in the following procedure was soaked and cleaned with aqua regia and rinsed thoroughly in water. Typically, 100 mL of 1 mM HAuCl4 solution was heated to boiling under stirring and then 10 mL of a 1.14% (w/w) trisodium citrate solution was added quickly. The solution color changed from pale yellow to wine red in a few minutes. Then, the solution was refluxed for another 15 min and cooled to room temperature. After filtration with a 0.22 μm filter, the AuNP solution was stored at 4 °C for further use.
2.4. Conjugation of SrMV Ab and CdTe QD
SrMV Ab was covalently attached to QD using EDC and NHS as activating agents. Briefly, 800 µL prepared CdTe QD solution was incubated with 200 µL of EDC/NHS mixtures at pH 7.4 for 1 h at 37 °C. Subsequently, 50 μL SrMV CP (0.1 mg/mL) was added to the solution and reacted for 2 h at 4 °C. BSA solution (1%, w/w) was added to the above mixture for occupying the unblocking activated carboxyl on the CdTe QD. Excess unreacted CdTe QD was separated by centrifugation at 12,000 rpm for 5 min and the upper phase was kept at 4 °C until use.
2.5. Conjugation of SrMV CP and AuNP
Fifty microliters SrMV CP (0.1 mg/mL) was mixed with 500 μL AuNP under stirring for 1 h at room temperature (pH = 8.5). The successful combination of AuNP and SrMV CP was verified by a UV–visible spectrophotometer.
2.6. Determination of Quenching Efficiency
In order to explore the optimal FRET efficiency, AuNP-CP in different concentrations were sequentially added to a constant concentration of CdTe QD-Ab. In other words, the immune complex in different ratios of CdTe QD-Ab/AuNP-CP (1:1–1:9) was investigated.
2.7. Quantitative Detection of Purified CP
For the determination of purified CP, CdTe QD-Ab and AuNP-CP in the optimum ratio were mixed in PBS buffer (pH = 7.4) at room temperature for 5 min to ensure a sufficient reaction between antibody and antigen. The fluorescence spectra of the CdTe QD were acquired at an excitation wavelength of 360 nm (The optimized data were shown in Figure S1). Afterward, purified SrMV CP solution in various concentrations was incubated with the mixture for 10 min and the response fluorescence was recorded again. Both excitation and emission slits were 5 nm.
To investigate the feasibility of the proposed method for biological samples, sap from healthy plants spiked with different concentrations of SrMV CP was examined.
3. Results
3.1. Morphological and Spectral Characterizations of CdTe QD and AuNP
TEM images were employed to qualitatively study the morphology and size of the prepared nanomaterials. As shown in Figure 1a, the synthesized CdTe QD was spherical and well dispersed with an average diameter of 3 nm. According to the relationship between the particle size of nanoparticles and their absorption coefficient [24], the concentration of CdTe QD solution was estimated as 3.2 μM. The quantum yield (QY) of the prepared CdTe QD was calculated to be 15.8% by using quinine sulfate as the standard reference (QY = 54% in 0.1 M H2SO4 solution). Figure 1b demonstrated the AuNP was uniform and monodisperse with an average diameter of 13 nm. The concentration of AuNP was determined to be about 9 nM based on a molar extinction coefficient of 2.7 × 10⁸ M−1 cm−1 at λ = 520 nm for 13 nm AuNP [25].
To investigate the capability of CdTe QD and AuNP as FRET donor and acceptor pairs, the fluorescence emission spectra of CdTe QD and the UV–vis absorption spectra of AuNP were tested (Figure 2). The results showed appreciable spectral overlap indicating the potential to achieve an efficient FRET phenomenon [26].
The functional groups on the surface of the synthesized nanomaterials were studied using FT-IR spectra and the results were shown in Figure 3. For CdTe QD, the characteristic absorption peaks that appeared at 3350 cm−1 and 1642 cm−1 were assigned to the stretching vibration of O-H and stretching vibrations of C=O, respectively. The peaks at 2975 cm−1 and 1410 cm−1 were attributed to C-H. The peak associated with the stretching vibrations of C-S can be found at 1045 cm−1 which confirmed the successful modification of TGA. AuNP exhibited characteristic absorption bands standing for the stretching vibrations of O-H at 3470 cm−1, stretching vibrations of C=O at 1640 cm−1, and C-H bending vibrations at 735 cm−1. The FT-IR results mentioned above demonstrated that the surfaces of nanomaterials were coated with carboxylic groups and hydroxyl groups which provide a platform for stable interaction with the proteins and other biomolecules.
3.2. Characterization of Bioconjugate
To verify the formation of CdTe QD-Ab and AuNP-CP conjugate, spectrophotometric analysis was performed. As shown in Figure 4a, the unconjugated CdTe-QD and CdTe QD-Ab exhibited their respective absorption peaks at 501 nm and 506 nm while their maximum OD values were 0.76 a.u. and 0.61 a.u., respectively. The maximum peak shift and OD decrease confirmed that the antibody was successfully modified to the surface of CdTe QD via the amidation reaction [27]. Analogously, the UV–vis absorption spectra of AuNP-CP displayed a shift (from 339 nm to 333 nm) in maximum peak and a decrease (from 0.32 a.u. to 0.25 a.u.) in OD in comparison with AuNP suggesting the adsorption of the antigen to the surface of the AuNP (Figure 4b). It is worth mentioning that adsorption was driven by electrostatic interaction and realized based on the Au-S complexation between AuNP and cysteine residues of the proteins [28].
3.3. Principle Validation
Consistent with our design, based on the antibody–antigen interaction, CdTe QD-Ab and AuNP-CP formed an immune complex where the donor and acceptor come in proximity leading to an obvious FRET phenomenon. Upon the introduction of unlabeled CP, the CdTe QD-Ab was released from the surface of the AuNP due to competitive replacement, which disrupted the FRET process and recovered the quenched fluorescence of CdTe QD (Figure 5). Therefore, an effective FRET-based biosensor can be constructed based on the fluorescent “off-on” of CdTe QD.
3.4. FRET Efficiency
Deemed to be the committed step of the assay, the effect of the immune complex at different donor-acceptor proportions on the FRET efficiency has been investigated (Figure 6a). The FRET efficiency was expressed by E = 1 − Ft/F0, where Ft and F0 represent the fluorescence intensity of CdTe QD in the presence and absence of the acceptor, respectively. As shown in Figure 6b, the best quenching efficiency of the donor was observed at a CdTe QD-Ab/AuNP-CP ratio of 1:7 where the antibody reached saturation of binding sites. At proportions lower than 1:7, excess CdTe QD-Ab was directly bound to the free CP and the effective concentration of antigen which participated in competitive replacement decreased, resulting in the underestimation of the target concentration. At proportions higher than 1:7, the existence of excessive AuNP-CP required higher amounts of free CP to overcome the competitive replacement in binding sites of the antibody, which may lead to a false-negative result [29].
3.5. Optimization for the Biosensor
To achieve the optimal sensing condition, parameters including medium pH and incubation time were further studied. Medium pH affected the surface charge of the protein and further influenced the formation of the immune complex. Considering that the low pH value will seriously quench the fluorescence of thiol-capped CdTe QD [30], the fluorescence intensity of the immune complex and pure CdTe QD-Ab was tested under varying pH (5–10). Figure 7a showed the maximal fluorescence quenching was obtained at pH = 8. The sensing procedure could be completed rapidly. As shown in Figure 7b, the fluorescence of the immune complex showed no obvious changes after 5 min of incubation, suggesting that the interactions between antibody and antigen reached saturation within 5 min.
3.6. Feasibility Verification
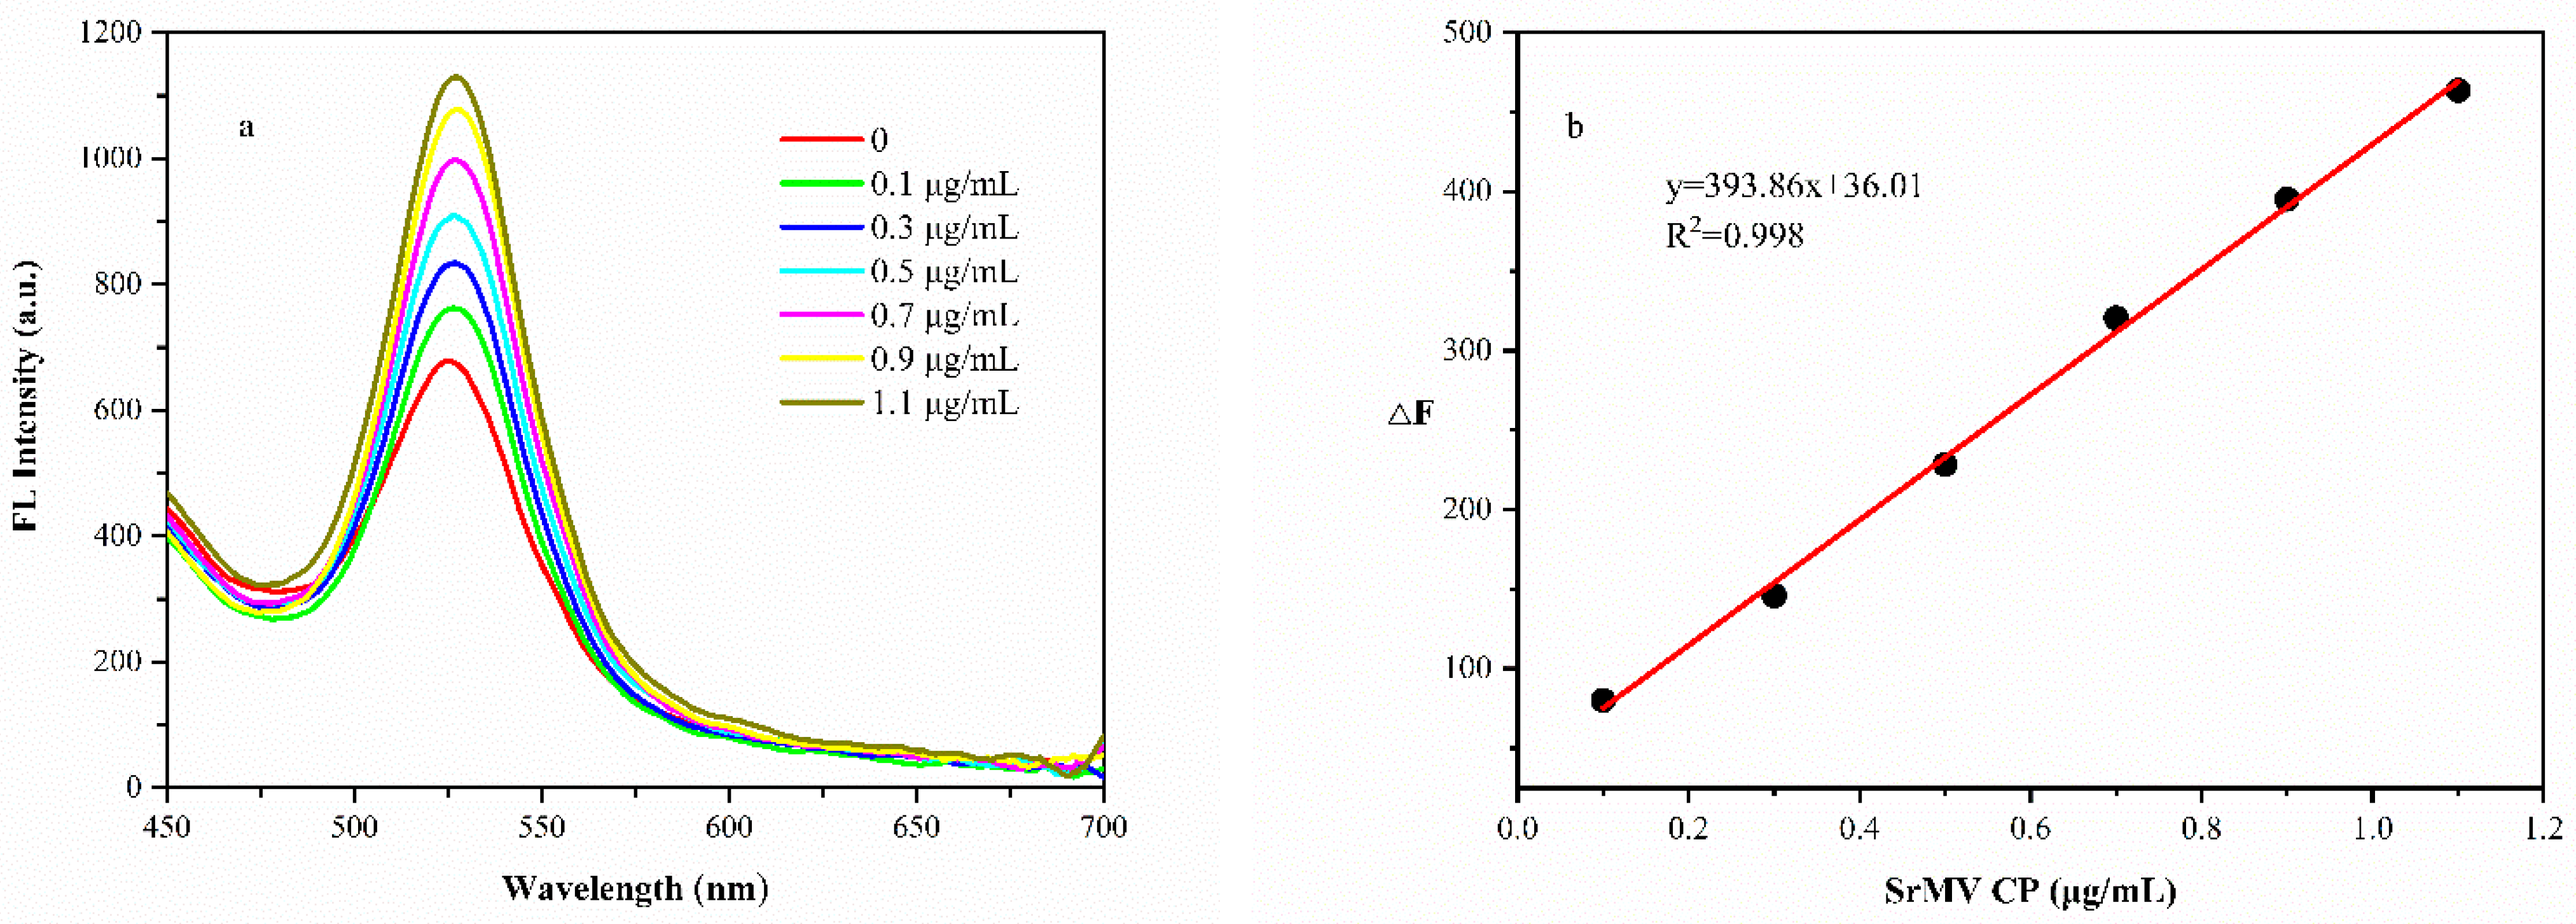
The fluorescence spectra in the presence of different amounts of SrMV under the optimum proportion were shown in Figure 8a. Upon the addition of purified CP from 0.1 μg/mL to 1.1 μg/mL, the emission intensity of CdTe QD increased gradually accompanied by the increasing target concentrations. The corresponding linear equation is y = 393.86x + 36.01 with a correlation coefficient R2 of 0.998 (Figure 8b). The limit of detection (LOD) was estimated at 0.02 μg/mL (LOD = 3S0/K, where S0 is the standard deviation of blank measurements (n = 3) and K is the slope of the calibration curve).
The feasibility of this biosensor was investigated by detecting the known concentrations of SrMV CP in the plant sap. As shown in Table 1, the good recoveries ranging from 97.7% to 107.4% with an RSD of 6.35% to 8.45% suggested the accuracy and reliability of the developed biosensor for SrMV detection.
4. Conclusions
By taking the advantages of CdTe QD and AuNP, we developed a fluorescence off-on strategy for SrMV detection. Under the optimum conditions, SrMV CP could be quantified with a detection limit of 0.22 μg/mL. The recovery of the spiked samples ranged between 97.7% and 107.4%, verifying the feasibility of the developed biosensor in the complicated biological environment. We demonstrate that the reported assay showed great potential for SrMV diagnosis in large-scale screening procedures. However, further studies are required to test the ability of the developed biosensor for detecting SrMV in field samples and compare the sensitivity of this system with conventional detection techniques.
Supplementary Materials
The following supporting information can be downloaded at: https://www.mdpi.com/article/10.3390/analytica3040026/s1. Figure S1. (a) Fluorescence and (b) maximum emission intensity of CdTe QD at different excitation wavelengths; Figure S2. Fluorescence recovery of the biosensor towards 0.5 μg/mL and 1 μg/mL SrMV CP over 1-week period.
Author Contributions
Conceptualization, X.H.; supervision, X.H. and B.C.; funding acquisition, R.W. and B.C.; writing—original draft, Z.H. and P.D. All authors have read and agreed to the published version of the manuscript.
Funding
This research was funded by the Department of Science and Technology of Guangxi Zhuang Autonomous Region (AD17129002) and the Key projects of Guangxi natural science fund (NO. 2017GXNSFDA198041) and the Nanning key R & D program (NO. 20201071).
Data Availability Statement
Not applicable.
Conflicts of Interest
The authors declare no conflict of interest.
References
- Li, W.F.; Shan, H.L.; Zhang, R.Y.; Wang, X.Y.; Yang, K.; Luo, Z.M.; Yin, J.; Cang, X.Y.; Li, J.; Huang, Y.K. Identification of resistance to Sugarcane streak mosaic virus (SCSMV) and Sorghum mosaic virus (SrMV) in new elite sugarcane varieties/clones in China. Crop Prot. 2018, 110, 77–82. [Google Scholar] [CrossRef]
- Wang, X.Y.; Li, W.F.; Huang, Y.K.; Zhang, R.Y.; Shan, H.L.; Yin, J.; Luo, Z.M. Molecular detection and phylogenetic analysis of viruses causing mosaic symptoms in new sugarcane varieties in China. Eur. J. Plant Pathol. 2017, 148, 931–940. [Google Scholar] [CrossRef]
- Chen, H.; Lin, Y.F.; Ali, N.; Lv, W.Z.; Shen, Y.N.; Chen, B.S.; Wen, R.H. Comparison of IC-RT-PCR, Dot-ELISA and Indirect-ELISA for the detection of Sorghum mosaic virus in field-grown sugarcane plants. Sugar Tech. 2019, 22, 122–129. [Google Scholar] [CrossRef]
- Ling, H.; Huang, N.; Xu, L.; Peng, Q.; Liu, F.; Yang, Y.; Que, Y. Suitable Reference Genes/miRNAs for qRT-PCR Normalization of Expression Analysis in Sugarcane Under Sorghum mosaic virus infection. Sugar Tech. 2019, 21, 780–793. [Google Scholar] [CrossRef]
- Martinelli, F.; Scalenghe, R.; Davino, S.; Panno, S.; Scuderi, G.; Ruisi, P.; Villa, P.; Stroppiana, D.; Boschetti, M.; Goulart, L.R.; et al. Advanced methods of plant disease detection. A review. Agron. Sustain. Dev. 2014, 35, 1–25. [Google Scholar] [CrossRef] [Green Version]
- Keizerweerd, A.T.; Chandra, A.; Grisham, M.P. Development of a reverse transcription loop-mediated isothermal amplification (RT-LAMP) assay for the detection of Sugarcane mosaic virus and Sorghum mosaic virus in sugarcane. J. Virol. Methods 2015, 212, 23–29. [Google Scholar] [CrossRef] [PubMed] [Green Version]
- Chen, G.; Song, F.; Xiong, X.; Peng, X. Fluorescent Nanosensors Based on Fluorescence Resonance Energy Transfer (FRET). Ind. Eng. Chem. Res. 2013, 52, 11228–11245. [Google Scholar] [CrossRef]
- Imani, M.; Mohajeri, N.; Rastegar, M.; Zarghami, N. Recent advances in FRET-Based biosensors for biomedical applications. Anal. Biochem. 2021, 630, 114323. [Google Scholar] [CrossRef]
- Cardoso Dos Santos, M.; Algar, W.R.; Medintz, I.L.; Hildebrandt, N. Quantum dots for Förster Resonance Energy Transfer (FRET). TrAC Trends Anal. Chem. 2020, 125, 115819. [Google Scholar] [CrossRef]
- Yu, L.; Andriola, A. Quantitative gold nanoparticle analysis methods: A review. Talanta 2010, 82, 869–875. [Google Scholar] [CrossRef] [PubMed]
- Wang, Y.; Ma, J.; Li, H.; Zhou, J.; Zhang, H.; Fu, L. A sensitive immunosensor based on FRET between gold nanoparticles and InP/ZnS quantum dots for arginine kinase detection. Food Chem. 2021, 354, 129536. [Google Scholar] [CrossRef]
- Deng, J.; Lu, Q.; Hou, Y.; Liu, M.; Li, H.; Zhang, Y.; Yao, S. Nanosensor composed of nitrogen-doped carbon dots and gold nanoparticles for highly selective detection of cysteine with multiple signals. Anal. Chem. 2015, 87, 2195–2203. [Google Scholar] [CrossRef] [PubMed]
- Shi, Y.P.; Pan, Y.; Zhang, H.; Zhang, Z.M.; Li, M.J.; Yi, C.Q.; Yang, M.S. A dual-mode nanosensor based on carbon quantum dots and gold nanoparticles for discriminative detection of glutathione in human plasma. Biosens. Bioelectron. 2014, 56, 39–45. [Google Scholar] [CrossRef]
- Sabela, M.; Balme, S.; Bechelany, M.; Janot, J.-M.; Bisetty, K. A Review of Gold and Silver Nanoparticle-Based Colorimetric Sensing Assays. Adv. Eng. Mater. 2017, 19, 1700270. [Google Scholar] [CrossRef]
- Shojaei, T.R.; Salleh, M.A.M.; Sijam, K.; Rahim, R.A.; Mohsenifar, A.; Safarnejad, R.; Tabatabaei, M. Fluorometric immunoassay for detecting the plant virus Citrus tristeza using carbon nanoparticles acting as quenchers and antibodies labeled with CdTe quantum dots. Microchim. Acta 2016, 183, 2277–2287. [Google Scholar] [CrossRef]
- Sabzehparvar, F.; Cherati, T.R.; Mohsenifar, A.; Shojaei, T.R.; Tabatabaei, M. Immobilization of gold nanoparticles with rhodamine to enhance the fluorescence resonance energy transfer between quantum dots and rhodamine; new method for downstream sensing of infectious bursal disease virus. Spectrochim. Acta A 2019, 212, 173–179. [Google Scholar] [CrossRef]
- Cheng, S.; Liao, L.S.; Sun, J.; Ye, Y.Y.; Yang, J.X.; Cao, C.F.; Lv, J.Q.; Fang, L.R.; Wu, F.; Lin, Y.X.; et al. A new immunoassay of serum antibodies against Peste des petits ruminants virus using quantum dots and a lateral-flow test strip. Anal. Bioanal. Chem. 2017, 409, 133–141. [Google Scholar] [CrossRef]
- Shen, W.; Gao, Z. Quantum dots and duplex-specific nuclease enabled ultrasensitive detection and serotyping of Dengue viruses in one step in a single tube. Biosens. Bioelectron. 2015, 65, 327–332. [Google Scholar] [CrossRef] [PubMed]
- Feng, T.; Fang, J.; Guo, Y.C.; Tao, Y.; Han, X.L.; Hua, Y.X.; Wang, J.J.; Li, L.Y.; Jian, Y.L.; Xie, G. A target-triggered biosensing platform for detection of HBV DNA based on DNA walker and CHA. Anal. Biochem. 2018, 554, 16–22. [Google Scholar] [CrossRef]
- Hong, S.; Lee, C. The Current Status and Future Outlook of Quantum Dot-Based Biosensors for Plant Virus Detection. Plant Pathol. J. 2018, 34, 85–92. [Google Scholar] [CrossRef] [PubMed]
- Khater, M.; Escosura-Muniz, A.d.l.; Merkoci, A. Biosensors for plant pathogen detection. Biosens. Bioelectron. 2017, 93, 72–86. [Google Scholar] [CrossRef] [PubMed] [Green Version]
- Shanehsaz, M.; Mohsenifar, A.; Hasannia, S.; Pirooznia, N.; Samaei, Y.; Shamsipur, M. Detection of Helicobacter pylori with a nanobiosensor based on fluorescence resonance energy transfer using CdTe quantum dots. Microchim. Acta 2012, 180, 195–202. [Google Scholar] [CrossRef]
- Liu, W.; Zhang, D.; Tang, Y.; Wang, Y.; Yan, F.; Li, Z.; Wang, J.; Zhou, H.S. Highly sensitive and selective colorimetric detection of cartap residue in agricultural products. Talanta 2012, 101, 382–387. [Google Scholar] [CrossRef]
- Yu, W.W.; Qu, L.H.; Guo, W.Z.; Peng, X.G. Experimental Determination of the Extinction Coefficient of CdTe, CdSe, and CdS Nanocrystals. Chem. Mater. 2003, 15, 2854–2860. [Google Scholar] [CrossRef]
- Yeh, K.C.; Chiang, Y.; Chang, S.W. Full Atomistic Simulation of Cross-Linked Gold Nanoparticle Assemblies. Multiscale Sci. Eng. 2020, 2, 242–251. [Google Scholar] [CrossRef]
- Stanisavljevic, M.; Krizkova, S.; Vaculovicova, M.; Kizek, R.; Adam, V. Quantum dots-fluorescence resonance energy transfer-based nanosensors and their application. Biosens. Bioelectron. 2015, 74, 562–574. [Google Scholar] [CrossRef] [PubMed]
- Shojaei, T.R.; Salleh, M.A.; Sijam, K.; Rahim, R.A.; Mohsenifar, A.; Safarnejad, R.; Tabatabaei, M. Detection of Citrus tristeza virus by using fluorescence resonance energy transfer-based biosensor. Spectrochim. Acta A 2016, 169, 216–222. [Google Scholar] [CrossRef]
- Ruiz, G.; Tripathi, K.; Okyem, S.; Driskell, J.D. pH Impacts the Orientation of Antibody Adsorbed onto Gold Nanoparticles. Bioconjug. Chem. 2019, 30, 1182–1191. [Google Scholar] [CrossRef] [PubMed]
- Zekavati, R.; Safi, S.; Hashemi, S.J.; Rahmani-Cherati, T.; Tabatabaei, M.; Mohsenifar, A.; Bayat, M. Highly sensitive FRET-based fluorescence immunoassay for aflatoxin B1 using cadmium telluride quantum dots. Microchim. Acta 2013, 180, 1217–1223. [Google Scholar] [CrossRef]
- Wang, S.; Mamedova, N.; Kotov, N.A.; Wei, C.; Studer, J.J.N.L. Antigen/Antibody Immunocomplex from CdTe Nanoparticle Bioconjugates. Nano Lett. 2002, 2, 817–822. [Google Scholar] [CrossRef]
Scheme 1.
Assay mechanism of the developed biosensor.
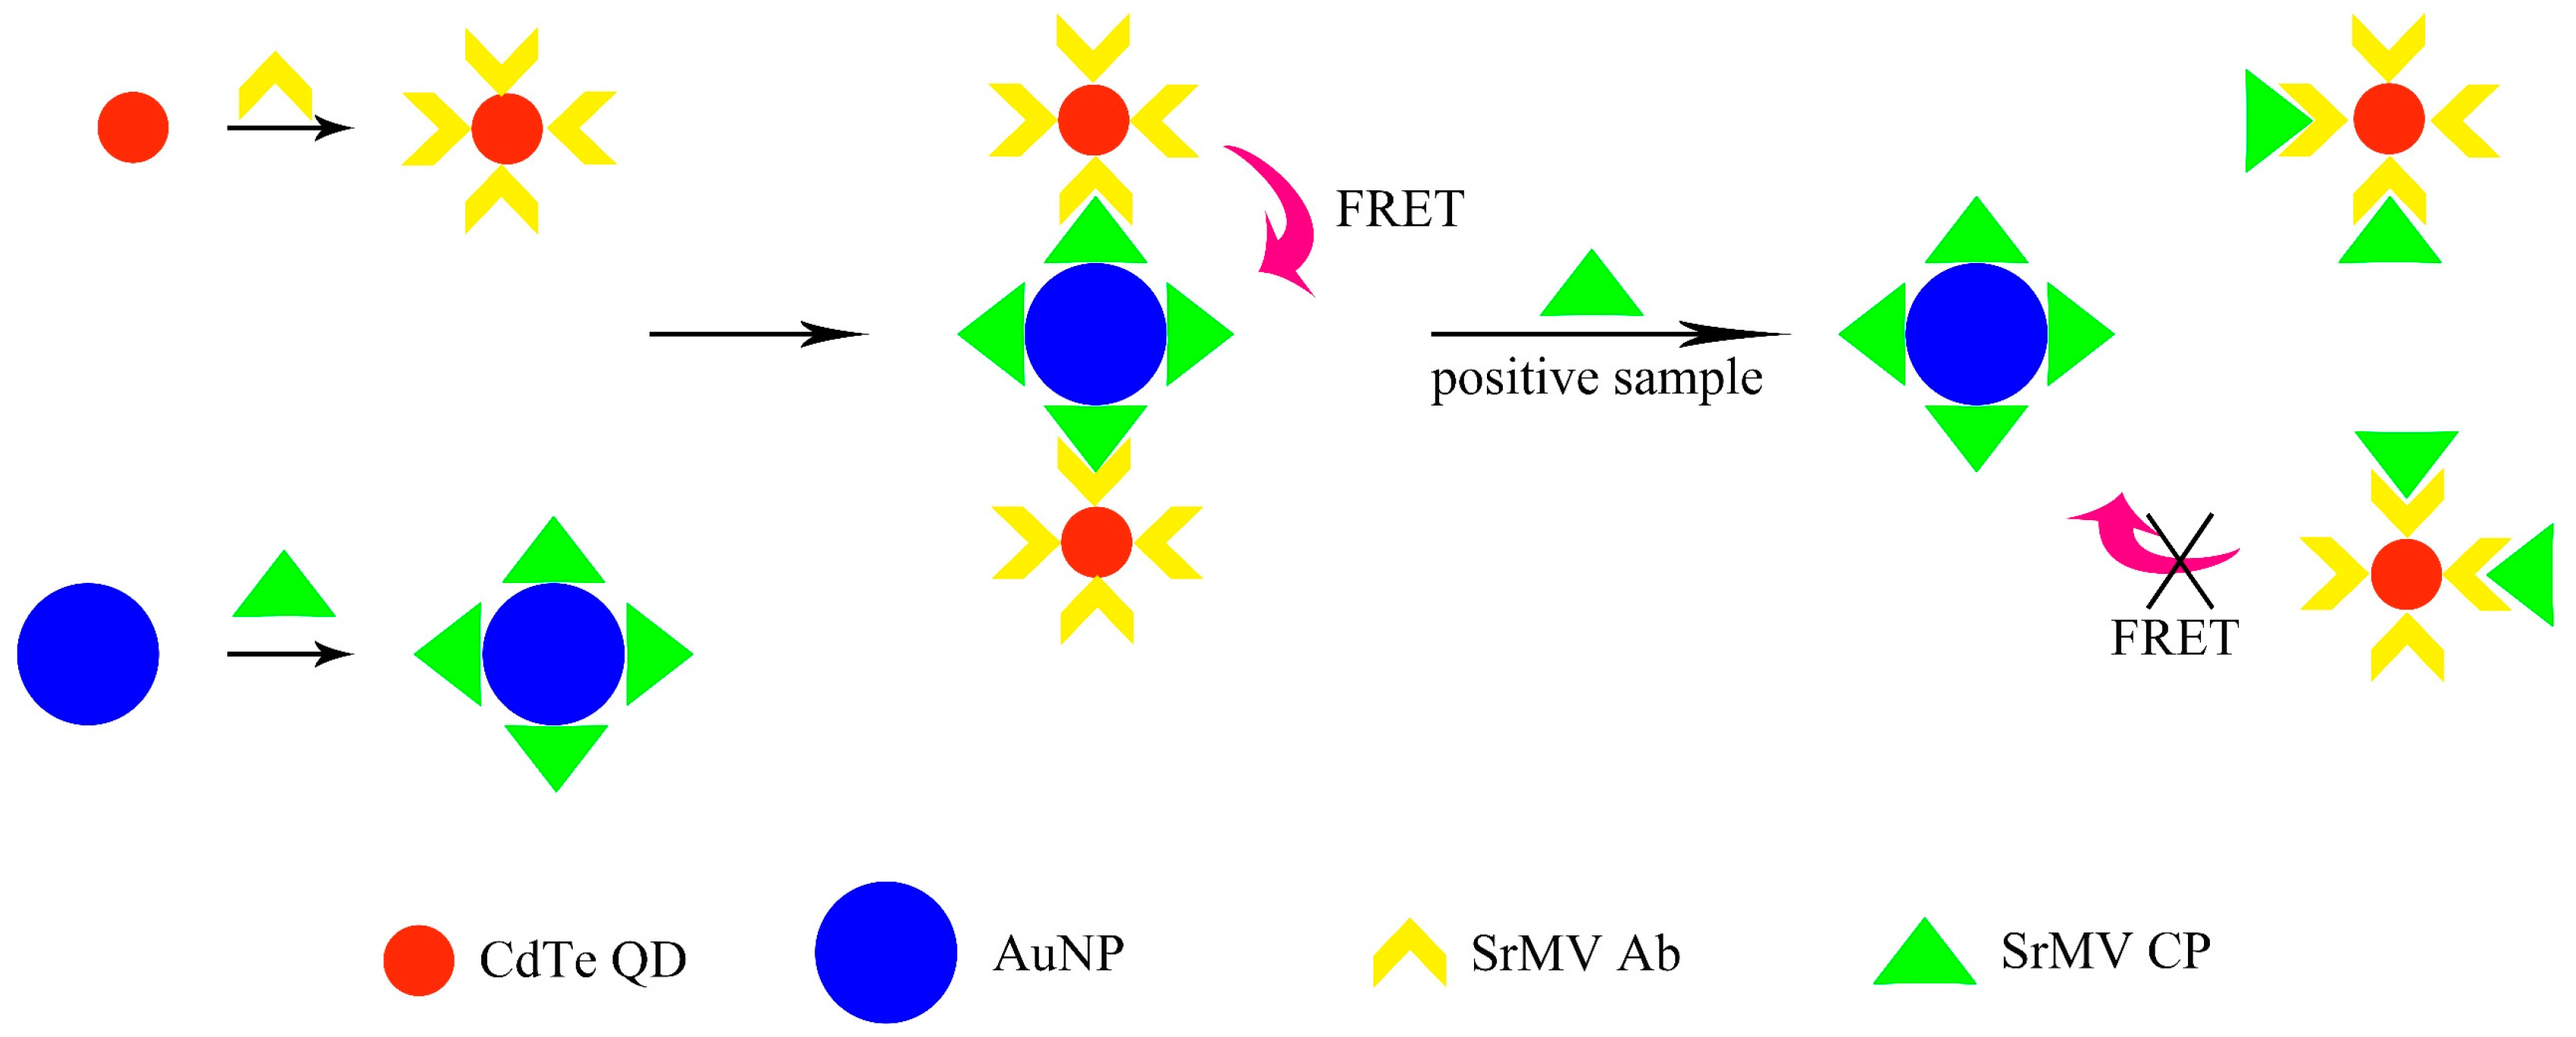
Figure 1.
TEM images of synthesized CdTe QD (a) and AuNP (b).
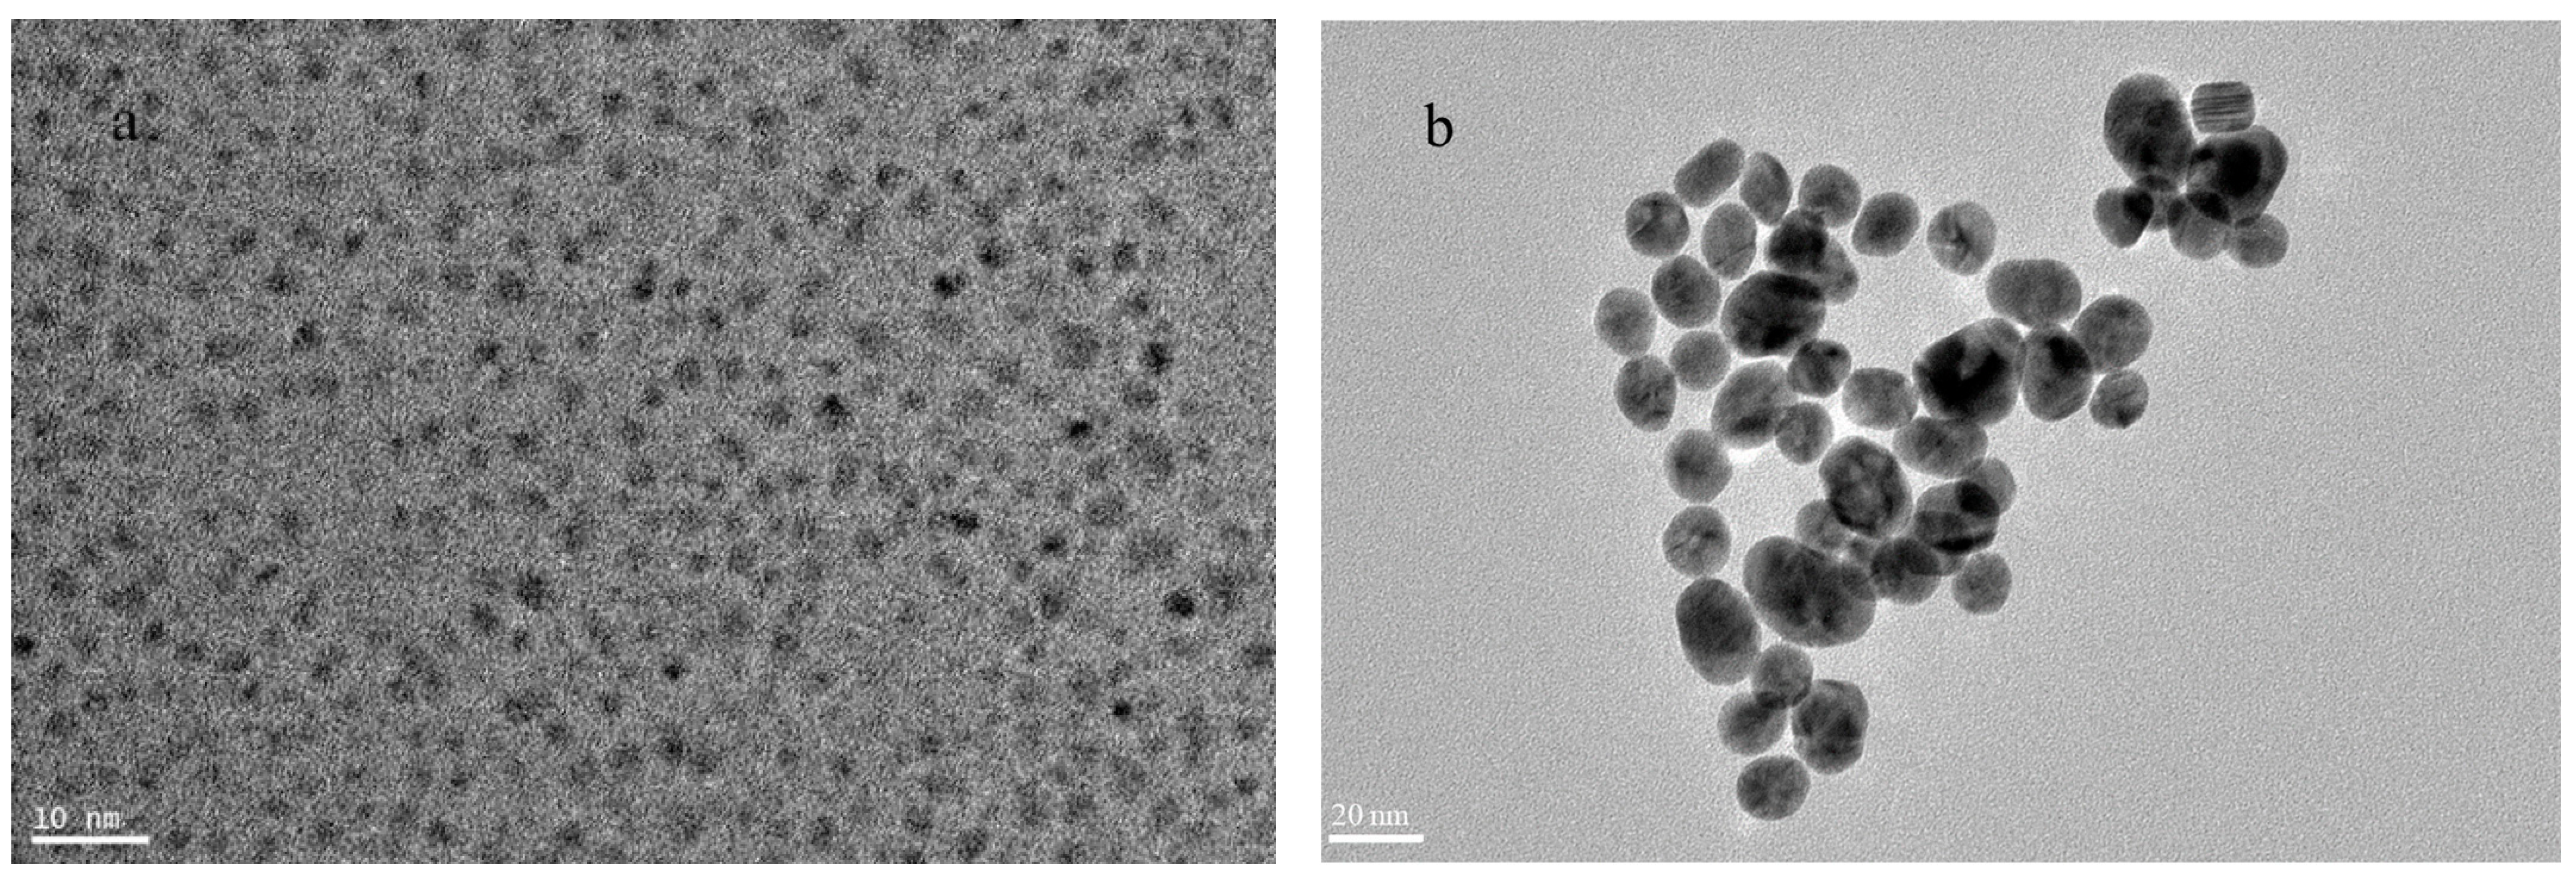
Figure 2.
Overlap between CdTe QD emission spectrum and AuNP absorption spectrum.

Figure 3.
FT-IR spectra of CdTe QD and AuNP.
Figure 4.
UV–vis absorption spectra of CdTe QD (a) and AuNP (b) before and after conjugated with corresponding proteins.
Figure 4.
UV–vis absorption spectra of CdTe QD (a) and AuNP (b) before and after conjugated with corresponding proteins.

Figure 5.
Fluorescence spectra of CdTe QD-Ab, CdTe QD-Ab + AuNP-CP and CdTe QD-Ab + AuNP-CP + pure CP.
Figure 5.
Fluorescence spectra of CdTe QD-Ab, CdTe QD-Ab + AuNP-CP and CdTe QD-Ab + AuNP-CP + pure CP.
Figure 6.
Quenched fluorescence (a) and FRET efficiency (b) of the developed biosensor at different proportions of CdTe QD-Ab and AuNP-CP.
Figure 6.
Quenched fluorescence (a) and FRET efficiency (b) of the developed biosensor at different proportions of CdTe QD-Ab and AuNP-CP.
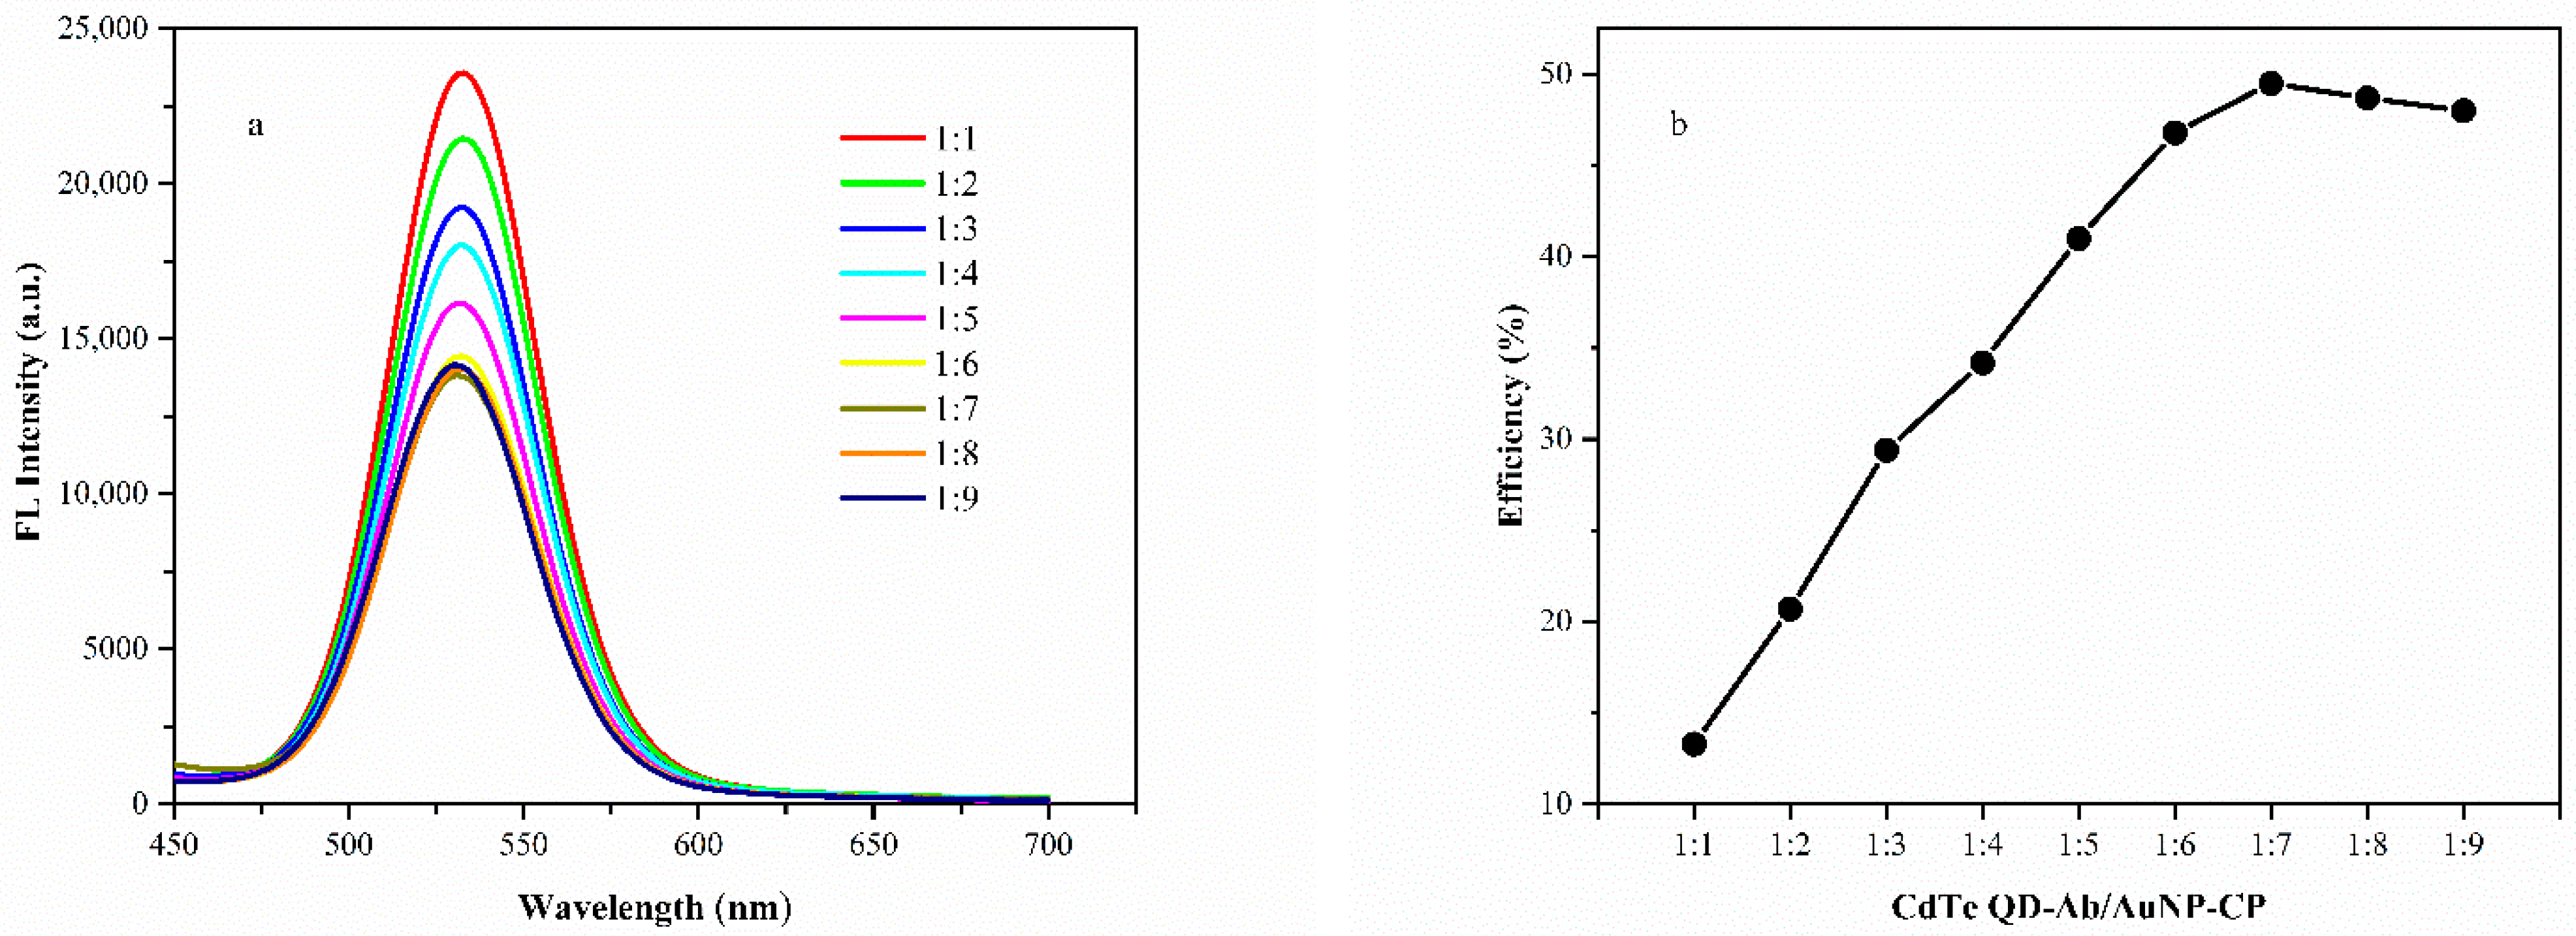
Figure 7.
(a) buffer pH and (b) incubation time optimization for the best FRET efficiency.
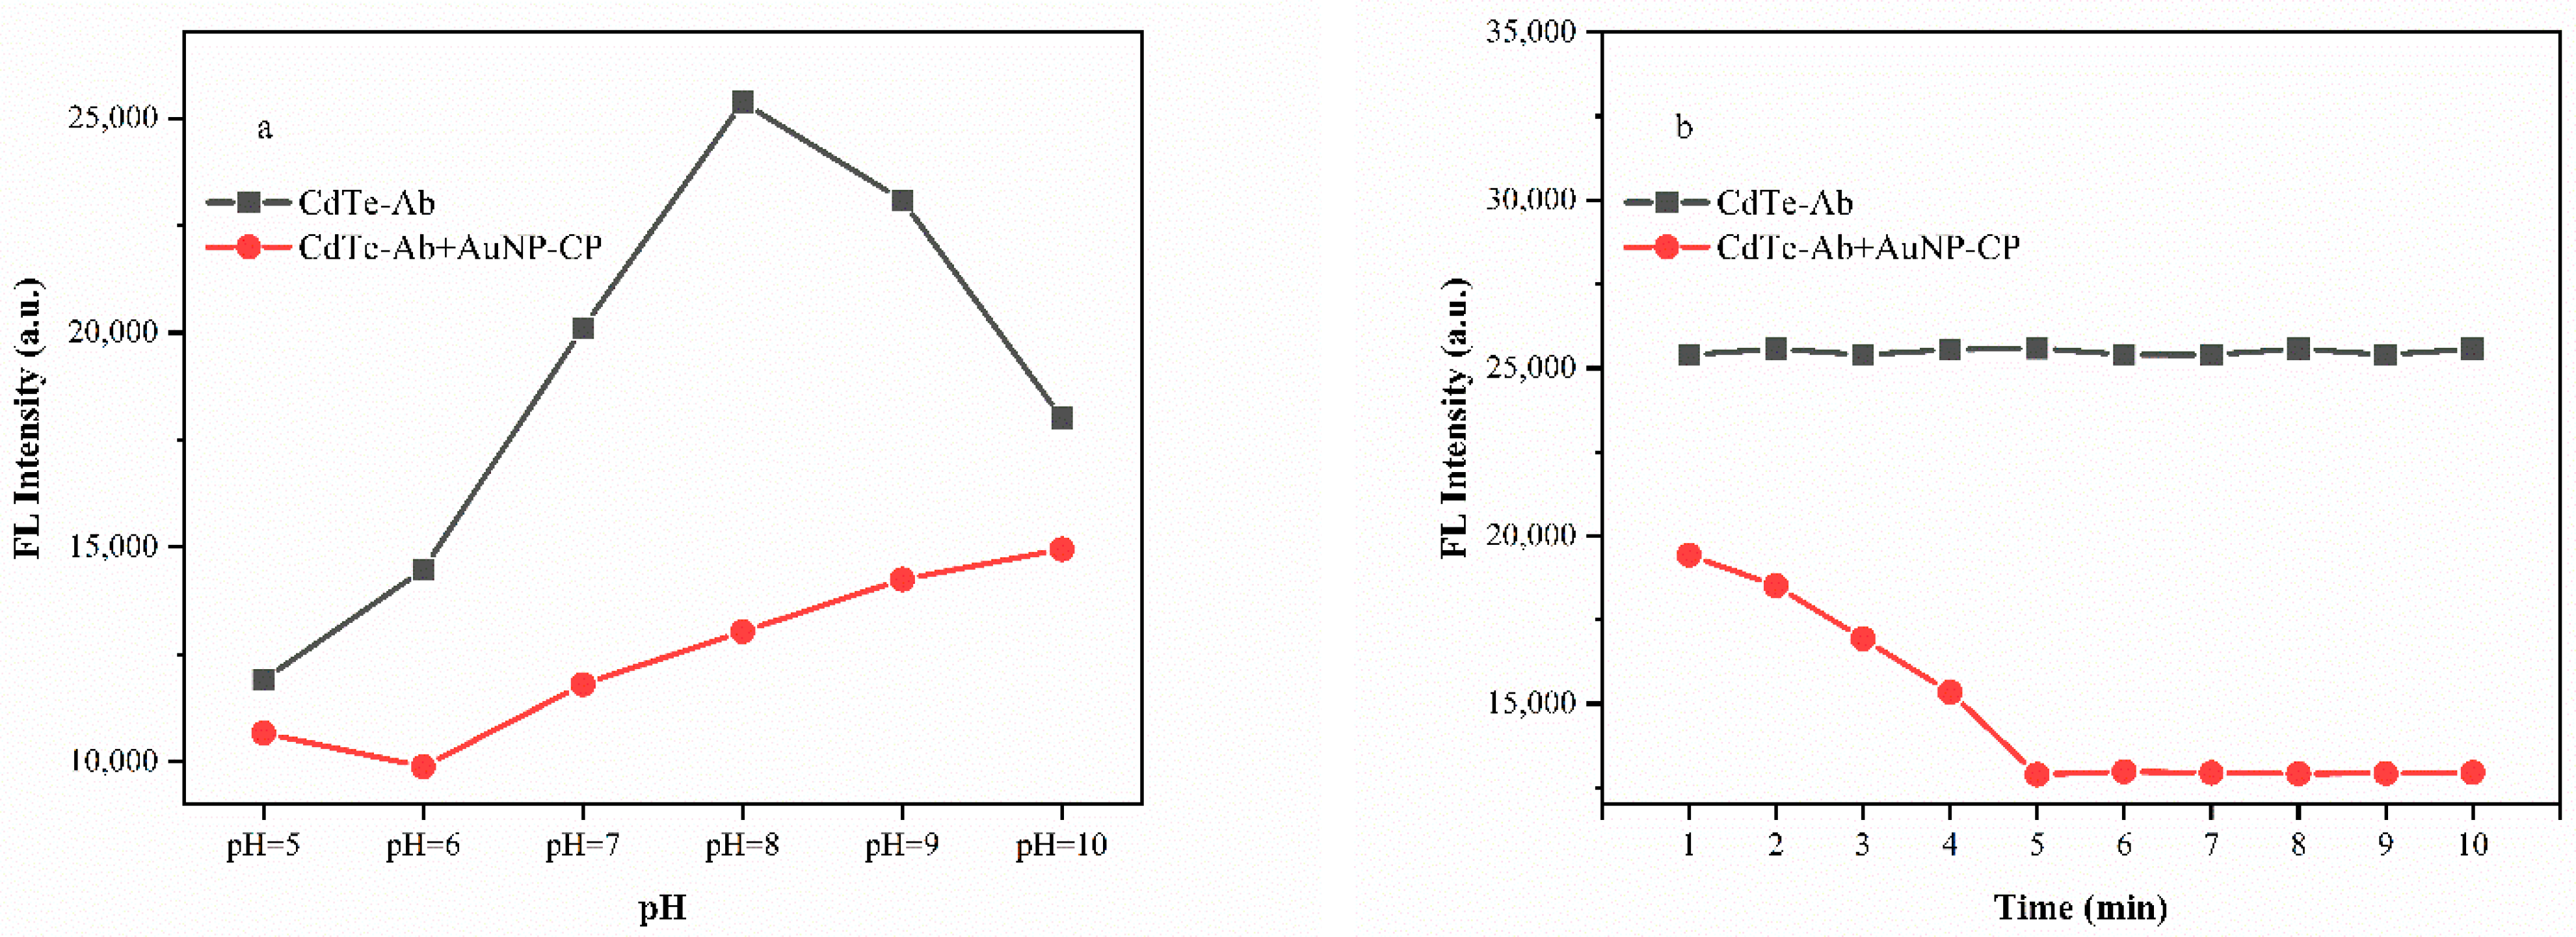
Figure 8.
(a) The effect of CP concentrations on the fluorescent intensity of the developed biosensor; (b) Standard curve of the developed biosensor (ΔF = Ft − F0).
Figure 8.
(a) The effect of CP concentrations on the fluorescent intensity of the developed biosensor; (b) Standard curve of the developed biosensor (ΔF = Ft − F0).

Table 1.
Recoveries of SrMV CP from spiked samples.
| Sample | Added (μg) | Measured (μg) | Recovery (%) | RSD (n = 3, %) |
|---|---|---|---|---|
| 1 | 1 | 1.07 ± 0.09 | 107.4 | 8.45 |
| 2 | 5 | 4.91 ± 0.34 | 98.2 | 6.92 |
| 3 | 10 | 9.77 ± 0.62 | 97.7 | 6.35 |
Publisher’s Note: MDPI stays neutral with regard to jurisdictional claims in published maps and institutional affiliations. |
© 2022 by the authors. Licensee MDPI, Basel, Switzerland. This article is an open access article distributed under the terms and conditions of the Creative Commons Attribution (CC BY) license (https://creativecommons.org/licenses/by/4.0/).
Share and Cite
MDPI and ACS Style
Han, Z.; Du, P.; Wen, R.; Chen, B.; He, X. Signal “Off-On” Biosensor Based on Fluorescence Resonance Energy Transfer (FRET) for Detection of Sorghum Mosaic Virus. Analytica 2022, 3, 385-393. https://doi.org/10.3390/analytica3040026
AMA Style
Han Z, Du P, Wen R, Chen B, He X. Signal “Off-On” Biosensor Based on Fluorescence Resonance Energy Transfer (FRET) for Detection of Sorghum Mosaic Virus. Analytica. 2022; 3(4):385-393. https://doi.org/10.3390/analytica3040026
Chicago/Turabian StyleHan, Zhenlong, Pengfei Du, Ronghui Wen, Baoshan Chen, and Xipu He. 2022. "Signal “Off-On” Biosensor Based on Fluorescence Resonance Energy Transfer (FRET) for Detection of Sorghum Mosaic Virus" Analytica 3, no. 4: 385-393. https://doi.org/10.3390/analytica3040026