
Urinary N-Acetyl-β-d-glucosaminidase (uNAG) as an Indicative Biomarker of Early Diabetic Nephropathy in Patients with Diabetes Mellitus (T1DM, T2DM): A Systematic Review and Meta-Analysis


Abstract
:1. Introduction
2. Materials and Methods
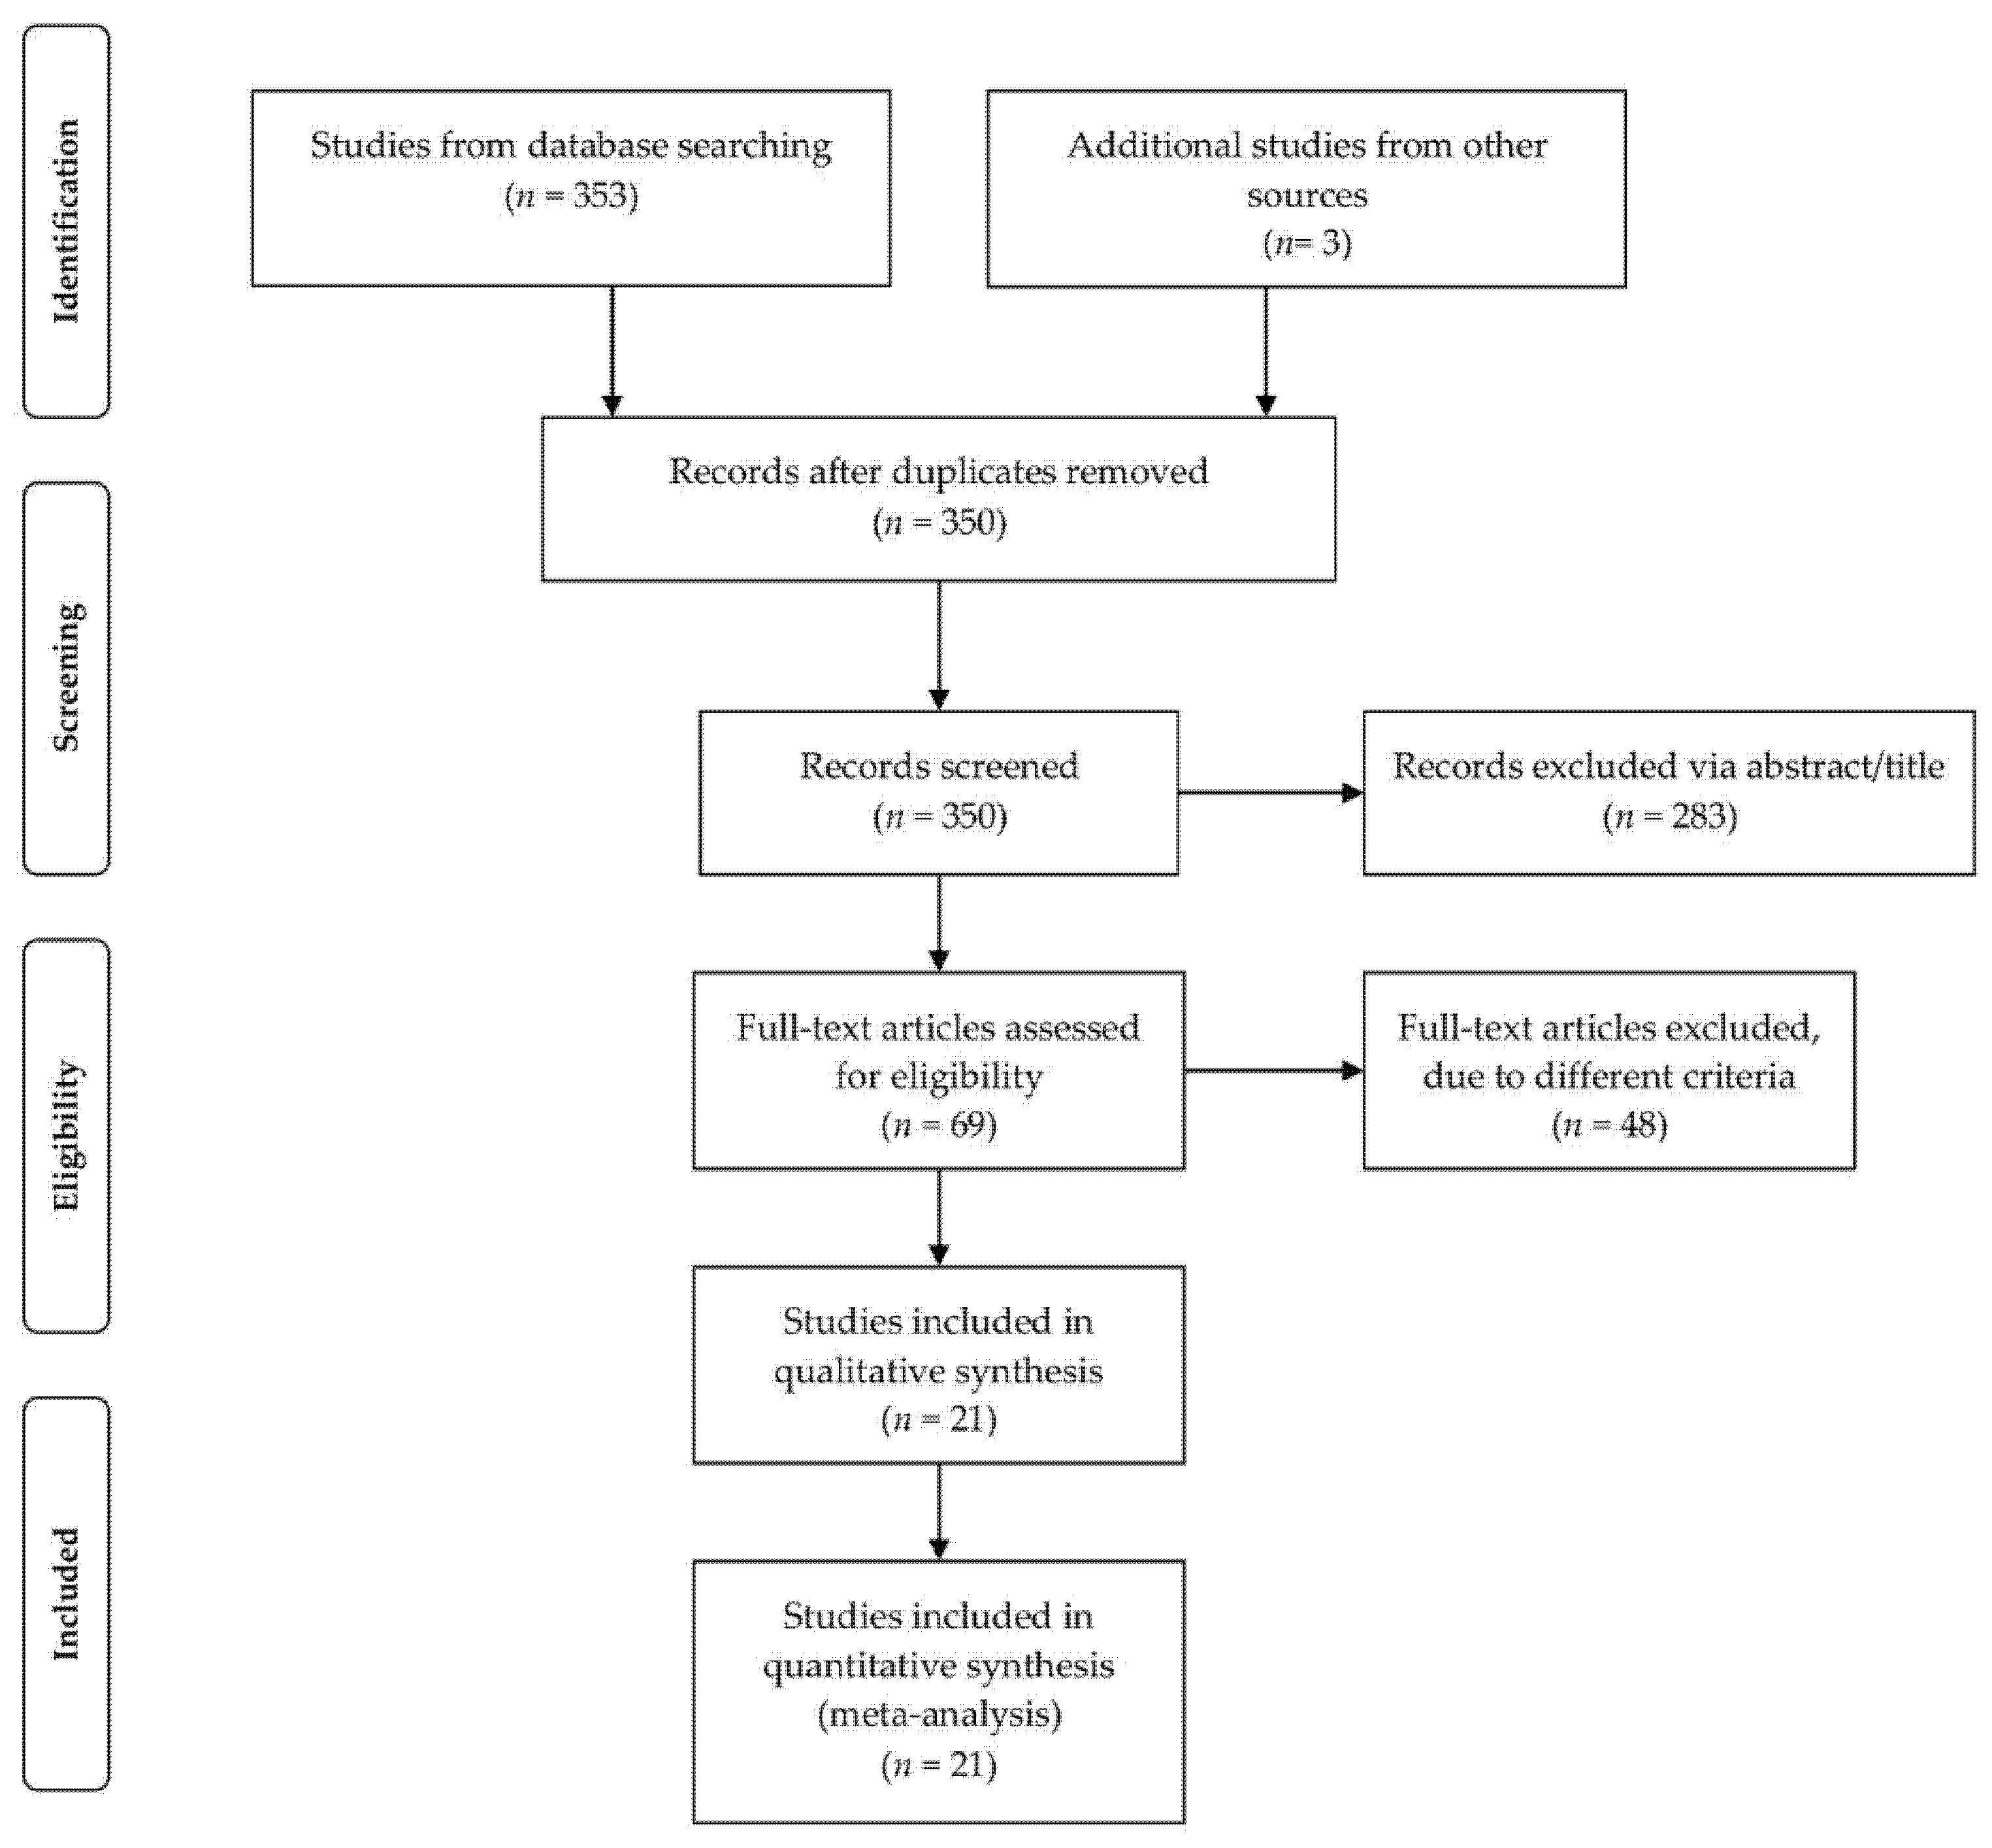
2.1. Search Strategy and Study Selection
2.2. Inclusion and Exclusion Criteria
2.3. Data Extraction
2.4. Quality Assessment of Safety Studies
2.5. Meta-Analysis
3. Results
3.1. Included Studies and Trial Characteristics
3.2. Quality Assessment of the Included Studies
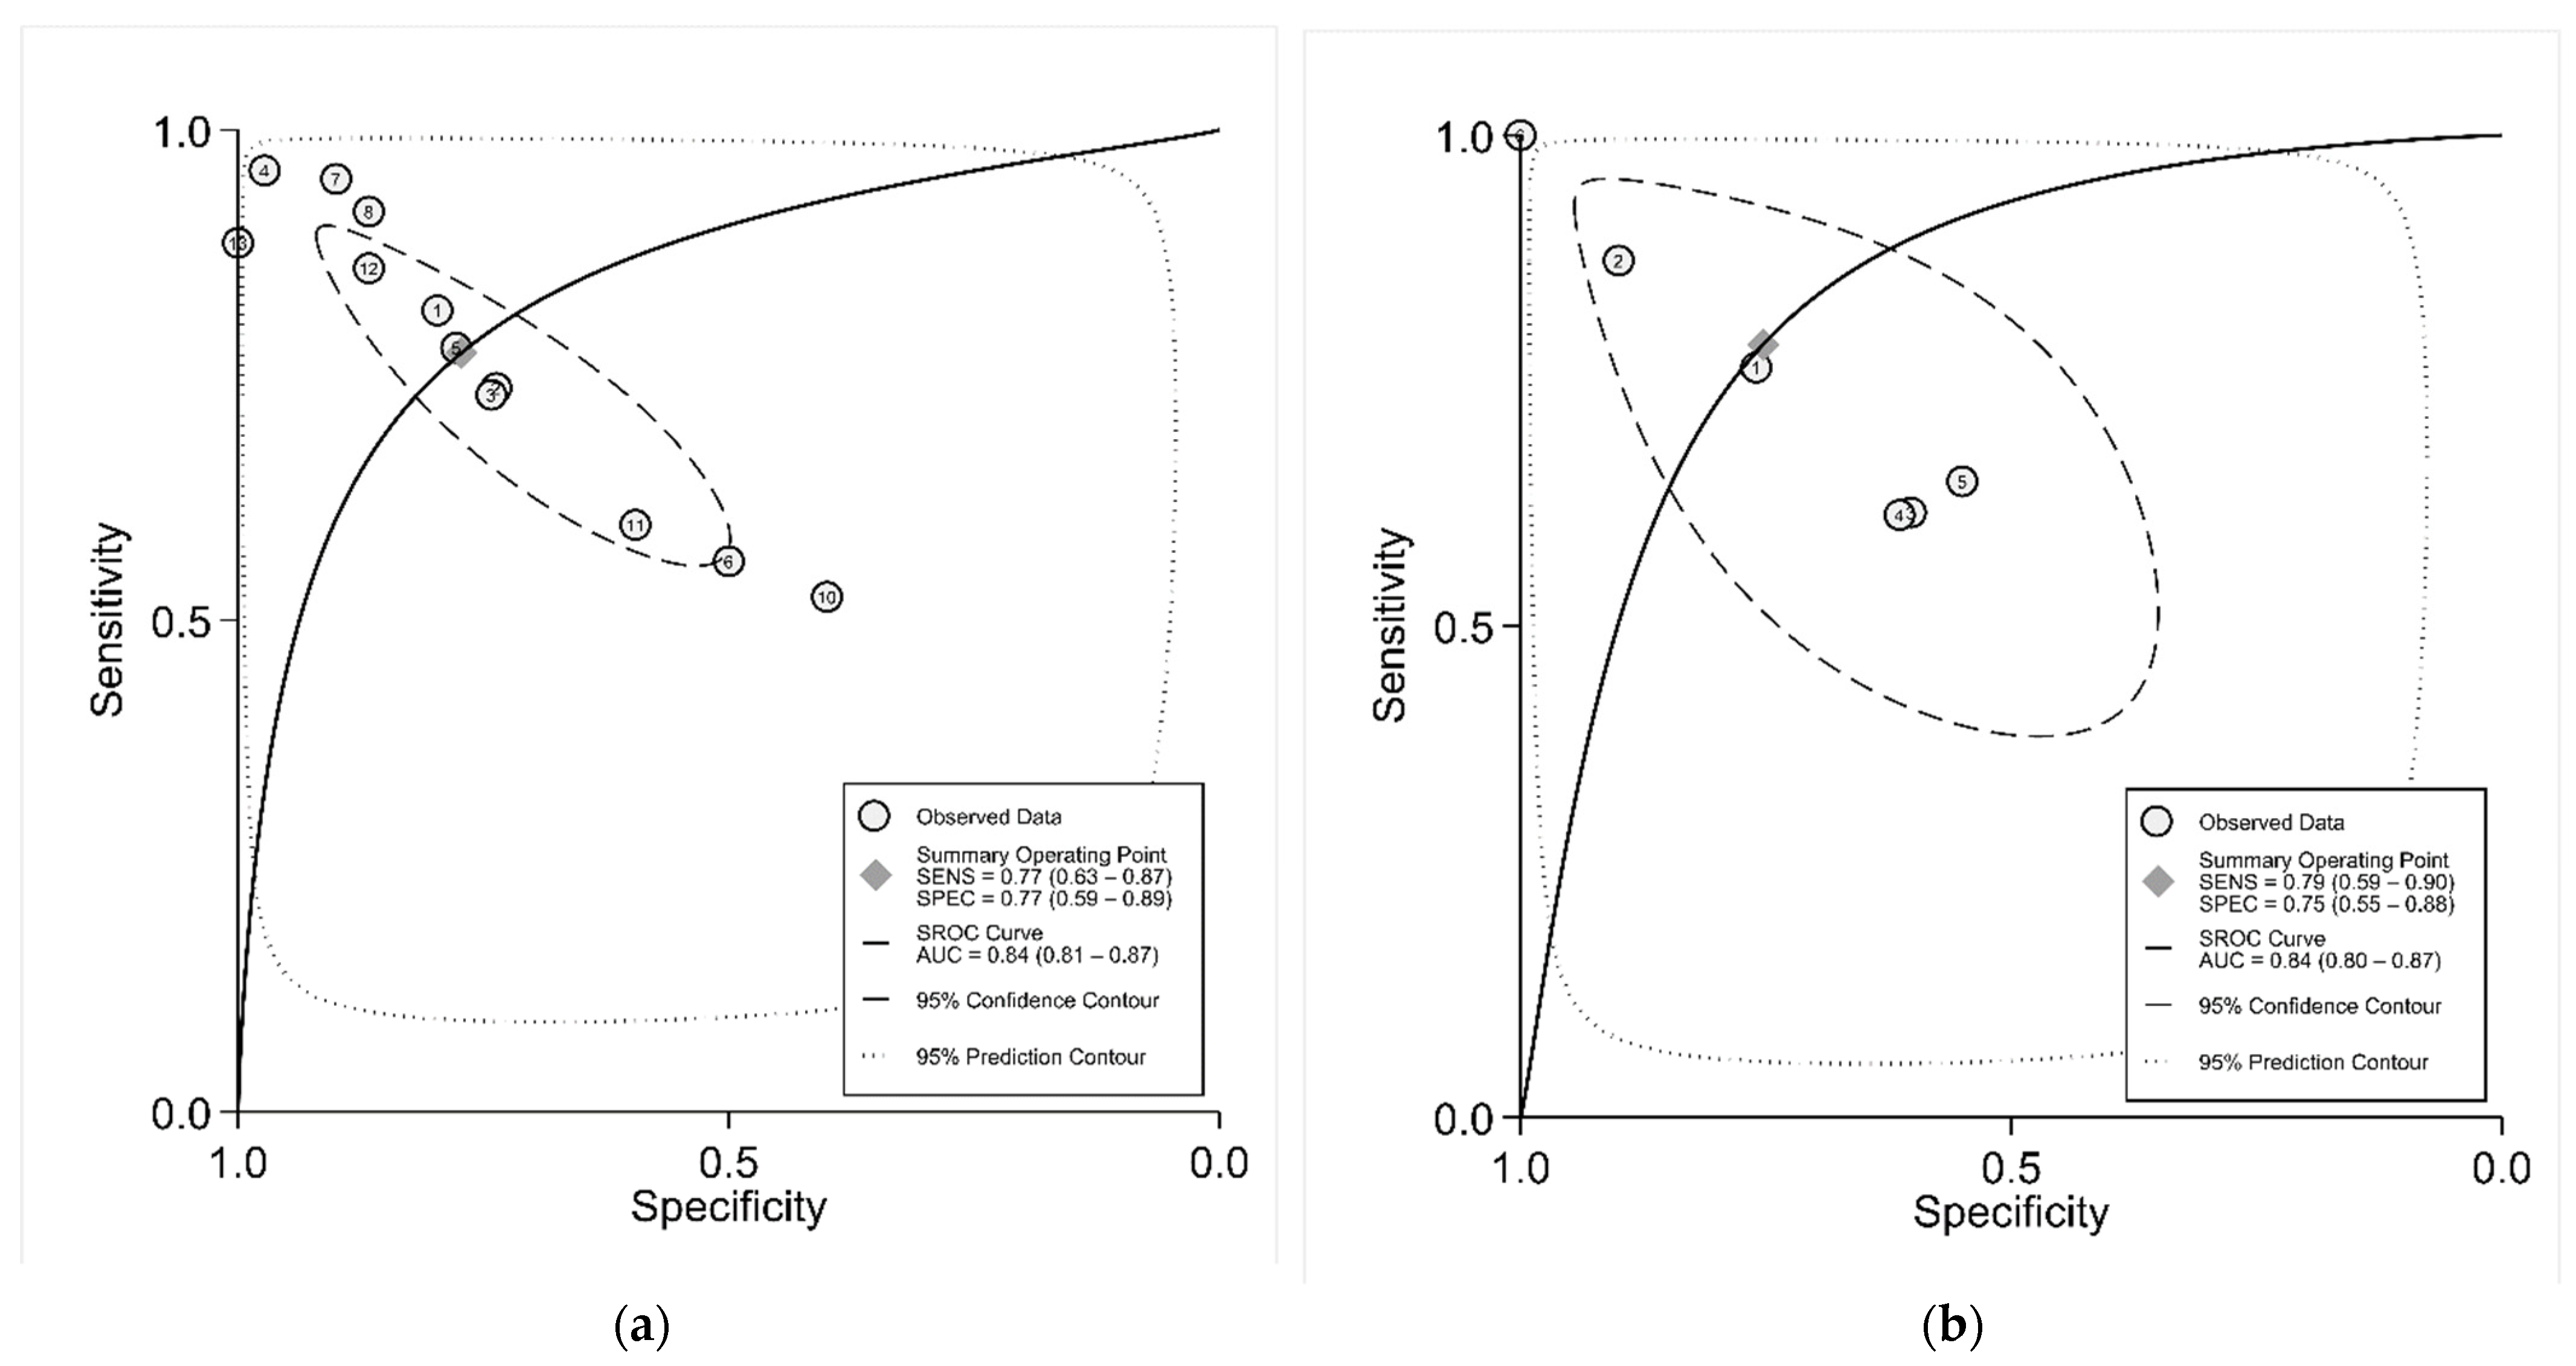
3.3. Diagnostic Accuracy and Summary ROC Curve
3.4. Subgroup Analysis and Publication Bias
4. Discussion
Supplementary Materials
Author Contributions
Funding
Institutional Review Board Statement
Informed Consent Statement
Data Availability Statement
Conflicts of Interest
References
- Nazar, C.M.J. Diabetic Nephropathy; Principles of Diagnosis and Treatment of Diabetic Kidney Disease. J. Nephropharmacol. 2014, 3, 15–20. [Google Scholar] [PubMed]
- Deckert, T.; Feldt-Rasmussen, B.; Borch-Johnsen, K.; Jensen, T.; Kofoed-Enevoldsen, A. Albuminuria Reflects Widespread Vascular Damage. The Steno Hypothesis. Diabetologia 1989, 32, 219–226. [Google Scholar] [CrossRef] [PubMed] [Green Version]
- KDOQI. Clinical Practice Guidelines and Clinical Practice Recommendations for Diabetes and Chronic Kidney Disease. Am. J. Kidney Dis. 2007, 49, S12–S154. [Google Scholar] [CrossRef] [Green Version]
- Gross, J.L.; de Azevedo, M.J.; Silveiro, S.P.; Canani, L.H.; Caramori, M.L.; Zelmanovitz, T. Diabetic Nephropathy: Diagnosis, Prevention, and Treatment. Diabetes Care 2005, 28, 164–176. [Google Scholar] [CrossRef] [PubMed] [Green Version]
- Mogensen, C.E. Microalbuminuria Predicts Clinical Proteinuria and Early Mortality in Maturity-Onset Diabetes. N. Engl. J. Med. 1984, 310, 356–360. [Google Scholar] [CrossRef]
- Yaqoob, M.; Mcclelland, P.; Patrick, A.; Stevenson, A.; Mason, H.; White, M.; Bell, G. Evidence of Oxidant Injury and Tubular Damage in Early Diabetic Nephropathy. Mon. J. Assoc. Physicians 1994, 87, 601–607. [Google Scholar] [CrossRef]
- Rossing, P.; Hougaard, P.; Parving, H.-H. Progression of Microalbuminuria in Type 1 Diabetes: Ten-Year Prospective Observational Study. Kidney Int. 2005, 68, 1446–1450. [Google Scholar] [CrossRef] [PubMed] [Green Version]
- Hovind, P.; Tarnow, L.; Rossing, K.; Rossing, P.; Eising, S.; Larsen, N.; Binder, C.; Parving, H.-H. Decreasing Incidence of Severe Diabetic Microangiopathy in Type 1 Diabetes. Diabetes Care 2003, 26, 1258–1264. [Google Scholar] [CrossRef] [Green Version]
- Bojestig, M.; Arnqvist, H.J.; Hermansson, G.; Karlberg, B.E.; Ludvigsson, J. Declining Incidence of Nephropathy in Insulin-Dependent Diabetes Mellitus. N. Engl. J. Med. 1994, 330, 15–18. [Google Scholar] [CrossRef] [PubMed]
- Caramori, M.L.; Fioretto, P.; Mauer, M. The Need for Early Predictors of Diabetic Nephropathy Risk: Is Albumin Excretion Rate Sufficient? Diabetes 2000, 49, 1399–1408. [Google Scholar] [CrossRef] [Green Version]
- Jha, J.C.; Jandeleit-Dahm, K.A.M.; Cooper, M.E. New Insights into the Use of Biomarkers of Diabetic Nephropathy. Adv. Chronic Kidney Dis. 2014, 21, 318–326. [Google Scholar] [CrossRef]
- von Eynatten, M.; Liu, D.; Hock, C.; Oikonomou, D.; Baumann, M.; Allolio, B.; Korosoglou, G.; Morcos, M.; Campean, V.; Amann, K.; et al. Urinary Adiponectin Excretion: A Novel Marker for Vascular Damage in Type 2 Diabetes. Diabetes 2009, 58, 2093–2099. [Google Scholar] [CrossRef] [Green Version]
- Saraheimo, M.; Forsblom, C.; Thorn, L.; Wadén, J.; Rosengård-Bärlund, M.; Heikkilä, O.; Hietala, K.; Gordin, D.; Frystyk, J.; Flyvbjerg, A.; et al. Serum Adiponectin and Progression of Diabetic Nephropathy in Patients with Type 1 Diabetes. Diabetes Care 2008, 31, 1165–1169. [Google Scholar] [CrossRef] [PubMed] [Green Version]
- Kanauchi, M.; Akai, Y.; Hashimoto, T. Transferrinuria in Type 2 Diabetic Patients with Early Nephropathy and Tubulointerstitial Injury. Eur. J. Intern. Med. 2002, 13, 190–193. [Google Scholar] [CrossRef]
- Qin, L.-X.; Zeng, X.; Huang, G. Changes in serum and urine ceruloplasmin concentrations in type 2 diabetes. Zhong Nan Da Xue Xue Bao Yi Xue Ban 2004, 29, 208–211. [Google Scholar]
- Vaidya, V.S.; Ferguson, M.A.; Bonventre, J.V. Biomarkers of Acute Kidney Injury. Annu. Rev. Pharmacol. Toxicol. 2008, 48, 463–493. [Google Scholar] [CrossRef] [PubMed] [Green Version]
- Portilla, D.; Dent, C.; Sugaya, T.; Nagothu, K.K.; Kundi, I.; Moore, P.; Noiri, E.; Devarajan, P. Liver Fatty Acid-Binding Protein as a Biomarker of Acute Kidney Injury after Cardiac Surgery. Kidney Int. 2008, 73, 465–472. [Google Scholar] [CrossRef] [Green Version]
- Nielsen, S.E.; Sugaya, T.; Tarnow, L.; Lajer, M.; Schjoedt, K.J.; Astrup, A.S.; Baba, T.; Parving, H.-H.; Rossing, P. Tubular and Glomerular Injury in Diabetes and the Impact of ACE Inhibition. Diabetes Care 2009, 32, 1684–1688. [Google Scholar] [CrossRef] [PubMed] [Green Version]
- Kapoula, G.V.; Kontou, P.I.; Bagos, P.G. Diagnostic Accuracy of Neutrophil Gelatinase-Associated Lipocalin for Predicting Early Diabetic Nephropathy in Patients with Type 1 and Type 2 Diabetes Mellitus: A Systematic Review and Meta-Analysis. J. Appl. Lab. Med. 2019, 4, 78–94. [Google Scholar] [CrossRef]
- Mungan, N.; Yuksel, B.; Bakman, M.; Topaloglu, A.K.; Ozer, G. Urinary N-Acetyl-beta-d-glucosaminidase Activity in Type I Diabetes Mellitus. Indian Pediatr. 2003, 40, 410–414. [Google Scholar] [PubMed]
- Colhoun, H.M.; Marcovecchio, M.L. Biomarkers of Diabetic Kidney Disease. Diabetologia 2018, 61, 996–1011. [Google Scholar] [CrossRef] [Green Version]
- Currie, G.; McKay, G.; Delles, C. Biomarkers in Diabetic Nephropathy: Present and Future. World J. Diabetes 2014, 5, 763–776. [Google Scholar] [CrossRef] [PubMed]
- American Diabetes Association. Standards of Medical Care in Diabetes—2013. Diabetes Care 2013, 36, S11–S66. [Google Scholar] [CrossRef] [PubMed] [Green Version]
- Whiting, P.F.; Rutjes, A.W.; Westwood, M.E.; Mallett, S.; Deeks, J.J.; Reitsma, J.B.; Leeflang, M.M.; Sterne, J.A.; Bossuyt, P.M.; QUADAS-2 Group. QUADAS-2: A revised tool for the quality assessment of diagnostic accuracy studies. Ann. Intern. Med. 2011, 155, 529–536. [Google Scholar] [CrossRef] [PubMed]
- van Houwelingen, H.C.; Arends, L.R.; Stijnen, T. Advanced Methods in Meta-Analysis: Multivariate Approach and Meta-Regression. Stat. Med. 2002, 21, 589–624. [Google Scholar] [CrossRef]
- Arends, L.R.; Hamza, T.H.; van Houwelingen, J.C.; Heijenbrok-Kal, M.H.; Hunink, M.G.M.; Stijnen, T. Bivariate Random Effects Meta-Analysis of ROC Curves. Med. Decis. Mak. 2008, 28, 621–638. [Google Scholar] [CrossRef] [PubMed]
- Higgins, J.P.; Green, S. Cochrane Handbook for Systematic Reviews of Interventions; Cochrane Book Series; John Wiley & Sons: Hoboken, NJ, USA, 2019; p. 674. [Google Scholar]
- Hozo, S.P.; Djulbegovic, B.; Hozo, I. Estimating the Mean and Variance from the Median, Range, and the Size of a Sample. BMC Med. Res. Methodol. 2005, 5, 13. [Google Scholar] [CrossRef] [PubMed] [Green Version]
- Youden, W.J. Index for Rating Diagnostic Tests. Cancer 1950, 3, 32–35. [Google Scholar] [CrossRef]
- Swets, J.A. Measuring the Accuracy of Diagnostic Systems. Science 1988, 240, 1285–1293. [Google Scholar] [CrossRef] [PubMed] [Green Version]
- Higgins, J.P.T.; Thompson, S.G.; Deeks, J.J.; Altman, D.G. Measuring Inconsistency in Meta-Analyses. BMJ 2003, 327, 557–560. [Google Scholar] [CrossRef] [PubMed] [Green Version]
- Deeks, J.J.; Macaskill, P.; Irwig, L. The Performance of Tests of Publication Bias and Other Sample Size Effects in Systematic Reviews of Diagnostic Test Accuracy Was Assessed. J. Clin. Epidemiol. 2005, 58, 882–893. [Google Scholar] [CrossRef]
- Asare-Anane, H.; Twum, F.; Kwaku Ofori, E.; Torgbor, E.L.; Amanquah, S.D.; Osafo, C. Urinary Lysosomal Enzyme Activities and Albuminuria in Ghanaian Patients with Type 2 Diabetes Mellitus. Dis. Markers 2016, 2016, 2810639. [Google Scholar] [CrossRef] [Green Version]
- Mohammadi-Karakani, A.; Asgharzadeh-Haghighi, S.; Ghazi-Khansari, M.; Hosseini, R. Determination of Urinary Enzymes as a Marker of Early Renal Damage in Diabetic Patients. J. Clin. Lab. Anal. 2007, 21, 413–417. [Google Scholar] [CrossRef] [PubMed]
- Salem, M.A.K.; El-Habashy, S.A.; Saeid, O.M.; El-Tawil, M.M.K.; Tawfik, P.H. Urinary Excretion of N-Acetyl-Beta-D-Glucosaminidase and Retinol Binding Protein as Alternative Indicators of Nephropathy in Patients with Type 1 Diabetes Mellitus. Pediatr. Diabetes 2002, 3, 37–41. [Google Scholar] [CrossRef]
- Piwowar, A.; Knapik-Kordecka, M.; Fus, I.; Warwas, M. Urinary Activities of Cathepsin B, N-Acetyl-Beta-D-Glucosaminidase, and Albuminuria in Patients with Type 2 Diabetes Mellitus. Med. Sci. Monit. 2006, 12, CR210–CR214. [Google Scholar] [PubMed]
- Ambade, V.; Sing, P.; Somani, B.L.; Basanna, D. Urinary N-Acetyl Beta Glucosaminidase and Gamma Glutamyl Transferase as Early Markers of Diabetic Nephropathy. Indian J. Clin. Biochem. 2006, 21, 142–148. [Google Scholar] [CrossRef] [PubMed] [Green Version]
- Assal, H.S.; Tawfeek, S.; Rasheed, E.A.; El-Lebedy, D.; Thabet, E.H. Serum Cystatin C and Tubular Urinary Enzymes as Biomarkers of Renal Dysfunction in Type 2 Diabetes Mellitus. Clin. Med. Insights Endocrinol. Diabetes 2013, 6, 7–13. [Google Scholar] [CrossRef] [PubMed]
- Żurawska-Płaksej, E.; Ługowska, A.; Hetmańczyk, K.; Knapik-Kordecka, M.; Adamiec, R.; Piwowar, A. Proteins from the 18 Glycosyl Hydrolase Family Are Associated with Kidney Dysfunction in Patients with Diabetes Type 2. Biomarkers 2015, 20, 52–57. [Google Scholar] [CrossRef]
- Vaidya, V.S.; Niewczas, M.A.; Ficociello, L.H.; Johnson, A.C.; Collings, F.B.; Warram, J.H.; Krolewski, A.S.; Bonventre, J.V. Regression of Microalbuminuria in Type 1 Diabetes Is Associated with Lower Levels of Urinary Tubular Injury Biomarkers, Kidney Injury Molecule-1, and N-acetyl-β-d-glucosaminidase. Kidney Int. 2011, 79, 464–470. [Google Scholar] [CrossRef] [Green Version]
- Sheira, G.; Noreldin, N.; Tamer, A.; Saad, M. Urinary Biomarker N-Acetyl-β-d-Glucosaminidase Can Predict Severity of Renal Damage in Diabetic Nephropathy. J. Diabetes Metab. Disord. 2015, 14, 4. [Google Scholar] [CrossRef] [Green Version]
- Shimojo, N.; Kitahashi, S.; Naka, K.; Fujii, A.; Okuda, K.; Tanaka, S.; Fujii, S. Comparison of N-Acetyl-Beta-D-Glucosaminidase and Alanine Aminopeptidase Activities for Evaluation of Microangiopathy in Diabetes Mellitus. Metabolism 1987, 36, 277–280. [Google Scholar] [CrossRef]
- Narita, T.; Hosoba, M.; Kakei, M.; Ito, S. Increased Urinary Excretions of Immunoglobulin g, Ceruloplasmin, and Transferrin Predict Development of Microalbuminuria in Patients with Type 2 Diabetes. Diabetes Care 2006, 29, 142–144. [Google Scholar] [CrossRef] [PubMed]
- Navarro, J.F.; Mora, C.; Muros, M.; García, J. Urinary Tumour Necrosis Factor-Alpha Excretion Independently Correlates with Clinical Markers of Glomerular and Tubulointerstitial Injury in Type 2 Diabetic Patients. Nephrol. Dial. Transpl. 2006, 21, 3428–3434. [Google Scholar] [CrossRef] [PubMed] [Green Version]
- Fujita, H.; Morii, T.; Koshimura, J.; Ishikawa, M.; Kato, M.; Miura, T.; Sasaki, H.; Narita, T.; Ito, S.; Kakei, M. Possible Relationship between Adiponectin and Renal Tubular Injury in Diabetic Nephropathy. Endocr. J. 2006, 53, 745–752. [Google Scholar] [CrossRef] [PubMed] [Green Version]
- Kalansooriya, A.; Holbrook, I.; Jennings, P.; Whiting, P.H. Serum Cystatin C, Enzymuria, Tubular Proteinuria and Early Renal Insult in Type 2 Diabetes. Br. J. Biomed. Sci. 2007, 64, 121–123. [Google Scholar] [CrossRef] [PubMed]
- Kalansooriya, A.; Jennings, P.; Haddad, F.; Holbrook, I.; Whiting, P.H. Urinary Enzyme Measurements as Early Indicators of Renal Insult in Type 2 Diabetes. Br. J. Biomed. Sci. 2007, 64, 153–156. [Google Scholar] [CrossRef]
- 48 Fu, W.-J.; Xiong, S.-L.; Fang, Y.-G.; Wen, S.; Chen, M.-L.; Deng, R.-T.; Zheng, L.; Wang, S.-B.; Pen, L.-F.; Wang, Q. Urinary Tubular Biomarkers in Short-Term Type 2 Diabetes Mellitus Patients: A Cross-Sectional Study. Endocrine 2012, 41, 82–88. [Google Scholar] [CrossRef]
- De Muro, P.; Lepedda, A.J.; Nieddu, G.; Idini, M.; Tram Nguyen, H.Q.; Lobina, O.; Fresu, P.; Formato, M. Evaluation of Early Markers of Nephropathy in Patients with Type 2 Diabetes Mellitus. Biochem. Res. Int. 2016, 2016, 7497614. [Google Scholar] [CrossRef] [PubMed] [Green Version]
- Zhang, D.; Ye, S.; Pan, T. The Role of Serum and Urinary Biomarkers in the Diagnosis of Early Diabetic Nephropathy in Patients with Type 2 Diabetes. PeerJ 2019, 7, e7079. [Google Scholar] [CrossRef] [PubMed] [Green Version]
- Nikolov, G.; Boncheva, M.; Gruev, T.; Biljali, S.; Stojceva-Taneva, O.; Masim-Spasovska, E. Urinary Biomarkers in the Early Diagnosis of Renal Damage in Diabetes Mellitus Patients. Scr. Sci. Med. 2013, 45, 58–64. [Google Scholar] [CrossRef] [Green Version]
- Al-Hazmi, S.F.; Gad, H.G.M.; Alamoudi, A.A.; Eldakhakhny, B.M.; Binmahfooz, S.K.; Alhozali, A.M. Evaluation of Early Biomarkers of Renal Dysfunction in Diabetic Patients. Saudi Med. J. 2020, 41, 690–697. [Google Scholar] [CrossRef] [PubMed]
- Kim, S.R.; Lee, Y.-H.; Lee, S.-G.; Kang, E.S.; Cha, B.-S.; Kim, J.-H.; Lee, B.-W. Urinary N-Acetyl-β-d-Glucosaminidase, an Early Marker of Diabetic Kidney Disease, Might Reflect Glucose Excursion in Patients with Type 2 Diabetes. Medicine 2016, 95, e4114. [Google Scholar] [CrossRef] [PubMed]


| Controls | Diabetic Patients | |||||||||||||||
|---|---|---|---|---|---|---|---|---|---|---|---|---|---|---|---|---|
| Normoalbuminuria | Microalbuminuria | Macroalbuminuria | ||||||||||||||
| Country | Sample Size (n) | Sex (%.Male/Female) | Age (Mean) | Sample Size (n) | Sex (%.Male/Female) | Age (Mean) | Sample Size (n) | Sex (%.Male/Female) | Age (Mean) | Sample Size (n) | Sex (%.Male/Female) | Age (Mean) | NAG Type | Determination Method of NAG | Data | Reference |
| Ghana | 65 | 44.6/55.4 | 51.2 | 39 | – | 26 | – | – | – | – | – | uNAG | Spectophotometric * | Mean, SD | [33] | |
| Ghana | 65 | 44.6/55.4 | 54 | 39 | – | 26 | – | – | – | – | – | uNAG/Cr | Spectophotometric | Mean, SD | [33] | |
| Iran | 25 | 60/40 | 55.2 | 24 | 62.5/37.5 | 58.2 | 8 | 62.5/37.5 | 53.1 | – | – | – | uNAG/Cr | Immunoturbidimetry | Mean, SD | [34] |
| Egypt | 40 | 40/60 | 15.1 | 48 | – | 14.6 | 11 | – | 16.8 | – | – | – | uNAG/Cr | Colorimetricanalysis ** | Mean, SD | [35] |
| Poland | 42 | 28.5/71.5 | 56 | 14 | – | – | 89 | – | – | 27 | – | – | uNAG/Cr | Spectophotometric | Median IQR | [36] |
| India | 48 | – | 45.6 | 94 | – | – | 102 | – | – | – | – | – | uNAG/Cr | ELISA ** | Mean, SD | [37] |
| Egypt | 20 | 60/40 | 51 | 20 | 50/50 | 51.3 | 25 | 44/56 | 52.9 | 25 | 48/42 | 51.7 | uNAG | Spectophotometric | Median IQR | [38] |
| Poland | 32 | 37.5/62.5 | 61.9 | 29 | 38/62 | 63.4 | 32 | 34.3/65.7 | 63.4 | 29 | 34.5/65.5 | 62.4 | uNAG | ELISA | Mean, SD | [39] |
| USA | 38 | 50/50 | 43 | 363 | 44/56 | 39 | 296 | 61/39 | 41 | – | – | – | uNAG | Spectophotometric | Mean, SD | [40] |
| Egypt | 10 | 60/40 | 47.3 | 10 | 80/20 | 51.36 | 20 | 50/50 | 48.6 | 20 | 40/60 | 52.8 | uNAG | ELISA | Mean, SD | [41] |
| Japan | 57 | 59.6/40.4 | 44.5 | 90 | – | 47.5 | – | – | – | – | – | – | uNAG/Cr | RIA | Mean, SD | [42] |
| India | 48 | – | 45.3 | 94 | – | – | 102 | – | – | – | – | – | uNAG/Cr | Spectophotometric | Mean, SD | [37] |
| Japan | – | – | – | 20 | 45/55 | 57.1 | 17 | 35.2/64.8 | 62.7 | – | – | – | uNAG/Cr | – | Median IQR | [43] |
| Spain | 32 | 46.8/53.2 | 60 | 25 | 52/48 | 60 | 60 | 48.3/51.7 | 59 | 75 | 48/52 | 64 | uNAG | Colorimetric analysis | Median IQR | [44] |
| Japan | 20 | 55/45 | 57 | 19 | 84.2/15.8 | 62 | 7.8 | 18/82 | 72.2 | 19 | 56.2/43.8 | 60 | uNAG | Colorimetric analysis | Median IQR | [45] |
| UK | 20 | 50/50 | 45 | 20 | – | – | 20 | – | – | – | – | – | uNAG | EIA | Mean, SD | [46] |
| UK | 15 | – | 48 | 12 | 58.3/41.7 | 48 | 12 | 41.7/58.3 | 48 | 12 | 50/50 | 48 | uNAG | EIA | Mean, SD | [47] |
| China | 28 | 46.4/53.6 | 48.3 | 61 | – | – | 24 | – | – | 16 | – | – | uNAG | Colorimetric analysis | Median IQR | [48] |
| Italy | 31 | 32.2/67.8 | 61.1 | 43 | 37.1/62.9 | 64.2 | – | – | – | – | – | – | uNAG | Colorimetric analysis | Median IQR | [49] |
| China | 42 | 54.8/45.2 | 54.3 | 144 | 57.6/42.4 | 54.3 | 94 | 55.3/44.7 | 55.49 | 49 | 57.1/42.9 | 59.2 | uNAG | Immunonephelometric | Median IQR | [50] |
| Skopje | 30 | 66.6/33.4 | 33 | 170 | 56.4/43.6 | 50 | 115 | 56.5/43.5 | 57.3 | – | – | – | uNAG | – | Mean, SD | [51] |
| Egypt | 30 | 50/50 | 51 | 26 | 39/61 | 51 | 30 | 53/47 | 57 | 30 | 53/47 | 56 | uNAG | ELISA | Mean, SD | [52] |
| uNAG: Controls vs. Patients with Normoalbuminuria | |||||||||||
| PubMed ID | Author Name | Country | Year | Type of Diabetes | Cut-Off | TP * | FN * | TN * | FP * | Sensitivity (95%.CI) | Specificity (95% CI) |
| 27594733 | Anane H.A. | Ghana | 2016 | 2 | 11.15 | 31 | 7 | 51 | 13 | 0.80 (0.63–0.90) | 0.79 (0.68–0.88) |
| 23966807 | Heba S. Assal | Egypt | 2013 | 2 | 8.25 | 14 | 5 | 14 | 5 | 0.72 (0.48–0.90) | 0.72 (0.48–0.90) |
| 25519006 | Zurawska Plaksej E. | Poland | 2014 | 2 | 156.5 | 27 | 10 | 23 | 8 | 0.73 (0.56–0.86) | 0.71 (0.53–0.86) |
| 20980978 | Vaidya S. V. | USA | 2011 | 1 | 1.15 | 347 | 15 | 36 | 1 | 0.95 (0.92–0.97) | 0.96 (0.86–0.99) |
| 25717442 | Gehan S. | Egypt | 2015 | 2 | 1 | 7 | 2 | 7 | 2 | 0.70 (0.34–0.93) | 0.70 (0.34–0.93) |
| 16935891 | Navarro J.F. | Spain | 2006 | 1 | 1 | 14 | 11 | 16 | 16 | 0.56 (0.34–0.76) | 0.50 (0.32–0.68) |
| 17910281 | Kalansoopiya A. | UK | 2007 | 2 | 1 | 19 | 1 | 18 | 2 | 0.95 (0.75–0.99) | 0.90 (0.68–0.98) |
| 18236735 | Kalansoopiya A. | UK | 2007 | 2 | 1 | 11 | 1 | 13 | 2 | 0.91 (0.61–0.99) | 0.86 (0.60–0.98) |
| 21779943 | Fu W. | China | 2011 | 2 | 1 | 11 | 49 | 3 | 24 | 0.18 (0.09–0.30) | 0.11 (0.02–0.29) |
| 26904288 | Muro P.D. | Italy | 2015 | 2 | 1 | 22 | 20 | 16 | 24 | 0.52 (0.36–0.68) | 0.40 (0.24–0.56) |
| 31218128 | Zhang D. | China | 2019 | 2 | 1 | 86 | 58 | 25 | 17 | 0.59 (0.51–0.67) | 0.40 (0.25–0.56) |
| - | Nikolov G. | Skopje | 2013 | 2 | 1 | 146 | 24 | 26 | 4 | 0.85 (0.79–0.90) | 0.86 (0.69–0.96) |
| 32601635 | Shrouq F.A.H. | Egypt | 2020 | 2 | 1 | 23 | 3 | 30 | 0 | 0.88 (0.69–0.97) | 1.00 (0.88–1.00) |
| uNAG/Cr: Controls vs. Patients with Normoalbuminuria | |||||||||||
| PubMed ID | Author Name | Country | Year | Type of Diabetes | Cut-Off | TP | FN | TN | FP | Sensitivity (95% CI) | Specificity (95% CI) |
| 27594733 | Anane H.A. | Ghana | 2016 | 2 | 9.2 | 22 | 17 | 38 | 27 | 0.56 (0.39–0.72) | 0.58 (0.45–0.70) |
| 23105632 | Ambade V. | India | 2006 | 1.2 | 6.5 | 68 | 26 | 32 | 16 | 0.72 (0.62–0.81) | 0.66 (0.51–0.79) |
| 15016173 | Salem M. A. K. | Egypt | 2002 | 1 | 4.6 | 38 | 10 | 31 | 9 | 0.79 (0.65–0.89) | 0.77 (0.61–0.89) |
| 2881186 | Shimojo N. | Japan | 1987 | 1 | 2.3 | 99 | 1 | 56 | 1 | 1.00 (0.95–1.00) | 1.00 (0.95–1.00) |
| 23105632 | Ambade V. | India | 2003 | 1 | 6.2 | 65 | 29 | 33 | 15 | 0.68 (0.53–0.81) | 0.69 (0.58–0.78) |
| 16641878 | Piwowar A. | Poland | 2006 | 2 | 0.3 | 9 | 17 | 27 | 35 | 0.34 (0.17–0.55) | 0.43 (0.31–0.56) |
| 18022929 | Karakani A. M. | Iran | 2007 | 1 | 3.6 | 23 | 1 | 24 | 1 | 1.00 (0.85–1.00) | 1.00 (0.85–1.00) |
| uNAG: Patients with Normoalbuminuria vs. Patients with Microalbuminuria | |||||||||||
| PubMed ID | Author Name | Country | Year | Type of Diabetes | Cut-Off | TP | FN | TN | FP | Sensitivity (95% CI) | Specificity (95% CI) |
| 27594733 | Anane H.A. | Ghana | 2016 | 2 | 12.9 | 2 | 1 | 1 | 1 | 0.53 (0.37–0.69) | 0.52 (0.33–0.73) |
| 23966807 | Heba S. Assal | Egypt | 2013 | 2 | 13.8 | 1 | 3 | 2 | 4 | 0.76 (0.50–0.91) | 0.91 (0.73–0.99) |
| 25519006 | Zurawska Plaksej E. | Poland | 2014 | 2 | 193.5 | 2 | 1 | 2 | 1 | 0.54 (0.38–0.71) | 0.48 (0.29–0.65) |
| 16966829 | Fujita H. | Japan | 2006 | 2 | 20 | 18 | 0 | 19 | 0 | 1.00 (0.81–1.00) | 1.00 (0.82–1.00) |
| 25717442 | Gehan S. | Egypt | 2015 | 2 | 1.2 | 6 | 3 | 12 | 7 | 0.62 (0.26–0.87) | 0.60 (0.36–0.80) |
| 16935891 | Navarro J.F. | Spain | 2006 | 1 | 4 | 34 | 26 | 14 | 11 | 0.56 (0.43–0.69) | 0.56 (0.34–0.75) |
| 21779943 | Fu W. | China | 2011 | 2 | 12.7 | 16 | 8 | 41 | 20 | 0.66 (0.44–0.84) | 0.67 (0.54–0.78) |
| 20980978 | Vaidya S.V. | USA | 2011 | 1 | 2.5 | 2 | 6 | 2 | 4 | 0.82 (0.78–0.86) | 0.84 (0.79–0.88) |
| uNAG/Cr: Patients with Normoalbuminuria vs. Patients with Microalbuminuria | |||||||||||
| PubMed ID | Author Name | Country | Year | Type of Diabetes | Cut-Off | TP | FN | TN | FP | Sensitivity (95% CI) | Specificity (95% CI) |
| 27594733 | Anane H.A. | Ghana | 2016 | 2 | 15 | 29 | 9 | 19 | 6 | 0.76 (0.60–0.88) | 0.75 (0.56–0.91) |
| 15016173 | Salem M. A. K. | Egypt | 2002 | 1 | 9.8 | 41 | 6 | 9 | 1 | 0.85 (0.72–0.93) | 0.87 (0.58–0.99) |
| 16641878 | Piwowar A. | Poland | 2006 | 2 | 1.1 | 8 | 5 | 53 | 35 | 0.57 (0.28–0.82) | 0.60 (0.49–0.70) |
| 23105632 | Ambade V. | India | 2003 | 1 | 9.6 | 57 | 36 | 62 | 39 | 0.61 (0.51–0.71) | 0.60 (0.50–0.70) |
| 16373913 | Narita T. | Japan | 2005 | 2 | 3 | 11 | 6 | 11 | 9 | 0.67 (0.38–0.85) | 0.55 (0.31–0.76) |
| 18022929 | Karakani A. M. | Iran | 2007 | 1 | 6.2 | 23 | 0 | 7 | 0 | 1.00 (0.85–1.00) | 1.00 (0.85–1.00) |
| uNAG: Controls vs. Patients with Normo-Microalbuminuria | |||||||||||
| PubMed ID | Author Name | Country | Year | Type of Diabetes | Cut-Off | TP | FN | TN | FP | Sensitivity (95% CI) | Specificity (95% CI) |
| 23966807 | Heba S. Assal | Egypt | 2013 | 2 | 10 | 38 | 7 | 19 | 1 | 0.84 (0.70–0.93) | 0.93 (0.75–0.99) |
| 25519006 | Zurawska Plaksej E. | Poland | 2014 | 2 | 160 | 53 | 17 | 23 | 9 | 0.75 (0.63–0.85) | 0.72 (0.53–0.86) |
| 20980978 | Vaidya S. V. | USA | 2011 | 1 | 1.3 | 597 | 62 | 38 | 0 | 0.90 (0.88–0.92) | 1.00 (0.90–1.00) |
| 25717442 | Gehan S. | Egypt | 2015 | 2 | 1 | 21 | 9 | 8 | 2 | 0.70 (0.50–0.85) | 0.79 (0.44–0.97) |
| uNAG /Cr: Controls vs. Patients with Normo-Microalbuminuria | |||||||||||
| PubMed ID | Author Name | Country | Year | Type of Diabetes | Cut-Off | TP | FN | TN | FP | Sensitivity (95% CI) | Specificity (95% CI) |
| 15016173 | Salem M. A. K. | Egypt | 2002 | 1 | 5.2 | 53 | 6 | 33 | 7 | 0.89 (0.79–0.96) | 0.82 (0.67–0.92) |
| 16641878 | Piwowar A. | Poland | 2006 | 2 | 0.5 | 55 | 48 | 17 | 25 | 0.53 (0.43–0.63) | 0.40 (0.25–0.56) |
| 18022929 | Karakani A. M. | Iran | 2007 | 1 | 4 | 32 | 0 | 25 | 0 | 1.00 (0.89–1.00) | 1.00 (0.89–1.00) |
| 23105632 | Ambade V. | India | 2003 | 1 | 6.5 | 142 | 54 | 34 | 14 | 0.72 (0.65–0.78) | 0.70 (0.55–0.83) |
| 27594733 | Anane H.A. | Ghana | 2016 | 2 | 11 | 45 | 20 | 44 | 21 | 0.69 (0.56–0.80) | 0.68 (0.54–0.78) |
| Number of Studies | Sensitivity (95% CI) | I² (%) | Specificity (95% CI) | I² (%) | PLR (95%CI) | NLR (95% CI) | DOR (95% CI) | AUC (95% CI) | p-Value |
|---|---|---|---|---|---|---|---|---|---|
| uNAG: Controls vs. patients with normoalbuminuria | |||||||||
| 13 | 0.77 (0.63–0.87) | 64.65 (37.83–91.46) | 0.77 (0.59–0.89) | 58.22 (25.48–90.96) | 3.4 (1.5–7.6) | 0.29 (0.14–0.06) | 12 (3–52) | 0.84 (0.81–0.87) | 0.89 |
| uNAG/Cr: Controls vs. patients with normoalbuminuria | |||||||||
| 7 | 0.82 (0.56–0.94) | 93.22 (89.64–96.80) | 0.79 (0.57–0.92) | 93.95 (90.87–97.04) | 3.9 (1.4–11.1) | 0.23 (0.07–0.79) | 17 (2–159) | 0.87 (0.84–0.90) | 0.63 |
| uNAG: Patients with normoalbuminuria vs. patients with microalbuminuria | |||||||||
| 8 | 0.65 (0.38–0.85) | 64.65 (37.83–91.46) | 0.65 (0.41–0.83) | 58.22 (25.48–90.96) | 1.8 (0.7–4.8) | 0.54 (0.20–1.49) | 3 (0–24) | 0.69 (0.65–0.73) | 0.66 |
| uNAG/Cr: Patients with normoalbuminuria vs. patients with microalbuminuria | |||||||||
| 6 | 0.79 (0.59–0.90) | 82.49 (69.37–95.61) | 0.75 (0.55–0.88) | 85.76 (75.66–95.87) | 3.2 (1.4–7.4) | 0.28 (0.11–0.70) | 11 (2–61) | 0.84 (0.80–0.87) | 0.13 |
| uNAG: Controls vs. patients with normo-microalbuminuria | |||||||||
| 4 | 0.83 (0.73–0.89) | 87.99 (78.95–97.04) | 0.92 (0.66–0.99) | 74.65 (51.70–97.59) | 10.8 (1.9–61.9) | 0.19 (0.11–0.33) | 58 (6–540) | 0.90 (0.88–0.93) | 0.49 |
| uNAG/Cr: Controls vs. patients with normo-microalbuminuria | |||||||||
| 5 | 0.84 (0.56–0.95) | 96.43 (94.53–98.32) | 0.81 (0.48–0.95) | 93.13 (88.69–97.56] | 4.4 (1–19] | 0.20 (0.05–0.85) | 22 (1–388) | 0.89 (0.86–0.92) | 0.08 |
Publisher’s Note: MDPI stays neutral with regard to jurisdictional claims in published maps and institutional affiliations. |
© 2021 by the authors. Licensee MDPI, Basel, Switzerland. This article is an open access article distributed under the terms and conditions of the Creative Commons Attribution (CC BY) license (https://creativecommons.org/licenses/by/4.0/).
Share and Cite
Driza, A.R.; Kapoula, G.V.; Bagos, P.G. Urinary N-Acetyl-β-d-glucosaminidase (uNAG) as an Indicative Biomarker of Early Diabetic Nephropathy in Patients with Diabetes Mellitus (T1DM, T2DM): A Systematic Review and Meta-Analysis. Diabetology 2021, 2, 272-285. https://doi.org/10.3390/diabetology2040025
Driza AR, Kapoula GV, Bagos PG. Urinary N-Acetyl-β-d-glucosaminidase (uNAG) as an Indicative Biomarker of Early Diabetic Nephropathy in Patients with Diabetes Mellitus (T1DM, T2DM): A Systematic Review and Meta-Analysis. Diabetology. 2021; 2(4):272-285. https://doi.org/10.3390/diabetology2040025
Chicago/Turabian StyleDriza, Arlinda R., Georgia V. Kapoula, and Pantelis G. Bagos. 2021. "Urinary N-Acetyl-β-d-glucosaminidase (uNAG) as an Indicative Biomarker of Early Diabetic Nephropathy in Patients with Diabetes Mellitus (T1DM, T2DM): A Systematic Review and Meta-Analysis" Diabetology 2, no. 4: 272-285. https://doi.org/10.3390/diabetology2040025