Article

Soil Colour and Plant-Wax Markers: Application in Forensic Investigations under Urban Subtropical Environments

1
Department of Soil Science and Agricultural Engineering, Federal University of Paraná, Funcionários St. 1540, Curitiba 80035-050, PR, Brazil
2
Environmental and Biochemical Sciences Group, The James Hutton Institute, Craigiebuckler, Aberdeen AB15 8QH, UK
3
Technical and Scientific Sector, Federal Police Department, Professora Sandalia Monzon St. 210, Curitiba 82640-040, PR, Brazil
*
Author to whom correspondence should be addressed.
Forensic Sci. 2022, 2(1), 57-71; https://doi.org/10.3390/forensicsci2010005
Submission received: 22 November 2021 / Revised: 29 December 2021 / Accepted: 5 January 2022 / Published: 14 January 2022
(This article belongs to the Special Issue Forensic Geoscience and Death Investigations)

Abstract

:
Most cases involving soil in criminal investigations in Brazil have focused on the chemical and mineralogical analyses of soil fractions without including the organic matter. The organic fraction contains plant-wax markers which may be useful to “fingerprint” forensic soils due to their chemical diversity, relative longevity and resistant nature. The aim of this study was to test the long- (kilometre), medium- (metre) and short- (centimetre) scale variability of plant-wax biomarkers in a forensic context in anthropised urban soils and soils developed under subtropical conditions. Two areas from the Curitiba municipality and two areas from the Colombo municipality, Paraná State, South Brazil, were selected. Soil colour analysis was carried out to obtain reflectance data over the 360–740 nm wavelength range. Furthermore, plant-wax marker compounds (n-alkanes and fatty-alcohols) were assessed by extraction and separation into different classes and an analysis of the compounds by gas chromatography (GC/MS). The compositions of the wax-marker profiles were different in samples collected side-by-side, showing sensitivity to local variations under subtropical conditions and in areas under intense human urban disturbance. Under these conditions, biomarkers may be used in real crime scenes, even on a micrometric scale of variation.

1. Introduction

In forensic science, soil is an important form of trace evidence and can be used to test for potential links between soil on a questioned item and a potential source location. Since traces of soil can readily become trapped on the underside of footwear and on vehicle tires, soil has long been considered to be a potential source of forensic information [1,2,3,4,5,6]. Provided that a well-tested and robust method (with chemical, physical, mineralogical and organic data) for the characterisation of the samples is available and used appropriately, a potential link can be tested and established between a suspect and a crime scene [3,4].
Inorganic soil analyses have been successfully used in forensic investigations [3,4,7,8,9,10,11], and organic approaches have less frequently been employed. Many soils have less than 5% (w/w) of organic matter content, particularly tropical and subtropical soils, and this has expressive effects on the biological, chemical and physical characteristics of the soil, even if it is present at reduced contents. Furthermore, this material can be used successfully in forensic studies, as organic matter is an inherent part of the soil, that is, for a given material to be considered as soil, it must have a minimum level of organic material, in addition to containing the inorganic mineral fractions (sand, silt and clay) in different proportions. As the concentration of organic matter varies with the soil concentration, dilutions of the organic matter content depend on the amount of soil sampled at the crime scene, such as the amount found on the sole of shoes and on the vehicle tires [3,4,12,13].
Traditional forensic approaches in Brazil have focused on the determination of the total elemental content and the physical fractionation of the soil [14]. In an alternative forensic approach, the composition of soil organic matter is determined by pyrolysis–gas chromatography/mass spectrometry (Py–GC/MS) [15]. Py–GC/MS analyses allow a qualitative investigation of the nature of organic materials and are efficient in identifying different compounds at the molecular level [16]. Soil organic biomarkers have received limited attention in forensic soil science, with only a few studies worldwide [17,18,19,20]. The relative abundance of organic compounds can vary considerably between soil samples only a short distance apart [13,21]. In most soils, especially in the topsoil, the organic compounds which have originated from the surface wax of plants are abundant. These compounds enter into the soil as fallen plant leaves and plant litter such as seeds, flowers and stems. Since plant roots have low concentrations of plant-wax compounds, they generally make a small contribution to the total content of these compounds in soils [4,18]. The most common and widely studied wax-marker compound class is the hydrocarbons, including n-alkanes, and the free and esterified long-chain fatty alcohols (high molecular-weight, straight-chain primary alcohols, derived from natural fats and oils) and fatty acids (carboxylic acids with a long aliphatic chain, containing a hydrocarbon chain and a terminal carboxyl group) [17,22,23,24] can also be used. These methods have been well-tested [12,25,26,27,28] and have been accepted in UK courts, including courts in England, Wales and Scotland over the last 15 years.
Whilst the highest-order plants contain these compounds, the relative proportions of individual compounds can differ greatly between plant species, and in some instances, between different parts of the same plant [2,4,18,25,26,27,28,29]. Although they can amount to only around 1% of the organic matter, they are very useful markers to “fingerprint” soils for forensic investigations due to their chemical diversity, relative longevity and resistant nature [30,31,32].
Forensic studies using plant-wax compounds have been tested mainly under temperate conditions, over a wide range of both rural and urban areas [17,20]. Under tropical and subtropical conditions, the potential of the use of plant-wax biomarkers in a forensic context is still unknown. Urban soils are frequently disturbed due land-clearing practices which change the dominant vegetation cover, and this study involved samples which were collected from land at the front of buildings facing the street and with residential buildings on both sides, presenting a high potential for having experienced a considerable amount of anthropic management. Another important factor is the greater degree of decomposition of the wax biomarkers under the warm and humid climate conditions experienced in this region of Brazil [33]. The soil has a unique and ubiquitous nature given its physical, chemical, biological and mineralogical characteristics, which allow it to be differentiated between the most varied environments. The uniqueness of the soil in regard to its characteristics makes it a powerful source of information in forensic investigations, because, due to its variability, it is possible to discriminate and associate it with a specific individual or object related to a crime scene. In tropical and subtropical conditions, it is observed that inorganic mineral fractions are more frequently used to investigate traces of soil sampled at crime scenes, possibly due to several factors, such as the heterogeneous nature of soils under different climatic conditions which leads, for example, to the wide variations of the organic matter decomposition rates in relation to soils from temperate regions. In this way, this work presents itself as innovative, aiming to evaluate a new technique which is still untested in soils of tropical and subtropical regions and diversifying the analytical techniques beyond those commonly applied in forensic soils, such as X-ray diffraction, sequential chemical extraction by the use of ICP, microwave digestion with concentrated acids to obtain chemical semitotal contents and thermogravimetric analysis [8,9].
The aim of the present study was to test the long- (kilometre), medium- (metre) and short- (centimetre) scale variability of wax biomarkers in a forensic context in urban soils developed under subtropical conditions in Brazil. The scale of variation in the composition of the markers used as a function of the sampling distance was an important tool.

2. Materials and Methods

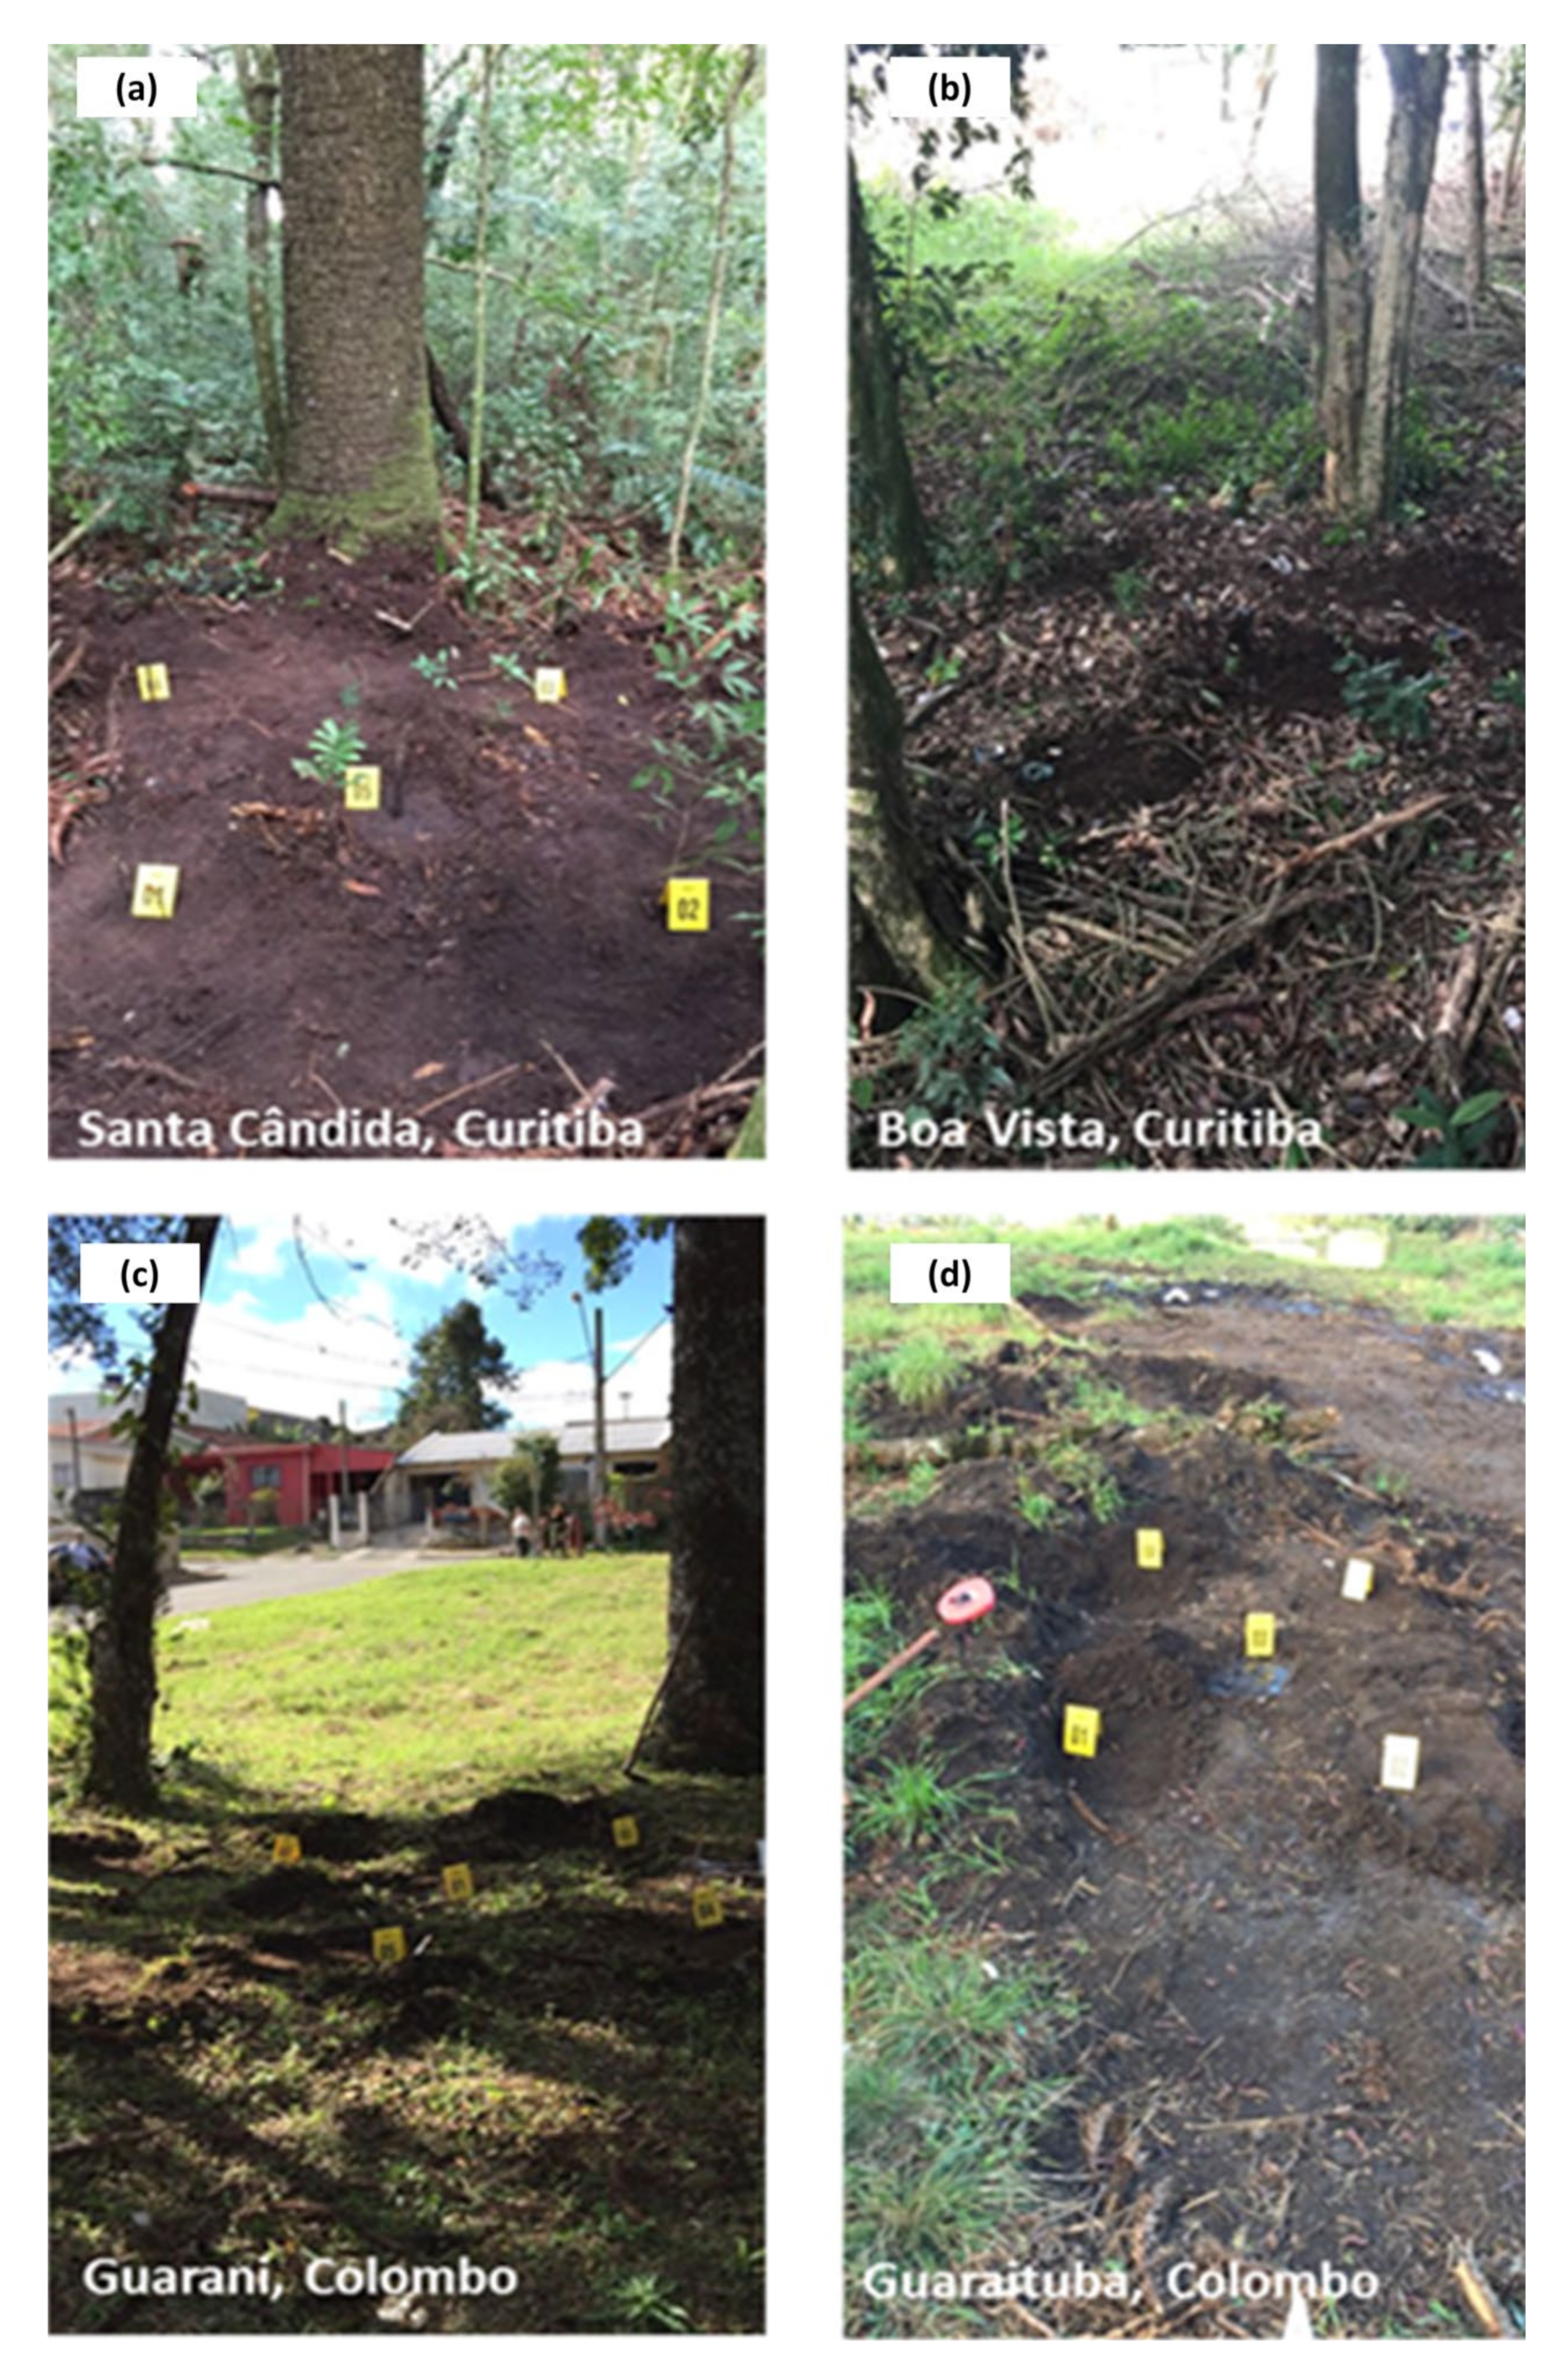
2.1. Soil Sites and Sampling

Two areas from the Curitiba municipality and two areas from the Colombo municipality, Paraná State, in the South of Brazil, were selected: the Santa Cândida and Boa Vista neighbourhoods of Curitiba and the Guarani and Guaraituba neighbourhoods of Colombo, located in the Metropolitan Region of Curitiba (Figure 1 and Figure 2). All soils were classified as inceptisol according to U.S. Soil Taxonomy [34] and as cambissolo háplico according to the Brazilian Soil Classification System [35].
The climate of the Curitiba and Colombo regions has been classified as Cfb type, according to the Köppen–Geiger classification, defined as mesothermic humid and super humid. The mean annual temperature is 16.5 °C, with mean temperature of 20.4 °C in the hottest months and 12.7 °C in the coldest months. The mean annual precipitation ranges from 1400 to 1500 mm and is regularly distributed across all months, and the relative air humidity is around 81%.
Locations which were not currently built over were selected across each urban area, and at each site four surface soils were sampled from the corners of a 1.5 m square (0–0.5 cm) quadrant in two replicates (Table 1). The replicates in each corner were sampled at a short distance from each other (10 cm). Soil samples were also adhered to the sole of a boot through a simulated experiment of a suspect walking over a crime scene (at the central position of Figure 2 in each location) [36]. The same average-height and average-build adult male walked across each scene. Soil trace samples on the sole of the boot were collected in 4 to 6 replicates (Table 1), according to the site of transfer and adherence (toe and heel positions on the sole of the boot, using the field sampling methodology previously reported in [10]. A total of 52 samples were collected (Table 1) and stored in secure individual sterile pots.
Only the top few centimetres of soil (or less) is usually transferred to questioned items (such tools, tyres, shoes and clothes), mainly under conditions of high rainfall and silty clay soils which favour the transfer and persistence of such material [17,37,38]. Therefore, the surface contact layer was sampled according to the normal procedure in a forensic investigation [33]. Soil samples were air-dried (40 °C for 24 h), sieved (2 mm mesh size) and then the fine fraction was subdivided into portions using an eight-channel cone and quarter system to provide a set of homogenous subsamples for the subsequent suite of both organic and inorganic analyses.
The vegetation currently growing at each site was not collected for analysis. Only a general description of the current growing vegetation was recorded (Figure 2). As it was an urban area, over the years there had been an intense turnover of the soils as a result of land-clearing practices and the introduction of new species of plants which may have covered the ground surface. For this reason, the establishment of direct relations between the composition of the soil wax biomarkers to the current vegetation of the areas was not considered relevant and the focus was on testing the variability over long, medium and short distances. Boa Vista was the site with most human disturbance and activity.

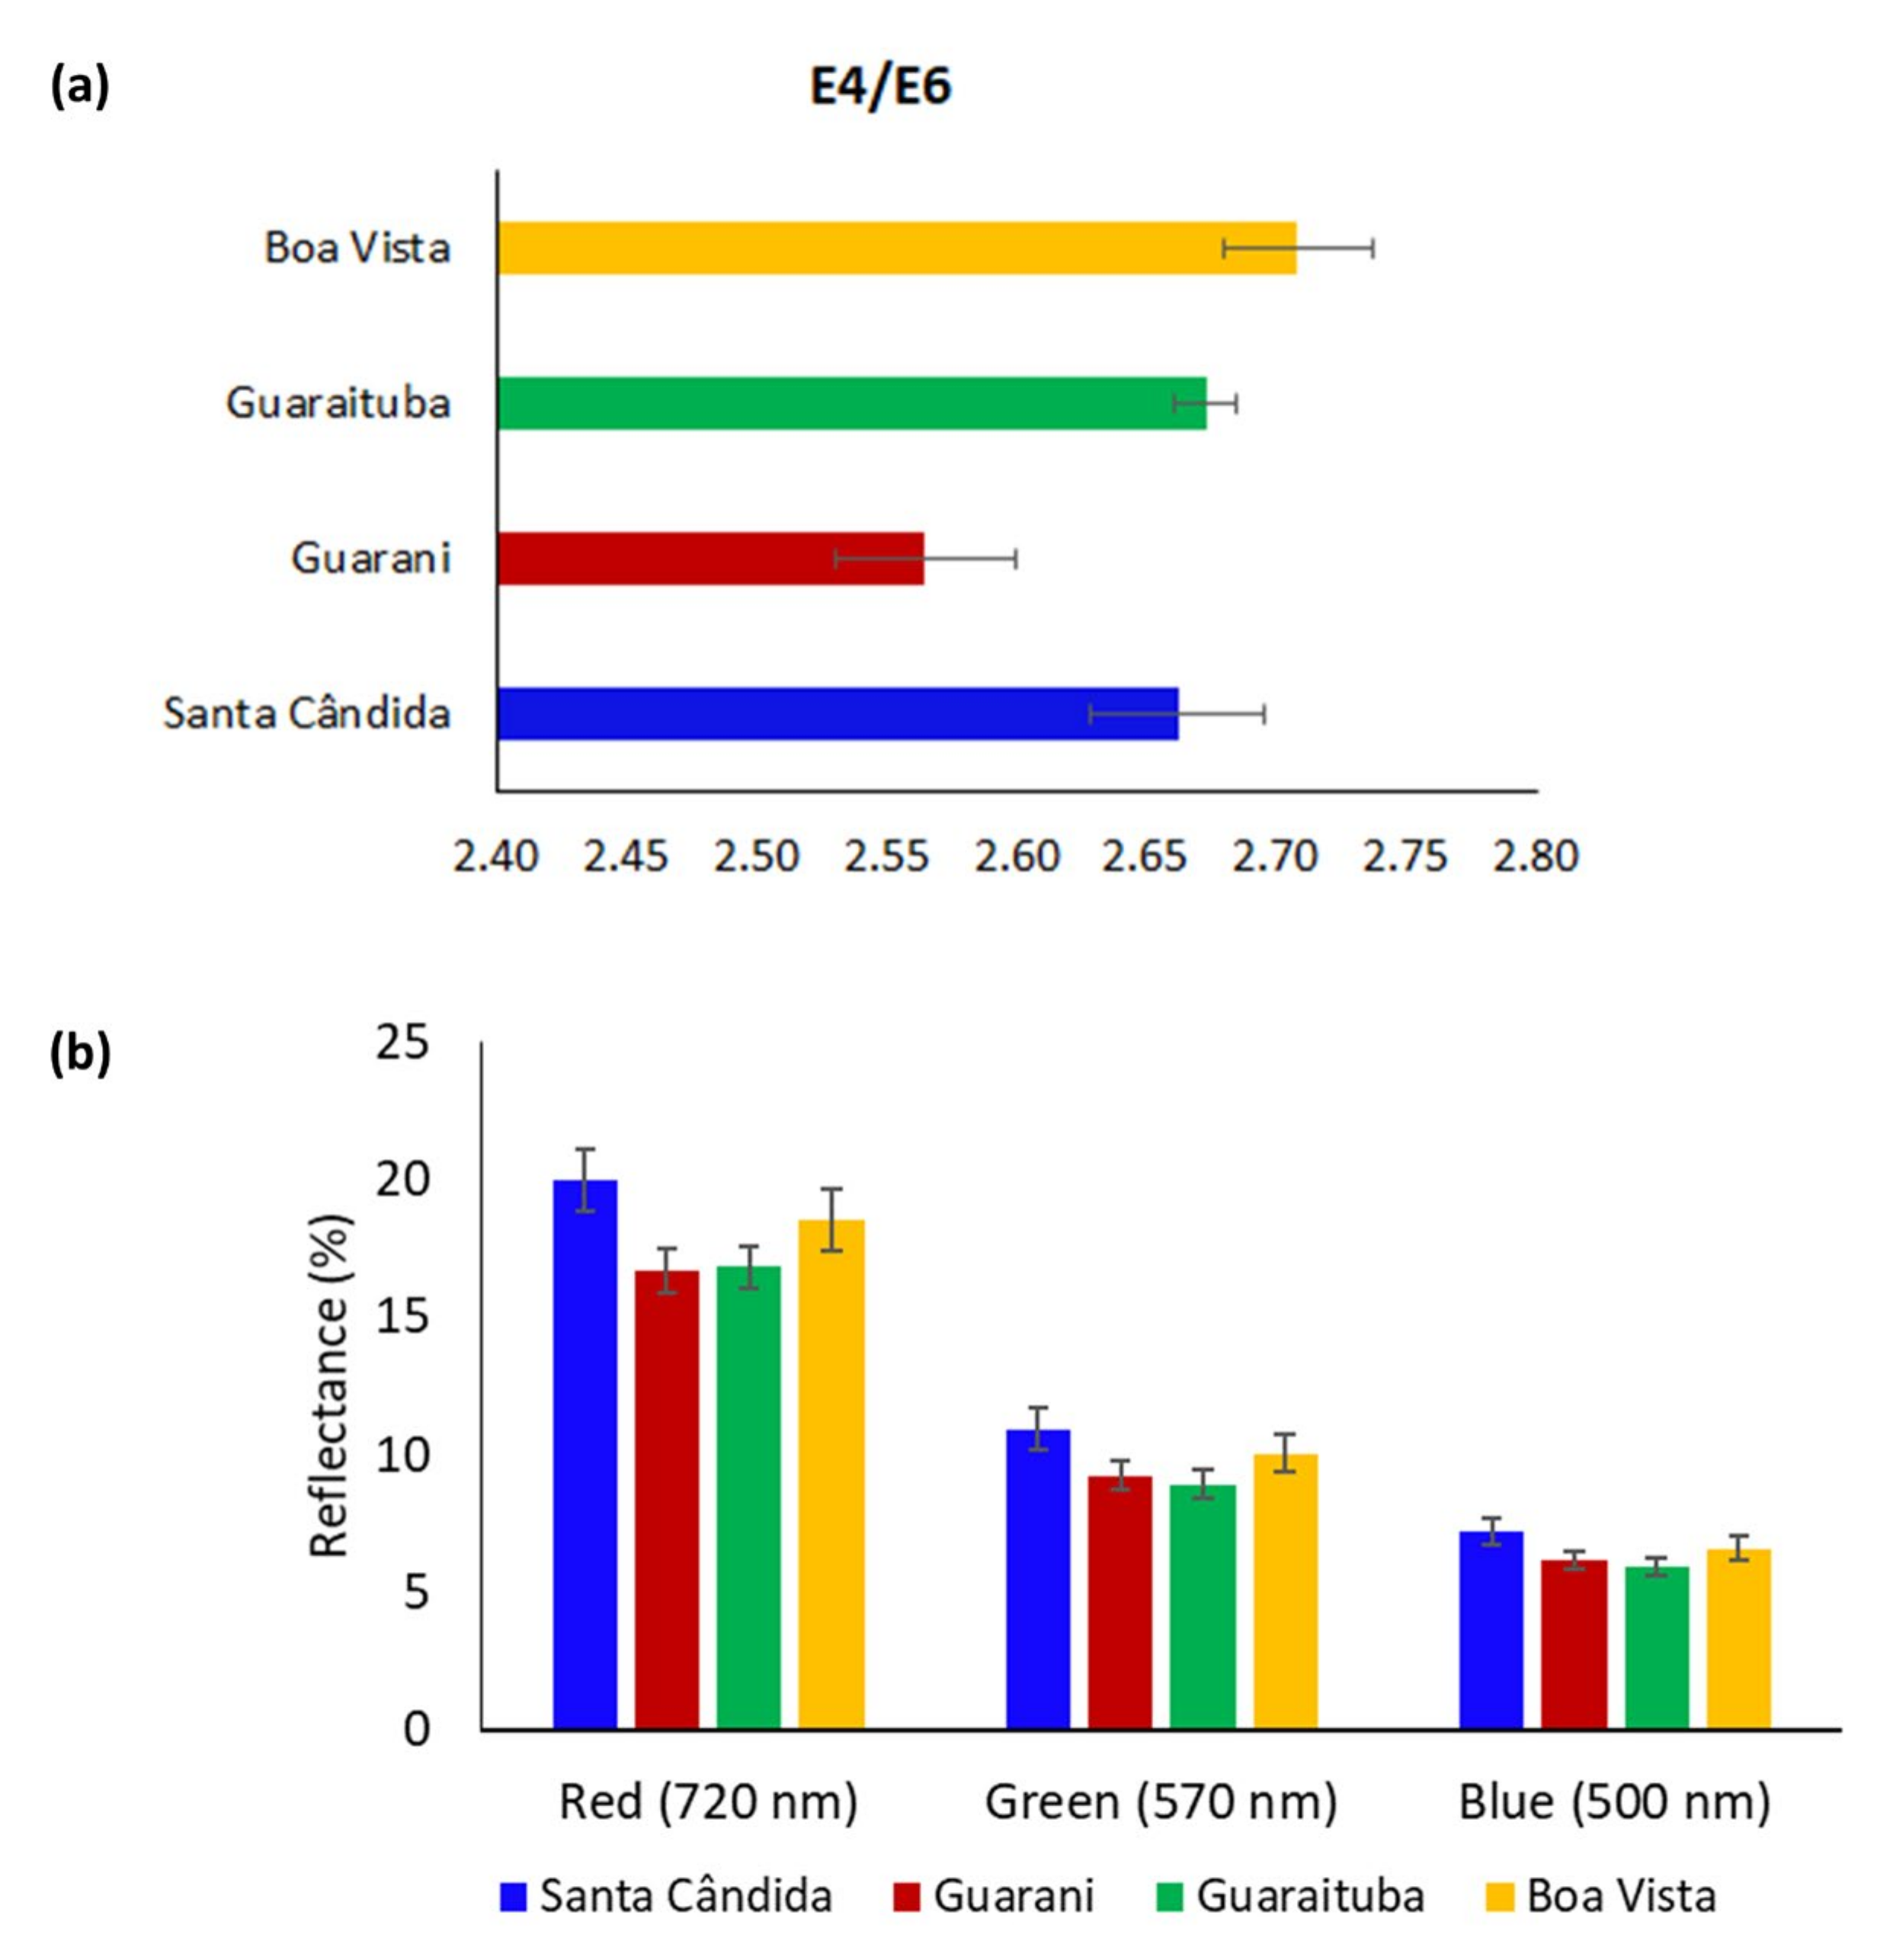
2.2. Colour Spectroscopy

Soil colour was determined from a milled and dried soil sample using a spectrophotometer CM2600d (Konica Minolta, Sensing Americas, Ramsey, NJ, USA) to obtain reflectance data over the 360–740 nm wavelength range. For each sample, data were averaged over triplicate measurements and converted to the CIELAB notation using SpectraMagic V3.61R2 software (Konica Minolta). E4/E6 ratios were calculated by the absorbance at 465 and 665 nm [38,39]. The RGB (red, green and blue) data were obtained from the reflectance values of the ultraviolet spectra, where R, G and B are related to the 720, 570 and 500 nm wavelengths, respectively [39].

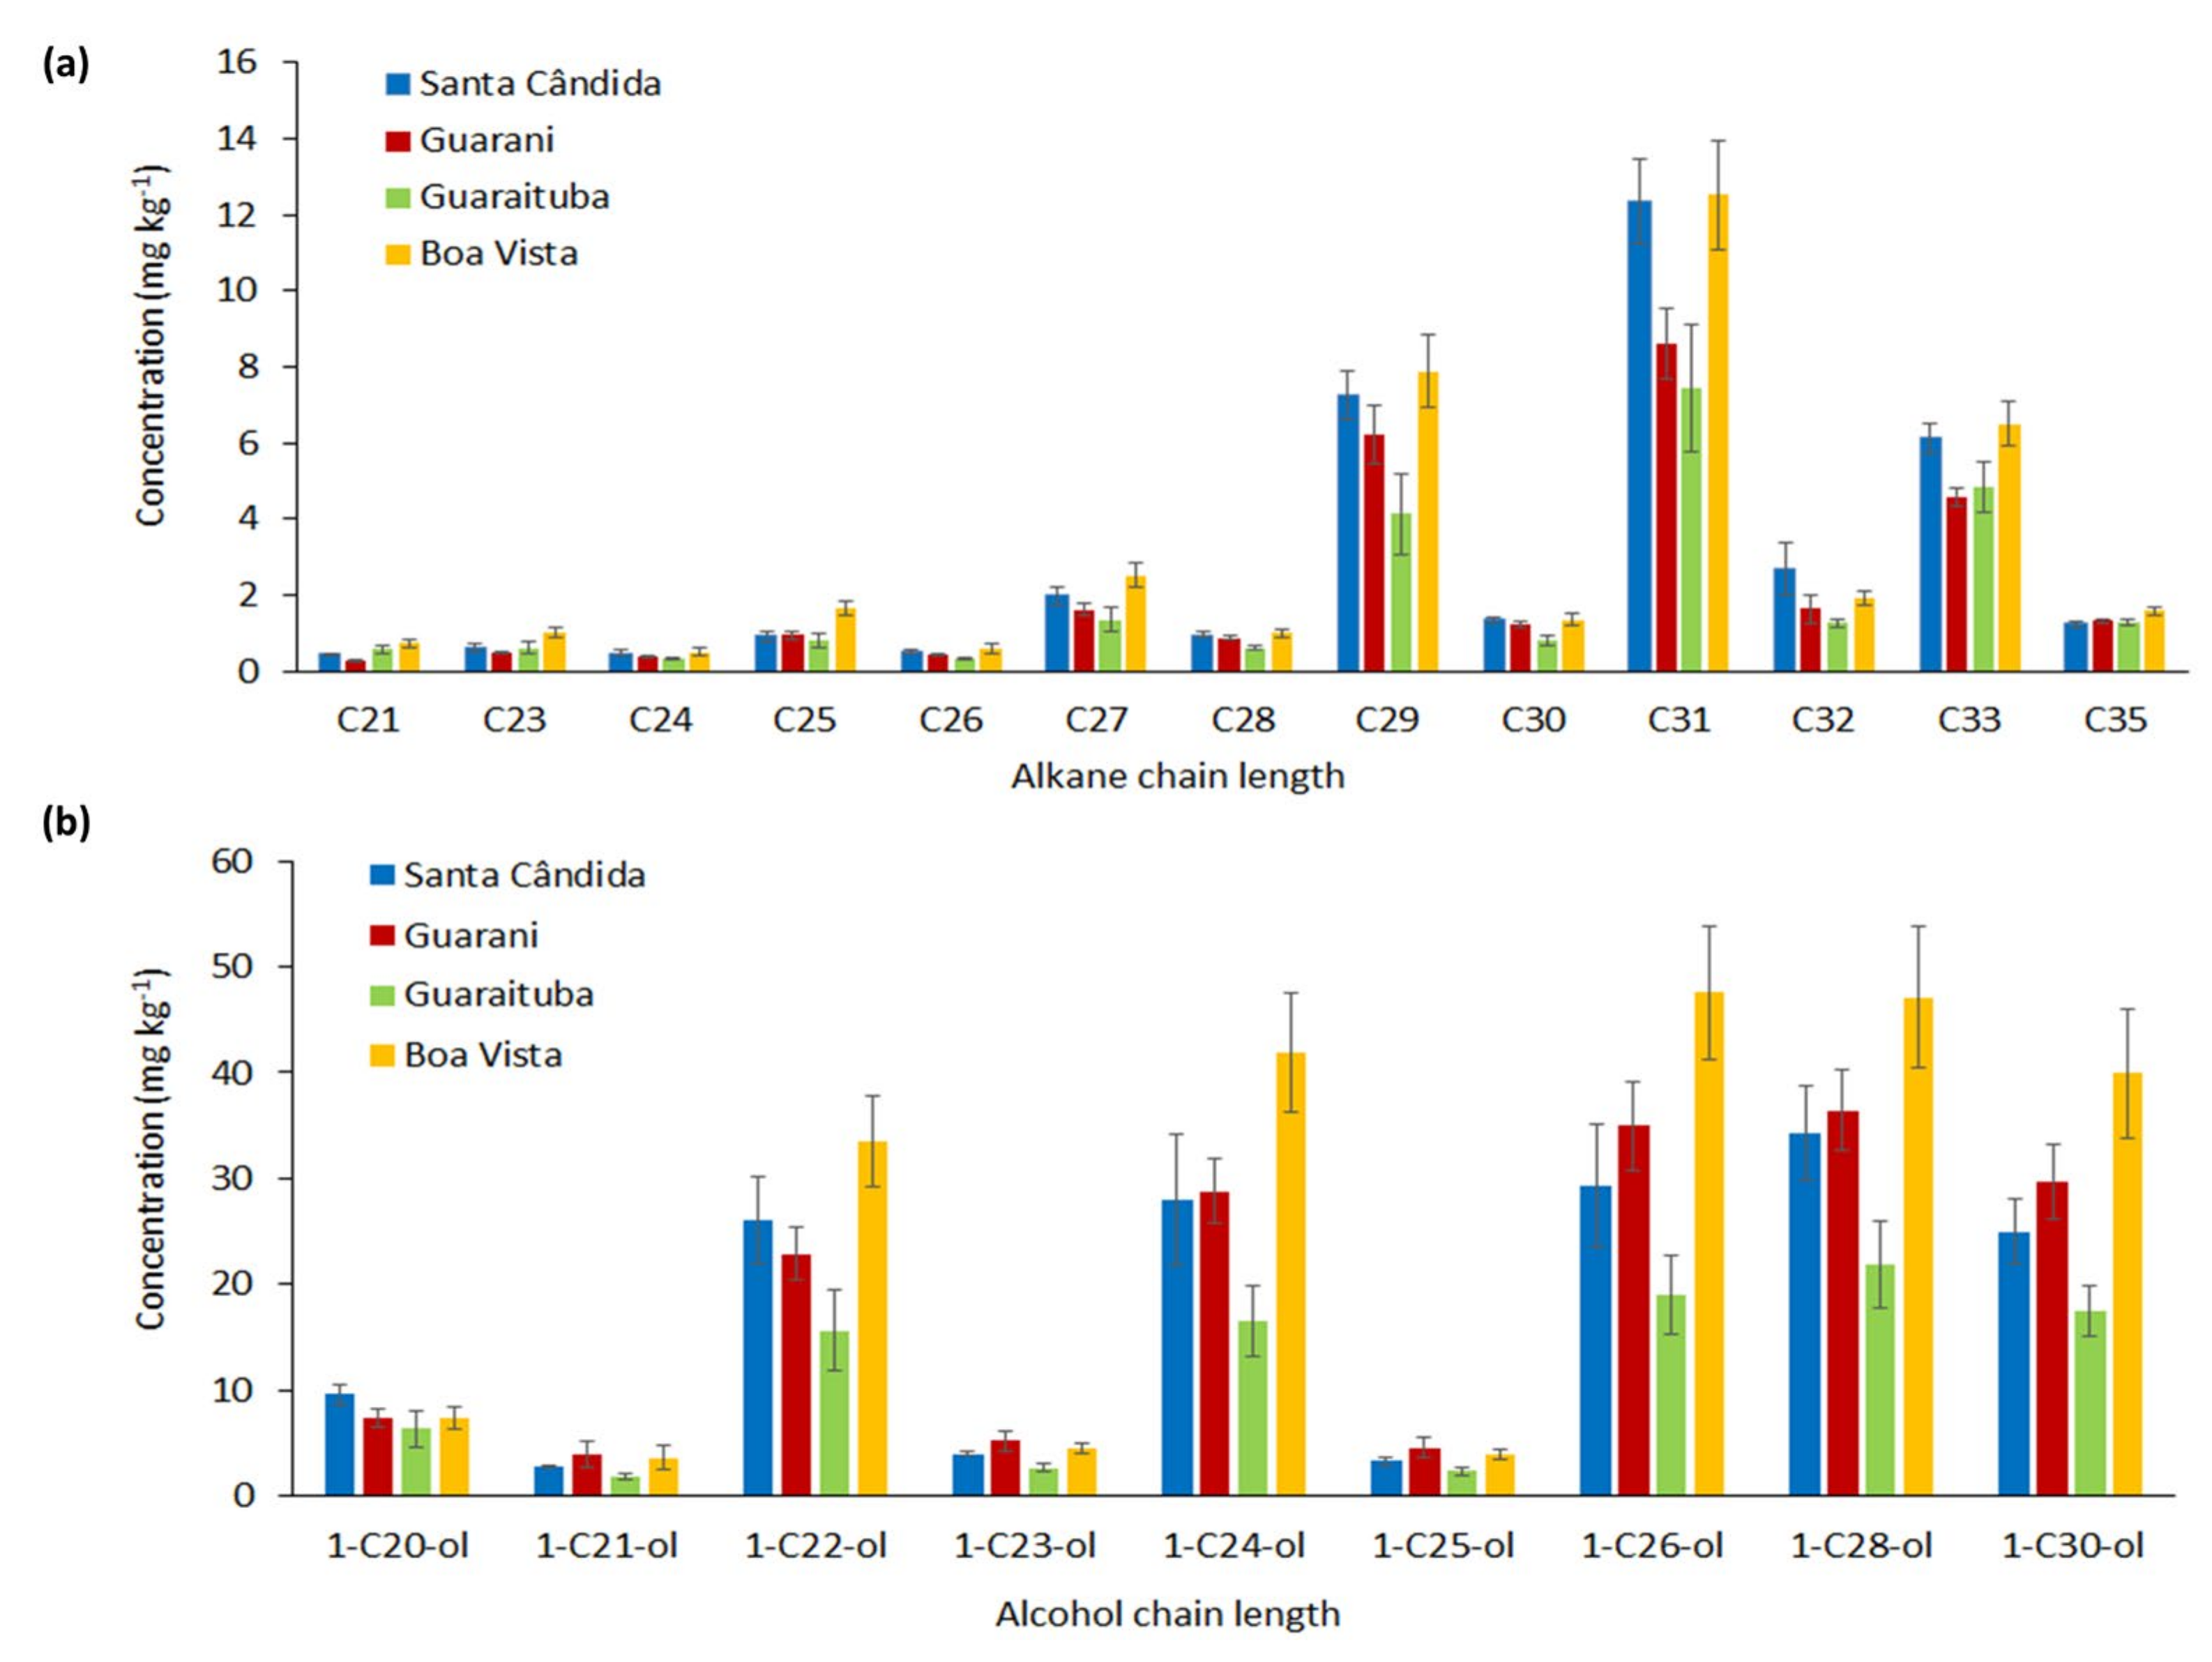
2.3. Plant-Wax Compound Determination by Gas Chromatography (GC/MS)

Plant-wax compound (n-alkane and fatty alcohol) analysis was carried out according to the method detailed in [26]. All solvents were redistilled prior to use and all aliquots were transferred with glass-tipped, calibrated autopipettes. All glassware was washed and rinsed in n-heptane before use. Samples were milled, weighed (0.20 g), dried in an oven at 50 °C for two hours, cooled in a desiccator, and then their moisture content was calculated.
Internal standards of docosane (C22) and tetratriacontane (C34) were added to each dry sample in decane at a concentration of 0.03 mg g−1, then n-heptacosanol (1-C27-ol) was added at a concentration of 0.12 mg g−1 to oven-dried milled samples prior to extraction. Samples were heated in 1 mol L−1 ethanolic KOH at 90 °C for 16 h (in triplicate), then the hydrocarbons were extracted in n-heptane, and this extract was evaporated to dryness, redissolved in heptane, purified and fractioned by loading through silica gel columns (Sigma Aldrich Ltd., St. Louis, MO, USA) that had been prepared with n-heptane.
The hydrocarbons were eluted with n-heptane, ketones were removed from the column with 97:3 n-heptane:ethyl acetate, and the crude alcohol fraction was collected by washing with 80:20 n-heptane:ethyl acetate. The hydrocarbon and crude alcohol extracts were then evaporated to dryness. The hydrocarbon fraction was redissolved in n-heptane, transferred to a GC/MS vial, evaporated to dryness, then dissolved in 20 µL dodecane prior to injection onto the GC/MS. Each of the crude alcohol fractions were redissolved in 100 µL n-heptane and 30 µL was loaded onto a capped 1 mL glass SPE (solid phase extraction) column, to which 60 µL saturated urea in ethanol was added. The columns were heated at 70 °C for 20 min and allowed to dry overnight, then the sterol/stanol fraction was recovered by elution with n-heptane, the urea removed by washing with water, and the fatty alcohols then eluted with n-heptane. Both fractions were then evaporated to dryness before derivatisation.
Acetate derivatives of the fatty alcohols were prepared by heating overnight with pyridine:acetic anhydride (5:1) at 50 °C. The acetate derivative was subsequently repeatedly redissolved in n-heptane, evaporated to dryness, then dissolved in 25 µL dodecane prior to injection onto the GC/MS (PU4500, Phillips, Amsterdam, The Netherlands) with a flame ionisation detector, a nonpolar silica capillary column (30 m × 0.52 µm internal diameter, 0.25 µm film thickness and He carrier gas at 5 cm3 min−1) and a direct injector.
The concentrations of the compounds were determined according to the methodology of Dove and Mayes [25], based on the addition of adequate internal standards (internal standard C34). It was assumed that, after extraction and other processing, the degree to which the analytes were recovered was the same as that of the internal standards.

2.4. Statistical Analysis

Multivariate analysis was applied to verify the variability of organic compounds in highly anthropised urban soils separated by short (replicates sampled at the same corner (10 cm apart) and replicates sampled on the sole of the boot (1 to 2 cm apart)), medium (repetitions sampled at different corners belonging to the same quadrant (1.5 m apart)) and long distances (samples collected in different neighbourhoods (3.7 to 9.8 km apart)) under subtropical conditions. In order to ensure the traceability of the sample collected from the suspect in forensic cases, the variations must allow for testing of positioning at the crime scene. As a simpler methodological alternative (spectroscopy) in relation to the determination of wax compounds (chromatography), the clustering pattern of the samples was verified by only the soil-colour data (E4/E6 ratio and reflectance at 720, 570 and 500 nm wavelengths).
Data were exported and comparisons between samples were visualised by the Bray–Curtis method for clustering of similarity, carried out in PAST [40] (Paleontological Statistics, 3.20 version), and by Principal Component Analysis (PCA) based on Statistica software [41].

3. Results

The samples collected in the Guarani neighbourhood (Table 1) presented the lowest values for the E4/E6 ratio (Figure 3a). The E4/E6 ratio is related to the condensation degree of the aromaticity or aliphaticity and the molecular weight of organic compounds [39,42,43]. Higher E4/E6 ratios (Boa Vista neighbourhood) are generally associated with more aliphatic and low-molecular-weight structures [44], with branched and straight-chain carbons [45,46]. The greater presence of vegetation with aliphatic groups (less humified) in Boa Vista could also be observed in the greater reflectance at 725–720 nm (red region) (Figure 3b), typical of long aliphatic chains with C–C and C–H bonds [45]. The RGB reflectance of the visible spectrum (500 to 720 nm) may be attributed to less aromatic chemical structures. These relationships obtained through colour spectroscopy and the qualitative aspects of the organic matter may be related to the nature of the residue of plants present in the soil [44,47].
At all the sites there was a predominance of odd long-chain alkanes (C29, C31 and C33); on the other hand, the values of C35 were low (Figure 4a). The hydrocarbons, including n-alkanes, are the most common and widely studied wax compounds [22,26,48]. The provenance of these compounds is mainly from the wax of the vegetation that enters into the soil as fallen leaves and other plant litter such as seeds, flowers and stems [12]. The n-alkanes, with odd-numbered carbon chains, are the predominant markers found in cuticular wax, especially the C27, C29, C31 and C33 alkanes [24,27,47], with C29 and C31 being the dominant compounds (Figure 4a).
C27, C29 and C31 alkane content is commonly found in the same corresponding plants, which explains the greater presence of these long-chain waxes in all the soils from the sites studied (Figure 4a). However, the compound concentrations in the plant may vary according to the photosynthetic pathways [49]. In some studies, it has been postulated that C31 represents grass input, while C27 and C29 represent input from trees and shrubs [17,22,23,24]. The input of different plant species at various stages of decomposition as a result of more intensive human influence is reflected in the higher concentrations of these long-chain alkanes at the Boa Vista site (Figure 4a). The lower concentrations of n-alkanes at the Guarani site (Figure 4a) may be associated with the low E4/E6 ratios (Figure 3a), which indicate the small input of more condensed chemical structures.
The consequent soil wax concentrations were also a result of the climatic conditions, reflecting the faster biosynthesis of these compounds under tropical and subtropical conditions [50] than under temperate conditions. The biodegradation of n-alkanes, for example, occurs at mesophilic temperatures [34]. Higher temperatures and increased rainfall were commonly found in Brazil, compared to the studies carried out in a temperate climate such as in the UK [28,33].
Another important constituent of plant-wax markers are the alcohols (Figure 4b). Higher C22, C24, C26, C28 and C30 compound contents were observed. The chain lengths of C26, C28 and C30 are generally found in cuticular wax, while the midchains C22 and C24 are constituents of suberin [50]. Compounds of n-alcohols with hydroxyl groups (-OH) are one of the main components of plant wax and, just like n-alkanes, can be biodegraded more quickly under warm and humid climate conditions. Concentrations of C26 were found in all sites, with the highest concentration in Boa Vista (Figure 4b). This compound is predominant in grass species [50]. Likewise, the concentration of n-alkanes and the E4/E6 ratios at this site reflected the impact of anthropisation on the original composition of these biomarkers in the soil, since this site was identified as having expereienced heavy urban modification in relation to the other sites.
All the variables obtained in the study (spectral colour, alkanes and alcohols) were explored using principal component analysis (PCA) (Figure 5). The cumulative variance of the principal components one and two (PC1 and PC2) was high. The samples from the Guaraituba neighbourhoods were grouped well in the PCA (Figure 5a), with a related Bray–Curtis clustering of similarity (6a) based on n-alkanes and fatty alcohols. The use of plant-wax markers in discriminating between soils/sediments from different plant communities has been clearly demonstrated on UK soils under temperate conditions [4,27,28].
Results of mineralogical analyses of the same samples used in this study were obtained by [10]. These authors worked with the silt and clay fraction in a sequential chemical procedure (extraction with ammonium oxalate, sodium dithionite-citrate-bicarbonate and NaOH 0.5 mol L−1). This comparison is proposed here with the aim of showing the variability of the data referring to the same samples; however, the analyses were carried out on different fractions to those presented in this work. Therefore, in the comparisons below, to verify the efficiency of the variations in the composition of the plant-wax markers in relation to the minerals, the values of the intragroup similarities were used:
(a)
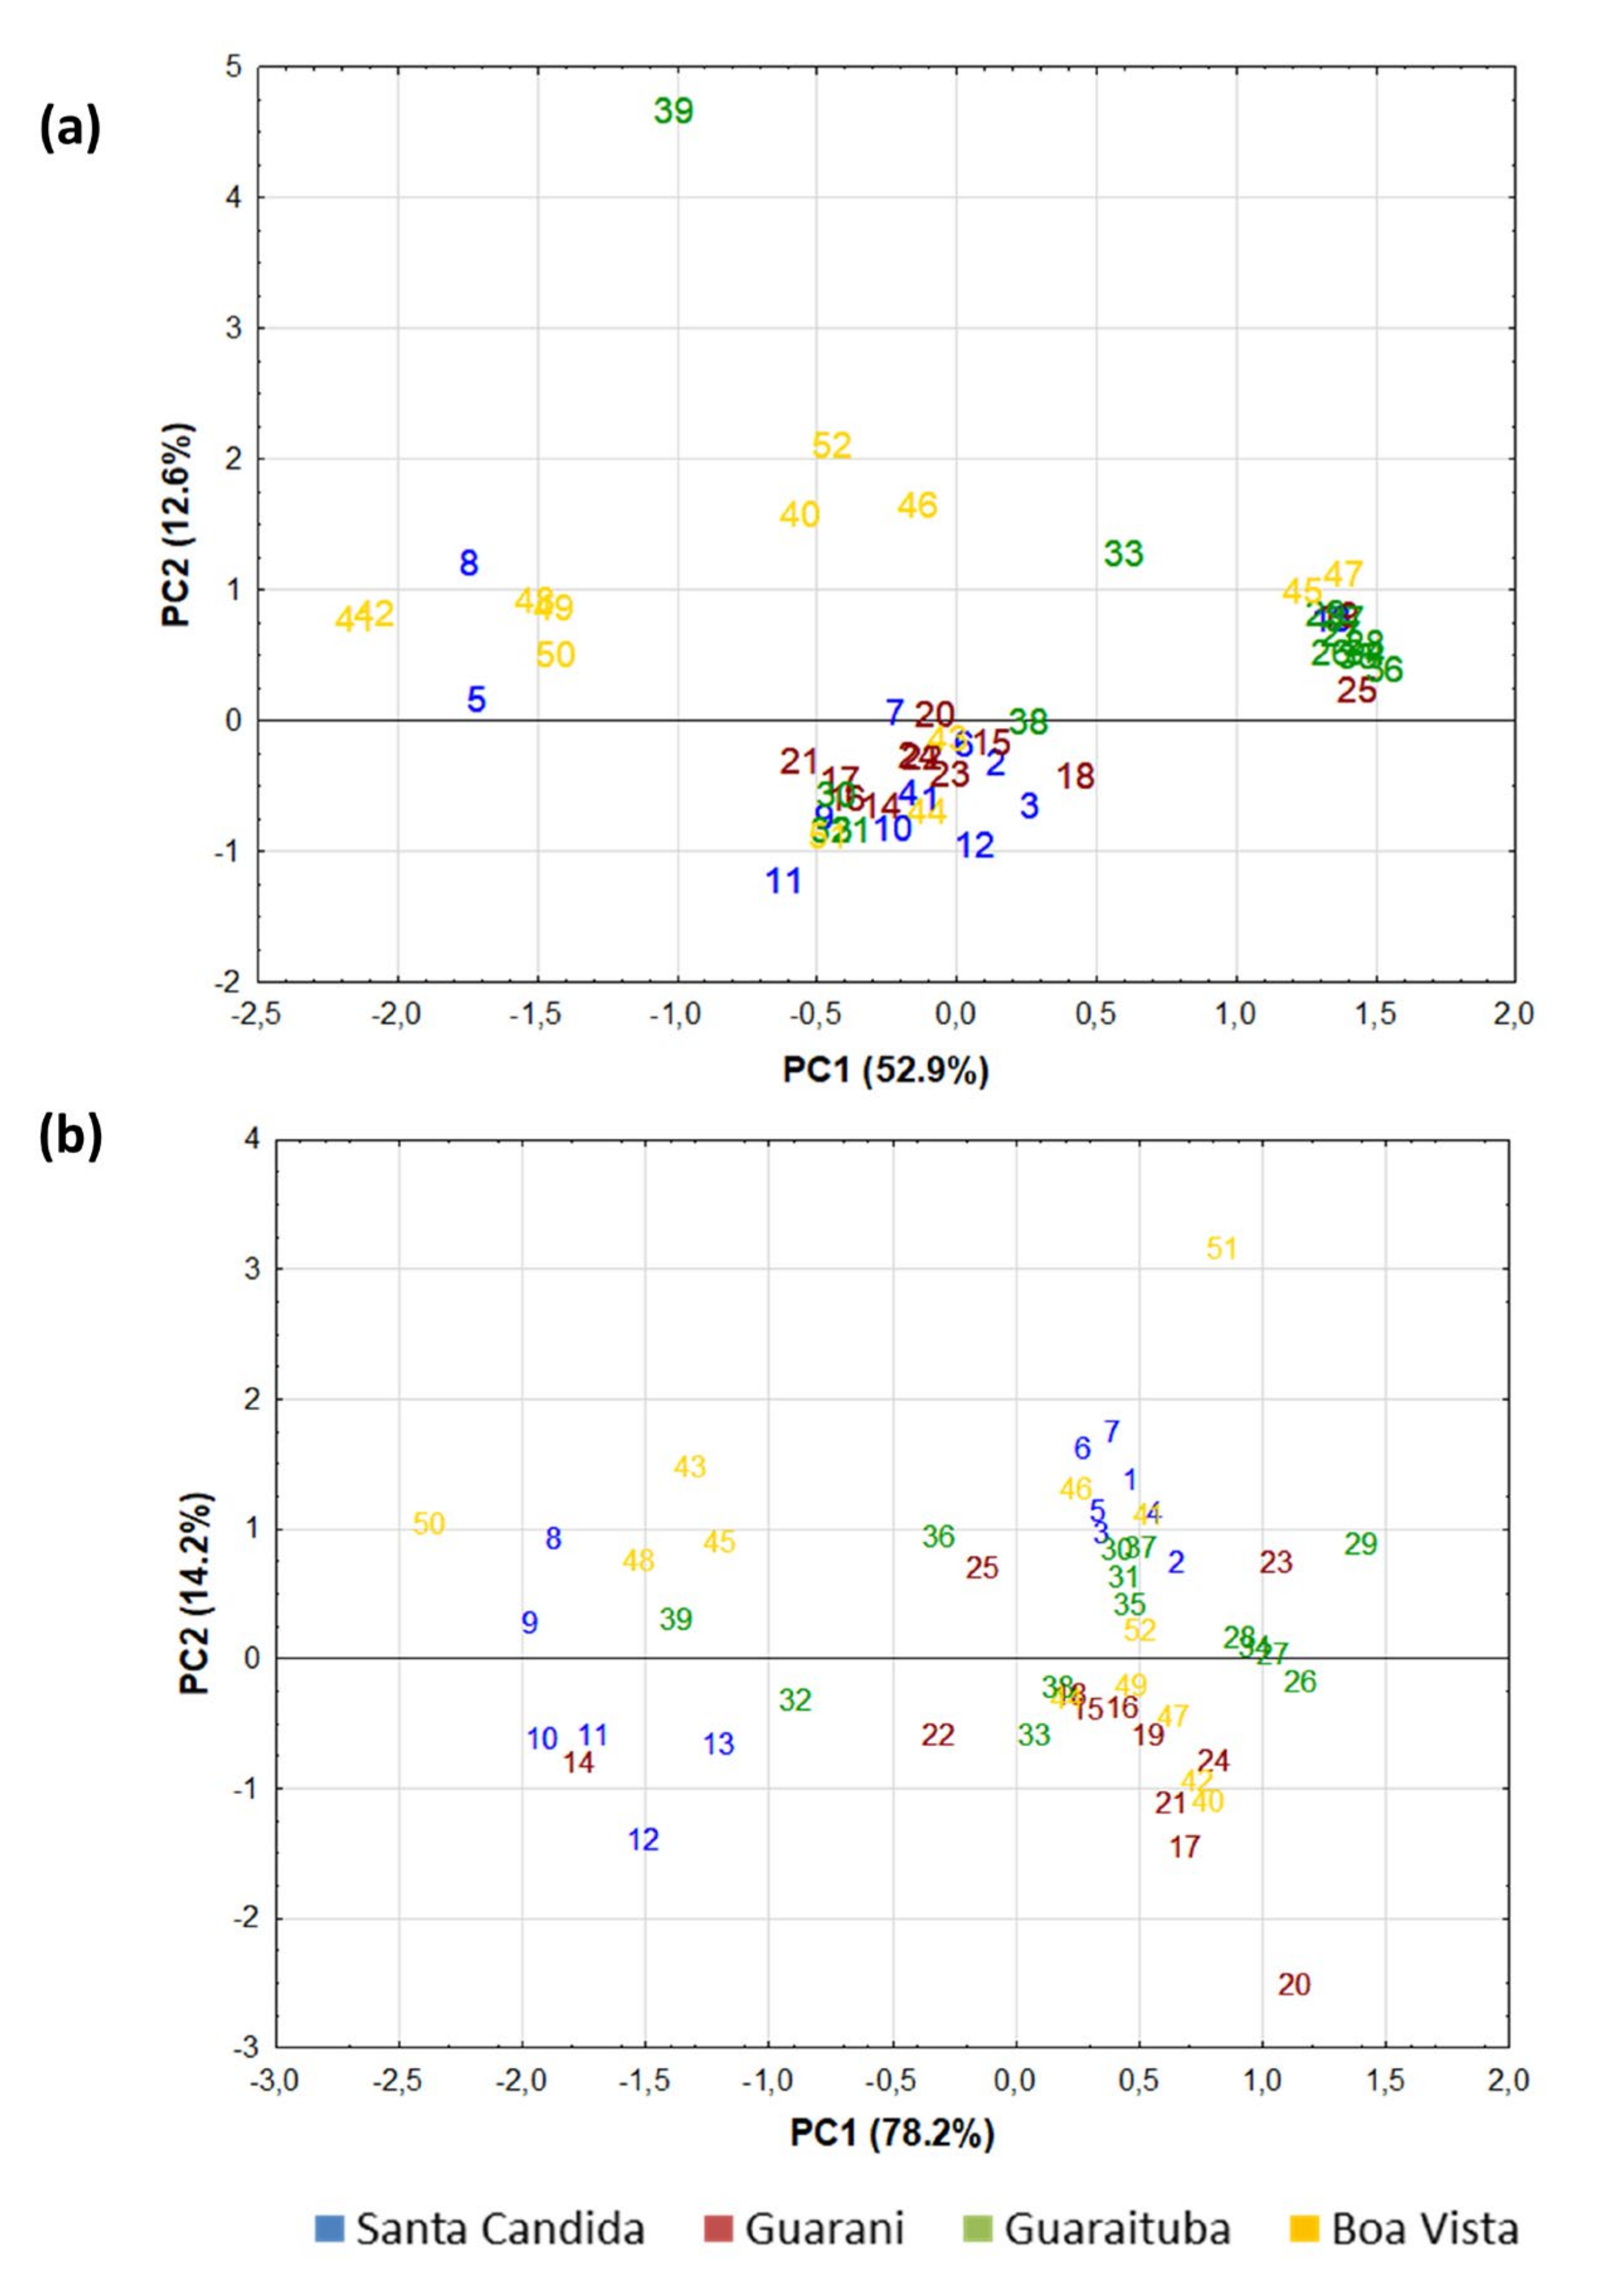
Samples collected over long and medium distances (kilometres and metres)—in this comparison, samples from the same neighbourhood (corners and centre of the quadrant) must be placed in the same homogeneous group if the sample comes from the same place on the ground. Santa Cândida (intragroup similarities): [10]—95%; the present study (Figure 6a)—42%. Guarani (intragroup similarities): [10]—97%; present study (Figure 6a)—42%. Guaraituba (intragroup similarities): [10]—97%; present study (Figure 6a)—42%. Boa Vista (intragroup similarities): [10]—93%; present study (Figure 6a)—42%.
(b)
Samples collected over a short distance from the sole of a boot (centimetres)—in this comparison, samples collected from the same boot sole should be placed in the same homogeneous group if the sample comes from the same place on the ground. Santa Cândida (intragroup similarities): [10]—97%; present study (Figure 6a)—42%. Guarani (intragroup similarities): [10]—98%; present study (Figure 6a)—42%. Guaraituba (intragroup similarities): [10]—98%; present study (Figure 6a)—42%. Boa Vista (intragroup similarities): [10]—94%; present study (Figure 6a)—73%.
Thus, the compositions of wax markers can be distinguished in samples collected side-by-side: metres apart—corners and centre of the same quadrant; centimetres apart—same boot sole. The analysis of the biomarkers was extremely sensitive under subtropical conditions and under intense urban occupation. This greater sensitivity in relation to the chemical analyses of the mineral fraction of soils can be used in specific forensic studies to trace samples on a microscale.
When the average contents of the alkanes of the four samples collected in the corners of the quadrants and the average contents of the alkanes in the sole of the boot were used, there was a better grouping of the quadrant with its respective sample from the centre of the quadrant (Figure 7a). This behaviour indicates that a regular soil-sampling grid should be carried out at short distances at the crime scene. In this case, a comparison should be made between the vestige sample collected from the suspect and the average composition of all the samples collected in the grid at the crime scene. The use of the average composition of alcohols had less power for grouping (Figure 7b). For the alkanes, the two areas of the city of Colombo were adequately separated in the Bray–Curtis analysis (Figure 7a).
The variation of the samples in the absorption of visible light (400 to 800 nm) was also intense in the samples collected at medium (quadrant) and short distances (two repetitions of the same corner and repetitions of the same boot sole) (Figure 6b). The similarity of samples from the same neighbourhood was low: Santa Cândida, Guarani, Guaraituba, Boa Vista—79%, a low value of similarity to infer a common source [4,12]. The colour parameters of the samples collected on the same boot sole were much less variable than the composition of the wax markers (the similarity of the repetitions of the trace sample) for Santa Cândida (96%) and Guarani (92%). For Guaraituba and Boa Vista, the similarity values for the boot repetitions remained the same (79%). As the soil surface layer (0–5 cm) was sampled, organic matter was likely the main component that defined the colour of the samples.
Here, we discuss the spectral colour data and the contents of plant-wax marker alkanes and alcohols, mainly based on an individual match, which can be useful and suitable for the spatial and geographical identification of areas. Nevertheless, it is important to point out that this data assessment can have its limitations, as it does not consider a comprehensive analysis of the dataset and its possible interrelationships.

4. Conclusions

Both the soil colour and the composition of the plant-wax markers were highly variable at medium (metres) and short distances (centimetres). Under the environmental conditions of the present study (urban area with a subtropical climate), the composition of the wax markers was different in samples collected side-by-side (for example, the sole of a suspect’s boot). The composition of the biomarkers was very sensitive to local variations under subtropical conditions and in areas under intense urban use. Under these conditions, biomarkers may be used in real crime scenes on a centimetre scale of variation or when using average values from a large number of soil samples. The analysis of alkanes was more discriminating compared with alcohols. Consideration should be given to the spatial scale of the variability of the methods used in any investigation, as it is important in the evaluation of potential linkages with a particular location, such as at a crime scene. This is why two or more analytical methods are often adopted in a case to avoid potential false exclusions or false associations.

Author Contributions

Conceptualization, L.D., V.M. and S.T.; methodology, L.D., V.M. and S.T.; software, L.D. and S.T.; validation, L.D., V.M., S.T., J.L.-M., B.R. and F.S.; formal analysis, S.T.; investigation, L.D., V.M. and S.T.; resources, V.M. and L.D.; data curation, L.D., V.M. and S.T.; writing—original draft preparation, L.D., V.M., S.T., J.L.-M., B.R. and F.S.; writing—review and editing, L.D., V.M., S.T., J.L.-M., B.R. and F.S.; visualization, L.D., V.M., S.T., J.L.-M., B.R. and F.S.; supervision, L.D. and V.M.; project administration, L.D. and V.M.; funding acquisition, L.D., V.M. and F.S. All authors have read and agreed to the published version of the manuscript.

Funding

This research analysis was funded by the James Hutton Institute.

Institutional Review Board Statement

Not applicable.

Informed Consent Statement

Not applicable.

Data Availability Statement

Not applicable.

Acknowledgments

We thank Coordenação de Aperfeiçoamento de Pessoal de Nível Superio—Capes (Brazil) for the financial support (reference, Capes Forense 25/2014). We gratefully acknowledge the use of the laboratory facilities at the James Hutton Institute, Aberdeen, supported by the Scottish Government (Rural and Environment Science and Analytical Services), and Jasmine Ross for supervising the wax-marker analysis.

Conflicts of Interest

The authors declare no conflict of interest.

References

  1. Morgan, R.M.; Bull, P.A. Data Interpretation in Forensic Sediment and Soil Geochemistry. Environ. Forensics 2006, 7, 325–334. [Google Scholar] [CrossRef] [Green Version]
  2. Ritz, K.; Dawson, L.; Miller, D. Criminal and Environmental Soil Forensics; Springer: New York, NY, USA, 2008. [Google Scholar]
  3. Dawson, L.A.; Hillier, S. Measurement of soil characteristics for forensic applications. Surf. Interface Anal. 2010, 42, 363–377. [Google Scholar] [CrossRef]
  4. Fitzpatrick, R.W.; Raven, M.D. Guidelines for Conducting Criminal and Environmental Soil Forensic Investigations: Version 7.0.076; Acid Sulfate Soils Centre: Adelaide, Australia, 2012. [Google Scholar]
  5. Murray, K.R.; Fitzpatrick, R.W.; Bottrill, R.S.; Berry, R.; Kobus, H. Soil transference patterns on bras: Image processing and laboratory dragging experiments. Forensic Sci. Int. 2016, 258, 88–100. [Google Scholar] [CrossRef] [PubMed]
  6. Chauhan, R.; Kumar, R.; Diwan, P.; Sharma, V. Thermogravimetric analysis and chemometric based methods for soil examination: Application to soil forensics. Forensic Chem. 2020, 17, 100191. [Google Scholar] [CrossRef]
  7. Nakai, I.; Furuya, S.; Bong, W.; Abe, Y.; Osaka, K.; Matsumoto, T.; Itou, M.; Ohta, A.; Ninomiya, T. Quantitative analysis of heavy elements and semi-quantitative evaluation of heavy mineral compositions of sediments in Japan for construction of a forensic soil database using synchrotron radiation X-ray analyses. X-ray Spectrom. 2014, 43, 38–48. [Google Scholar] [CrossRef]
  8. Melo, V.F.; Testoni, S.A.; Dawson, L.; de Lara, A.G.; da Silva Salvador, F.A. Can analysis of a small clod of soil help to solve a murder case? Sci. Justice 2019, 59, 667–677. [Google Scholar] [CrossRef]
  9. Testoni, S.A.; Melo, V.F.; Dawson, L.A.; Salvador, F.A.D.S.; Kunii, P.A. Validation of a Standard Operating Procedure (SOP) for Forensic Soils Investigation in Brazil. Revista Brasileira de Ciência do Solo 2019, 43, e0190010. [Google Scholar] [CrossRef] [Green Version]
  10. Prandel, L.; Melo, V.F.; Testoni, S.A.; Brinatti, A.M.; Saab, S.D.C.; Dawson, L.A. Spectroscopic techniques applied to discriminate soils for forensic purposes. Soil Res. 2020, 58, 151. [Google Scholar] [CrossRef]
  11. Dawson, L.A.; Mayes, R.W. Criminal and Environmental Soil Forensics: Soil as Physical Evidence in Forensic Investigations, Introduction to Environmental Forensics, 3rd ed.; Elsevier Ltd.: Amsterdam, The Netherlands, 2015; pp. 457–486. [Google Scholar] [CrossRef]
  12. Dawson, L. Soil organic characterisation in forensic case work. J. Int. Geosci. 2017, 40, 157–165. [Google Scholar] [CrossRef]
  13. Melo, V.; Mazzetto, J.M.; Dieckow, J.; Bonfleur, E.J. Factor analysis of organic soils for site discrimination in a forensic setting. Forensic Sci. Int. 2018, 290, 244–250. [Google Scholar] [CrossRef] [PubMed]
  14. Mazzetto, J.M.; Melo, V.F.; Bonfleur, E.; Vidal-Torrado, P.; Dieckow, J. Potential of soil organic matter molecular chemistry determined by pyrolysis-gas chromatography/mass spectrometry for forensic investigations. Sci. Justice 2019, 59, 635–642. [Google Scholar] [CrossRef]
  15. Schellekens, J.; Almeida-Santos, T.; Macedo, R.S.; Buurman, P.; Kuyper, T.W.; Vidal-Torrado, P. Molecular composition of several soil organic matter fractions from anthropogenic black soils (Terra Preta de Índio) in Amazonia—A pyrolysis-GC/MS study. Geoderma 2017, 288, 154–165. [Google Scholar] [CrossRef]
  16. Dawson, L.A.; Towers, W.; Mayes, R.W.; Craig, J.; Väisänen, R.K.; Waterhouse, E.C. The use of plant hydrocarbon signatures in characterizing soil organic matter. Geol. Soc. Spec. Publ. 2004, 232, 269–276. [Google Scholar] [CrossRef]
  17. Carvalho, Á.; Ribeiro, H.; Mayes, R.; Guedes, A.; Abreu, I.; Noronha, F.; Dawson, L. Organic matter characterization of sediments in two river beaches from northern Portugal for forensic application. Forensic Sci. Int. 2013, 233, 403–415. [Google Scholar] [CrossRef]
  18. Madureira-Carvalho, Á.; Ribeiro, H.; Newman, G.; Brewer, M.J.; Guedes, A.; Abreu, I.; Noronha, F.; Dawson, L. Geochemical analysis of sediment samples for forensic purposes: Characterisation of two river beaches from the Douro River, Portugal. Aust. J. Forensic Sci. 2018, 52, 222–234. [Google Scholar] [CrossRef]
  19. Mcculloch, G.; Dawson, L.A.; Ross, J.M.; Morgan, R.M. The discrimination of geoforensic trace material from close proximity locations by organic pro fi ling using HPLC and plant wax marker analysis by GC. Forensic Sci. Int. 2018, 288, 310–326. [Google Scholar] [CrossRef] [PubMed]
  20. Demanèche, S.; Schauser, L.; Dawson, L.; Franqueville, L.; Simonet, P. Microbial soil community analyses for forensic science: Application to a blind test. Forensic Sci. Int. 2016, 270, 153–158. [Google Scholar] [CrossRef] [PubMed]
  21. Meyers, P.A.; Ishiwatari, R. Lacustrine organic geochemistry-an overview of indicators of organic matter sources and dia-genesis in lake sediments. Org. Geochem. 1993, 20, 867–900. [Google Scholar] [CrossRef] [Green Version]
  22. Meyers, P.A. Application of organic geochemistry to paleolimnological reconstruction: A summary of examples from the Laurention Great Lakes. Org. Geochem. 2003, 34, 261–289. [Google Scholar] [CrossRef]
  23. Schellekens, J.; Buurman, P.; Pontevedra-Pombal, X. Selecting parameters for the environmental interpretation of peat mo-lecular chemistry–A pyrolysis-GC/MS study. Org. Geochem. 2009, 40, 678–691. [Google Scholar] [CrossRef]
  24. Dove, H.; Mayes, R.; Freer, M. Effects of species, plant part, and plant age on the n-alkane concentrations in the cuticular wax of pasture plants. Aust. J. Agric. Res. 1996, 47, 1333–1347. [Google Scholar] [CrossRef]
  25. Dove, H.; Mayes, R.W. Protocol for the analysis of n-alkanes and other plant-wax compounds and for their use as markers for quantifying the nutrient supply of large mammalian herbivores. Nat. Protoc. 2006, 1, 1680–1697. [Google Scholar] [CrossRef] [PubMed]
  26. Mayes, R.W.; Macdonald, L.M.; Ross, J.M.; Dawson, L.A. Discrimination of Domestic Garden Soils Using Plant Wax Compounds as Markers. In Criminal and Environmental Soil Forensics; Ritz, K., Dawson, L.A., Miller, D., Eds.; Springer: Cham, Switzerland, 2008; pp. 463–476. [Google Scholar] [CrossRef]
  27. McCulloch, G.; Dawson, L.; Brewer, M.; Morgan, R. The identification of markers for Geoforensic HPLC profiling at close proximity sites. Forensic Sci. Int. 2017, 272, 127–141. [Google Scholar] [CrossRef] [PubMed]
  28. Smith, D.G.; Mayes, R.W.; Raats, J.G. Effect of species, plant part, and season of harvest on n-alkane concentrations in the cuticular wax of common rangeland grasses from southern Africa. Aust. J. Agric. Res. 2001, 52, 875–882. [Google Scholar] [CrossRef]
  29. Thanasoulias, N.C.; Piliouris, E.T.; Kotti, E.M.-S.; Evmiridis, N.P. Application of multivariate chemometrics in forensic soil discrimination based on the UV-Vis spectrum of the acid fraction of humus. Forensic Sci. Int. 2002, 130, 73–82. [Google Scholar] [CrossRef]
  30. Fitzpatrick, R.; Raven, M. A Criminal Case Study Involving Transference of Acid Sulfate Soil Material from a Crime Scene to Forensic Evidence. In Inland Acid Sulfate Soil Systems Across Australia; CRC LEMEL: Perth, Australia, 2009; Chapter 8; pp. 151–161. [Google Scholar]
  31. Cheshire, K.; Morgan, R.; Holmes, J. The potential for geochemical discrimination of single- and mixed-source soil samples from close proximity urban parkland locations. Aust. J. Forensic Sci. 2017, 49, 161–174. [Google Scholar] [CrossRef] [Green Version]
  32. Bourguignon, L.; Dawson, L.A.; Hellmann, A.; Marlof, A.; Fernadez Rodriquez, A.; Repele, M.; Utehaag, S. Best Practice Manual for the Forensic Comparison of Soil Traces; European Network of Forensic Science Institutes: Wiesbaden, Germany, 2019. [Google Scholar]
  33. Cheng, L.; Shi, S.; Li, Q.; Chen, J.; Zhang, H.; Lu, Y. Progressive Degradation of Crude Oil n-Alkanes Coupled to Methane Production under Mesophilic and Thermophilic Conditions. PLoS ONE 2014, 9, e113253. [Google Scholar] [CrossRef]
  34. Soil Survey Staff. Keys to Soil Taxonomy; Natural Resources Consersation Services: Washington, DC, USA, 2014. [Google Scholar]
  35. Dos Santos, H.G.; Jacomine, P.K.T.; dos Anjos, L.H.C.; de Oliveira, V.A.; Lumbreras, J.F.; Coelho, M.R.; de Almeida, J.A.; de Araujo Filho, J.C.; de Oliveira, J.B.; Cunha, T.J.F. Sistema Brasileiro de Classificação de Solos; Empresa Brasileira de Pesquisa Agropecuária: Brasilia, Brasil, 2018. [Google Scholar]
  36. Kumar, R.; Sharma, V. Chemometrics in forensic science. TrAC Trends Anal. Chem. 2018, 105, 191–201. [Google Scholar] [CrossRef]
  37. Morgan, R.M.; Scott, K.R.; Ainley, J.; Bull, P.A. Journey history reconstruction from the soils and sediments on footwear: An empirical approach. Sci. Justice 2019, 59, 306–316. [Google Scholar] [CrossRef]
  38. Chen, Y.; Senesi, N.; Schnitzer, M. Information provided on humic substances by E4/E6 ratio. Soil Sci. Soc. Am. J. 1977, 41, 352–358. [Google Scholar] [CrossRef]
  39. Chauhan, R.; Kumar, R.; Sharma, V. Soil forensics: A spectroscopic examination of trace evidence. Microchem. J. 2020, 139, 74–84. [Google Scholar] [CrossRef]
  40. Hammer, Ø.; Harper, D.A.T.; Ryan, P.D. PAST: Paleontological Statistics Software Package for Education and Data Analysis. Palaeontologia Electronica 2001, 4, 9. [Google Scholar]
  41. StatSoft. Statistica (Data Analysis Software System); StatSoft: Tulsa, OK, USA, 2011. [Google Scholar]
  42. Zalba, P.; Amiotti, N.M.; Galantini, J.A.; Pistola, S. Soil Humic and Fulvic Acids from Different Land-Use Systems Evaluated by E4/E6 Ratios. Commun. Soil Sci. Plant Anal. 2016, 47, 1675–1679. [Google Scholar] [CrossRef]
  43. Oktaba, L.; Odrobińska, D.; Uzarowicz, Ł. The impact of different land uses in urban area on humus quality. J. Soils Sediments 2018, 18, 2823–2832. [Google Scholar] [CrossRef] [Green Version]
  44. Chauhan, R.; Kumar, R.; Kumar, V.; Sharma, K.; Sharma, V. On the discrimination of soil samples by derivative diffuse reflectance UV–vis-NIR spectroscopy and chemometric methods. Forensic Sci. Int. 2020, 319, 110655. [Google Scholar] [CrossRef] [PubMed]
  45. Senesi, N.; Sipos, S. Molecular-weight distribution, analytical and spectroscopic characterization of humic fractions sequentialy isolated by organic-solvents from a brown coal acid. Org. Geochem. 1985, 8, 157–162. [Google Scholar] [CrossRef]
  46. Mbarek, B.H.; Gargouri, K.; Mbadra, C.; Chaker, R.; Souidi, Y.; Abbas, O.; Baeten, V.; Rigane, H. Change and spatial variability of soil organic matter humification after long-term tillage and olive mill wastewater application in arid regions. Soil Res. 2020, 58, 388. [Google Scholar] [CrossRef]
  47. Sharma, V.; Chauhan, R.; Kumar, R. Spectral characteristics of organic soil matter: A comprehensive review. Microchem. J. 2021, 171, 106836. [Google Scholar] [CrossRef]
  48. Sachse, D.; Billault, I.; Bowen, G.J.; Chikaraishi, Y.; Dawson, T.E.; Feakins, S.J.; Freeman, K.H.; Magill, C.R.; McInerney, F.A.; van der Meer, M.T.; et al. Molecular Paleohydrology: Interpreting the Hydrogen-Isotopic Composition of Lipid Biomarkers from Photosynthesizing Organisms. Annu. Rev. Earth Planet. Sci. 2012, 40, 221–249. [Google Scholar] [CrossRef] [Green Version]
  49. Vogts, A.; Moossen, H.; Rommerskirchen, F.; Rullkötter, J. Distribution patterns and stable carbon isotopic composition of alkanes and alkan-1-ols from plant waxes of African rain forest and savanna C3 species. Org. Geochem. 2009, 40, 1037–1054. [Google Scholar] [CrossRef]
  50. Holtvoeth, J.; Rushworth, D.; Copsey, H.; Imeri, A.; Cara, M.; Vogel, H.; Wagner, T.; Wolff, G.A. Improved end-member characterisation of modern organic matter pools in the Ohrid Basin (Albania, Macedonia) and evaluation of new palaeoenvironmental proxies. Biogeosciences 2016, 13, 795–816. [Google Scholar] [CrossRef] [Green Version]
Figure 1. (a) Schematic figure of Brazil highlighting the Paraná State (PR) and the Curitiba Metropolitan Region (CMR); (b) two selected municipalities within the CMR; and (c) linear distance between the sampled sites (site 1—Santa Cândida neighbourhood; site 2—Boa Vista neighbourhood, Guarani neighbourhood, Guaraituba neighbourhood).
Forensicsci 02 00005 g001
Figure 2. Sampling locations within Curitiba and Colombo municipalities, State of Paraná, Brazil. Photographs located in four separate urban areas: Santa Cândida—Curitiba (a); Boa Vista—Curitiba (b); Guarani—Colombo (c); Guaraituba—Colombo (d). Source: modified from (Testoni et al., 2019).
Forensicsci 02 00005 g002
Figure 3. Average of soil-colour parameters for the four sites: (a) E4/E6 ratio (absorbance at 465/absorbance at 665 nm) and (b) RGB (red, green, blue) data obtained from the reflectance values of the visible spectra at 720, 570 and 500 nm wavelengths, respectively (Santa Cândida—n = 13 samples (Table 1) × 3 replicates = 39; Guarani—n = 12 samples × 3 replicates = 36; Guaraituba—n = 14 samples × 3 replicates = 42; Boa Vista—n = 13 samples × 3 replicates = 39).
Forensicsci 02 00005 g003
Figure 4. Mean (± standard deviation) n-alkane (a) and alcohol (b) concentrations for the four sites (Santa Cândida—n = 13 samples (Table 1) × 3 replicates = 39; Guarani—n = 12 samples × 3 replicates = 36; Guaraituba—n = 14 samples × 3 replicates = 42; Boa Vista—n = 13 samples × 3 replicates = 39).
Forensicsci 02 00005 g004
Figure 5. Principal Component Analysis (PCA) of the soil samples analysed based on n-alkanes and fatty alcohols (a) and spectral colour data (b).
Forensicsci 02 00005 g005
Figure 6. Index of similarity of the soil samples using Bray–Curtis method based on n-alkanes and fatty alcohols (a) and spectral colour data (b).
Forensicsci 02 00005 g006
Figure 7. Index of similarity of the soil samples using the Bray–Curtis method based on n-alkanes and fatty alcohols (a) and spectral colour data (b).
Forensicsci 02 00005 g007
Table 1. Soil sample characteristics.
UTM (22J)
SamplePosition 1PlaceE-WN-SParent Material
Site 1
1Bottom rightSanta Cândida678,2037,192,226Claystone
2Bottom leftSanta Cândida678,2037,192,226Claystone
3Top rightSanta Cândida678,2037,192,226Claystone
4Top leftSanta Cândida678,2037,192,226Claystone
5Bottom rightSanta Cândida678,2037,192,226Claystone
6Bottom leftSanta Cândida678,2037,192,226Claystone
7Top rightSanta Cândida678,2037,192,226Claystone
8Top leftSanta Cândida678,2037,192,226Claystone
9Footprint/toesSanta Cândida678,2037,192,226Claystone
10Footprint/heelSanta Cândida678,2037,192,226Claystone
11Footprint/heelSanta Cândida678,2037,192,226Claystone
12Footprint/toesSanta Cândida678,2037,192,226Claystone
13Footprint/heelSanta Cândida678,2037,192,226Claystone
Site 2
14Bottom rightGuarani682,7477,192,633Limestone
15Bottom leftGuarani682,7477,192,633Limestone
16Top rightGuarani682,7477,192,633Limestone
17Top leftGuarani682,7477,192,633Limestone
18Bottom rightGuarani682,7477,192,633Limestone
19Bottom leftGuarani682,7477,192,633Limestone
20Top rightGuarani682,7477,192,633Limestone
21Top leftGuarani682,7477,192,633Limestone
22Footprint/toesGuarani682,7477,192,633Limestone
23Footprint/heelGuarani682,7477,192,633Limestone
24Footprint/heelGuarani682,7477,192,633Limestone
25Footprint/toesGuarani682,7477,192,633Limestone
Site 3
26Bottom rightGuaraituba683,1897,195,492Limestone
27Bottom leftGuaraituba683,1897,195,492Limestone
28Top rightGuaraituba683,1897,195,492Limestone
29Top leftGuaraituba683,1897,195,492Limestone
30Bottom rightGuaraituba683,1897,195,492Limestone
31Bottom leftGuaraituba683,1897,195,492Limestone
32Top rightGuaraituba683,1897,195,492Limestone
33Top leftGuaraituba683,1897,195,492Limestone
34Footprint/toesGuaraituba683,1897,195,492Limestone
35Footprint/heelGuaraituba683,1897,195,492Limestone
36Footprint/heelGuaraituba683,1897,195,492Limestone
37Footprint/toesGuaraituba683,1897,195,492Limestone
38Footprint/heelGuaraituba683,1897,195,492Limestone
39Footprint/heelGuaraituba683,1897,195,492Limestone
Site 4
40Bottom rightBoa Vista676,1867,190,193Claystone
41Bottom leftBoa Vista676,1867,190,193Claystone
42Top rightBoa Vista676,1867,190,193Claystone
43Top leftBoa Vista676,1867,190,193Claystone
44Bottom rightBoa Vista676,1867,190,193Claystone
45Bottom leftBoa Vista676,1867,190,193Claystone
46Top rightBoa Vista676,1867,190,193Claystone
47Top leftBoa Vista676,1867,190,193Claystone
48Footprint/toesBoa Vista676,1867,190,193Claystone
49Footprint/heelBoa Vista676,1867,190,193Claystone
50Footprint/heelBoa Vista676,1867,190,193Claystone
51Footprint/toesBoa Vista676,1867,190,193Claystone
52Footprint/heelBoa Vista676,1867,190,193Claystone
1 Footprint heel and toes are simulated trace samples, collected at the centre of the sampling quadrant. Santa Cândida and Boa Vista are neighbourhoods of the Curitiba municipality (State of Paraná), Guarani and Guaraituba are neighbourhoods of the Colombo municipality (Curitiba Metropolitan Region).
Publisher’s Note: MDPI stays neutral with regard to jurisdictional claims in published maps and institutional affiliations.

