

Kinetic Interjoint Coordination in Lower Limbs during Gait in Patients with Hemiparesis


1
Department of Physical Medicine and Rehabilitation, Graduate School of Medicine, Tohoku University, Sendai 980-8575, Japan
2
Department of Robotics, Graduate School of Engineering, Tohoku University, Sendai 980-8579, Japan
3
Graduate School of Biomedical Engineering, Tohoku University, Sendai 980-8575, Japan
*
Author to whom correspondence should be addressed.
Biomechanics 2022, 2(3), 466-477; https://doi.org/10.3390/biomechanics2030036
Submission received: 5 July 2022
/
Revised: 7 September 2022
/
Accepted: 8 September 2022
/
Published: 11 September 2022
(This article belongs to the Topic Biomechanics and Biomaterial Engineering in Neurological Disorders)
Abstract
:The coordination of joint moments in the same limb—otherwise known as kinetic interjoint coordination—during gait in patients with hemiparesis remains unclear. This study clarifies the characteristics of kinetic interjoint coordination in the lower limbs using a principal component analysis (PCA). Using a three-dimensional motion analysis system and force plates, the kinematic and kinetic data from 29 patients with hemiparesis and 12 healthy controls were measured when they walked along a 7 m walkway. The spatiotemporal principal components (PCs) of the hip, knee, and ankle joint moments were calculated using a PCA and the motor modules during gait were identified. We adopted a case–control study design to clarify the kinetic interjoint coordination characteristics during gait in patients with hemiplegia. As the results of comparisons between the patients and controls showed, the peak timing of the first PC, which had high loadings of hip and ankle joint moments on the paretic side, was significantly earlier than that on the other sides. The loading of the knee joint moment for the first PC on the paretic side was significantly lower than that on the non-paretic side (p < 0.05), which was highly variable with negative and positive values. The results demonstrated that the first motor module comprising hip and ankle joint moments on the paretic side during gait in patients with hemiparesis may be merged with knee joint flexion or the extension moment, and may have an atypical temporal component. The index of kinetic interjoint coordination would be a useful tool for robotic-based systems for effective rehabilitation, which would significantly contribute to the acceleration of collaborative research in the fields of engineering and rehabilitation medicine.
1. Introduction
For most patients with hemiparesis, community ambulation is an important and essential ability [1]. Community ambulation is generally associated with quality of life and depression [2]. However, community ambulation can be restricted by an impaired walking ability after a stroke [1,3]. Many studies have demonstrated that for patients with hemiparesis, decreased community ambulation is related to deficits in gait speed, 6 min walking distance, and the energy cost of walking [3,4,5,6]. In addition, previous studies have suggested that a reduced walking speed and 6 min walking distance are related to forward propulsion, step length asymmetry (i.e., longer step length on the paretic side (PS)), and temporal asymmetry (i.e., shorter single stance time on the PS) in patients with hemiparesis during gait [7,8,9]. Therefore, forward propulsion and spatiotemporal parameters are essential gait parameters for walking ability and primary targets of post-stroke gait rehabilitation in patients with hemiparesis.
Muscle activities during gait in healthy controls are grouped into motor modules [10,11]. The motor modules can be identified using the non-negative matrix factorization (NNMF) results from surface electromyography (EMG) signals [11]. There are five modules during gait: (1) hip and knee extensors in early stance; (2) ankle plantar flexors in late stance; (3) tibialis anterior and rectus femoris in swing; (4) hamstrings in late swing and early stance; (5) hip flexors in pre- and early swing [12]. An abnormal synergy pattern is one of the motor impairments that affects a patient following a stroke, and is coupled with joint movement due to difficulty in gaining independent control over certain muscle groups. Muscle activity has been demonstrated to result in impaired muscle coordination during gait for these patients, which indicates a less complex motor module due to an abnormal synergy pattern [11,13]. In patients with hemiparesis, the motor module related to propulsion in the late stance during gait is combined with the other module that is related to the body support during weight acceptance, the deceleration of the leg at the end of the swing, and propulsion in the early stance [11]. The motor module combined with the other modules represents the merged motor module. Consequently, the merged motor module causes more braking on the PS and more propulsive asymmetry than the healthy controls [11,13]. Moreover, patients with a merged motor module have different peak timing of the ankle plantar flexor module on the PS from those with healthy controls [14]. In the previous studies, the analyses of the muscle coordination by applying electromyography of the lower limb muscles did not include the muscle activity of the hip flexor (e.g., iliopsoas). Since the hip flexor moment impulse is negatively related to the propulsive impulse, an analysis of the muscle coordination may need to include the muscle activity of the hip flexor [15].
Several researchers have also used a principal component analysis (PCA) to analyze interjoint coordination based on the kinetic variables in the lower limbs during gait using healthy controls [16,17]. Sadeghi et al. revealed that in healthy controls, weight support and the generation of propulsion are important functions of the interjoint coordination between the ankle and hip moments during gait [16]. Therefore, interjoint coordination among the joint moments could be an index that considers the effect of the hip joint moment, unlike muscle coordination. The PCA results using joint moments in the lower limb during gait in patients with hemiparesis represent the kinetic intralimb coordination impairment, mainly due to abnormal synergy, as shown in a previous study using NNMF [11]. The high variance described by the PCs of the kinetic variables in the lower limbs indicates the motor module merging. Abnormal peak timing of kinetic PC variables in the lower limbs can explain impaired motor module timing. The kinetic characteristics in the lower limbs during gait in patients with hemiplegia have been analyzed regarding their quantity but not quality in many previous studies, although the interjoint coordination of the joint moments in the lower limbs during gait seems to be a useful clinical assessment marker for the selection and adjustment of orthotics and wearable powered exoskeletons using the data obtained from patients with hemiparesis [18,19,20,21,22,23,24,25].
This study aims to investigate the difference in variance and the PC timing of the kinetic variables in the lower limbs on the PS and non-PS in patients with hemiparesis, and on the left side (LS) of the healthy controls. This study’s significance is due to characterizing the kinetics of the impaired motor module on the paretic side in patients with hemiparesis. The results can provide useful information for individuals using wearable powered exoskeletons and orthotics that require kinetic control at each joint in the lower limb in hemiplegia. We hypothesized that the variance explained by the PCs of the kinetic variables on the paretic side, which is involved in propulsive deficits during walking in patients with hemiplegia, would be higher than the controls. As shown, the motor module related to propulsion in the late stance phase during gait was combined with the other modules of muscle activity in the previous study in the patients with hemiplegia [11]. Secondly, the PC timing of the kinetic variables on the PS in hemiplegia patients was earlier than in controls, as high ankle joint stiffness and premature muscle activity in the early stance phase on the paretic side were observed in previous studies [25,26].
2. Materials and Methods
2.1. Participants
A total of 29 stroke patients (age range, 30–74 years) and 12 healthy controls of comparable age were recruited (age range, 31–78 years) in the study. Table 1 shows the demographic and clinical subjects’ characteristics. No significant difference in age, weight, or height was found.
The inclusion criteria for subjects included: (1) first-time stroke and mild to severe paresis; (2) a Brunnstrom recovery stage score in the lower limb on the paretic side of less than or equal to VI; (3) the stroke being caused by either an ischemic or hemorrhagic supratentorial lesion; and (4) the ability to walk at least 7 m without using an assistive device. The exclusion criterion for both patients with hemiparesis and controls was as follows: (1) brainstem or cerebellar lesion presence and orthopedic problems. Additionally, not all patients with higher brain dysfunction were excluded, only those with higher brain dysfunction who had difficulty walking 7 m on a straight path.
We assessed hemiparetic patients based on hemiparesis severity and the ability to perform movements outside the extensor and flexor synergy patterns using the Brunnstrom recovery stages [27]. We also additionally assessed neurological impairments including abnormal muscle tone using the Stroke Impairment Assessment Set (SIAS) in patients with hemiparesis [28] and functional impairments of ambulation using the walking or wheelchair item from the Functional Independence Measure (FIM) [29]. An experienced physical therapist (Y.S.) performed these tests while applying standardized protocols. This study was conducted in accordance with the Declaration of Helsinki’s tenets. The study approval was granted by the institutional review board (no. 2016-1-354). All participants provided written informed consent before data collection.
2.2. Gait Analysis
The subjects were asked to walk 7 m over 2–10 trials until the five stride data were recorded. The patients were instructed to walk at a self-selected, comfortable pace without assistive devices. If the patients complained of fatigue, they were allowed to rest. We determined the time it took the healthy subjects to walk 7 m to match their already measured walking speed. The healthy participants were instructed to walk 7 m in the set time. The healthy controls practiced the 7 m walk several times before gait measurements were taken. An average of more than five strides during the successful trials was used for analysis. Moreover, 33 reflective markers were attached to 12 segments. An 8-camera motion analysis system (MAC 3D System; Motion Analysis Corporation, Santa Rosa, CA, USA) was used to record the three-dimensional coordinates for the 33 reflective markers attached to the various body segments (Table 2) during gait, operating at 120 Hz. The ground reaction force data were obtained at a 1200 Hz sampling rate using four 90 cm × 60 cm force plates (Anima Corporation, Chofu, Tokyo, Japan), which were embedded in the middle of a walkway.
A bidirectional fourth-order Butterworth low-pass filter with cut-off frequencies of 20 Hz and 200 Hz was used to smooth the three-dimensional coordinates and ground reaction force data. A 12-segment model based on anthropometric data, in accordance with the Dumas’ work [30], consisted of the feet, shanks, thighs, pelvis, thorax, upper arms, and forearms. A joint coordinate system was used for kinematic data calculation for each joint in the lower extremities [31]. The inverse dynamics was additionally used for kinetics estimation of the lower extremity joints [32]. All kinematic, kinetic, and PC data were time-normalized to 100% of one gait cycle. The representative parameters for the gait in the patient group were extracted from the kinematic and kinetic data in accordance with a previous study by Kinsella [33]. We normalized the kinetic data to the patient’s body weight. The peak propulsion was identified as the maximum value of the ground reaction force curve in the forward direction during gait. A customized software program created with MATLAB (Mathworks Inc., Natick, MA, USA) was used for the calculation of the parameters.
2.3. PCA Using Singular Value Decomposition (SVD)
We performed spatiotemporal decomposition using a PCA based on the joint moments in the lower limb [34,35] to calculate the kinetic joint coordination of the lower limbs and the loading of each lower limb joint. The time-series joint moment data were represented as a column in the matrix R (τ,t) as follows:
where represents the normalized moments at each jth step (%) using the absolute maximum moments during one gait cycle [j: 0–100 (%)]. The PCA was conducted by determining the eigenvectors and eigenvalues of the covariance matrix of the object data, for example . Additionally, the singular value decomposition (SVD) analysis was employed because it can divide the time-series joint moment data into spatial and temporal PC components using MATLAB (Math Works Incorporated, Natick, MA, USA). The eigenvectors of can be calculated as follows using SVD:
where denotes time-series values with the corresponding eigenvectors . Therefore, the time-series data of the joint moments can be decomposed into the time-invariant spatial components and temporal characteristic components of the corresponding spatial components . Additionally, the variance percentage accounting (%) for the ith PC was calculated using .
The parameters of interest were the percentage of variance accounting for each PC, the peak timing of the first PC, and the factor loadings of the three joints in each PC. The variance percentage accounted for each PC and the peak timings represent the spatial and temporal components of the motor module. A high variance percentage for a PC indicates that the kinetic motor module variable is merged with the other motor module, as shown in the previous study on the motor modules of muscle activities during gait in patients with hemiparesis [11]. The first PC peak timings were extracted from the first PC time curve (Figure 1). The factor loadings of the three joint moments in the spatial PCs indicate the amount of variance in the joint moment that is captured by the PC (i.e., the weighted contribution of each joint moment to the motor module), referring to the previous studies on kinematic coordination and muscle synergy [11,36].
2.4. Statistical Analysis
The mean value of the five stride data for each subject was used for analysis. The gait speed, stride time, and stride length between the patient group and the healthy controls were compared using unpaired t-tests. Using a one-way ANOVA followed by a Tukey test, this study examined the differences in the spatiotemporal, representative kinetic, and PCA-related parameters along the LS of the healthy controls and on the PS and non-PS in the patient group. The eta-squared (η2) value was calculated to estimate the effect size. The significance level for all the tests was set to p < 0.05. All statistical tests were performed using the Statistical Package for the Social Sciences (SPSS) (version 22.0; SPSS Inc., Chicago, IL, USA).
3. Results
3.1. Gait Speed and Spatiotemporal Parameters
Table 3 shows all the gait parameters in the patient group and healthy controls. No significant differences were found between the gait speeds of the two groups. However, significant differences were observed in the swing time (F2,67 = 15.648, p < 0.001, η2 = 0.32), single-leg stance time (F2,67 = 6.659, p = 0.002, η2 = 0.17), and step length (F2,67 = 6.419, p = 0.003, η2 = 0.16) among the PS and non-PS in the patients and the left side in the healthy controls. The swing time in the non-PS group was the shortest and the single- leg stance time in the healthy controls was the longest among the PS and non-PS in the patients and the left side in the healthy controls. The step length on the non-PS was shorter than that in the healthy control group (p = 0.002).
3.2. Kinetic Parameters
Figure 2 shows the representative time curve of the three joint moments in the lower limb during gait in a patient with hemiparesis and a healthy control. Significant differences were observed among the PS and non-PS in the patients and the left side in the healthy controls in the maximum hip extension moment in the early stance (F2,67 = 5.079, p = 0.009, η2 = 0.13; as shown in Table 2), maximum ankle plantar flexion moment (F2,67 = 9.299, p < 0.001, η2 = 0.22), and knee flexion moment (F2,67 = 4.271, p = 0.018, η2 = 0.11) in the stance phase and the maximum knee extension moment (F2,67 = 5.078, p = 0.009, η2 = 0.13) in the late stance. The maximum hip extension moment in the early stance for the non-PS group was higher than that in the PS group (p = 0.006). The maximum knee flexion moment in the stance phase for the PS was higher than that for the non-PS (p = 0.016). For the PS, the maximum ankle plantar flexion moment in the stance phase was the lowest among the PS and non-PS in the patients and the left side in the healthy controls. In addition, for the non-PS group, the maximum knee extension moment in the late stance was the highest among the PS and non-PS in the patients and the left side in the healthy controls.
3.3. PCA-Related Parameters
Table 4 shows the PCA results. The PCA of the joint moments demonstrated that the first and second PCs accounted for total variances of 82% and 17% for the LS of the healthy controls; 75% and 20% for the non-PS; and 81% and 18% for the PS, respectively. The first two PCs on the non-PS accounted for 95% of the variance, which is lower than the percent variance of the first two PCs on the PS (p < 0.01) and the LS of the healthy controls (p < 0.05). This study determined the significant differences in the peak timing of the first PC (F2,67 = 12.585, p < 0.001, η2 = 0.27). The peak timing of the first PC on the PS was significantly earlier than that on the other sides. Significant differences were observed in the knee joint moment loading of the first and second PCs and the hip joint moment for the second PC (F2,67 = 3.357, p = 0.041, η2 = 0.09; F2,67 = 10.073, p < 0.001,η2 = 0.23; and F2,67 = 3.861, p = 0.026, η2 = 0.10). The knee joint moment loading for the first PC and the hip joint moment for the second PC on the PS were lower than those on the non-PS (p = 0.034 and p = 0.032). In addition, compared with the loadings of the knee joint moment for the second PC on the PS and LS of the healthy controls, those of the non-PS of the patients were significantly lower (p = 0.034 and p < 0.001).
4. Discussion
The objective of our study was to clarify the kinetic interjoint coordination characteristics in the lower limbs using PCA. As hypothesized, the main finding was that the peak timings of the first PC of the kinetic variables were early during gait in patients with hemiparesis when considering the PS. This finding suggests that the impaired interjoint coordination among the joint moments on the PS has an atypical temporal component. The results characterized the impaired motor module regarding the kinetics on the paretic side in patients with hemiparesis. This is the first study on kinetic interjoint coordination during gait in 29 patients with hemiparesis. The kinetic interjoint coordination index would be a useful tool for prescribing robotic-based systems for effective rehabilitation, as well as new gait assessments from a kinetic perspective. Moreover, the index would also significantly accelerate collaborative research in the fields of engineering and rehabilitation medicine and contribute to the development of orthotics and robotics.
4.1. Percent Variance Explained by the PCs
This study showed that the variance percentage described by the first two PCs of the kinetic variables in the lower limbs exceeded 95% of the total variance. These results indicate that for the healthy controls and patients with hemiparesis, the time series of the kinetic variables during gait might follow a planar law in a three-dimensional space, similar to the kinematic variables demonstrated in previous studies [36,37]. The planar law can reflect a centrally controlled behavior beyond biomechanical constraints [37,38], which indicates that walking is a centrally controlled behavior. Additionally, the variance percentages accounting for the PCs on the PS did not significantly vary from those on the non-PS and on the left side in the healthy controls. The high variance percentage accounting for the PCs on the PS was not shown contrary to our hypothesis, which represents the merged motor module. The results indicated that the identified motor module of kinetic variables on the PS may be needed without a gait assist in patients, as well as in the healthy controls, because the lower number of motor modules of kinetic variables than for muscle activation causes a larger motor module role in the kinetic variables of gait. However, the results also showed that the timing of the first PC of the kinetic variables on the PS differed from that of the non-PS and controls.
4.2. Impaired Temporal Interjoint Coordination on the PS
The time series of the PCs analyzed using the PCA was characterized by the description of each representative curve [39]. The results revealed an early peak timing of the time series of the first PC, which comprised ankle and hip joint moments in the lower limb on the PS in patients with hemiparesis. Additionally, the ankle plantar flexion moment in the stance phase on the PS decreased but the hip flexion moment did not, which comprised the first motor module. The characteristics of the function of the lower limb on the PS may influence the results of the early peak timing of the first motor module (i.e., the less severely affected strength of the proximal muscles in the lower limb on the PS in patients with an upper motoneuron lesion) [40]. Similarly, an atypical thigh kinematic profile is associated with altered intersegmental coordination on the PS in patients with hemiparesis [36]. Meanwhile, our previous study revealed that increased gait speed caused the later peak timing of the first motor module in healthy controls [41]. Therefore, the impaired temporal interjoint coordination among the joint moments (i.e., early peak timing of the first motor module on the PS) may decrease the propulsive force to the whole body when the trail limb angle is decreased, as shown in a previous study on muscle synergy during gait in patients with hemiparesis [14].
4.3. Various Knee Moment Pattern Types on the PS
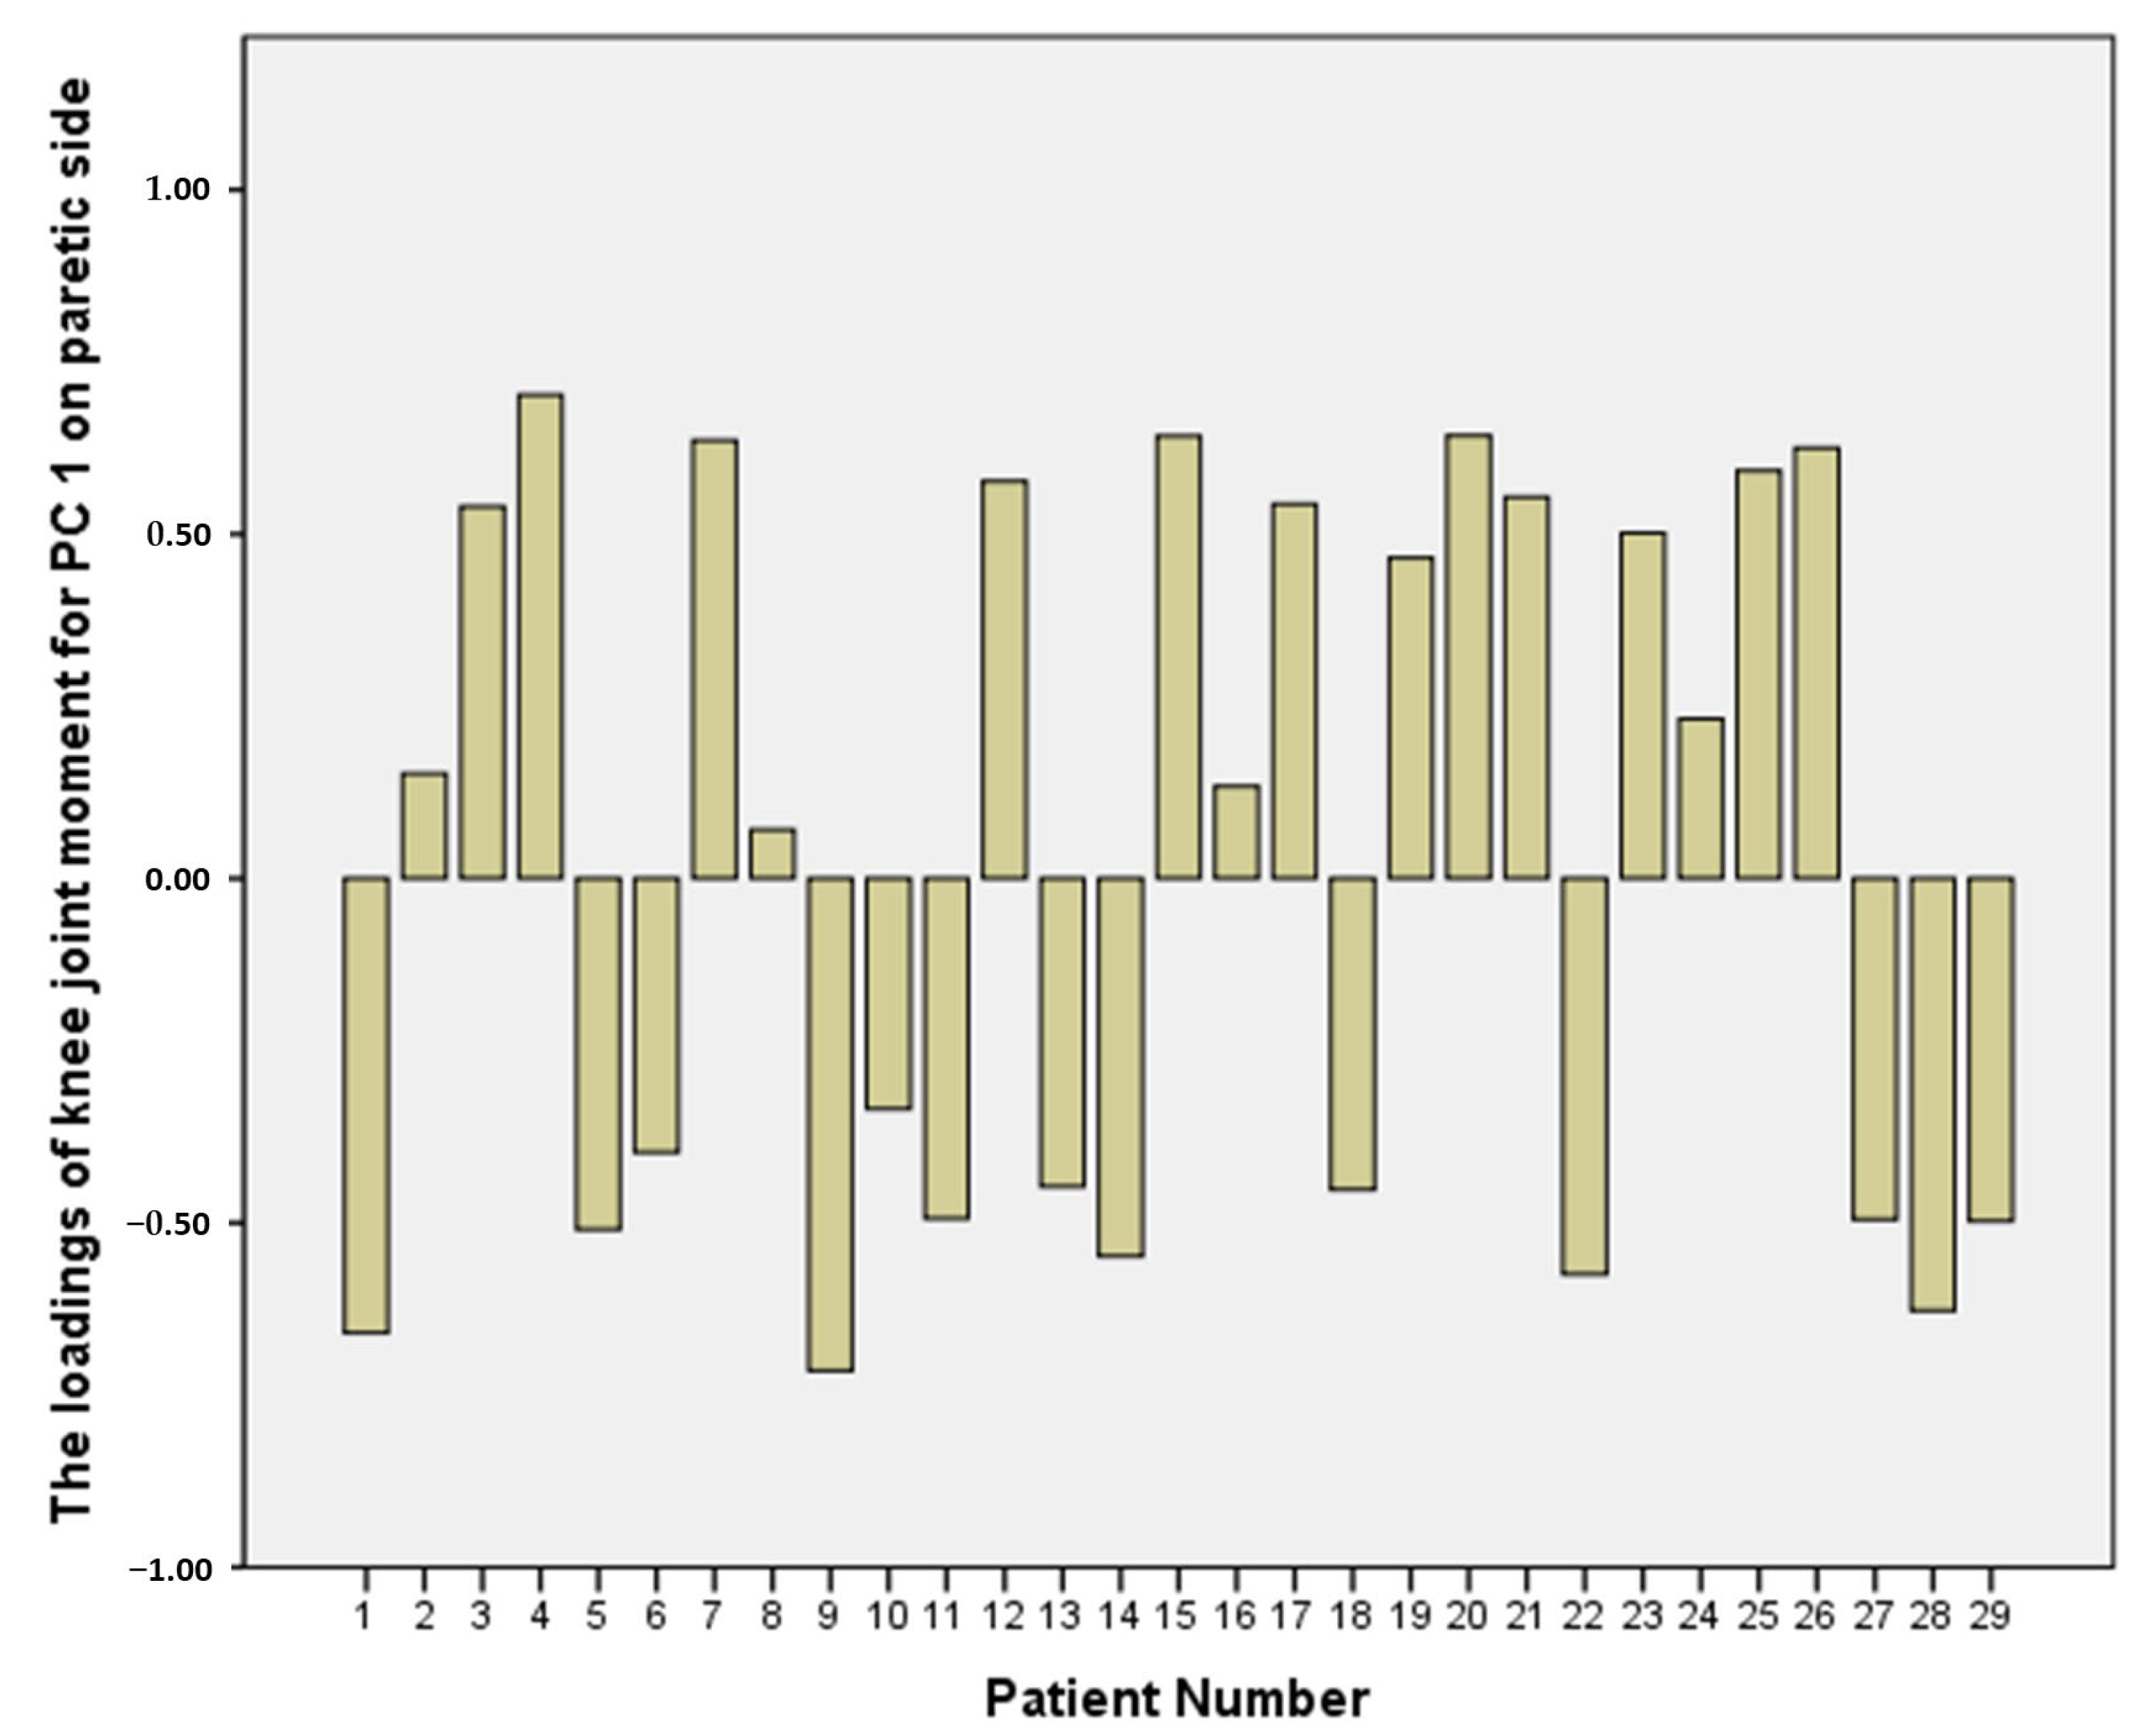
The loading of the knee joint moment for the first PC on the PS was lower than that for the non-PS, but the absolute value of that on the PS was high (Figure 3). These results demonstrate that the knee moment pattern types on the PS varied among patients, such as the large variability of the knee joint angles among the hemiparetic patients in the previous studies on gait classification. Previous studies have demonstrated an excessive coactivation of the knee extensors and ankle plantar flexors, which represent extensor synergy, as well as coactivation of the knee flexors and ankle plantar flexors in the stance phase during gait in patients with hemiparesis [26,42,43]. Figure 3 shows the individual loadings of the knee joint moment for the first PC for 29 patients. A high absolute value of the loading of the knee joint moment for the first PC on the PS indicates that the motor module comprising the ankle and hip joints affects forward propulsion. This might be merged with the knee joint due to the coactivation and relative weighting of synergistic muscle activations, as shown in previous studies [11,13].
4.4. Kinetic Interjoint Coordination on the Non-PS
The variance percentage in the first two PCs in the non-PS group was lower than that in the PS group and the healthy controls. A novel compensation by the non-PS leg during gait has been reported in patients with hemiparesis, which generates atypical muscle activities in the leg on the non-PS [44]. Therefore, kinetic control, which is exhibited by the kinetic interjoint coordination in the lower limbs on the non-PS, would require more motor modules other than the main motor modules. This is because the muscle groups are activated together to compensate for the propulsion that occurs only on the PS and to maintain balance due to the instability of the PS leg in the patients.
4.5. Limitations
This study has several limitations. First, this investigation did not use inclusion criteria related to the time since the neurologic event. A previous study found significant differences in the kinematic interjoint coordination during gait between the acute and chronic stages [45]. Therefore, future studies should investigate the relationship between the time since the neurologic event and kinetic interjoint coordination. Second, in this study, the healthy controls were not matched by sex to the patient group. However, in their study, Chow and Stokic [36] found no differences in the kinematic coordination of the lower limbs during gait between healthy men and women. Since kinematic variables represent the movement characteristics resulting from force due to muscle activation, the kinetic interjoint coordination of the lower limbs in men during gait may also be similar to that in women. Therefore, sex differences are unlikely to affect the results. Third, differences in kinetic data may be observed between a measured and more realistic walk in the healthy controls because they were asked to walk at a slow speed. However, the walking speed influences the kinetic data in the lower limbs [46]. Therefore, an accurate comparison should be performed between kinetic data from patients with hemiparesis and those measured at a slow walking speed in healthy controls. Fourth, we did not analyze the parameters related to the PCA on the right side in the healthy controls. Therefore, we could not decide whether it is appropriate to analyze this side’s parameters in the healthy controls.
5. Conclusions
In conclusion, the early timing of the first motor module, represented by kinetic interjoint coordination on the PS, was found during gait in patients with hemiparesis. The first motor module on the PS comprises the knee joint moment, which can be negative or positive for each patient, and hip and ankle joint moments. The kinetic interjoint coordination on the PS during gait may be useful for diagnosing and evaluating the impaired motor module due to the abnormal synergy pattern in patients. Moreover, the index of the kinetic interjoint coordination would be a useful tool for robotic-based systems for effective rehabilitation, which would greatly contribute to the acceleration of collaborative research between the fields of engineering and rehabilitation medicine.
Author Contributions
Conceptualization, Y.S.; methodology, Y.S. and K.H.; software, Y.S. and K.H.; validation, Y.S., K.H. and D.O.; formal analysis, Y.S.; investigation, Y.S. and K.H.; re-sources, Y.S., K.H., D.O. and S.-I.I.; data curation, Y.S.; writing—original draft preparation, Y.S.; writing—review and editing, Y.S.; visualization, Y.S.; supervision, S.-I.I.; project administration, S.-I.I.; funding acquisition, D.O., Y.S. and S.-I.I. All authors have read and agreed to the published version of the manuscript.
Funding
This research was funded by Grant-in-Aid for Scientific Research (B), grant number JP20H04260, and Grant-in-Aid for Scientific Research (C), grant number JP22K11443.
Institutional Review Board Statement
The study was conducted according to the guidelines of the Declaration of Helsinki and approved by the Ethics Committee of the Tohoku University Graduate School of Medicine (2016-1-354).
Informed Consent Statement
Informed consent was obtained from all subjects involved in the study. Written informed consent was obtained from the patient(s) to publish this paper.
Data Availability Statement
Data available on request due to privacy and ethical restrictions.
Acknowledgments
We would like to thank the staff at the Department of Physical Medicine and Rehabilitation at Tohoku University for their advice and help.
Conflicts of Interest
The authors declare no conflict of interest.
References
- Lord, S.; McPherson, K.; McNaughton, H.; Rochester, L.; Weatherall, M. Community ambulation after stroke: How important and obtainable is it and what measures appear predictive? Arch. Phys. Med. Rehabil. 2004, 85, 234–239. [Google Scholar] [CrossRef] [PubMed]
- Thilarajah, S.; Mentiplay, B.F.; Bower, K.J.; Tan, D.; Pua, Y.H.; Williams, G.; Koh, G.; Clark, R.A. Factors Associated With Post-Stroke Physical Activity: A Systematic Review and Meta-Analysis. Arch. Phys. Med. Rehabil. 2018, 99, 1876–1889. [Google Scholar] [CrossRef] [PubMed]
- Perry, J.; Garrett, M.; Gronley, J.; Mulroy, S. Classification of walking handicap in the stroke population. Stroke 1995, 26, 982–989. [Google Scholar] [CrossRef]
- Franceschini, M.; Rampello, A.; Agosti, M.; Massucci, M.; Bovolenta, F.; Sale, P. Walking performance: Correlation between energy cost of walking and walking participation. new statistical approach concerning outcome measurement. PLoS ONE 2013, 8, e56669. [Google Scholar] [CrossRef]
- Fulk, G.D.; He, Y.; Boyne, P.; Dunning, K. Predicting Home and Community Walking Activity Poststroke. Stroke 2017, 48, 406–411. [Google Scholar] [CrossRef]
- Fulk, G.D.; Reynolds, C.; Mondal, S.; Deutsch, J.E. Predicting home and community walking activity in people with stroke. Arch. Phys. Med. Rehabil. 2010, 91, 1582–1586. [Google Scholar] [CrossRef] [PubMed]
- Awad, L.N.; Binder-Macleod, S.A.; Pohlig, R.T.; Reisman, D.S. Paretic Propulsion and Trailing Limb Angle Are Key Determinants of Long-Distance Walking Function After Stroke. Neurorehabil. Neural Repair 2015, 29, 499–508. [Google Scholar] [CrossRef] [PubMed]
- Sibley, K.M.; Tang, A.; Patterson, K.K.; Brooks, D.; McIlroy, W.E. Changes in spatiotemporal gait variables over time during a test of functional capacity after stroke. J. Neuroeng. Rehabil. 2009, 6, 27. [Google Scholar] [CrossRef]
- Turns, L.J.; Neptune, R.R.; Kautz, S.A. Relationships between muscle activity and anteroposterior ground reaction forces in hemiparetic walking. Arch. Phys. Med. Rehabil. 2007, 88, 1127–1135. [Google Scholar] [CrossRef]
- Ivanenko, Y.P.; Poppele, R.E.; Lacquaniti, F. Five basic muscle activation patterns account for muscle activity during human locomotion. J. Physiol. 2004, 556, 267–282. [Google Scholar] [CrossRef]
- Clark, D.J.; Ting, L.H.; Zajac, F.E.; Neptune, R.R.; Kautz, S.A. Merging of healthy motor modules predicts reduced locomotor performance and muscle coordination complexity post-stroke. J. Neurophysiol. 2010, 103, 844–857. [Google Scholar] [CrossRef] [PubMed]
- Neptune, R.R.; Clark, D.J.; Kautz, S.A. Modular control of human walking: A simulation study. J. Biomech. 2009, 42, 1282–1287. [Google Scholar] [CrossRef] [PubMed]
- Brough, L.G.; Kautz, S.A.; Bowden, M.G.; Gregory, C.M.; Neptune, R.R. Merged plantarflexor muscle activity is predictive of poor walking performance in post-stroke hemiparetic subjects. J. Biomech. 2018, 82, 361–367. [Google Scholar] [CrossRef]
- Routson, R.L.; Clark, D.J.; Bowden, M.G.; Kautz, S.A.; Neptune, R.R. The influence of locomotor rehabilitation on module quality and post-stroke hemiparetic walking performance. Gait Posture 2013, 38, 511–517. [Google Scholar] [CrossRef] [PubMed]
- Peterson, C.L.; Cheng, J.; Kautz, S.A.; Neptune, R.R. Leg extension is an important predictor of paretic leg propulsion in hemiparetic walking. Gait Posture 2010, 32, 451–456. [Google Scholar] [CrossRef]
- Sadeghi, H.; Sadeghi, S.; Prince, F.; Allard, P.; Labelle, H.; Vaughan, C.L. Functional roles of ankle and hip sagittal muscle moments in able-bodied gait. Clin. Biomech. 2001, 16, 688–695. [Google Scholar] [CrossRef]
- Shemmell, J.; Johansson, J.; Portra, V.; Gottlieb, G.L.; Thomas, J.S.; Corcos, D.M. Control of interjoint coordination during the swing phase of normal gait at different speeds. J. Neuroeng. Rehabil. 2007, 4, 10. [Google Scholar] [CrossRef]
- Olney, S.; Griffin, M.; Monga, T.; McBride, I. Work and power in gait of stroke patients. Arch. Phys. Med. Rehabil. 1991, 72, 309–314. [Google Scholar]
- Olney, S.J.; Griffin, M.P.; McBride, I.D. Temporal, kinematic, and kinetic variables related to gait speed in subjects with hemiplegia: A regression approach. Phys. Ther. 1994, 74, 872–885. [Google Scholar] [CrossRef]
- Kim, C.M.; Eng, J.J. Magnitude and pattern of 3D kinematic and kinetic gait profiles in persons with stroke: Relationship to walking speed. Gait Posture 2004, 20, 140–146. [Google Scholar] [CrossRef]
- Farris, D.J.; Hampton, A.; Lewek, M.D.; Sawicki, G.S. Revisiting the mechanics and energetics of walking in individuals with chronic hemiparesis following stroke: From individual limbs to lower limb joints. J. Neuroeng. Rehabil. 2015, 12, 24. [Google Scholar] [CrossRef] [PubMed] [Green Version]
- Mentiplay, B.F.; Williams, G.; Tan, D.; Adair, B.; Pua, Y.H.; Bok, C.W.; Bower, K.J.; Cole, M.H.; Ng, Y.S.; Lim, L.S.; et al. Gait Velocity and Joint Power Generation After Stroke: Contribution of Strength and Balance. Am. J. Phys. Med. Rehabil. 2019, 98, 841–849. [Google Scholar] [CrossRef] [PubMed]
- Sekiguchi, Y.; Honda, K.; Owaki, D.; Izumi, S.I. Classification of Ankle Joint Stiffness during Walking to Determine the Use of Ankle Foot Orthosis after Stroke. Brain Sci. 2021, 11, 1512. [Google Scholar] [CrossRef] [PubMed]
- Sekiguchi, Y.; Muraki, T.; Kuramatsu, Y.; Furusawa, Y.; Izumi, S. The contribution of quasi-joint stiffness of the ankle joint to gait in patients with hemiparesis. Clin. Biomech. 2012, 27, 495–499. [Google Scholar] [CrossRef] [PubMed]
- Sekiguchi, Y.; Muraki, T.; Tanaka, N.; Izumi, S. Relationship between activation of ankle muscles and quasi-joint stiffness in early and middle stances during gait in patients with hemiparesis. Gait Posture 2015, 42, 348–353. [Google Scholar] [CrossRef]
- Fujita, K.; Miaki, H.; Fujimoto, A.; Hori, H.; Fujimoto, H.; Kobayashi, Y. Factors affecting premature plantarflexor muscle activity during hemiparetic gait. J. Electromyogr. Kinesiol. 2018, 39, 99–103. [Google Scholar] [CrossRef]
- Brunnstrom, S. Recovery stages and evaluation procedures. In Movement Therapy in Hemiplegia: A Neurophysiological Approach; Harper & Row: New York, NY, USA, 1970; pp. 34–55. [Google Scholar]
- Tsuji, T.; Liu, M.; Sonoda, S.; Domen, K.; Chino, N. The stroke impairment assessment set: Its internal consistency and predictive validity. Arch. Phys. Med. Rehabil. 2000, 81, 863–868. [Google Scholar] [CrossRef]
- Linacre, J.M.; Heinemann, A.W.; Wright, B.D.; Granger, C.V.; Hamilton, B.B. The structure and stability of the Functional Independence Measure. Arch. Phys. Med. Rehabil. 1994, 75, 127–132. [Google Scholar] [CrossRef]
- Dumas, R.; Cheze, L.; Verriest, J.P. Adjustments to McConville et al. and Young et al. body segment inertial parameters. J. Biomech. 2007, 40, 543–553. [Google Scholar] [CrossRef]
- Winter, D.A. (Ed.) Biomechanics and Motor Control of Human Movement, 4th ed.; John Wiley & Sons, Inc.: Hoboken, NJ, USA, 2009. [Google Scholar]
- Selbie, W.S.; Hamill, J.; Kepple, T.M. Three-Dimensional Kinetics; Human Kinetics: Champaign, IL, USA, 2013. [Google Scholar]
- Kinsella, S.; Moran, K. Gait pattern categorization of stroke participants with equinus deformity of the foot. Gait Posture 2008, 27, 144–151. [Google Scholar] [CrossRef]
- Funato, T.; Aoi, S.; Oshima, H.; Tsuchiya, K. Variant and invariant patterns embedded in human locomotion through whole body kinematic coordination. Exp. Brain Res. 2010, 205, 497–511. [Google Scholar] [CrossRef] [PubMed] [Green Version]
- Troje, N.F. Decomposing biological motion: A framework for analysis and synthesis of human gait patterns. J. Vis. 2002, 2, 371–387. [Google Scholar] [CrossRef] [PubMed]
- Chow, J.W.; Stokic, D.S. Intersegmental coordination of gait after hemorrhagic stroke. Exp. Brain Res. 2015, 233, 125–135. [Google Scholar] [CrossRef]
- Cheron, G.; Bouillot, E.; Dan, B.; Bengoetxea, A.; Draye, J.P.; Lacquaniti, F. Development of a kinematic coordination pattern in toddler locomotion: Planar covariation. Exp. Brain Res. 2001, 137, 455–466. [Google Scholar] [CrossRef] [PubMed]
- Ivanenko, Y.P.; d’Avella, A.; Poppele, R.E.; Lacquaniti, F. On the origin of planar covariation of elevation angles during human locomotion. J. Neurophysiol. 2008, 99, 1890–1898. [Google Scholar] [CrossRef] [PubMed]
- Sadeghi, H.; Prince, F.; Sadeghi, S.; Labelle, H. Principal component analysis of the power developed in the flexion/extension muscles of the hip in able-bodied gait. Med. Eng. Phys. 2000, 22, 703–710. [Google Scholar] [CrossRef]
- Adams, R.W.; Gandevia, S.C.; Skuse, N.F. The distribution of muscle weakness in upper motoneuron lesions affecting the lower limb. Brain 1990, 113 Pt 5, 1459–1476. [Google Scholar] [CrossRef]
- Sekiguchi, Y.; Owaki, D.; Honda, K.; Izumi, S. The contribution of intralimb kinetic coordination in lower limb to control of propulsion and weight support at a wide range of gait speed in young and elderly people. In Proceedings of the ISPGR World Congress, Edinburgh, UK, 30 June–4 July 2019; pp. 305–306. [Google Scholar]
- Den Otter, A.R.; Geurts, A.C.; Mulder, T.; Duysens, J. Abnormalities in the temporal patterning of lower extremity muscle activity in hemiparetic gait. Gait Posture 2007, 25, 342–352. [Google Scholar] [CrossRef]
- Dyer, J.O.; Maupas, E.; de Andrade Melo, S.; Bourbonnais, D.; Nadeau, S.; Forget, R. Changes in activation timing of knee and ankle extensors during gait are related to changes in heteronymous spinal pathways after stroke. J. Neuroeng. Rehabil. 2014, 11, 148. [Google Scholar] [CrossRef]
- Raja, B.; Neptune, R.R.; Kautz, S.A. Coordination of the non-paretic leg during hemiparetic gait: Expected and novel compensatory patterns. Clin. Biomech. 2012, 27, 1023–1030. [Google Scholar] [CrossRef]
- Milovanovic, I.; Popovic, D.B. Principal component analysis of gait kinematics data in acute and chronic stroke patients. Comput. Math. Methods Med. 2012, 2012, 649743. [Google Scholar] [CrossRef] [PubMed] [Green Version]
- Goldberg, S.R.; Stanhope, S.J. Sensitivity of joint moments to changes in walking speed and body-weight-support are interdependent and vary across joints. J. Biomech. 2013, 46, 1176–1183. [Google Scholar] [CrossRef] [PubMed] [Green Version]
Figure 1.
Typical ankle, knee, and hip moments during one gait cycle. The left (a), middle (b), and right (c) figures indicate the ankle, knee, and hip moments during one gait cycle, respectively. The black line, dotted black line, and gray line represent the measurements of the PS and non-PS in patients with hemiparesis and the LS in healthy controls, respectively.
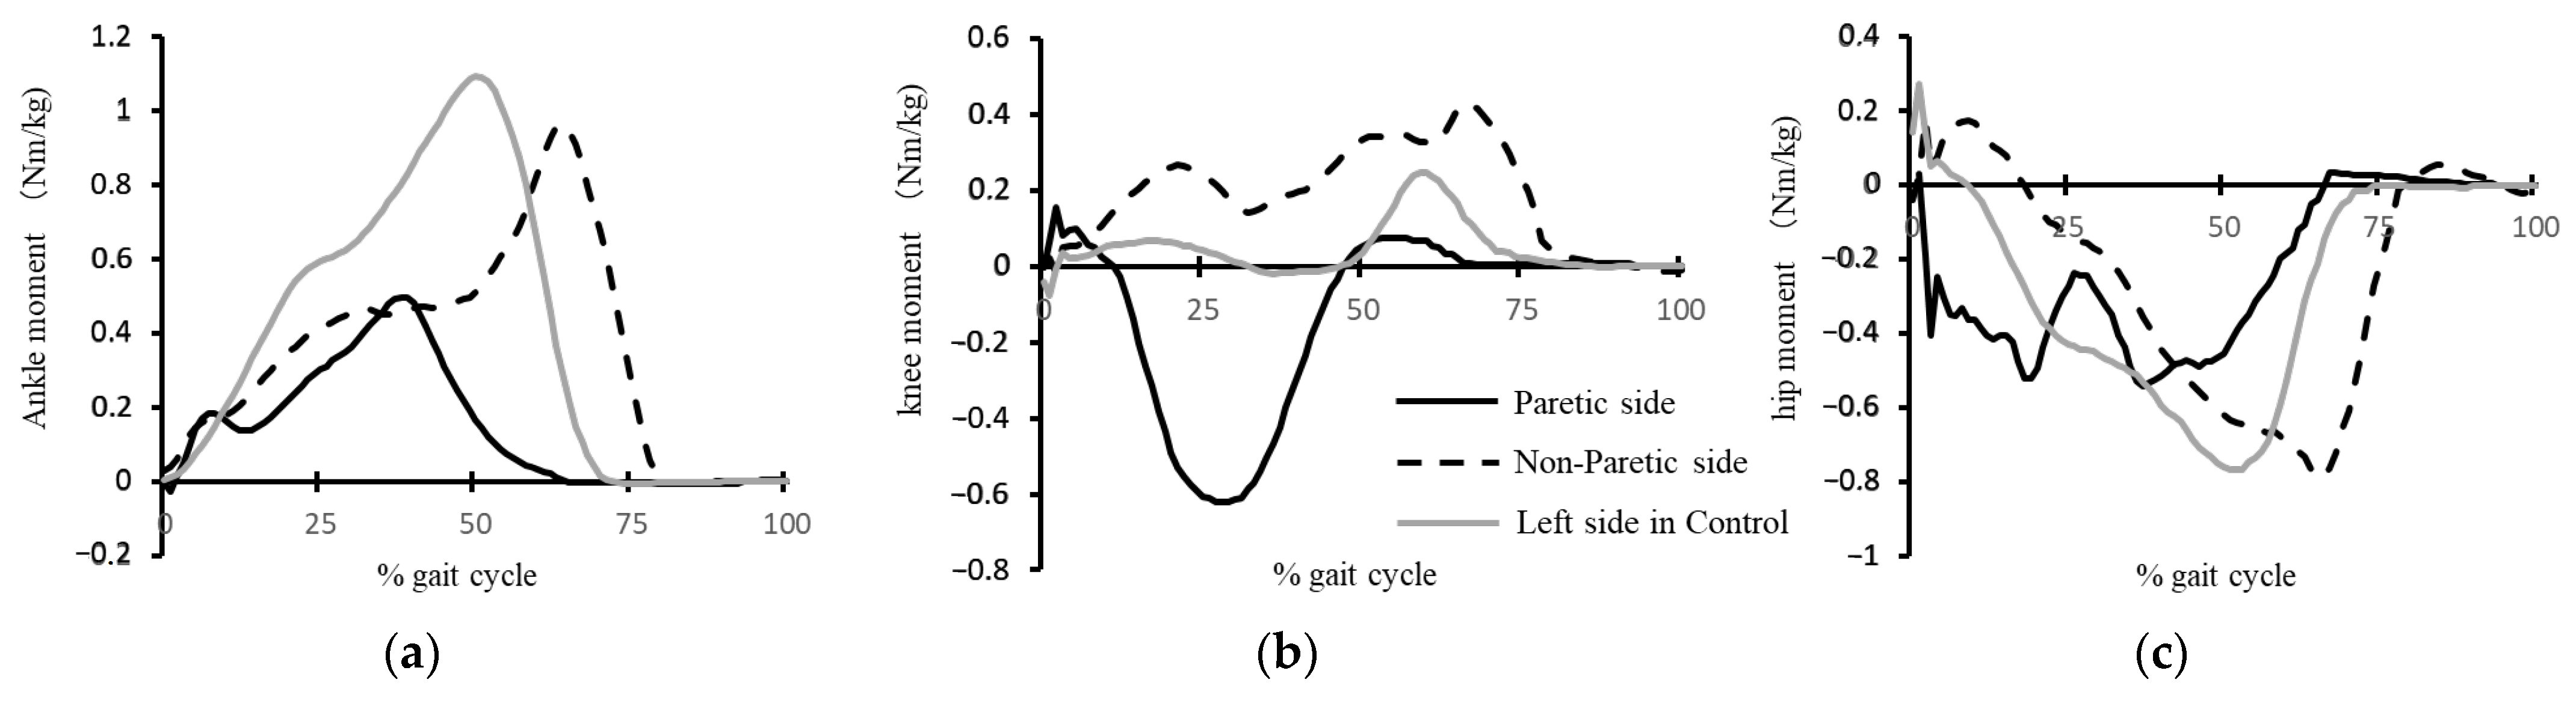
Figure 2.
Typical first two PCs during the one gait cycle. The left (a) and right (b) figures indicate the first and second PCs, respectively. The black line, dotted black line, and gray line represent the measurements on the PS, non-PS in the patient with hemiparesis, and LS in the healthy control, respectively. The first PC-time curve is unimodal, whereas the second one is bimodal. The peak timing of the PCs on the PS occurred earlier than those on the non-PS in the patients with hemiparesis and the LS in the healthy controls.

Figure 3.
Loadings of the knee joint moment for the first PC in each of the 29 patients. Thirteen patients had negative values, whereas all the others had positive values.
Figure 3.
Loadings of the knee joint moment for the first PC in each of the 29 patients. Thirteen patients had negative values, whereas all the others had positive values.

Table 1.
Characteristics of subjects with hemiparesis and controls.
| Hemiparesis | Control | |
|---|---|---|
| N | 29 | 12 |
| Gender | 25 M/4 F | 5 M/7 F |
| Age (years) | 57.9 (SD 11.1) | 52.8 (SD 10.1) |
| Height (cm) | 166.4 (SD 8.2) | 166.3 (SD 8.7) |
| Weight (kg) | 65.9 (SD 8.5) | 61.4 (SD 12.5) |
| Diagnosis | Cerebral hemorrhage 19 Cerebral infarction 10 | |
| Paretic side | 19 R/10 L | |
| Time Since neurologic event (Month) | 43 (SD 49) | |
| Brunnstrom stage in the lower limb (3/4/5/6) a | 14/4/10/1 | |
| SIAS b | ||
| Muscle tone in lower limb (0/1/2/3) | 6/15/8 | |
| Total score | 51.2 (SD 9.6) | |
| Walking item of FIM c (0/1/2/3/4/5/6/7) | 0/0/0/0/0/4/21/4 |
a The Brunnstrom stage index is a six-stage evaluation tool used for patients with hemiparesis due to stroke. It consists of three different parts: the upper extremity, hand, and lower extremity. b The SIAS assesses neurologic impairments (upper and lower limb motor function, muscle tone, sensory function, range of motion, deep tendon reflexes, pain, trunk function, visuospatial function, and speech). There are 22 items and each item is rated from 0 (severely impaired) to 3 (normal) for muscle tone, sensory function, range of motion, pain, trunk, higher cortical function, and unaffected side function, or to 5 (normal) for motor function. The total score is 76. c Walking or wheelchair item of FIM—the ability to perform the scale items is rated on a 7-point ordinal scale ranging from 1 (total dependence/maximum assistance) to 7 (total independence).
Table 2.
Marker placement on the body.
| Segment | Placement of Markers |
|---|---|
| Trunk | Spinous process of the 7th cervical vertebrae, spinous process of the 10th thoracic vertebrae, jugular notch where the clavicles meet the sternum, xiphoid process of the sternum, and the position in the middle of the right scapula. |
| Upper arm | Both acromions and both elbow lateral epicondyles |
| Forearm | Both elbow lateral epicondyles and ulnar styloid processes and radius |
| Pelvis | Both anterior superior iliac spines and both posterior superior iliac spines |
| Thigh | Both greater trochanters and both knee lateral and medial epicondyles |
| Shank | Both knee lateral epicondyles and both lateral and medial malleoli |
| Foot | Both the 1st and 5th metatarsal heads, both lateral and medial malleoli, and both calcanei |
Table 3.
The mean and standard deviation results of spatial–temporal and kinetic data.
| Control | Paretic Side | Non-Paretic Side | |
|---|---|---|---|
| Gait speed (cm/s) | 53.4 (SD 17.4) | 42.2 (SD 20.9) | |
| Stride time (s) | 1.67 (SD 0.37) | 1.67 (SD 0.51) | |
| Stride length (cm) | 90.9 (SD 16.9) a | 67.8 (SD 24.3) a | |
| Step length (cm) | 44.5 (SD 8.6) b | 35.1 (SD 10.4) | 30.1 (SD 13.8) b |
| Stance time (s) | 1.09 (SD 0.27) | 1.09 (SD 0.49) | 1.25 (SD 0.48) |
| Swing time (s) | 0.57 (SD 0.10) b | 0.58 (SD 0.11) c | 0.40 (SD 0.15) bc |
| Single support time (s) | 0.57 (SD 0.09) ab | 0.43 (SD 0.14) a | 0.40 (SD 0.15) b |
| Swing time asymmetry | 1.02 (SD 0.06) a | 1.51 (SD 0.61) a | |
| Step length asymmetry | 1.03(SD0.08) | 1.37 (SD 0.53) a | |
| Peak propulsion (N/kg) | 1.00(SD0.44) | 0.61 (SD 0.37) ac | 0.99 (SD0.42) c |
| Maximum hip extension moment in the early stance (Nm/kg) | 0.38 (SD 0.23) | 0.28 (SD 0.24) c | 0.47 (SD 0.22) c |
| Maximum hip flexion moment in the stance phase (Nm/kg) | 0.66 (SD 0.19) | 0.87 (SD 0.33) | 0.77 (SD 0.41) |
| Maximum knee extension moment in the early stance (Nm/kg) | 0.19 (SD 0.18) | 0.27 (SD 0.18) | 0.33 (SD 0.23) |
| Maximum knee flexion moment in the stance phase (Nm/kg) | 0.17 (SD 0.12) | 0.27 (SD 0.22) c | 0.14 (SD 0.14) c |
| Maximum knee extension moment in the late stance (Nm/kg) | 0.27 (SD 0.09) b | 0.30 (SD 0.20) c | 0.45 (SD 0.25) bc |
| Maximum ankle dorsiflexion moment in the early stance (Nm/kg) | 0.05 (SD 0.04) | 0.02 (SD 0.06) | 0.04 (SD 0.04) |
| Maximum ankle plantarflexion moment in the stance phase (Nm/kg) | 1.05 (SD 0.16) a | 0.71 (SD 0.28) ac | 0.90 (SD 0.24) c |
a Note: p < 0.05, control vs. paretic side, b p < 0.05, control vs. non-paretic side, and c p < 0.05, paretic side vs. non-paretic side.
Table 4.
The mean and standard deviation results for the PCA-related data.
| Control | Paretic Side | Non-Paretic Side | |
|---|---|---|---|
| Variance explained by PC1 (%) | 81 (SD 6) | 81 (SD 12) | 75 (SD 14) |
| Variance explained by PC2 (%) | 17 (SD 6) | 18 (SD 12) | 20 (SD 11) |
| Variance explained by PC1 + PC2 (%) | 98 (SD 1) b | 99 (SD 1) c | 95 (SD 5) bc |
| Timing of peak PC1 (% gait cycle) | 52 (SD 3) a | 43 (SD 9) ac | 55 (SD11) c |
| Loadings of hip joint moment in PC1 | −0.63 (SD 0.07) | −0.47 (SD 0.23) | −0.42 (SD 0.35) |
| Loadings of knee joint moment in PC1 | 0.26 (SD 0.37) | 0.03 (SD 0.53) c | 0.35 (SD 0.45) c |
| Loadings of ankle joint moment in PC1 | 0.63 (SD 0.09) | 0.67 (SD 0.10) | 0.61 (SD 0.15) |
| Loadings of hip joint moment in PC2 | 0.06 (SD 0.36) | −0.31 (SD 0.52) c | 0.07 (SD 0.67) c |
| Loadings of knee joint moment in PC2 | 0.86 (SD 0.10) ab | 0.67 (SD 0.22) ac | 0.51 (SD 0.28) bc |
| Loadings of ankle joint moment in PC2 | −0.28 (SD 0.23) | −0.13 (SD 0.37) | −0.11 (SD 0.48) |
a Note: p < 0.05 when comparing the control with the paretic side, b p < 0.05 when comparing the control with the non-paretic side, c p < 0.05 when comparing the paretic side with non-paretic side.
Publisher’s Note: MDPI stays neutral with regard to jurisdictional claims in published maps and institutional affiliations. |
© 2022 by the authors. Licensee MDPI, Basel, Switzerland. This article is an open access article distributed under the terms and conditions of the Creative Commons Attribution (CC BY) license (https://creativecommons.org/licenses/by/4.0/).
Share and Cite
MDPI and ACS Style
Sekiguchi, Y.; Owaki, D.; Honda, K.; Izumi, S.-I. Kinetic Interjoint Coordination in Lower Limbs during Gait in Patients with Hemiparesis. Biomechanics 2022, 2, 466-477. https://doi.org/10.3390/biomechanics2030036
AMA Style
Sekiguchi Y, Owaki D, Honda K, Izumi S-I. Kinetic Interjoint Coordination in Lower Limbs during Gait in Patients with Hemiparesis. Biomechanics. 2022; 2(3):466-477. https://doi.org/10.3390/biomechanics2030036
Chicago/Turabian StyleSekiguchi, Yusuke, Dai Owaki, Keita Honda, and Shin-Ichi Izumi. 2022. "Kinetic Interjoint Coordination in Lower Limbs during Gait in Patients with Hemiparesis" Biomechanics 2, no. 3: 466-477. https://doi.org/10.3390/biomechanics2030036