Article

Assessment of a Non-Destructive Testing Method Using Ultrasonic Pulse Velocity to Determine the Compressive Strength of Rubberized Bricks Produced with Lime Kiln Dust Waste

Civil Engineering Discipline, Department of Engineering, La Trobe University, Bundoora, VIC 3086, Australia
*
Author to whom correspondence should be addressed.
Geotechnics 2023, 3(4), 1294-1308; https://doi.org/10.3390/geotechnics3040070
Submission received: 21 September 2023 / Revised: 7 November 2023 / Accepted: 14 November 2023 / Published: 1 December 2023
(This article belongs to the Special Issue Recent Advances in Geotechnical Engineering (2nd Edition))

Abstract

:
This paper presents a comprehensive study in which non-destructive testing utilizing ultrasonic pulse velocity (UPV), considering both pressure (P) waves and shear (S) waves, was used to assess the compressive strength (CS) of rubberized bricks. These innovative bricks were manufactured by blending lime kiln dust (LKD) waste with ground granulated blast furnace slag (GGBFS), sand, and fine waste tire crumb rubber (WTCR). This study introduces mathematical models to explain the relationships between the results of destructive tests (DTs), specifically compression strength (CS) tests, and non-destructive tests (NDTs) employing UPV. These models were subsequently used to conduct validation exercises to accurately predict the strength of the rubberized bricks produced. The outcomes of the validation tests underscore the effectiveness of the UPV method in predicting the CS of rubberized eco-friendly bricks produced using an LKD-GGBFS blend. Importantly, the prediction using the power model exhibited minimal errors, confirming the utility of the UPV method as a reliable tool for assessing the compressive strength of such sustainable construction materials. This research contributes to advancing the field of eco-friendly construction materials and highlights the practical applicability of non-destructive ultrasonic testing in assessing their structural properties.

1. Introduction

Gradually, environmental pollution is becoming a worrisome global phenomenon due to varying activities like industrialization and urbanization, which are usually associated with economic development. These have led to a general increase in energy consumption as well as waste discharges. Waste management fundamentally constitutes waste collection, transportation, disposal, and/or cremation. Waste generated can be reduced, reused, and/or recycled, significantly decreasing the quantity of waste dumped on available lands [1]. Environmental pollution, such as greenhouse gas emissions, acid deposition, water pollution, and waste management, has been adjudged a global public health problem. Therefore, there is a continuous need for investigation from multiple standpoints on how these pollutants can be tackled to promote health standards and strengthen environmental systems to resist contamination [2,3,4].
The production and use of ordinary Portland cement (OPC), a major binder material that is universally used in construction, accounts for monumental negative environmental impacts, including the release of high embodied energy during its production at temperatures of about 1450 °C [5,6]. Furthermore, the use of OPC for industrial activities such as construction and building operations has accounted for about 36% of the global use of energy and about 40% of CO2 emissions [5,6,7], ranking OPC as one of the construction materials for which sustainability is of the greatest concern [8,9,10]. Due to these concerns, significant research has been carried out on the utilization of alternative cementation materials (ACMs) in construction to replace OPC. Duan et al. [11] researched fly-ash metakaolin geopolymer (FAMG) as an alternative to OPC, and the results obtained from their study showed that the geopolymer exhibited better strengthening qualities when compared to OPC at varying temperatures. The production of cement-free construction blocks from steel slag industry waste as a sole binder material was carried out by Mahoutian and Shao [12]. The results of their study demonstrated that slag-bond concrete blocks exhibited better mechanical and durability properties when compared to those produced from OPC. In addition, the slag-bond concrete blocks did not lose mass after 20 cycles of freeze and thaw, while the commercial cement OPC blocks did. Furthermore, studies on the engineering properties of cementless concrete produced from GGBFS as the cementation material and recycled desulphurization slag (DS) as coarse and fine aggregates were carried out by Kuo et al. [13]. A superplasticizer was also added to improve the workability within the mix and enhance the compressive strength of the concrete produced. A minimum compressive strength of 14 MPa, which is the requirement for low-strength concrete, was achieved. Additionally, sulphate attack resistance was enhanced, and the samples indicated good volume stability.
The properties and successful engineering applications of crumb rubber obtained from waste tires have been previously reported in various publications concerning their environmental, economic, and technical benefits [14,15,16,17,18,19]. The incorporation of waste tire crumb rubber (WTCR) into engineering cementitious composites is increasingly being recognized for its substantial environmental benefits. This practice not only improves environmental health and contributes to the reduction in CO2 emissions, as evidenced in studies [20,21], but it also addresses critical geo-environmental concerns. One such concern is the instability of riverbeds, a consequence of the extensive dredging of fine aggregates from rivers, which leads to significant changes in river flow directions [22]. Furthermore, the use of WTCR as a partial replacement for granular materials offers a solution to the depletion of natural resources like sand and gravel, a situation that the surge in construction activities has aggravated. By substituting traditional aggregates with WTCR, not only are these environmental impacts significantly reduced, but it also aids in the production of lighter-weight structures. This approach marks a sustainable and innovative shift in construction material technology, aligning with environmental conservation and resource efficiency goals. The incorporation of WTCR into concrete was investigated by Youssef et al., [23] and the results obtained from their experiments showed that the concrete samples produced with pre-treated crumb rubber with a 10% NaOH solution had a 17.2% higher strength when compared to samples that were produced with untreated crumb rubber. Hence, they recommended using treated waste tire crumb rubber in concrete. The outcome from research carried out by Thomas and Gupta [24] highlighted that with a 12.5% optimum replacement of fine aggregates with WTCR, moderate compressive strength, lighter weight elements, and better resistance to water absorption were achieved.
It is of the utmost importance to note that cementless construction composites produced with waste materials and used for building structures need to be tested at production and after they have been incorporated into buildings. This emphasizes the importance of proper quality control for these structures built with waste material; however, there is limited knowledge on the utilization of NDTs on cementless construction composites produced with waste alone. Hence, the use of NDT methods in assessing the properties of these non-traditional construction composites at the point of production is essential.
NDTs, which are testing methods that are integral for carrying out in-place assessments without setting off structural damage, have shown advantages over destructive testing. Presently, various NDT methods have been employed in the evaluation of different concrete types [25]. For instance, UPV has successfully been utilized to assess the mechanical properties of masonry units produced from clay [26,27] and concrete elements [28,29,30] as well as for assessing weathered granites [31,32]. Additionally, ground-penetrating radar (GPR), another form of NDT, has successfully been used to measure the moisture content level in brick masonry models and full-scale stone after simulated flooding [33]. Furthermore, rebound hammer tests, which are also a form of NDT, have been used to investigate the strength of concrete elements [26,29].
From various studies that have been carried out on assessing the effectiveness of NDTs for strength evaluation in concrete units, the use of UPV has been highlighted to be a very effective NDT method [26,28,29,30,34,35]. The UPV testing method majorly comprises compression or longitudinal (P) waves and shear (S) waves [36]. P waves are globally employed for the estimation of strength in cemented granular materials due to their easy generation, higher velocity, and easy measurement [28,30,35]. Alternatively, S waves are known for their stable velocities in concretes at varying moisture contents and air void levels [30]. Hence, research on the use of UPV for strength estimation in concrete units is receiving great attention, and for cementless units produced with waste, more attention is needed.
Mohammed et al. [35] carried out an evaluation of rubbercrete using the UPV (P waves) and rebound hammer (RH) tests to establish a relationship between CS and the UPV and RH of the rubbercrete samples. Exponential models were used to relate the CS to the UPV and the CS to the RH results. After a thorough examination of the models, they concluded that the results obtained from the RH test showed more dependence on the properties of the rubbercrete mixture when compared to the results obtained from the UPV test. Hence, they recommended that the UPV test was a more realistic evaluation of rubbercrete mixtures. Choi et al. [37] investigated the strength properties of rubberized concretes using the UPV (P waves) test. The samples’ CS and splitting tensile strengths were determined experimentally, and exponential models were proposed and used to validate the experimental data. They concluded that the UPV measurements could be used to estimate the strength of rubber concretes; however, further investigation was needed subject to various factors considered in producing the concrete, such as the curing time, the water-cement ratios, and the replacement ratios of rubber particles as well as the sizes and types of rubber. Yilmaz et al. [34] assessed the strength properties of cemented paste backfill using the UPV (P waves) tests. The effect of fines (<20 µm) of tailings, the water-to-cement ratio, and the binder type/dosage on the UPV of cemented paste backfill samples were investigated and compared to the corresponding unconfined compressive strength (UCS) results. A linear relationship was proposed to exist between the UCS and the UPV of the cement paste backfill samples. Their investigation established that the UPV tests could reliably be used to estimate the strength of cement paste backfill samples. Marie [38] investigated zones of weakness of concrete produced with rubber using the UPV (P waves) test. The investigation focused on identifying the optimal amount of crumb rubber from waste tires ranging from 0–100% by the volume of the fine aggregate that could partially replace fine aggregates in the concrete. The samples tested using UPV tests revealed three zones of weakness in the samples, which were zones A (>5.1 km/s), B (3.2–5.1 km/s), and C (2.0–3.1 km/s). The samples with a 25% rubber content were reported as having an optimal rubber content, which fell within zone A, and they demonstrated that although the compressive strength was reduced, the samples’ results remained within acceptable limits.
Several research studies have been carried out to evaluate the relationships between the UPV and the CS of rubberized bricks produced with cement; however, this relationship has not been investigated on rubberized bricks produced with LKD as an alternative to OPC. In this study, eco-friendly bricks were produced using a blend of LKD-GGBFS for cementing purposes and with varying contents of fine WTCR aggregates as a partial replacement to natural fine aggregates for weight reduction. The outcome of the NDTs using the UPV wave transducers (P wave: 54 kHz and S wave: 40 kHz) and DTs using the compression tests were investigated and compared. The results obtained from this study are intended to bring to the fore the wave option (P or S waves) to be employed in obtaining models that can be used to accurately predict the CS of rubberized bricks produced with an LKD-GGBFS blend.

2. Materials and Methods

2.1. Materials

2.1.1. LKD and GGBFS
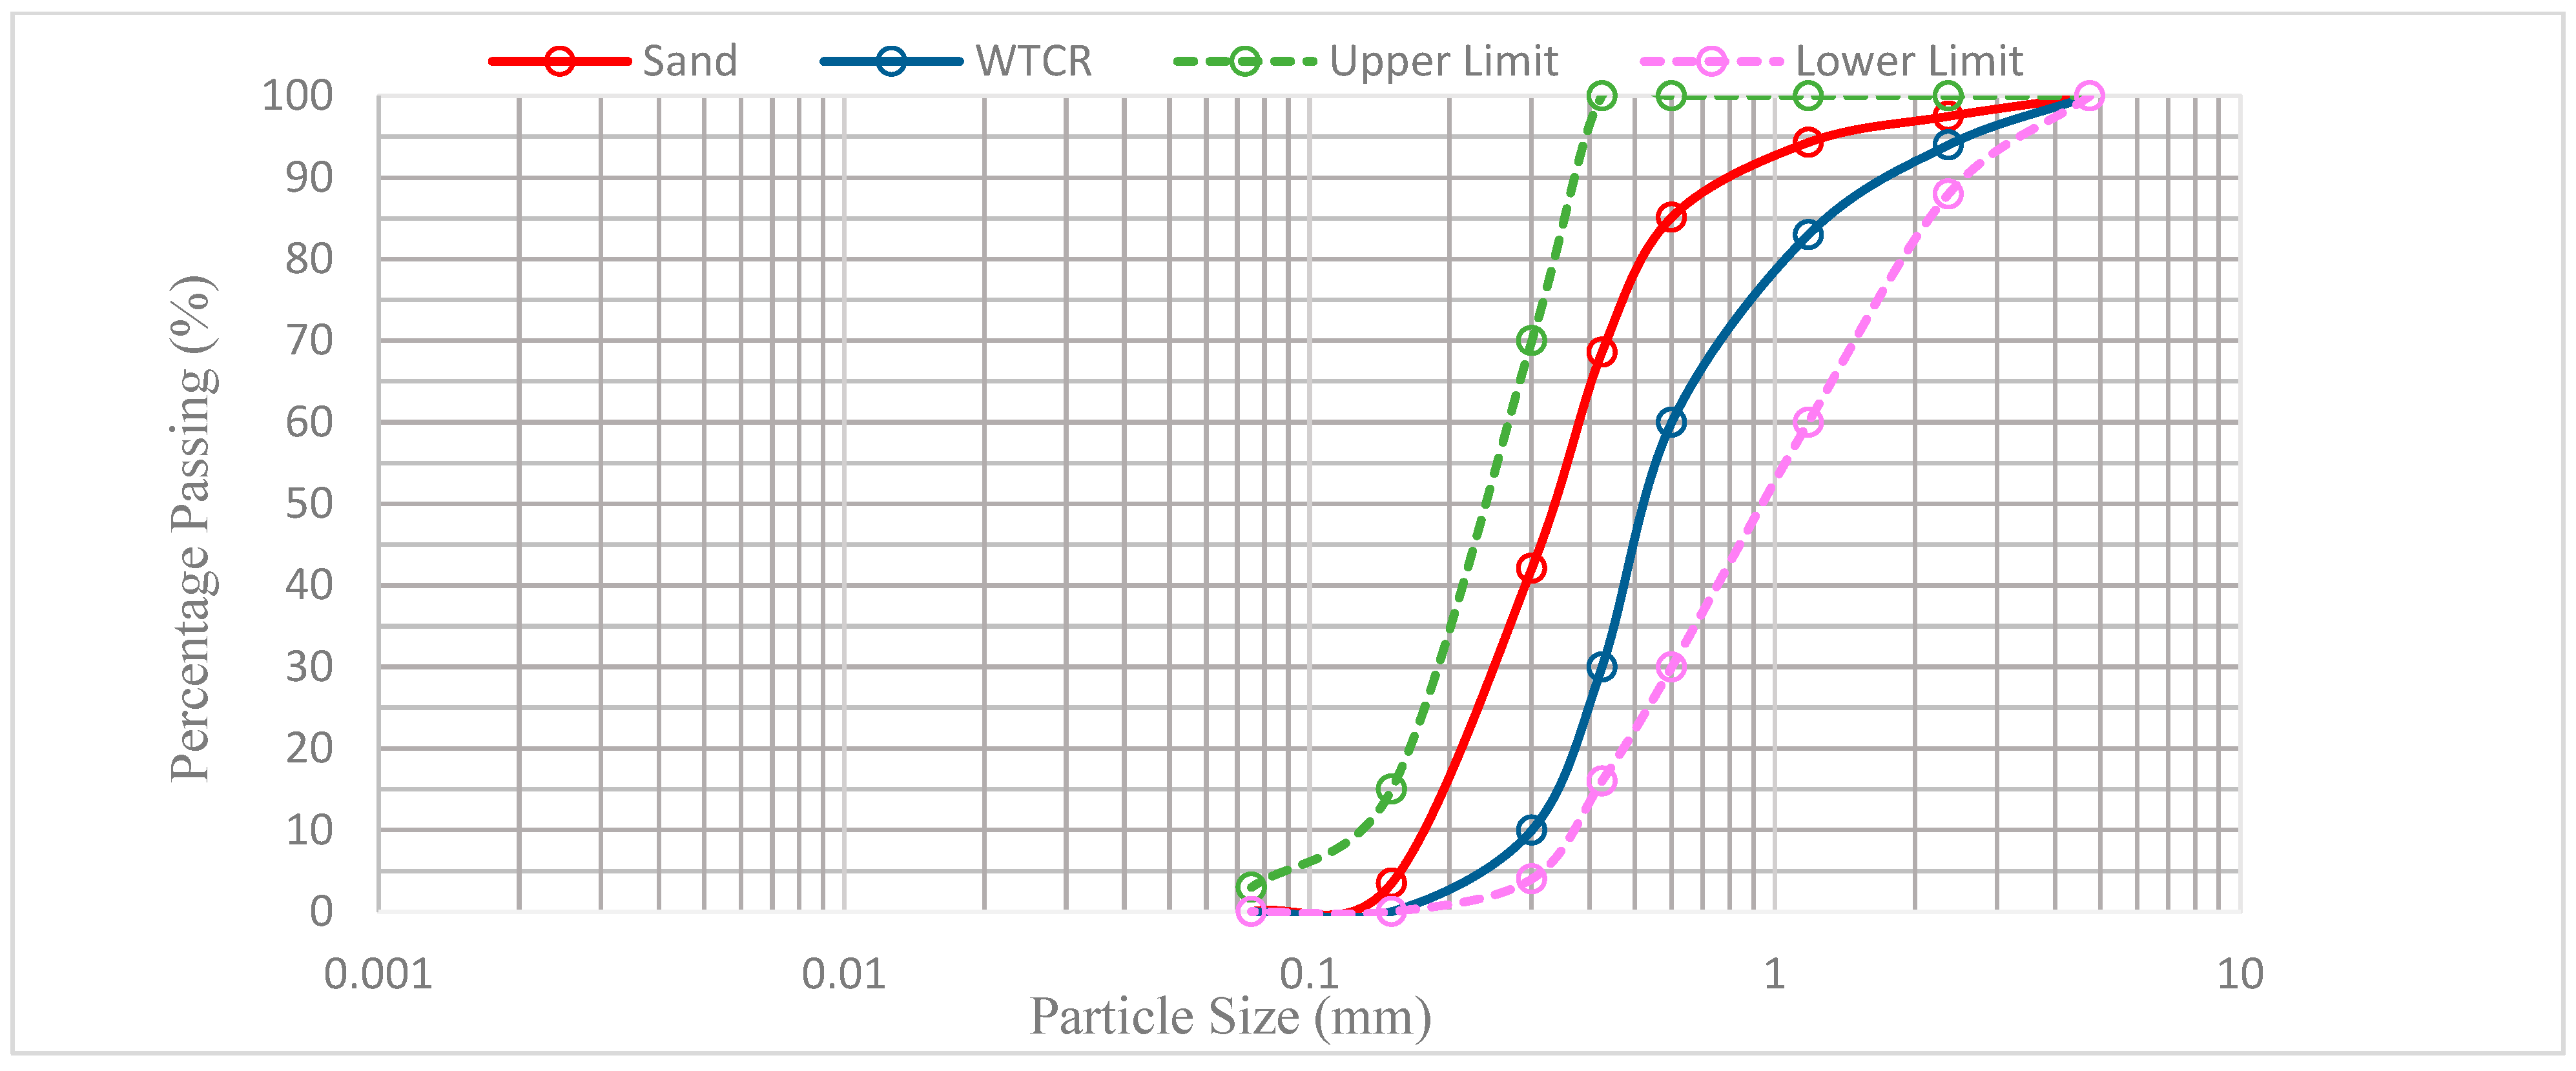
Lime kiln dust (LKD) is an end waste product in a powdered form obtained from the production of quicklime (QL), which is high in calcium content but mostly ends up in landfills [39]. The LKD waste used in this study was obtained from high-temperature rotatory kilns after quicklime (calcium oxide) production from Cement Australia.
Research into the use of alternative cementitious materials (ACMs) is on the rise due to the adverse effects surrounding the production and use of OPC. OPC consists of CaO (61–67%), SiO2 (19–23%), Al2O3 (2.5–6%), Fe2O3 (0–6%), and MgO (0–5%) [40], which are the compounds responsible for strengthening samples. Furthermore, before any material can be used to replace OPC, their chemical oxides must fall within this range. Chemical analysis using atomic absorption spectroscopy (AAS) was carried out on the LKD waste, and the results showed that the LKD waste consisted of CaO, SiO2, Al2O3, Fe2O3, and MgO with oxide proportions of 63.42, 20.04, 4.90, 3.49%, and 1.11%, respectively. Hence, their presence and composition identified the LKD as a good alternative to OPC. However, ref. [41,42] reported in their research that a supplementary cementitious material (SCM) with a high SiO2 content of at least 30% needs to be combined with the LKD to enhance the cementation property of LKD, and so GGBFS with a SiO2 of 33.1% was used in combination with the LKD. The LKD and GGBFS were combined using a blending ratio of 70:30 (LKD: GGBFS), and the high CaO and SiO2 contents in the matrix were responsible for the recorded strengthening of the bricks [43]. The specific gravity (Gs) values of the LKD and the GGBFS were determined to be 2.75 and 2.65, respectively. Samples of the LKD and the GGBFS used in this study are shown in Figure 1 and Figure 2 below.

2.1.2. Sand

Sieve analysis was performed on the sand samples, and the results showed that the sand’s fineness modulus (FM) was 2.47. River sand with an FM value within the range of 2.3–3.1 [44,45] or 2.2–2.8 [46] is recommended for brick production. The Gs of the sand used in this study was 2.61.

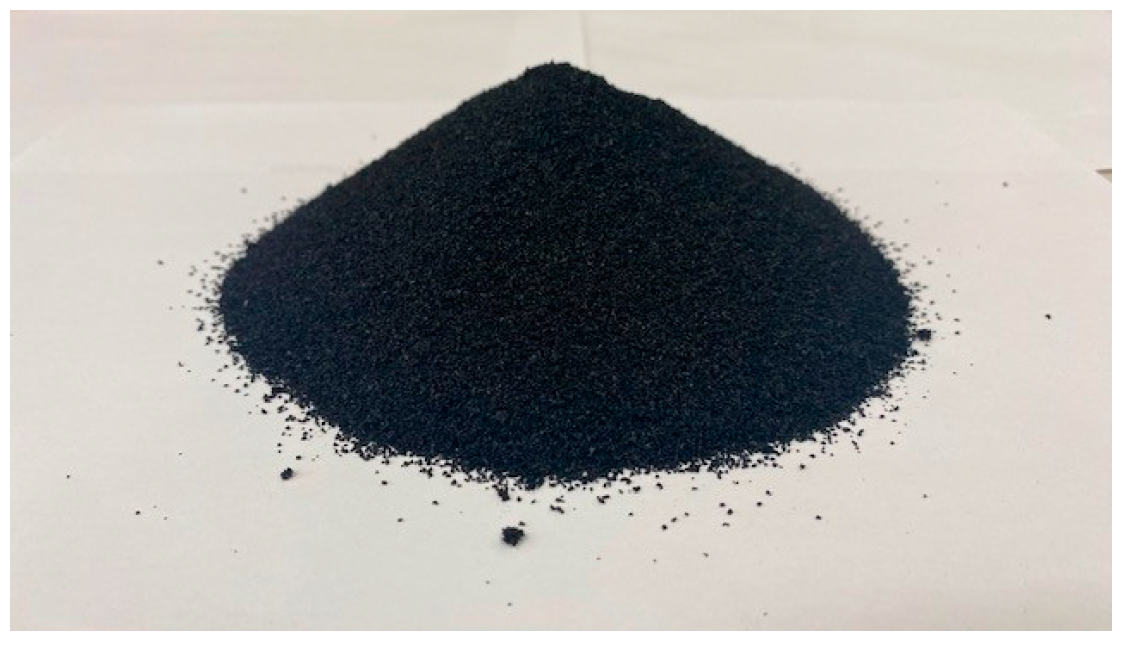
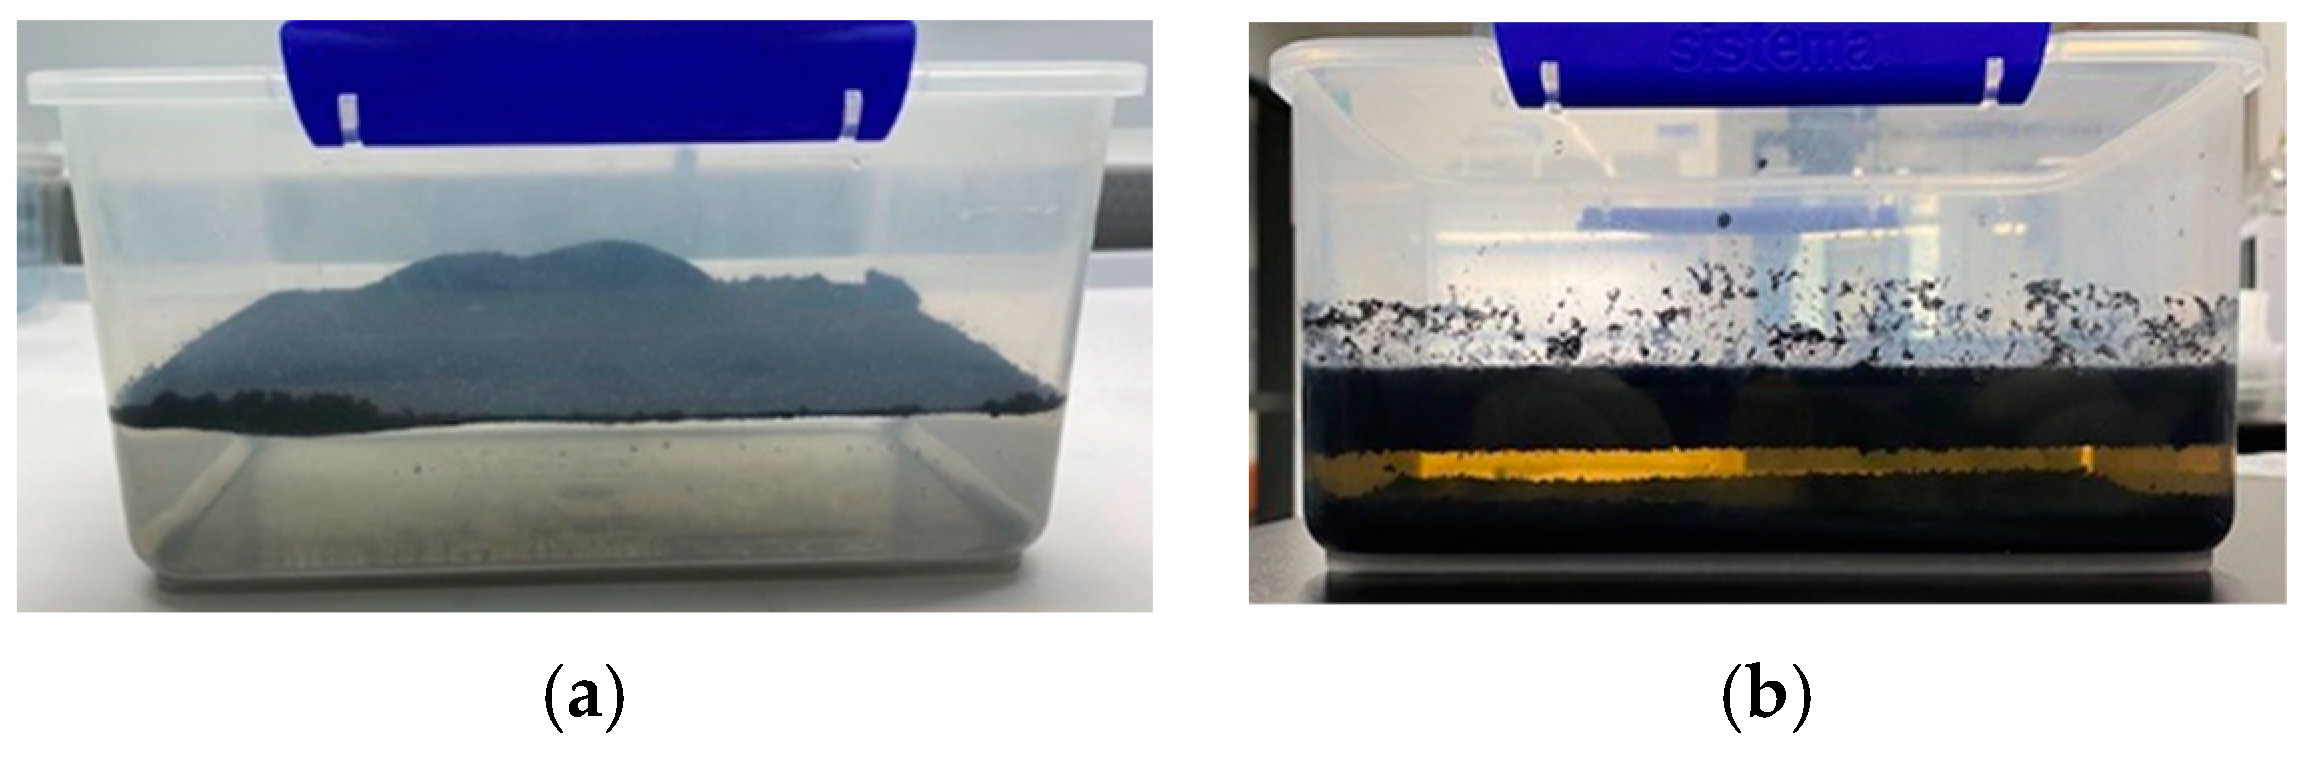
2.1.3. Fine Waste Tire Crumb Rubber (WTCR)

Figure 3 shows an image of the WTCR used in the study. The aim of using the WTCR was to reduce the weight of the masonry units produced while addressing the environmental issues regarding the indiscriminate dumping of waste tires [47]. Its application, however, reduces the workability of the mix [48,49] and the strength of the samples produced [37,38,50]. This loss in strength associated with the formation of weak bonds is because of the impermeability and smoothness of the rubber material [23,51]. These characteristics result in incomplete bonding between the cementitious paste and the rubber aggregates, leading to cracks when the samples are loaded externally [52]. The weak bonding brings about a low concrete performance in samples. So, to address this shortcoming and enhance the mechanical properties of the samples, surface treatment of the rubber aggregates using a 10% NaOH solution has been recommended [47,53,54,55]. As shown in Figure 4a,b, this treatment process was carried out to enhance the bonding between the rubber aggregates and the LKD–GGBFS matrix. Other tests carried out on the WTCR included determining the specific gravity (Gs) and the sieve analysis. The results obtained from these tests indicated that the values of Gs and FM were 0.77 and 2.96, respectively. Gs values for WTCR ranging between 0.48 and 1.72 have been reported in different studies [37,48,55,56,57]. Furthermore, the FM obtained for the WTCR was within the required limits as reported by studies [56,57] and as specified by codes [44,45] for fine aggregates. Hence, the fine WTCR used in this study could partially replace fine natural aggregates (sand) since it possessed similar grading properties to the sand aggregates.
Figure 5 shows the gradation curve of the fine natural aggregates, the fine WTCR, and the lower and upper limits for fine aggregates, showing that the fine aggregates used in this study fell within the required limits [44,45].

2.2. Methods

2.2.1. Mix Design

In this study, the laboratory design of the brick mix compositions focused on achieving a minimum compressive strength of 3 MPa, which is suitable for non-load-bearing masonry units as per references [58,59]. The mix comprised 1.0 part by weight of a lime kiln dust (LKD) and ground granulated blast furnace slag (GGBFS) blend as the binder, 3.0 parts by weight of sand as the aggregate, and a water–binder (w/b) ratio of 0.45. To enhance workability, an average of 1.5% of a water-reducing agent (WRA) was added, calculated based on the weight of the LKD-GGBFS blend. Waste tire crumb rubber (WTCR) was also experimentally used to replace the sand in the mix in increments of 5%, 10%, 15%, and 20% by volume. Distilled water was utilized for the sample preparation to ensure consistency and purity in the mix.

2.2.2. Preparation and Curing of Samples

  • The procedure for mixing the ingredients for brick production was carried out using standards [58,59], and afterward, the mix was transferred into already greased formworks.
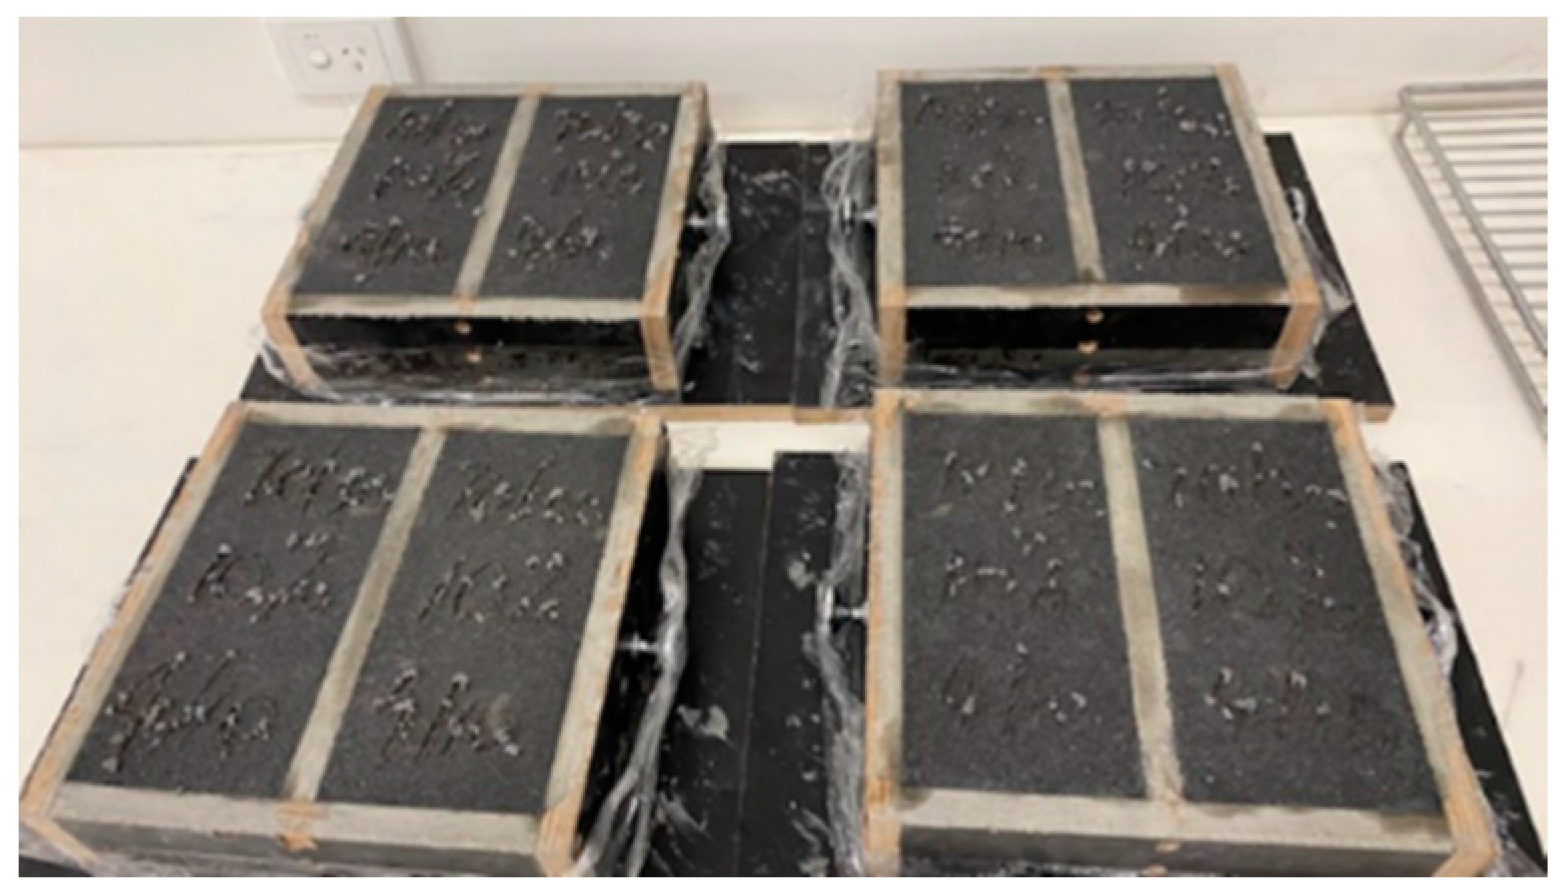
  • The greased formworks were placed on a vibrating table, and the mix was transferred into the forms in 3 layers. For the first and second layers, the vibration lasted for 40 s, and for the final layer, the vibration lasted for 120 s. After that, the excess material above the formworks was struck off to give a leveled and smooth surface, as shown in Figure 6.
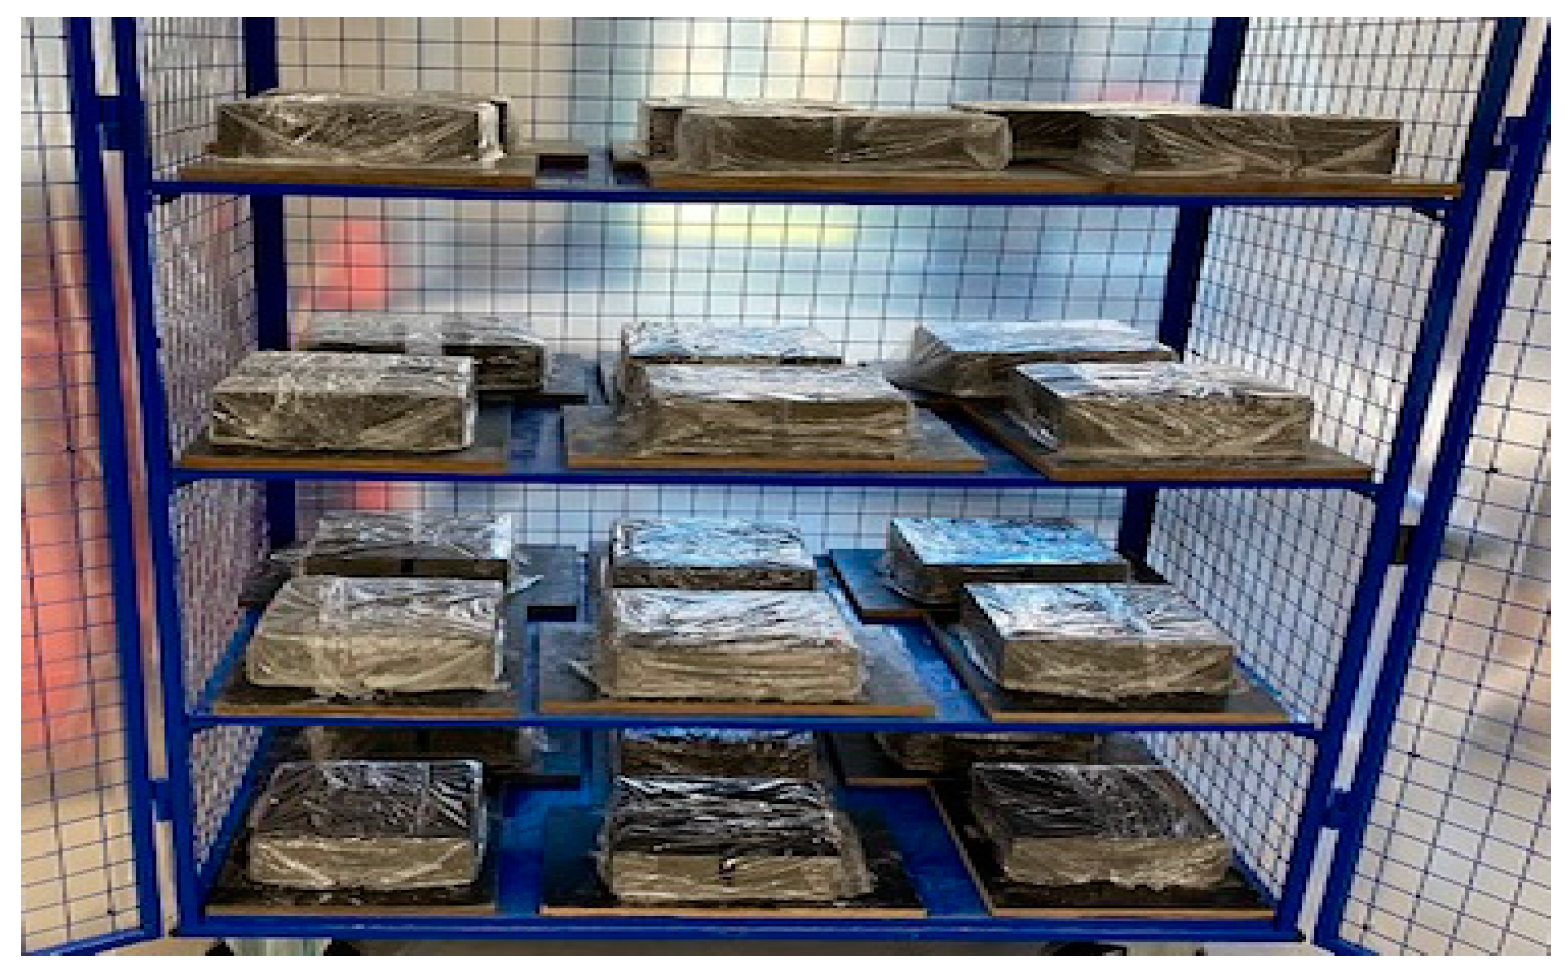
  • The bricks were allowed to sit for 48 h before de-molding. Immediately after de-molding, the samples were sprayed with water and wrapped in layers of cling film to retain the moisture and were kept in a controlled environment with an average humidity and temperature of 79% (±5%) and 19 °C (±5 °C), respectively, to enhance the moist curing (Figure 7).
  • Spraying of the samples continued every other day for 7, 14, and 28 days, respectively. When the respective curing durations had elapsed, the samples were unwrapped and air-dried for 3–5 days, and then the NDT (UPV) and the DT (compression) tests were carried out.

3. Testing of Bricks

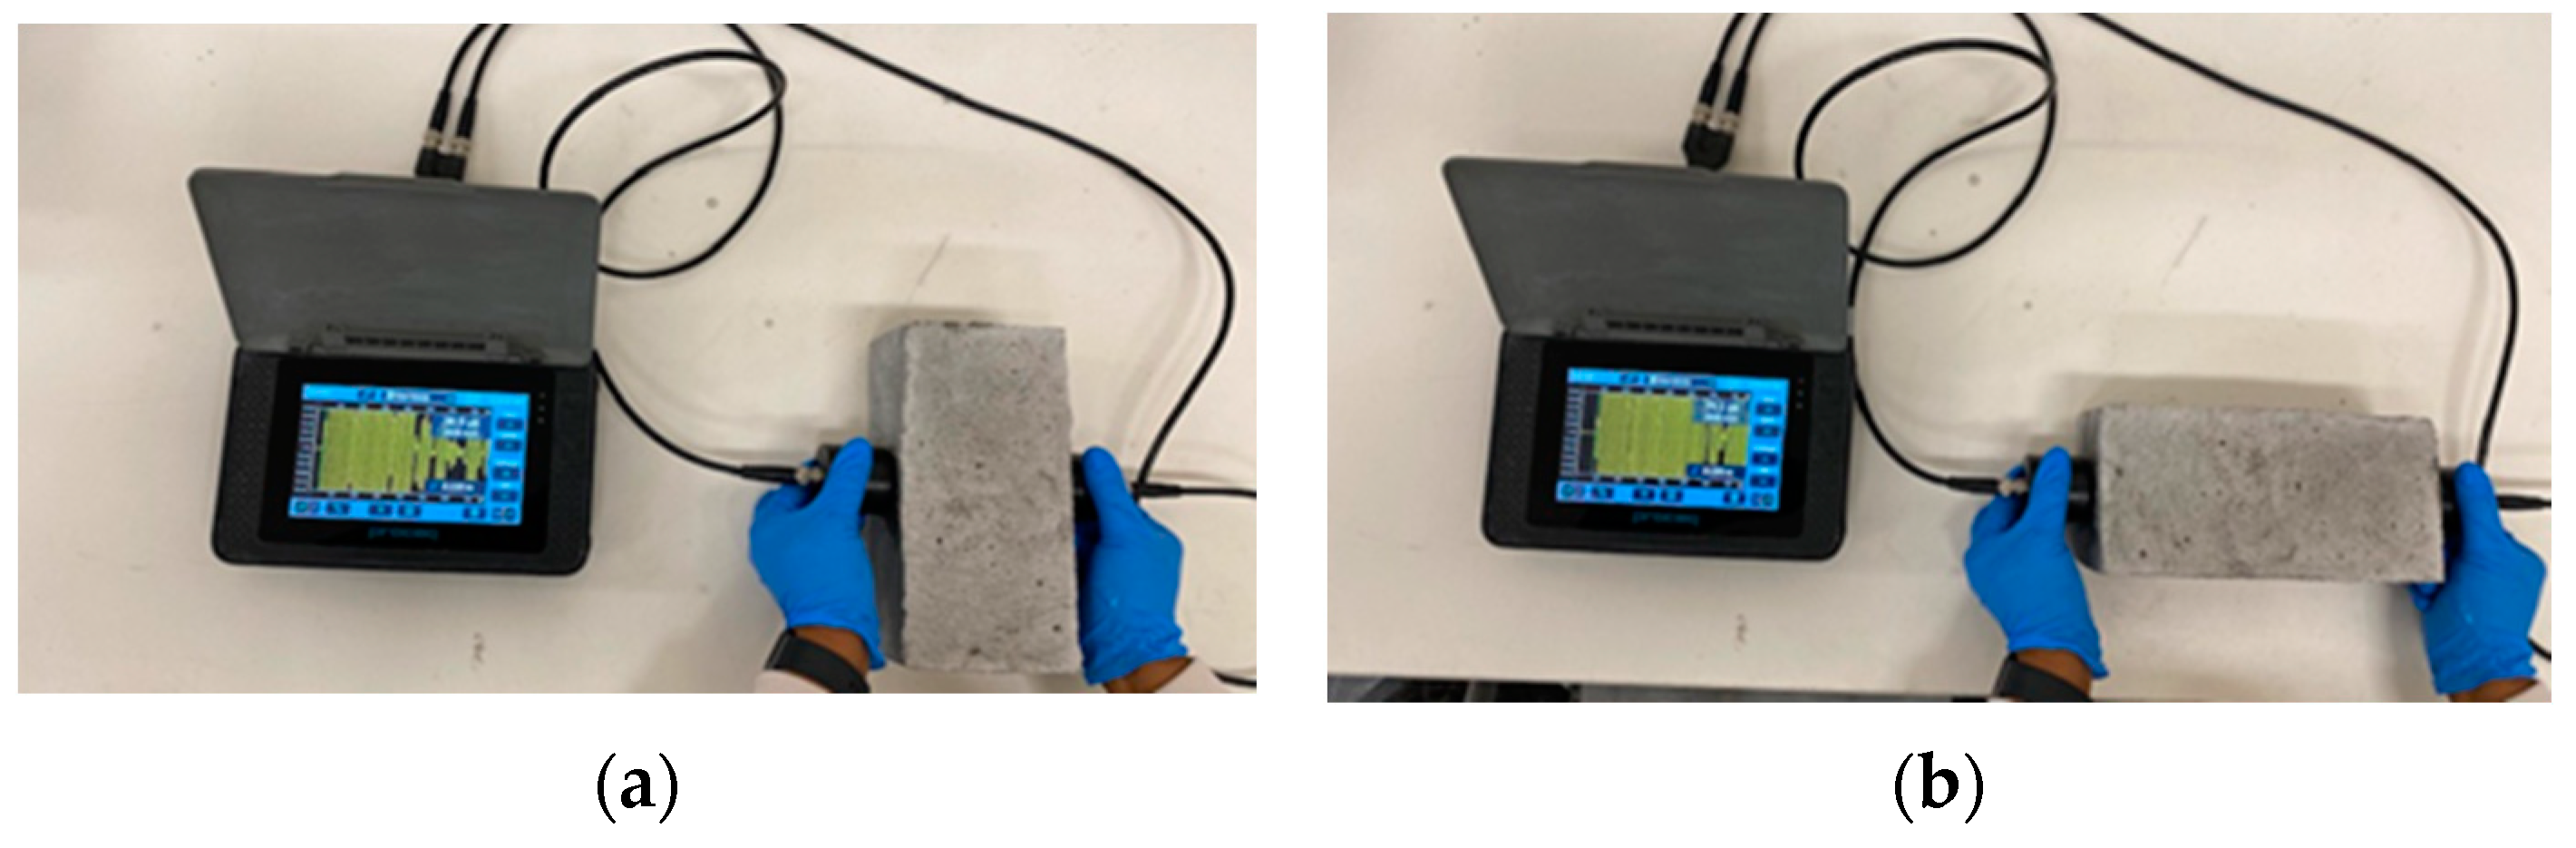
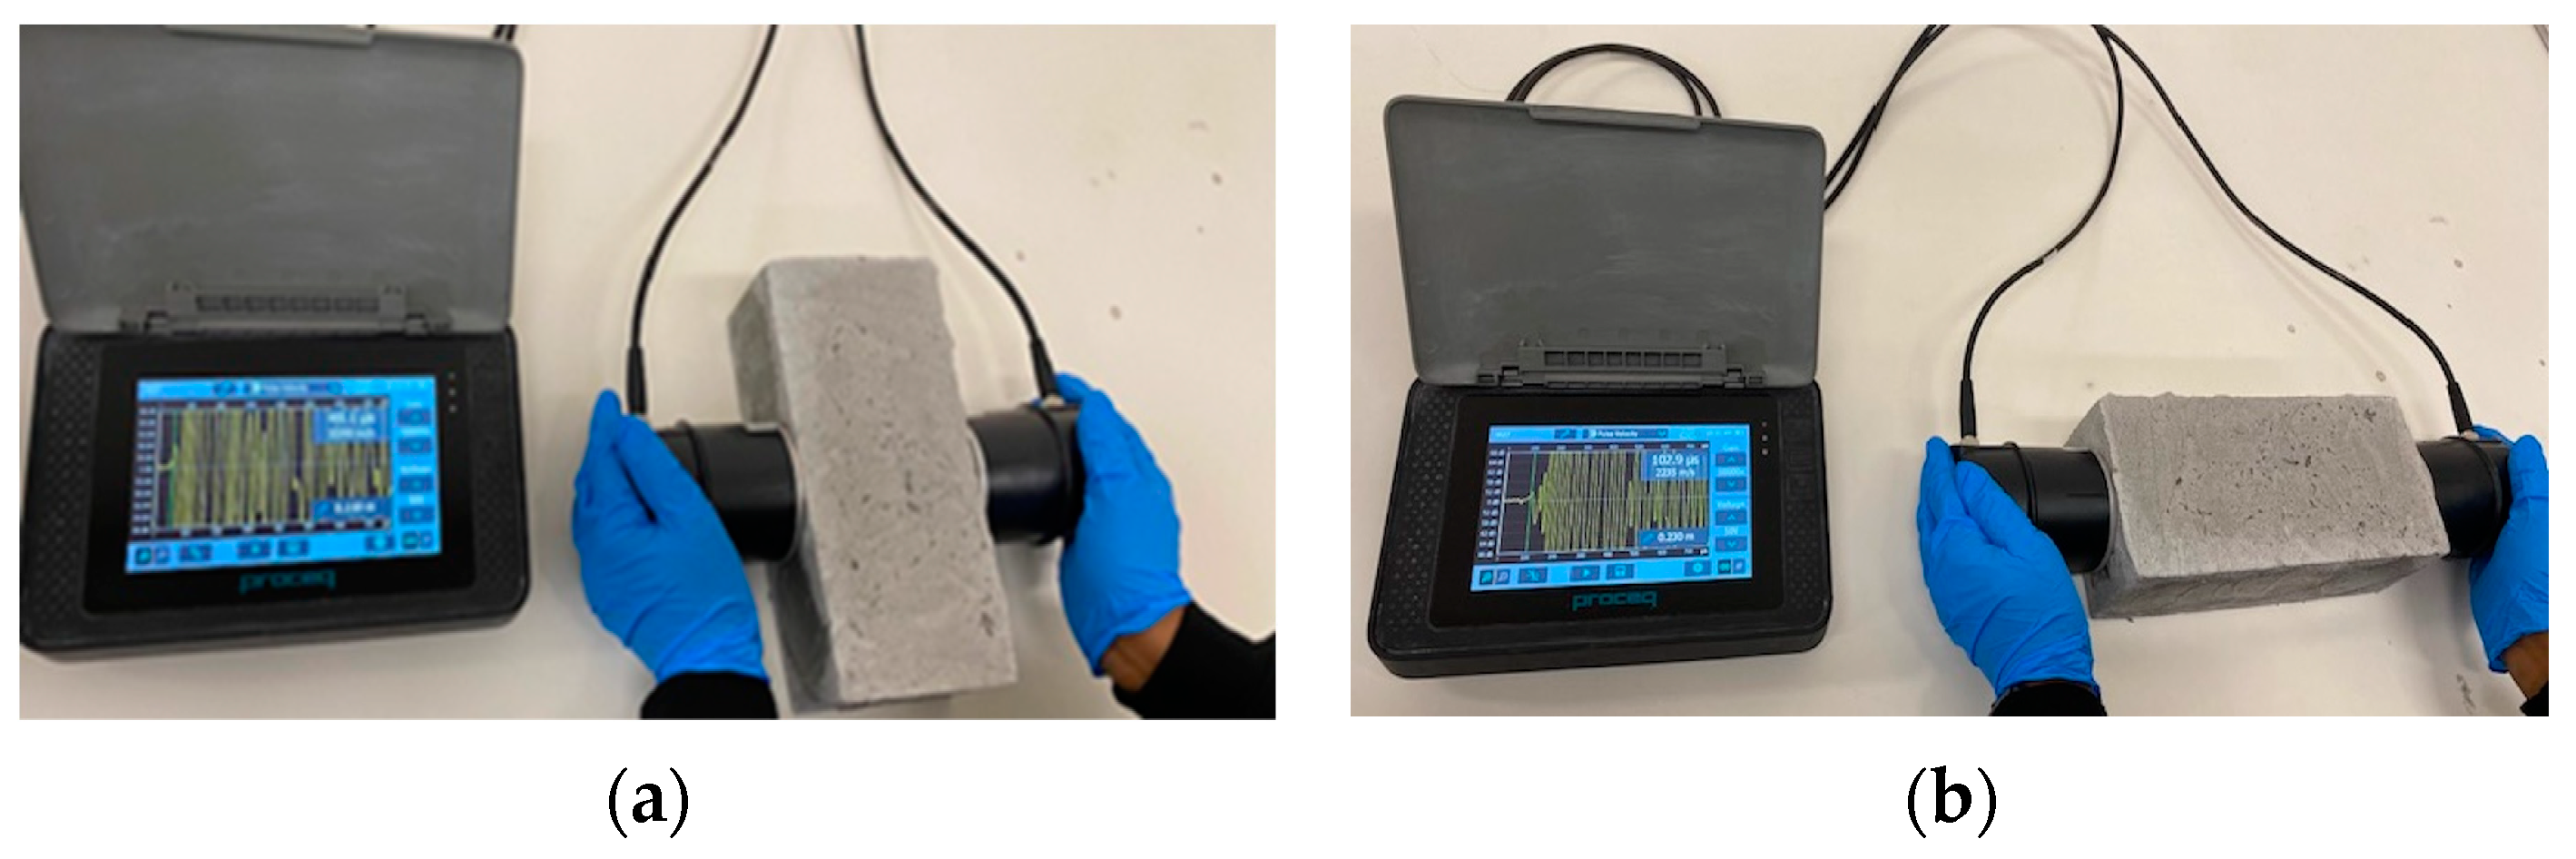
3.1. NDT: Ultrasonic Pulse Velocity (UPV) Test

The NDTs were carried out on the brick samples using a Pundit PL-200 ultrasonic pulse velocity (UPV) testing machine to determine the passage of waves (P and S) through the brick samples before crushing. Vaseline was applied to the surface of the samples, and this was carried out to maintain good contact between the sample and the transducers. The transducers were then placed on the bricks transversely and longitudinally, as shown in Figure 8a,b and Figure 9a,b. The waves transmitted were determined according to standards [60].

3.2. DT: Compression Strength (CS) Tests

A compression test is usually carried out to ascertain the peak stress any sample can withstand. The CS test was carried out using the MTS compression testing machine (500 kN ± 25 kN capacity). Figure 10a,b show the samples in the machine before and after testing. The brick samples were subjected to a compressive load at a rate of 4 mm/min, and the testing procedure was carried out in line with codes [58,59,61,62]. The CS was computed using Equation (1) below [62]:
CS = K a ( 1000 P A )
where
  • Ka = aspect ratio factor determined with respect to the brick’s height-to-thickness ratio
  • P = Load at which failure of the brick specimen occurs (kN)
  • A = Area of the brick sample (mm2)
  • CS = Compressive strength of the brick sample (MPa)

4. Discussion of Results

As shown in Table 1, a mix design was carried out to ascertain the right mix that would be utilized for the final design. A total of 63 bricks were produced for the trial mix, and these were tested at 7, 14, and 28 days, respectively. The LKD:GGBFS content was varied using a constant water binder ratio of 0.45, and the mix that gave CS ≥ 5 MPa [59], which also had a higher LKD ratio, was used as the final mix design. Hence, a 70:30 (LKD:GGBFS) blend was selected as the final blending ratio for the mix design.

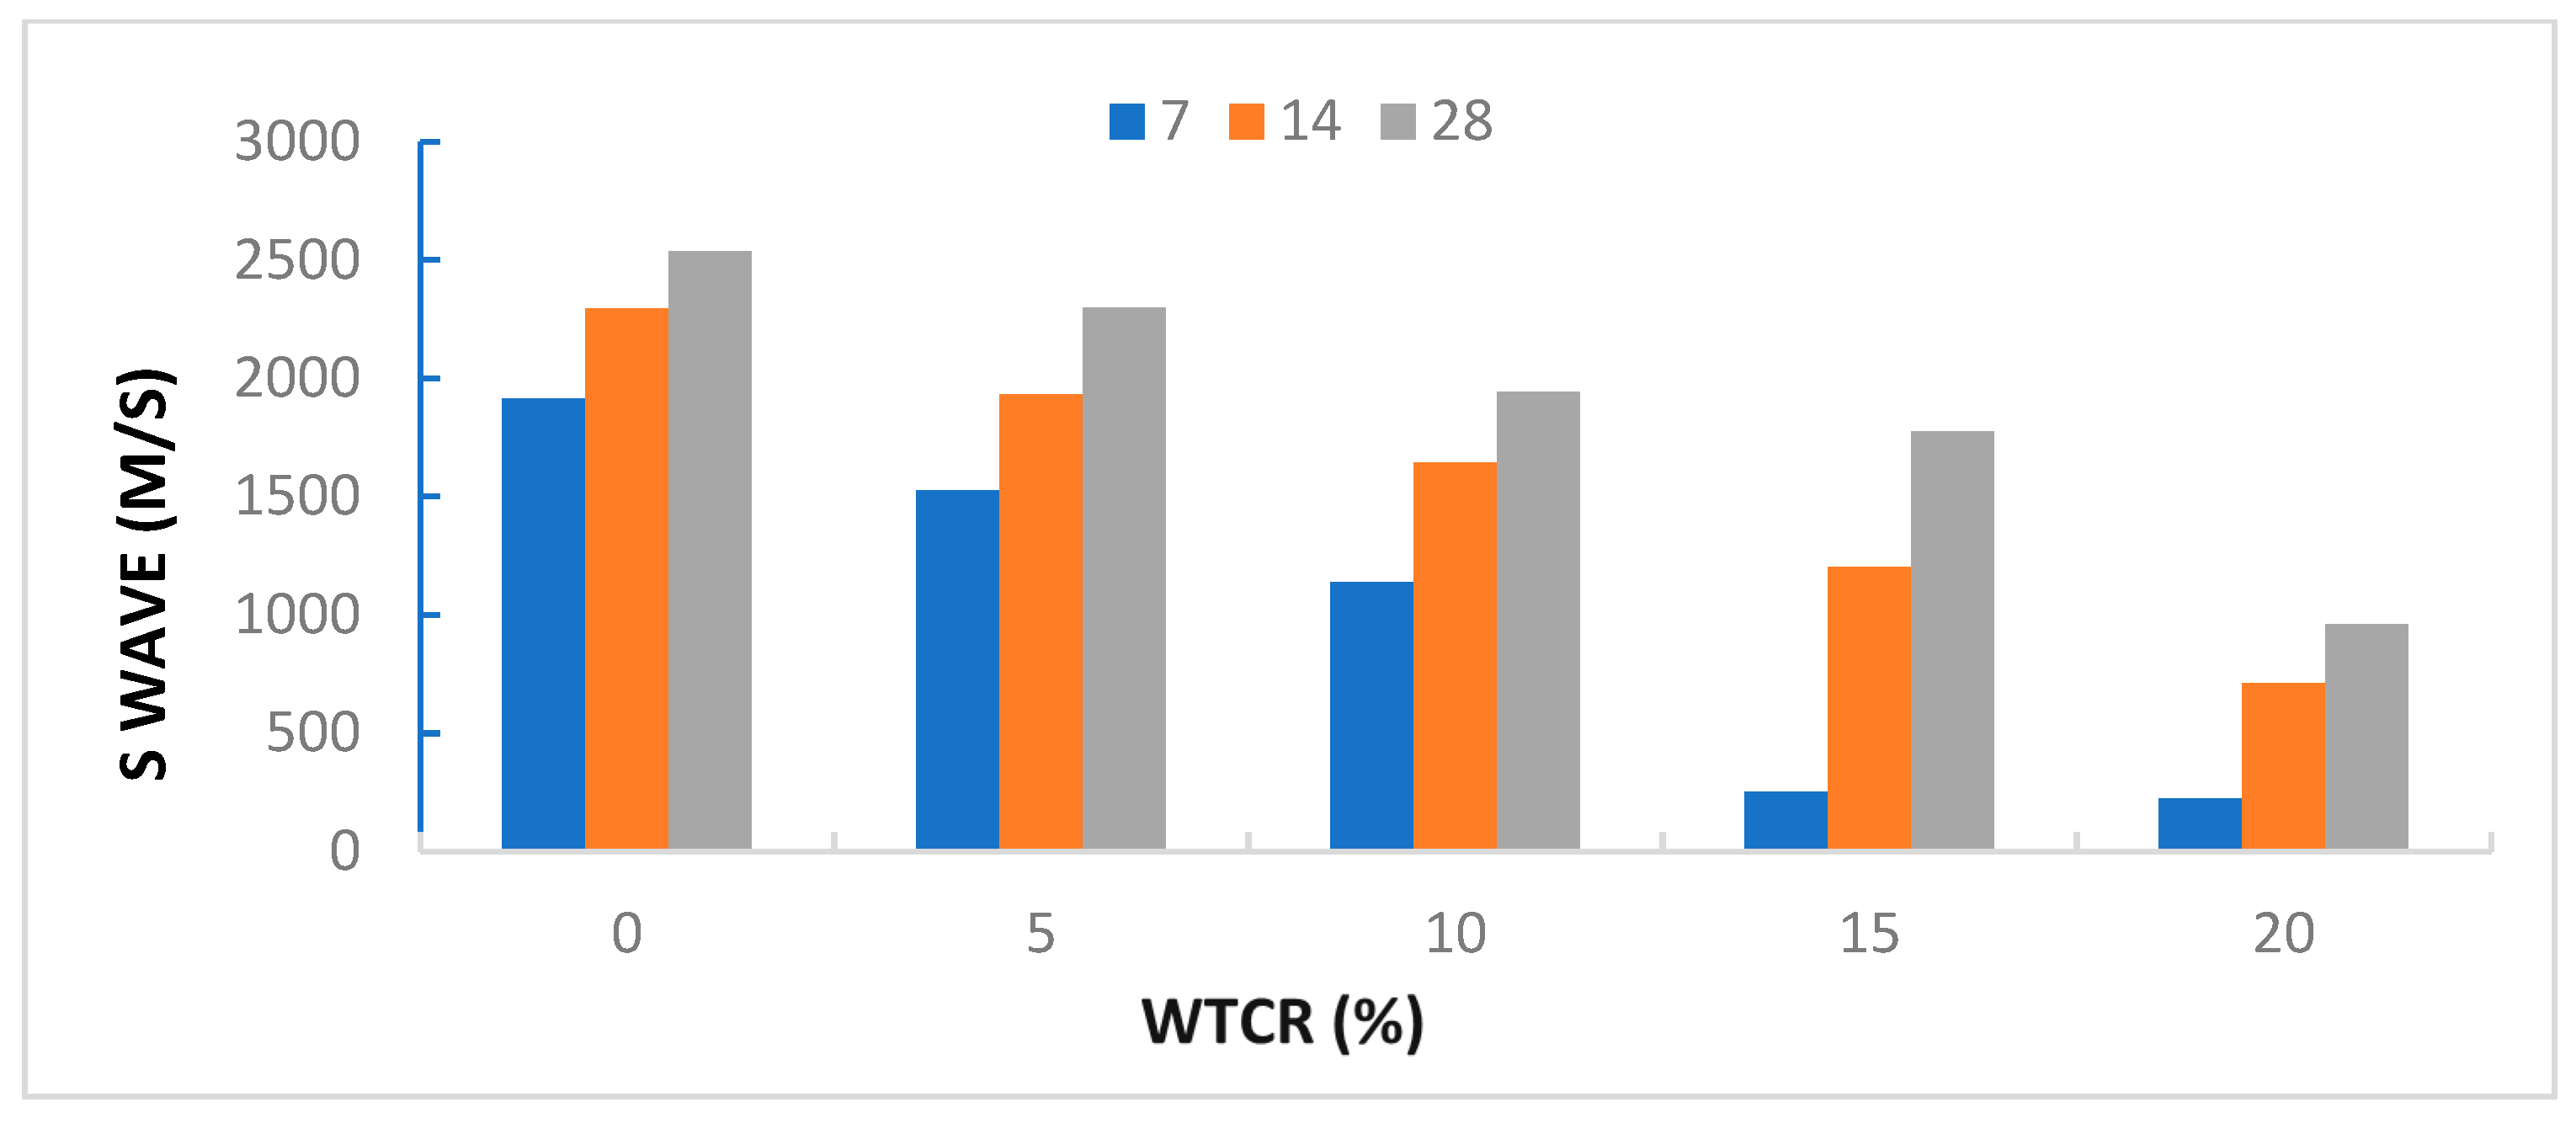
4.1. Ultrasonic Pulse Velocity (UPV) Test

A total of 45 brick samples were prepared using the 70:30 (LKD:GGBFS) blend ratio at varying contents of WTCR, and these were tested using the UPV testing methods, which considered the P and S waves. The results obtained are shown in Figure 11 and Figure 12, respectively. It can be observed that although a similar trend was recorded for both wave types, the samples tested with the P waves had higher velocities when compared to those tested with the S waves. This follows reports from previous research [30], hence, its preference and recommendation [34,35,37,38].

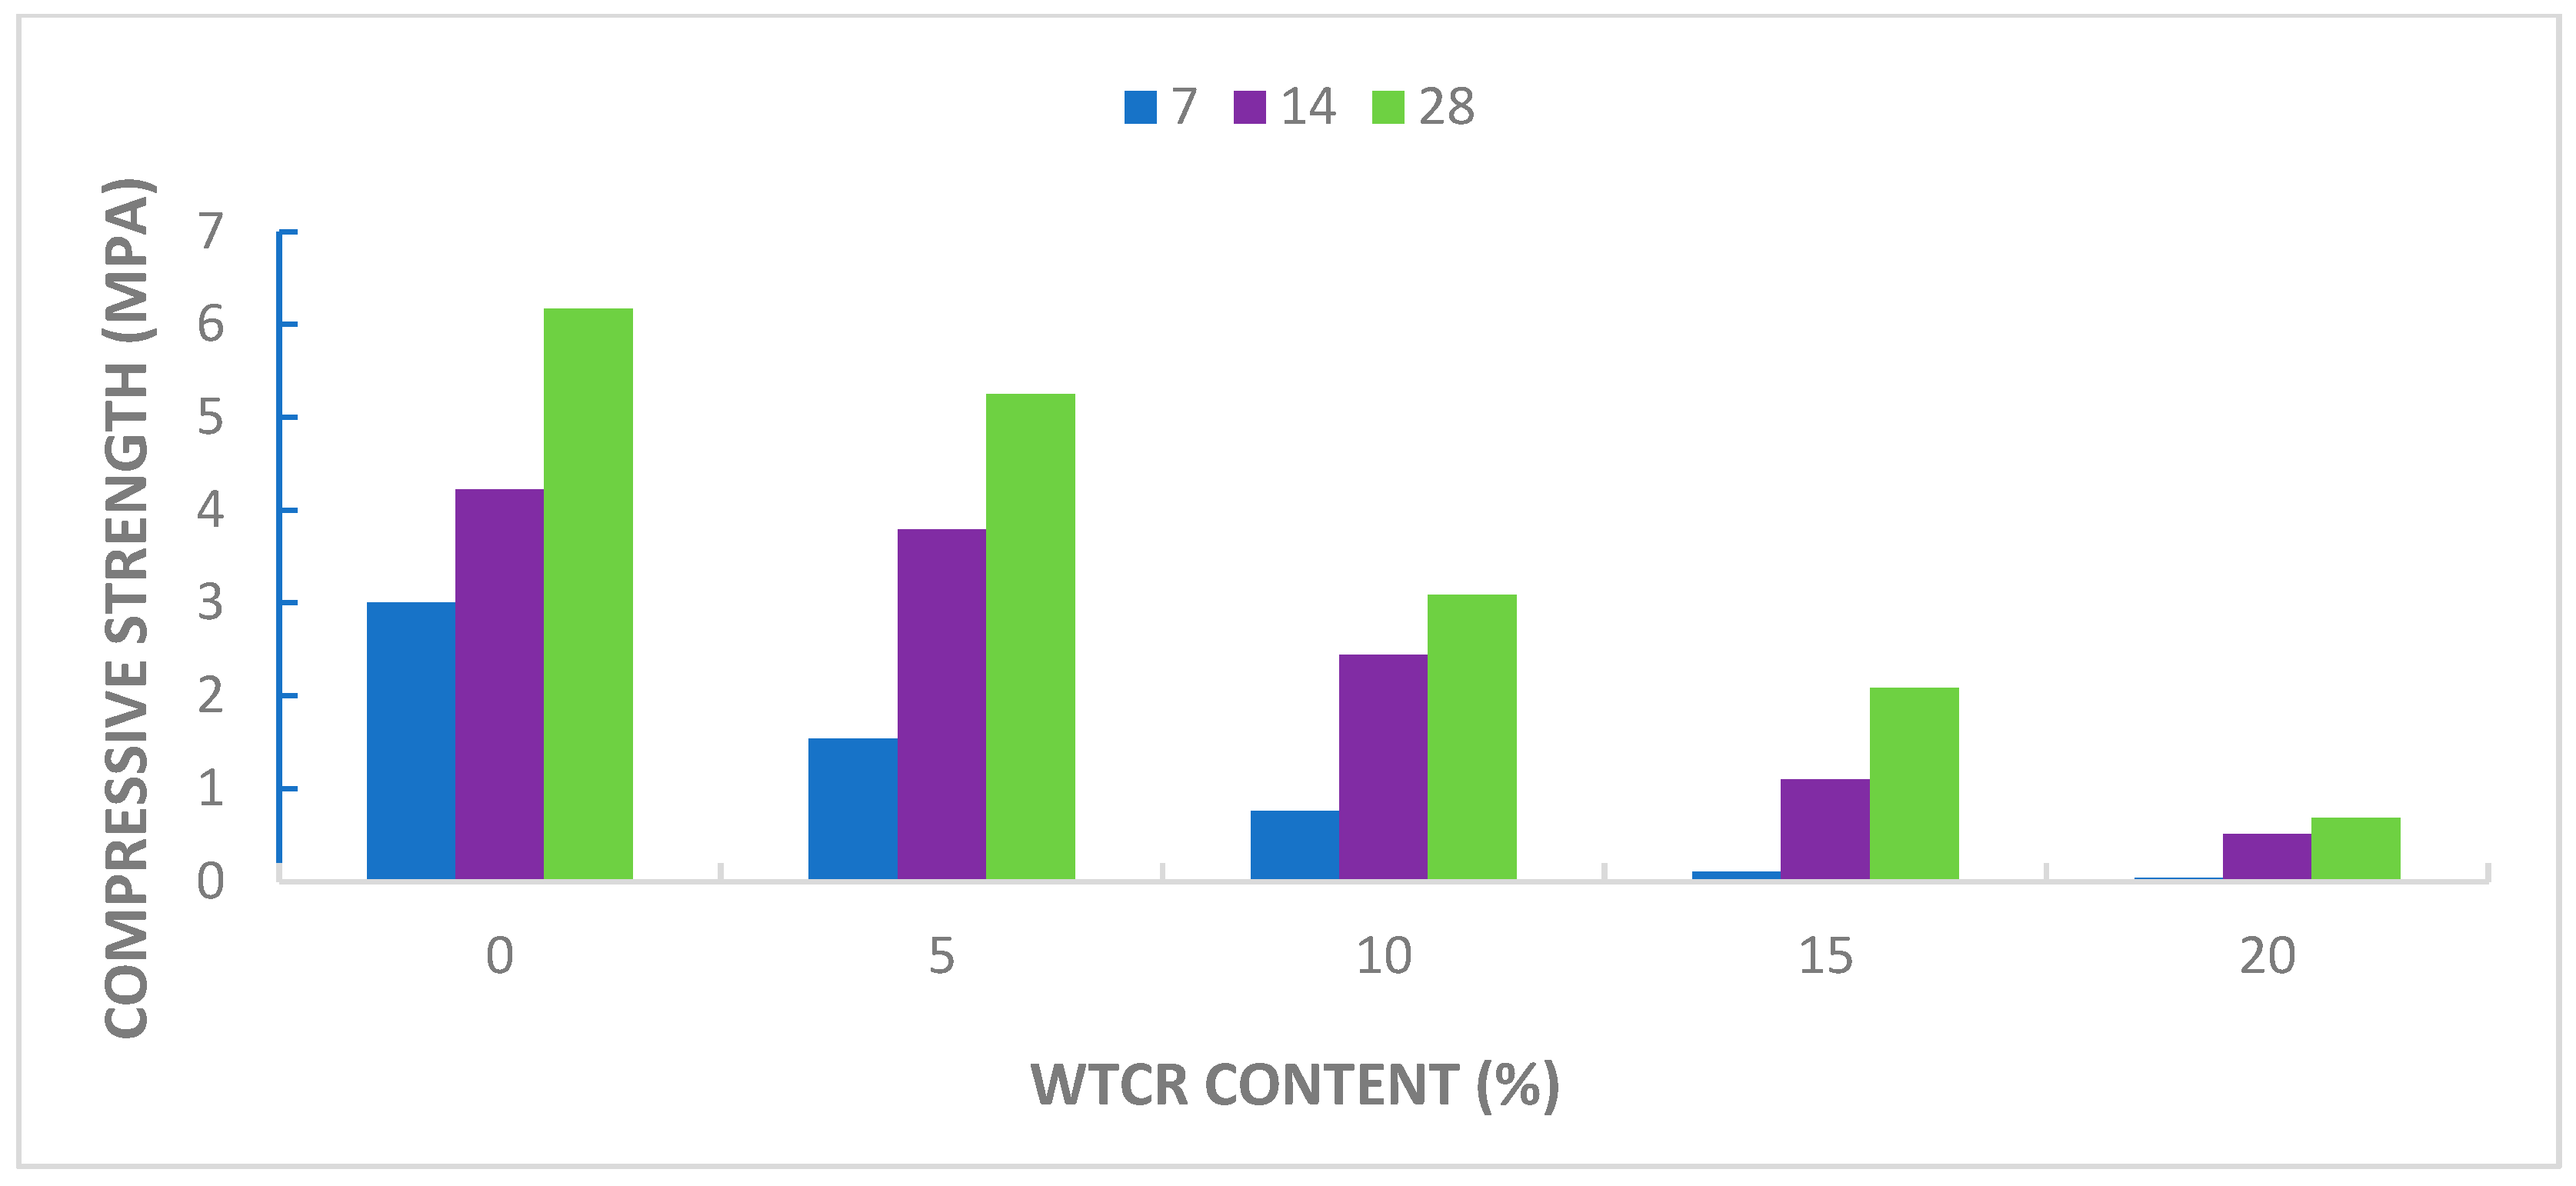
4.2. Compression Strength Test

After the UPV test, the same set of samples were subjected to the compression strength test, and the results are shown in Figure 13.
As shown in Figure 11, Figure 12 and Figure 13, a similar trend was observed for all the samples. The maximum and minimum strengths were recorded for the samples with 0% and 20% WTCR, respectively. The higher the quantity of WTCR in a mix, the lower the wave velocity and the CS [35,38]. Although the wave velocities obtained using the P wave were lower than the recommended 3600 m/s to pass for good concrete bricks produced with OPC [35,38], the bricks produced with up to 5 and 10% WTCR replacement passed for load- and non-load-bearing bricks, respectively, for small buildings [59].

4.3. Comparison of UPV and CS Using Developed Models

Several theoretical models have been used to correlate the compressive strengths with wave velocities [30,37,63,64,65]. However, this correlation can be influenced by factors such as the water-cement/binder ratios, the aggregate type, the cementitious material, the specimen sizes, the curing time, and the method used to test the samples [37]. This study developed linear, exponential, logarithmic, and power models to determine the relationships between the UPV (P and S waves) and the CS of the bricks produced. Furthermore, the respective correlation coefficients (R2) were used to evaluate the level of reliability of the correlations, as summarized in Table 2.
Evaluating the models in Table 2 above, the models associated with the power relationship with correlation coefficients of 0.9604 and 0.9591 for the P and S waves respectively gave the most preferred relationship with acceptable trendline presentations as shown in Figure 14a,b hence, the acceptable models for correlating CS and wave velocity for P and S waves are given in Equations (2) and (3).
fc = 6 × 10⁻⁸Vp2.2933
fc = 2 × 10⁻⁶Vs1.8985
where
  • fc = compressive strength;
  • Vp = wave velocity for P waves;
  • Vs = velocity for S waves.
Table 3 shows the validation of the power models for both the P and S waves. It can be observed that the predicted values associated with the P waves gave closer values to the experimental values when compared to the S wave values. Hence, it can be deduced that the accurate prediction of the CS of the rubberized bricks produced with the LKD-GGBFS blend could be achieved using the P waves.
Validations were also carried out using the models proposed by other studies [26,35,63] that relate UPV (P-wave) to CS. These models were selected because similar research materials utilized in those studies were used in this research. Aliabdo and Elmoaty [26] considered stones, cementless lime sand bricks, and cementless burned bricks respectively and they proposed a general model for all tested samples which is shown in Equation (4) below. Mohammed et al. [35] considered waste tire rubberized concrete and their model for the strength of samples achieved at 28 days is shown in Equation (5) below. Furthermore, Demirboga et al. [63] considered cementless concrete produced with fly ash (FA), blast furnace slag (BFS), and a combination of FA + BFS, all mineral admixtures and their model for all combinations is shown in Equation (6) below.
fc0.25 = 1.233lnV + 0.5689
fcu = 1.7564e0.0008UPV
fc = 0.008e0.002V
Table 4 and Figure 15 below show the CS values obtained from validation exercises carried out using Equations (4)–(6). It can be observed that the values of CS obtained are either higher or lower than the experimental CS obtained in this study. This supports the recommendations made by researchers [35,37,66,67]. They suggest that the validation of proposed models relating to UPV and CS should involve testing samples with different raw materials and conditions. These conditions include aggregate type/size, cementitious material, mix designs, water binder ratio, and duration of curing, which should differ from those used in the highlighted studies [26,35,63].

5. Conclusions

In this study, destructive (compression) and non-destructive testing methods considering UPV (P and S) waves were used to determine the compressive strength of rubberized bricks produced with lime kiln dust waste. From the experiments, analysis, and validations carried out, the following conclusions can be made:
  • The LKD-GGBFS blend is a suitable alternative to OPC that can be used to produce eco-friendly rubberized bricks.
  • WTCR can be replaced by up to 5% of the volume of sand to give a CS value of not less than 5 MPa after a 28-day curing period, as recommended for solid or cored load-bearing masonry units in small buildings [59].
  • WTCR can be replaced by up to 10% of the volume of sand to give a CS value of not less than 3 MPa after a 28-day curing period, as recommended for solid or cored non-load-bearing masonry units in small buildings [59].
  • P waves are recommended for carrying out UPV tests due to their stable and higher velocities, as seen in the results presented in this study.
  • The power model for the P waves gave the most preferred relationship with an acceptable trendline presentation. Hence, it is an acceptable model for correlating the CS value and the wave velocity for rubberized bricks produced with the LKD-GGBFS blend considered in this study.
  • The developed power model can be useful for predicting laboratory crushing test strength values when cast samples are unavailable. However, further investigation is required to verify this model, considering different factors such as the cementitious material, the aggregate type and size, the water-cement/binder ratios, the specimen sizes, and the curing time.

Author Contributions

J.A.O.:—Formal Analysis. J.A.O. and H.A.-N.: Conceptualisation, Methodology, Writing—original draft. H.A.-N.: Supervision, Validation: J.A.O. and H.A.-N.: Writing—review & editing. All authors have read and agreed to the published version of the manuscript.

Funding

This research was funded by Tertiary Education Trust Fund (TETFund) for sponsoring her studies at La Trobe University, Melbourne, Australia.

Data Availability Statement

The data presented in this study are available on request from the corresponding author. The data are not publicly available due to ethical.

Acknowledgments

The first author wishes to acknowledge the Tertiary Education Trust Fund (TETFund) for sponsoring her studies at La Trobe University, Melbourne, Australia. Furthermore, the authors wish to express their keen appreciation to Cement Australia and Sika Australia Pty. Ltd., Melbourne for the free LKD waste, GGBFS, and WRA (Sika Plastiment-45) samples that were donated to support the study.

Conflicts of Interest

The authors hereby declare that they have no conflict of interest.

References

  1. Munier, N. Multicriteria Environmental Assessment; Kluwer Academic Publishers: Dordrecht, The Netherlands, 2004. [Google Scholar]
  2. Loux, N.T.; Su, Y.S.; Hassan, S.M. Issues in assessing environmental exposures to manufactured nanomaterials. Int. J. Environ. Res. Public Health 2011, 8, 3562–3578. [Google Scholar] [CrossRef] [PubMed]
  3. Abbasi, T.; Abbasi, S.A. Water quality indices based on bioassessment: The biotic indices. J. Water Health 2011, 9, 330–348. [Google Scholar] [CrossRef] [PubMed]
  4. Yuan, H. A model for evaluating the social performance of construction waste management. Waste Manag. 2012, 32, 1218–1228. [Google Scholar] [CrossRef] [PubMed]
  5. Intergovernmental Panel on Climate Change (IPCC). Sources of CO2. In Carbon Dioxide Capture and Storage; IPCC: Geneva, Switzerland, 2004; pp. 77–103. [Google Scholar]
  6. World Business Council for Sustainable Development (WBCSD). The Cement Sustainability Initiative—Our Agenda for Action; WBCSD: Geneva, Switzerland, 2002. [Google Scholar]
  7. UNEP. Global Status Report Towards a Zero-Emission, Efficient and Resilient Buildings and Construction Sector; UNEP: Nairobi, Kenya, 2018. [Google Scholar]
  8. Gartner, E. Industrially interesting approaches to ‘low CO2’ cements. Cem. Concr. Res. 2004, 34, 1489–1498. [Google Scholar] [CrossRef]
  9. Hewlett, P.C. (Ed.) Lea’s Chemistry of Cement and Concrete, 4th ed.; Elsevier: Amsterdam, The Netherlands, 1998. [Google Scholar]
  10. World Bank (WB). Construction Industry Value Chain; World Bank: Washington, DC, USA, 2018. [Google Scholar]
  11. Duan, P.; Yan, C.; Zhou, W.; Luo, W.; Shen, C. An investigation of the microstructure and durability of a fluidized bed fly ash–metakaolin geopolymer after heat and acid exposure. Mater. Des. 2015, 74, 125–137. [Google Scholar] [CrossRef]
  12. Mahoutian, M.; Shao, Y. Production of cement-free construction blocks from industry wastes. J. Clean. Prod. 2016, 137, 1339–1346. [Google Scholar] [CrossRef]
  13. Kuo, W.; Wang, H.; Shu, C. Engineering properties of cementless concrete produced from GGBFS and recycled desulfurization slag. Constr. Build. Mater. 2014, 2014, 189–196. [Google Scholar] [CrossRef]
  14. Siddique, R.; Naik, T.R. Properties of concrete containing scrap-tire rubber—An overview. Waste Manag. 2004, 24, 563–569. [Google Scholar] [CrossRef]
  15. Ho, A.C.; Turatsinze, A.; Hameed, R.; Vu, D.C. Effects of rubber aggregates from grinded used tires on the concrete resistance to cracking. J. Clean. Prod. 2012, 23, 209–215. [Google Scholar] [CrossRef]
  16. Issa, C.A.; Salem, G. Utilisation of recycled crumb rubber as fine aggregates in concrete mix design. Constr. Build. Mater. 2013, 42, 48–52. [Google Scholar] [CrossRef]
  17. Zahid Hossain, F.M.; Shahjalal Md Islam, K.; Tiznobaik, M.; Shahria Alam, M. Mechanical properties of recycled aggregate concrete containing crumb rubber and polypropylene fiber. Constr. Build. Mater. 2019, 225, 983–996. [Google Scholar] [CrossRef]
  18. Mohajerani, A.; Burnett, L.; Smith, J.V.; Markovski, S.; Rodwell, G.; Rahman, M.T.; Kurmus, H.; Mirzababaei, M.; Arulrajah, A.; Horpibulsuk, S.; et al. Recycling waste rubber tires in construction materials and associated environmental considerations: A review. Resour. Conserv. Recycling. 2020, 155, 104679. [Google Scholar] [CrossRef]
  19. Thakur, A.; Senthil, K.; Singh, A.P. Experimental investigation on crumb rubber based concrete bricks along with polypropylene and steel fibers. Asian J. Civ. Eng. 2022, 23, 357–374. [Google Scholar] [CrossRef]
  20. Zhang, Z.; Ma, H.; Qian, S. Investigation on properties of ECC incorporating crumb rubber of different sizes. J. Adv. Concr. Technol. 2015, 13, 241–251. [Google Scholar] [CrossRef]
  21. Azevedo FPacheco-Torgal, F.; Jesus, C.; Barroso de Aguiar, J.L.; Camões, A.F. Properties and durability of HPC with tyre rubber wastes. Constr. Build. Mater. 2012, 34, 186–191. [Google Scholar] [CrossRef]
  22. Siddika, A.; Mamun, M.A.A.; Alyousef, R.; Amran, Y.H.M.; Aslani, F.; Alabduljabbar, H. Properties and utilizations of waste tire rubber in concrete: A review. Constr. Build. Mater. 2019, 224, 711–731. [Google Scholar] [CrossRef]
  23. Youssf, O.; Mills, J.E.; Hassanli, R. Assessment of the mechanical performance of crumb rubber concrete. Constr. Build. Mater. 2016, 125, 175–183. [Google Scholar] [CrossRef]
  24. Thomas, B.S.; Gupta, R.C. Long term behaviour of cement concrete containing discarded tire rubber. J. Clean. Prod. 2015, 102, 78–87. [Google Scholar] [CrossRef]
  25. Hoła, A.; Sadowski, L.; Szymanowski, J. Non-destructive testing and analysis of a xix-century brick masonry building. Arch. Civ. Eng. 2020, 66, 201–219. [Google Scholar] [CrossRef]
  26. Aliabdo, A.A.E.; Elmoaty, A.E.M.A. Reliability of using nondestructive tests to estimate compressive strength of building stones and bricks. Alex. Eng. J. 2012, 51, 193–203. [Google Scholar] [CrossRef]
  27. Noor-E-Khuda, S.; Albermani, F. Mechanical properties of clay masonry units: Destructive and ultrasonic testing. Constr. Build. Mater. 2019, 219, 111–120. [Google Scholar] [CrossRef]
  28. Lee, Y.H.; Oh, T. The Measurement of P-, S-, and R-Wave Velocities to Evaluate the Condition of Reinforced and Prestressed Concrete Slabs. Adv. Mater. Sci. Eng. 2016, 2016, 1548215. [Google Scholar] [CrossRef]
  29. Mohammed, B.S.; Abdullahi, M.; Hoong, C.K. Statistical models for concrete containing wood chipping as partial replacement to fine aggregate. Constr. Build. Mater. 2014, 55, 13–19. [Google Scholar] [CrossRef]
  30. Lin, S.; Tang, X.; Li, H.-N.; Gucunski, N.; Wang, Y. Non-destructive Evaluation of Concrete Compressive Strength Using Shear-Horizontal Waves. J. Perform. Constr. Facil. 2023, 37, 06022002. [Google Scholar] [CrossRef]
  31. Noor-E-Khuda, S.; Albermani, F.; Veidt, M. Flexural strength of weathered granites: Influence of freeze and thaw cycles. Constr. Build. Mater. 2017, 156, 891–901. [Google Scholar] [CrossRef]
  32. Mahmutoğlu, Y. Prediction of weathering by thermal degradation of a coarse-grained marble using ultrasonic pulse velocity. Environ. Earth. Sci. 2017, 76, 435. [Google Scholar] [CrossRef]
  33. Cardani, G.; Cantini, L.; Munda, S.; Zanzi, L.; Binda, L. Non invasive measurements of moisture in full-scale stone and brick masonry models after simulated flooding: Effectiveness of GPR. In Nondestructive Testing of Materials and Structures; Springer: Dordrecht, The Netherlands, 2013; pp. 1143–1149. [Google Scholar]
  34. Yilmaz, T.; Ercikdi, B.; Karanam, K.; Külekçi, G. Assessment of strength properties of cemented paste backfill by ultrasonic pulse velocity test. Ultrasonics 2014, 54, 1386–1394. [Google Scholar] [CrossRef]
  35. Mohammed, B.S.; Azmi, N.J.; Abdullahi, M. Evaluation of rubbercrete based on ultrasonic pulse velocity and rebound hammer tests. Constr. Build. Mater. 2011, 25, 1388–1397. [Google Scholar] [CrossRef]
  36. Yaman, I.O.; Inci, G.; Yesiller, N.; Aktan, H.M. Ultrasonic pulse velocity in concrete using direct and indirect transmission. ACI Mater. J. 2001, 98, 450–457. [Google Scholar]
  37. Choi, Y.; Kim, I.-H.; Lim, H.-J.; Cho, C.-G. Investigation of Strength Properties for Concrete Containing Fine-Rubber Particles Using UPV. Materials 2022, 15, 3452. [Google Scholar] [CrossRef]
  38. Marie, I. Zones of weakness of rubberised concrete behavior using the UPV. J. Clean. Prod. 2016, 116, 217–222. [Google Scholar] [CrossRef]
  39. Latif, M.; Naganathan, S.; Razak, H.; Mustapha, K. Performance of lime kiln dust as cementitious material. Procedia Eng. 2015, 125, 780–787. [Google Scholar] [CrossRef]
  40. ASTM C150/C150M-2; Standard Specification for Portland Cement. ASTM: West Conshohocken, PL, USA, 2021.
  41. Arulrajah, A.; Mohammadinia, A.; D’Amico, A.; Horpibulsuk, S. Effect of lime kiln dust as an alternative binder in the stabilisation of construction and demolition materials. Constr. Build. Mater. 2017, 152, 999–1007. [Google Scholar] [CrossRef]
  42. Kakrasul, J.; Parsons, R.; Han, P. Lime Kiln Dust for Treated Subgrades; The University of Kansas: Lawrence, KS, USA, 2017. [Google Scholar]
  43. Bediako, M.; Amankwah, E.O. Analysis of Chemical Composition of Portland Cement in Ghana: A Key to Understand the Behavior of Cement. Hindawi Publ. Corp. Adv. Mater. Sci. Eng. 2015, 2015, 349401. [Google Scholar] [CrossRef]
  44. AS 1141.11.1; Methods for Sampling and Testing Aggregates. Standards Australia: Sydney, NSW, Australia, 2020.
  45. ASTM C33/C33M; Standard Specifications for Concrete Aggregates. ASTM: West Conshohocken, PL, USA, 2013.
  46. Frasson, A., Jr.; Casali, J.M.; Olivera, A.L.; Prudêncio, L.R., Jr. A Mix Design Methodology for Concrete Block Units. In Proceedings of the 15th International Brick and Block Masonry Conference, Florianópolis, Brazil, 3–6 June 2012. [Google Scholar]
  47. Guo, S.; Dai, Q.; Si, R.; Sun, X.; Lu, C. Evaluation of properties and performance of rubber-modified concrete for recycling of waste scrap tire. J. Clean. Prod. 2017, 14, 681–689. [Google Scholar] [CrossRef]
  48. Najim, K.B.; Hall, M.R. Mechanical and dynamic properties of self-compacting crumb rubber modified concrete. Constr. Build. Mater. 2012, 27, 521–530. [Google Scholar] [CrossRef]
  49. Strukar, K.; Kalman, T.K.; Miličević, I.; Bušić, R. Potential use of rubber as aggregate in structural reinforced concrete element1A review. Eng. Struct. 2019, 188, 452–468. [Google Scholar] [CrossRef]
  50. Hesami, S.; Hikouei, I.S.; Emadi, S.A.A. Mechanical behavior of self-compacting concrete pavements incorporating recycled tire rubber crumb and reinforced with polypropylene fiber. J. Clean. Prod. 2016, 133, 228–234. [Google Scholar] [CrossRef]
  51. Shu, X.; Huang, B. Recycling of waste tire rubber in asphalt and portland cement concrete: An overview. Constr. Build. Mater. 2014, 67, 217–224. [Google Scholar] [CrossRef]
  52. Shen, W.; Shan, L.; Zhang, T.; Ma, H.; Cai, Z.; Shi, H. Investigation on polymer-rubber aggregate modified porous concrete. Constr. Build. Mater. 2013, 38, 667–674. [Google Scholar] [CrossRef]
  53. Segre, N.; Joekes, I. Use of tire rubber particles as addition to cement paste. Cem. Concr. Res. 2000, 30, 1421–1425. [Google Scholar] [CrossRef]
  54. Tian, S.; Zhang, T.; Li, Y. Research on modifier and modified process for rubber-particle used in rubberised concrete for road. Adv. Mater. Res. 2011, 243, 4125–4130. [Google Scholar] [CrossRef]
  55. Mohammadi, I.; Khabbaz, H.; Vessalas, K. Enhancing mechanical performance of rubberised concrete pavements with sodium hydroxide treatment. Mater. Struct. 2016, 49, 813–827. [Google Scholar] [CrossRef]
  56. Niş, A.; Eren, N.A.; Çevik, A. Effects of recycled tyre rubber and steel fibre on the impact resistance of slag-based self-compacting alkali-activated concrete. Eur. J. Environ. Civ. Eng. 2023, 27, 519–537. [Google Scholar] [CrossRef]
  57. Priyadharshini, M.; Naveen Kumar, M. Experimental Study on Crumb Rubber with Partial Replacement of Fine Aggregate. Int. Res. J. Eng. Technol. 2018, 5, 4584–4590. [Google Scholar]
  58. AS 3700; Masonry Structures. Standards Australia: Sydney, NSW, Australia, 2018.
  59. AS 4773.2; Masonry in Small Buildings Construction. Standards Australia: Sydney, NSW, Australia, 2015.
  60. ASTM C1383-04; Standard Test Method for Measuring the P-Wave Speed and the Thickness of Concrete Plates Using the Impact-Echo Method. ASTM: West Conshohocken, PL, USA, 2009.
  61. AS 1012.9; Methods of Testing Concrete. Compressive Strength Test-Concrete, Mortar and Grout Specimens. Standards Australia: Sydney, NSW, Australia, 2014.
  62. AS/NZS 4456.4; Masonry Units, Segmental Pavers and Flags—Methods of Test, Method 4: Determining Compressive Strength of Masonry Units. Standards Australia: Sydney, NSW, Australia, 2003.
  63. Demirboğa, R.; Türkmen, İ.; Karakoç, M.B. Relationship between ultrasonic velocity and compressive strength for high-volume mineral-admixtured concrete. Cem. Concr. Res. 2004, 34, 2329–2336. [Google Scholar] [CrossRef]
  64. Sabbağ, N.; Uyanık, O. Prediction of reinforced concrete strength by ultrasonic velocities. J. Appl. Geophys. 2017, 141, 13–23. [Google Scholar] [CrossRef]
  65. Yang, S.; Zhu, H.; Xu, Z. Prediction of compressive strength of concrete using double-shear testing method. J. Mater. Civ. Eng. 2021, 33, 04020423. [Google Scholar] [CrossRef]
  66. Neville, A.M. Properties of Concrete, 3rd ed.; Longman: Singapore, 1995. [Google Scholar]
  67. Tharmaratnam, K.; Tan, B.S. Attenuation of ultrasonic pulse in cement mortar. Cem. Concr. Res. 1990, 20, 335–345. [Google Scholar] [CrossRef]
Figure 1. LKD Sample.
Geotechnics 03 00070 g001
Figure 2. GGBFS Sample.
Geotechnics 03 00070 g002
Figure 3. WTCR sample.
Geotechnics 03 00070 g003
Figure 4. (a) Treatment at 0 h and (b) treatment after 24 h of WTCR using 10% NaOH solution.
Geotechnics 03 00070 g004
Figure 5. Gradation curve of sand and fine WTCR.
Geotechnics 03 00070 g005
Figure 6. Brick samples in formworks.
Geotechnics 03 00070 g006
Figure 7. Wrapped samples cured in a controlled environment.
Geotechnics 03 00070 g007
Figure 8. (a,b) Measurement of P-wave velocity.
Geotechnics 03 00070 g008
Figure 9. (a,b) Measurement of S-wave velocity.
Geotechnics 03 00070 g009
Figure 10. (a) Sample before crushing. (b) Sample after crushing.
Geotechnics 03 00070 g010
Figure 11. Effect of amount of WTCR on 7-, 14-, and 28-days strength (P wave test).
Geotechnics 03 00070 g011
Figure 12. Effect of amount of WTCR on 7-, 14-, and 28-days strength (S wave test).
Geotechnics 03 00070 g012
Figure 13. Effect of amount of WTCR on 7-, 14-, and 28-days strength (compression test).
Geotechnics 03 00070 g013
Figure 14. (a) A power relationship between P wave and compressive strength. (b) A power relationship between S wave and compressive strength.
Geotechnics 03 00070 g014
Figure 15. Plots showing validation of models proposed by Mohammed et al. [35], Demirboga et al. [63], and Aliabdo & Elmoaty [26].
Geotechnics 03 00070 g015
Table 1. Mix proportion and strength of different blend ratios.
SCM:Fine Aggregate RatioSCM Blend Ratio (%)
(LKD:GGBFS)
MaterialsCS (MPa)
LKD:GGBFS (g) Sand (g)
1:390:101620:18054001.67
1:380:201440:36054003.69
1:370:301260:54054006.17
1:360:401080:720540010.49
1:350:50900:90054008.71
1:340:60720:1080540011.94
1:330:70540:1260540012.04
Table 2. Summary of models developed and their corresponding correlation coefficients.
Mathematical CorrelationP WaveS Wave
Correlation CoefficientModelCorrelation CoefficientModel
LinearR2 = 0.9162fc = 0.0021V − 1.517R² = 0.8654fc = 0.0025V − 1.3399
ExponentialR2 = 0.7702fc = 0.0751e0.0015VR² = 0.9122fc = 0.0734e0.0019V
LogarithmicR2 = 0.7332fc = 2.6107ln(V) − 16.944R² = 0.6206fc = 1.9959ln(V) − 11.886
PowerR2 = 0.9604fc = 6 × 10⁻⁸V2.2933R² = 0.9591fc = 2 × 10⁻⁶V1.8985
Table 3. Validation of proposed power model and experimental compressive strengths.
Experimental CS (MPa) from CompressionP Wave Predicted CS (MPa) Using Power Model S Wave Predicted CS (MPa) Using Power Model
3.232.6163.408
1.541.6342.217
0.760.7301.267
0.10.1200.072
0.040.0530.059
4.224.5074.810
3.793.7763.461
2.442.5912.553
1.11.2731.406
0.510.3240.518
6.177.5985.813
5.254.7624.819
3.093.7723.504
2.082.5632.945
0.680.6230.919
Table 4. Validation of models from the literature and experimental compressive strengths.
P Wave (m/s)CS (Demirboga et al. [63])CS (Mohammed et al. [35])CS (Aliabdo and Elmoaty [26])Experimental CS (MPa) from Compression
21440.5839.7621.7793.23
17460.2637.011.7651.54
12290.0934.6951.7450.76
5600.0252.7491.7010.1
3910.0171.8121.6780.04
27181.83615.4511.7924.22
25161.22613.1451.7883.79
21350.5729.6921.782.44
15660.1836.1481.7621.1
8620.0453.51.7270.51
34137.37226.9411.8046.17
27842.09516.2891.7945.25
25151.22313.1351.7883.09
21250.5619.6141.7792.08
11470.0794.3971.7440.68
Disclaimer/Publisher’s Note: The statements, opinions and data contained in all publications are solely those of the individual author(s) and contributor(s) and not of MDPI and/or the editor(s). MDPI and/or the editor(s) disclaim responsibility for any injury to people or property resulting from any ideas, methods, instructions or products referred to in the content.

