

Innovation Pattern Heterogeneity and Crisis Resilience

1
SSB—Statistics Norway, Postboks 2633 St. Hanshaugen, NO-0131 Oslo, Norway
2
NIFU—Nordic Institute for Studies in Innovation, Research and Education, Postboks 2815 Tøyen, NO-0608 Oslo, Norway
*
Author to whom correspondence should be addressed.
Businesses 2023, 3(2), 323-346; https://doi.org/10.3390/businesses3020021
Submission received: 29 March 2023
/
Revised: 28 April 2023
/
Accepted: 26 May 2023
/
Published: 31 May 2023
(This article belongs to the Special Issue Crisis Management and Innovations Challenges)
Abstract
:We use the new taxonomy for innovative firms developed based on microlevel data from the Community Innovation Survey (CIS2018) on a sample of 6360 Norwegian firms, and information on users of COVID-19-related compensation schemes for firms with significant loss of turnover and furloughed employees to analyse how resilient different innovative firms have been to the crisis (in both the short and the long run). By using different probabilistic regression models, we study the probability of firms being affected negatively during the pandemic period between March 2020 and February 2022 covering three waves of societal restrictions in Norway. Our main assumption is that all firms were hit by a shock at an early stage due to a complete lockdown in March 2020, but that firms were more resilient if they either did not use the compensation schemes or used them for a briefer period than the less resilient firms. We find “active R&D doers” to be most resilient, while “strategic adapters” (firms with a main strategy of producing high-quality products for a specific group of customers) are found to be least resilient. These results imply that pre-existing innovation capabilities are important for meeting the crisis.
1. Introduction
Innovation and R&D investment are linked to superior growth for companies. R&D, and in particular private-sector R&D, is a central part of productivity growth in Western economies [1,2,3]. The private economic return on R&D investment has long proved to exceed that on ordinary capital [4], and the conclusion has been recognised across various mainstream economy theories—whether neoclassical, endogenous or evolutionary [5]. The empirical literature on innovation and productivity also concludes that innovation leads to higher productivity in terms of higher revenue per employee performance [6]. Hence, R&D and innovation play a vital role in economic development and growth.
However, what happens in times of crisis? Are the concepts of firms’ innovative capabilities and crisis resilience related? On the one hand, we might expect firms with high innovation capacity to be more resilient to crises. Given their innovative and agile nature, they might be expected to have quick strategic responses that typically imply adopting new technologies and innovative business procedures [7,8]. Organisations with the ability to adapt to and recover quickly from sudden events beyond their control, for example, shocks such as the COVID-19 pandemic or the 2008 financial crisis, are almost by definition resilient. On the other hand, economic turmoil and crisis change the environment that companies navigate in, causing increased uncertainty and risk. A natural reaction will be then to downscale production, lay off employees and cancel investments, especially risky investments [9]. There is uncertainty associated with innovation activities, but the extent to which innovative firms expose themselves to uncertainty varies depending not only on the amount of resources they spend on innovation, but also on their approach to innovation. Thus, it is not self-evident which innovative firms are more likely to be resilient to such crises.
For answering this question, we need to address some measurement issues first. It may not be simple to capture innovative behaviour empirically merely by applying the terms “product” and “process” innovation as defined in the Oslo manual for statistical purposes [10] (However, given the availability of harmonized international data that are based on Oslo manual definitions for innovation, there are many empirical studies that are using these definitions, some of which are also for exploring innovation and crisis resilience [11].) Innovation activities may also involve passive knowledge acquisition or adoption of new technology. Using factor analysis and community innovation survey data covering the period 2016–2018, Capasso and Rybalka [12] identify 11 distinct (but not mutually exclusive) innovation patterns that were most common among Norwegian firms prior to the COVID-19 pandemic. The 11 innovation patterns are based on R&D and innovation inputs and outputs at firm level. This includes information on formal R&D activities, investment in R&D and innovation, funding for innovation activities, types of innovation, innovation strategies, co-creation of innovation and with whom, use of IPR and factors hampering decisions to start innovation activities (see Appendix A for a description of the patterns). Our main research objective is to apply this new taxonomy that treats innovation as a multifaceted concept and to explore how firms with different approaches to innovation behaved during the pandemic, i.e., which of them were the most resilient and which were the least.
How to measure firm resilience is the next measurement issue. Fundamentally, the concept of resilience is closely related with the ability of an element or system to return to a stable state after a disruption [13]. Although there is growing recognition of the concept of organisational resilience within academic publications, the concept and features of organisational resilience had remained largely undefined and ambiguous [14]. Burnard and Bhamra [14] developed a conceptual framework of a resilient organisational response and introduced the following working definition for organisational resilience upon which future empirical studies could be based:
“Resilience is the emergent property of organisational systems that relates to the inherent and adaptive qualities and capabilities that enable an organisations adaptive capacity during turbulent periods. The mechanisms of organisational resilience thereby strive to improve an organisation’s situational awareness, reduce organisational vulnerabilities to systemic risk environments and restore efficacy following the events of a disruption”[14] (p. 5587).
The pandemic and the subsequent lockdown in spring 2020 provide us with the exogenous shock, which allows us to conduct almost a real-time experiment. As an indicator of how resilient different innovative firms have been to the COVID-19 crisis, we use unique data that allow us to identify month by month firms with a pronounced loss of turnover from March 2020 to February 2022 (The first infection control measures were implemented in Norway on 13 March 2020. After several periods with either escalation or lightening of the infection control measures, the economy was completely re-opened from 12 February 2022. To identify firms with a pronounced loss of turnover, their activity each month during the pandemic was compared to their activity in the corresponding month before the pandemic started, i.e., in 2019.) During the crisis, the Norwegian government launched different measures to help firms through the turmoil of the pandemic. One of these measures was the Business Compensation Scheme, which covered unavoidable operating costs in cases of pronounced loss of turnover due to the pandemic. Another one was the Salary Compensation Scheme, which provided wage compensation to firms that kept employees at work instead of laying them off (furloughing them), again, in the case of lost turnover due to the pandemic. The firms that did not use the compensation schemes are assumed to be more resilient to the crisis than the firms that used these schemes. Conversely, those of the firms that used the compensation schemes longest are assumed to have been least resilient to the crisis in the long run. By applying this assumption, we determine which innovative firms suffered long-term negative effects from the crisis as opposed to those that were affected in the beginning of the pandemic and recovered shortly afterwards. In addition, we use data on furloughing due to COVID-19 that are available for March–August 2020 to analyse which firms furloughed their employees in addition to suffering a pronounced loss of turnover, and thus were hit especially hard by the lockdown.
It is worth noting that there is no single measure of crisis resilience that is universally accepted, and different measures may be more or less appropriate depending on the context. Crisis resilience in the context of an economic crisis refers to the ability of organisations (or individuals, or communities) to withstand, adapt to, and recover from the negative impacts of economic shocks. In this context, our measure of resilience reflects both the ability to withstand in the short run (by keeping business going on) and recover from the negative impacts in the long run (by exiting from using the compensation schemes). However, our measure of resilience does not say anything directly on ability to adapt to the changed environment. To shed the light on this issue, one need to collect more qualitative information through, e.g., an additional survey, which is out of the scope of this study. Irrespective of this limitation, by addressing the issue of measurement of organisational resilience to the crisis, we believe that our study contributes to better understanding what makes firms stronger and more prepared for future challenges.
The existing literature shows that a profound crisis, such as the COVID-19 pandemic, affects the environment in which firms navigate. A crisis may also change innovation patterns. For example, the financial crisis in the late 2000s changed the landscape and identikit of innovators, from firms exploiting pre-existing capabilities, engaging in formal R&D and being well established, to firms that were smaller, younger, not dependent on pre-existing capabilities and which exploited new opportunities and new markets [15]. On the other hand, it is argued that pre-existing capabilities, implying high innovation intensity and previous introduction of several types of innovation, learning ability and building dynamic capabilities [15,16,17,18,19] are important factors enabling companies to be resilient and/or agile in terms of innovation activities in response to crises. However, none of the existing studies to our knowledge have explored how the variety in the pre-crisis innovation strategies affects firm resilience.
We use the new taxonomy of Capasso and Rybalka [12], microlevel data from Community Innovation Survey (CIS2018) on a sample of 6360 Norwegian firms and information on users of COVID-19-related compensation schemes for firms with a significant loss of turnover and furloughed employees to analyse how resilient different innovative firms have been to the crisis (in both the short and the long run). By using different probabilistic regression models (probit, bivariate probit and duration model), we study the probability of firms being affected negatively by the crisis (causing them to use compensation schemes or furlough employees) in the period as a whole and in different sub-periods between March 2020 and February 2022 (a period covering three waves of societal restrictions in Norway due to the pandemic). Our research adds to the scarce empirical literature regarding innovation and economic crisis, shedding light on the extent to which innovation capabilities contribute to making firms more resilient to profound crisis.
We find “active R&D doers” to be most resilient to the crisis (in both the short and the long run), while “strategic adapters” (firms with a main strategy of producing high-quality products for specific groups of customers) are found to be least resilient. These results indicate that firms with higher innovation capacity, in terms of formal R&D activity on a regular basis and frequent collaboration on R&D and innovation with others, were more resilient to the crisis, while the group appearing to be less resilient to the crisis clearly had a lower level of innovation capacity. In this respect, our results are supporting anticipation of Archibugi and Filippetti [15], who suggest that pre-existing capabilities are important factors enabling companies to be resilient in terms of innovation activities in response to crises.
Our paper is structured as follows: Section 2 provides a conceptual frame based on previous literature on heterogeneity with respect to economic crises, how innovative companies respond to crises and how they change their innovative behaviour. We base our research questions on this evidence. In Section 3, we present the data and the empirical strategy for the study. Section 4 presents the estimation results. Finally, Section 5 draws conclusions and discusses future research.
2. Literature Overview
A profound crisis fundamentally changes the environment in which companies navigate. The exogenous shock to the economy affects both the demand and the supply side, creating increased uncertainty for companies. The COVID-19 pandemic led to a significant drop in economic activity and thus in demand. The IMF forecast for 2020 was that the global economy would contract by 3 percent [20]. This is much worse than the 2008–2009 financial crisis, also known as the Great Recession, when the global economy was estimated to shrink by 0.1 percent in the year 2009.
The nature of crises differs to some extent. The Great Recession hit the financial side of the economy, which is important for risky projects such as innovation activities. Providing financial resources is necessary to enable entrepreneurs to establish new companies and invest in innovative activities [21,22]. A lack of venture capital increases the cost of capital for smaller companies, start-ups and companies in R&D-intensive industries [4]. A higher cost of capital often leads to a downturn in innovation activities.
The Great Lockdown caused by the COVID-19 pandemic in turn affected the ability of people to go to work. Innovation teams were not able to meet, human interaction was hampered and reduced to Zoom, Skype or Teams meetings. The lockdown also hit production and transportation, obviously affecting national and global value chains. Production was halted due to a lack of foreign inputs. When a shock hits one link in a value chain, the impact is transmitted and amplified through global value chains [23,24].
The Great Recession and Great Lockdown are profound economic crises that caused major changes in industries and technologies, naturally increasing the level of uncertainty for companies. The increased uncertainty affects the strategic decisions and innovative behaviour of firms. During the Great Lockdown Thorgren and Williams [9] empirically studied how Swedish SMEs reacted to the recession following the outbreak of COVID-19. They found how SMEs acted immediately by deferring investment, reducing labour costs, reducing expenses, and negotiating contracts and terms. Moreover, the data highlight how SMEs in an unfolding crisis are reluctant to commit to any action that will increase their debt-to-equity ratio. Hermundsdottir et al. [25] show how COVID-19 negatively impacted a certain kind of innovation, namely, environmental innovation, and that the negative effects of COVID-19 impact the most environmentally innovative or greener companies.
Archibugi and Filippetti [15] find changes in innovative behaviour during the Great Recession. Prior to the Recession, 38 percent of respondents increased their innovation-related investment, while 42 percent maintained it at the same level. During the crisis, however, only 9 percent increased their innovation-related investment and 57 percent maintained it at the same level. Thus, there was a significant downturn in overall innovation activity, but those 9 percent of the respondents that actually continued to increase their innovation activities saw opportunities in the crisis. This is in line with the literature that argues that crises represent opportunities to gain market share and to enter new markets [21,26,27,28].
This in turn leads to the question of whether specific features of innovative firms are more conducive to innovation during a crisis, thereby making them more resilient to crises. What are the characteristics of companies that are more resilient to crises? With a basis in the work of Schumpeter [29,30], further developed by Freeman et al. [31], Dosi [26], Pavitt [32] and Malerba and Orsenigo [33], Archibugi and Filippetti [15] argue that there are differences in the landscapes of innovative firms during crises and between crises. Between crises, the landscape is dominated by “creative accumulation”. Creative accumulation is distinguished by large incumbents exploiting pre-existing capabilities and accumulated knowledge. Formal R&D is important, and the innovation process is dominated by incremental innovation. Markets have high entry barriers due to the importance of accumulated knowledge, and technological advancement is based on path-dependent and cumulative technological trajectories, also reflected in the incremental innovation. During crises, the landscapes change character: small firms and new entrants are the drivers of innovation. There is a focus on path-breaking innovations, and with low barriers to entry into new industries, there is a high rate of entry and exits leading to a lower level of market concentration and strong competition.
The results of Archibugi and Filippetti [15], who empirically tested the above hypothesis on data from the European Commission’s Innobarometer Survey [34], are somewhat ambiguous regarding the hypothesis that in times of crisis the innovative landscape is dominated by creative destruction and between crises it is dominated by creative accumulation. On the one hand, they find evidence for creative destruction rather than creative accumulation during crises, implying that new entrants and smaller companies that are driving path-breaking innovation do better during recessions, while incumbents utilising pre-existing capabilities and high levels of path-dependency do better in times of more stable economic growth. On the other hand, they argue that pre-existing capabilities, implying high innovation intensity and previous introduction of several types of innovation, are important factors enabling companies to be resilient and/or agile in terms of innovation activities in response to crises.
Other theoretical approaches provide potential explanations as to whether innovation activities and level of innovation activities affects resilience to crisis. Organisational learning theory emphasize the importance of absorptive capacity affecting the ability to be more resilient in turbulent times [16,35]. Further, the resource-based view emphasizes the importance of non-imitable and scarce resources as key to sustainable competitive advantages [36]. In times of crisis, firms investing in hard-to-imitate and scarce resources through R&D investments achieved much higher profits [17]. A third approach is the evolutionary theory of technological change where persistent innovation and development of dynamic capabilities are highlighted as key characteristics of technical advancement and superior performance at company level [18,37,38,39]. Most recently, Weaven et. al. [19] argues that dynamic capabilities helped Australian SMEs facing the turbulence of the COVID-19 crisis. Thus, the learning ability, building capacity, being a persistent innovator, building dynamic capabilities and investing in hard-to-imitate resources can be important means to be resilient to crisis.
To better support firms in times of crisis, policymakers need to understand which companies suffer during crises. From the literature, we find that crises can be heterogeneous in nature, so that firms are affected unevenly. The individual firm may also respond differently to crises: some reduce their exposure to risk by cancelling activities and investment, whereas others exploit the uncertain times by increasing their investment in innovations.
The heterogeneity with respect to how innovative companies respond to a crisis does not seem to be captured by sectoral divisions, firm size or by distinguishing between systematic and sporadic innovators. Moreover, innovativeness may be not as easy to capture empirically by applying the terms “product” and “process” innovation as defined in the Oslo manual for statistical purposes [10]. Hence, more studies that take into account variety in approaches to innovation are needed.
Taking a step back and pursuing more broadly an understanding of the dynamics of innovation leads to the conclusion that product-based classifications of sectors, such as the NACE, are inadequate. This has led to attempts to develop new taxonomies that better capture the heterogeneity of innovative companies; see [32,40,41,42]. Based on the work by Leiponen and Drejer [42], Capasso and Rybalka [12] developed a more fine-grained taxonomy of Norwegian innovative companies. By using factor analysis, they identify eleven “typical” approaches to innovation, in terms of both innovation inputs and outputs and how innovation is conducted. The results identify commonalities in innovation behaviour regardless of sector and geographical location. The eleven different approaches to innovation are presented in Appendix A.
The more fine-grained taxonomy of innovative Norwegian firms provides a novel way of identifying and categorising typical approaches to innovation. It may be further used to provide new insights into the characteristics of innovative Norwegian firms that proved to be resilient to the crisis as well as those that were less resilient.
3. Data Sources and Descriptive Statistics
3.1. Data Sources
To determine what types of innovative firms were most or least resilient to the COVID-19 crisis, we use Norwegian microdata on the firms included in the 2018 Community Innovation Survey (CIS2018). CIS data are collected by Statistics Norway and contain detailed information on firms’ innovation activities, including expenditures, divided into intramural R&D, extramural R&D services and expenditures on other aspects of innovation activities. They also contain information on firms’ strategies, on whether a firm introduced a new product or a process innovation (the definitions of these types of innovation comply with the recommendations of the Oslo manual (OECD, 2018)), whether it cooperated with other firms/institutions in its innovation activities, and whether it applied for a patent and/or other IPR in the three-year period prior to the survey (2016–2018 for CIS2018). The survey sample is selected using a stratified method for firms with 5–49 employees, while all firms with 50 or more employees are included. The strata are based on industry classification (NACE codes) and firm size. CIS2018 contains information on 6360 firms.
Based on questions from CIS2018, Capasso and Rybalka [12] constructed a set of indicators that covered various firm innovation activities and other relevant activities in firms. They also used an exploratory factor analysis to investigate which of the indicators are highly correlated, thereby reflecting a set of unobserved/latent approaches to innovation (represented in the model by factors) by Norwegian firms prior to the COVID-19 crisis. Appendix A presents the names and main characteristics implied by the respective approaches to innovation. The names were chosen to reflect the main features of each group.
As an indicator of how resilient different innovative firms were to the COVID-19 crisis, we apply data on the use of different compensation schemes by firms with a pronounced loss of turnover. These schemes were available for Norwegian firms from March 2020 to February 2022. (The first infection control measures were introduced in Norway on 13 March 2020. After several periods of either escalation or relaxation of the infection control measures, the economy was completely re-opened on 12 February 2022. Application and processing procedures were active from 22 April 2020 to 10 May 2022.) A short description of the schemes is presented in Table 1, and information on the recipients is available through open-source data. (These data can be found either on the government website www.regjeringen.no (accessed on 11 April 2022) or on the websites of the responsible agencies.) In addition, we use personal data on the recipients of salary compensation for furloughed employees. These data were accumulated at firm level by the Norwegian Labour and Welfare Administration (NAV) and are available through Statistics Norway’s database on public support for businesses. We used these data to identify firms that responded to the lockdown in March 2020 with immediate downsizing.
Finally, we use information on fulfilled education for firm employees from the National Education Database to account for the availability of skilled labour in firms. This register includes individual-based statistics, which have been aggregated at firm level through the linked employer-employee register data.
3.2. Formulation of Assumptions and Construction of Final Sample
The compensation schemes presented in Table 1 were intended to help firms that were negatively affected by government infection control measures. Hence, our first key assumption is that firms that used these schemes were less resilient to the crisis than firms that did not use them (given that they were still active in February 2022). (Of 6360 firms covered by CIS2018, 13 were registered as bankrupt in 2019, and 115 were registered as bankrupt in 2020–2021. It usually takes up to 2 years from the start of bankruptcy proceedings to being registered as bankrupt in the Register of Business Enterprises. Therefore, most of these processes were started before the COVID-19 crisis and so were not caused by the pandemic. Moreover, it was made temporarily impossible by government regulation to start bankruptcy proceedings during 2020. As a result, the statistics show a lower number of bankruptcies in 2020 than before the pandemic: https://public.tableau.com/app/profile/statistisk.sentralbyr.statistics.norway./viz/vis-konkurser-per-uke/Konkurserovertid2020-2019-2009 (accessed on 8 November 2022)).
Assumption 1 (A1).
Firms that used COVID-19-related compensation schemes during the pandemic were less resilient to the COVID-19 crisis than firms that did not use them.
We also treat implementation of infection control measures on 13 March 2020 as a shock and assume that firms had been equally impacted by these measures immediately after their implementation. However, with time some firms were able to adapt their products, services and activities to the new conditions and hence benefited in terms of increased turnover. These firms were then expected to stop using (exit from) the compensation schemes quickly. Our next key assumption is the following:
Assumption 2 (A2).
Firms that started to use COVID-19-related compensation schemes but exited quickly (had a shorter duration in the schemes) were more resilient to the crisis than firms that used the schemes throughout the period (had a longer duration in the schemes).
From previous analyses, we know that some industries, such as the travel industry, retail trade and other personal services (including hairdressers, skin care salons, etc.) were hit especially hard (see, for example, [43] (Norwegian text), which describes the distribution of users of the Business Compensation Scheme by the main industry groups in the first months of the pandemic, March–May 2020, in Norway). In the next chapter, we control for the industry and other firm characteristics (i.e., firm size, age and location) to study how different innovative firms were affected by the crisis. We also know from previous research that the availability of skilled labour in a firm has a positive impact on firm performance in terms of both innovative output and productivity, e.g., see [44]. We then assume that labour heterogeneity could also influence a firm’s resilience to the crisis and control for it, including in the model the share of high-skilled employees in the firm. This share is defined as the number of man-hours worked by employees with upper secondary education (which includes vocational training) divided by the total number of man-hours in the firm.
After excluding 128 firms registered as bankrupt in 2019–2021 and 124 that were liquidated through mergers before March 2020, we are left with 6108 firms for further analysis. Table 2 presents descriptive statistics for the size, age and turnover in 2018 of the firms in the final sample. As mentioned earlier, all firms with 50 or more employees are included in the Community Innovation Survey. At the same time, about 60 percent of firms in our sample are small firms with less than 50 employees, and about 15 percent are micro firms with 5–9 employees. Thus, our sample is representative of both small and large firms in terms of both employee numbers and turnover (the median turnover is about NOK 6 million or EUR 600 thousand). It is also representative of different industries and regions. (The survey sample is selected using a stratified method for firms with 5–49 employees (larger firms are full covered), where strata are based on industry classification (NACE codes) and firm size. Hence, data are representative for industries and firm size by construction. Sample distribution figures by industry group and region can be provided upon request.)
As regards age, most of the firms in the sample are well-established, with a median age of 20 years since their establishment. Approximately 10 percent of the firms in the sample were young in 2018 (i.e., 2–5 years old). The firms in the sample are also skills-intensive firms (both the median and the average share of high-skilled employees is about 70 percent in terms of man-hours). In approximately 20 percent of the firms in the sample, less than half of the man-hours worked are skilled man-hours.
3.3. Periodicity and Duration of Use of Compensation Schemes by Norwegian Firms
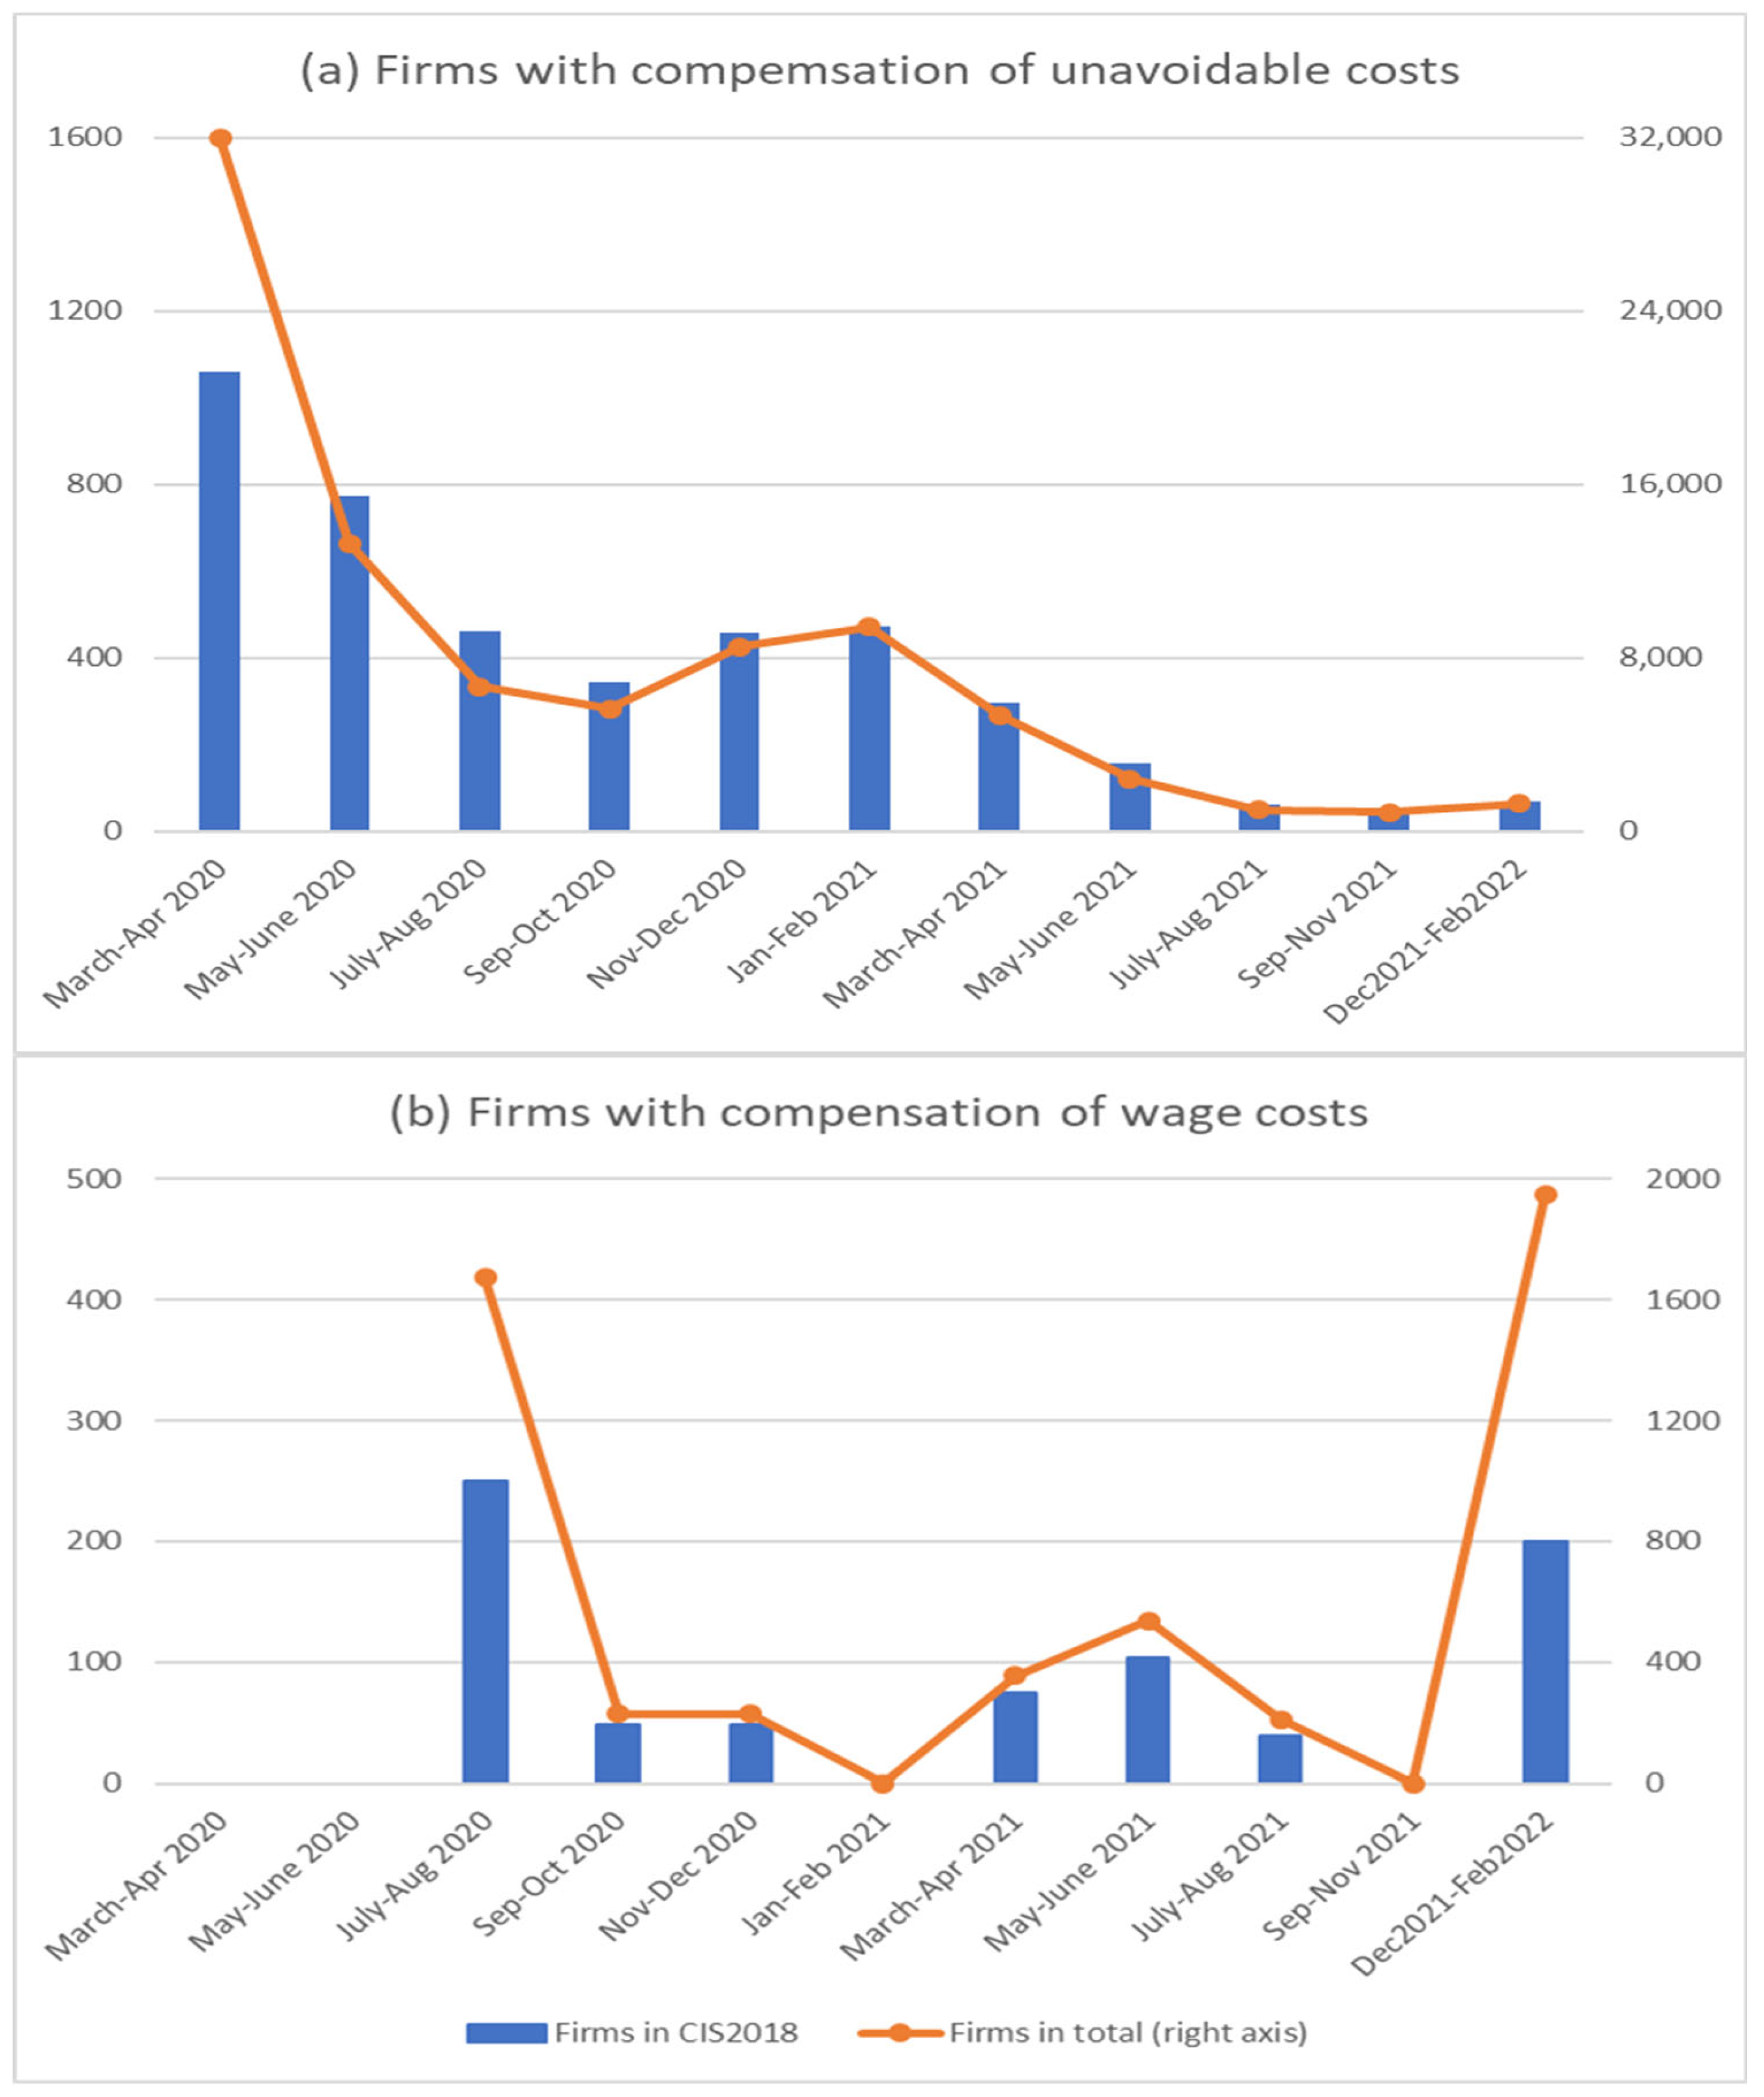
Figure 1 shows the number of firms, in total and represented in CIS 2018, that used compensation schemes between March 2020 and February 2022. Panel (a) shows users of the Business Compensation Scheme, while panel (b) shows firms that were users of the Salary Compensation Scheme. The whole period is divided into sub-periods of two months (due to availability of data for some of the sub-periods at this level) with one exception. The last two sub-periods cover three months, to separate the relatively few users in the autumn of 2021 from the last wave of the pandemic, and hence strict infection control measures and more users, from December 2021 to the re-opening of society in February 2022.
From Figure 1, we see that users of the Business Compensation Scheme are well represented by firms in CIS2018, i.e., the number of users covered by CIS2018 follows the same development over time as the total number of users (only the first sub-period in the analysis (i.e., March–April 2020) is an exception to this pattern, when relatively less firms covered by CIS2018 used the scheme compared to the total number of users). Many firms had to stop or adjust their activities due to infection control measures, and hence experienced significant loss of turnover compared to the normal situation.
The users of the Salary Compensation Scheme, which made it possible to keep employees at work even when a firm’s activities in terms of turnover were markedly reduced, are also well represented by firms covered by CIS2018 (see Figure 1b). Note that these compensation schemes were used most intensively at the start and during sub-periods with escalation of infection control measures (i.e., late autumn 2020-start of 2021, spring 2021 and turn of the year 2021–2022).
The data on furloughed employees are treated separately in our analysis from two other compensation schemes due both to the limited time availability of this scheme (i.e., it was available from March to August 2020) and to the different sets of requirements that applied. While the Business Compensation Scheme and the Salary Compensation Scheme for firms both had a requirement of significant loss of turnover (the main indicator in our analysis of resilience), the latter scheme is related to the temporary downsizing of the firm in terms of employees. In total, 54,191 firms furloughed more than 400 thousand employees due to COVID-19-related restrictions during March–April 2020, with most furloughing registered in March 2020 (see [45], Chapter 3.2, in Norwegian). In the next sub-periods, the number of firms with furloughed employees was markedly reduced, i.e., to 7589 firms in May–June 2020 and 3407 firms in July–August 2020. Of the firms covered by innovation survey, 2805 used this scheme in March–April 2020, 755 in May–June 2020 and 501 in July–August 2020. We use data on furloughed employees only for the probabilistic analysis of short-run resilience, while data from the Business Compensation and Salary Compensation schemes are used to analyse long-run resilience.
Table 3 reports numbers of users of compensation schemes by the sub-period of their first observed use. It demonstrates that most of the firms started to use compensation schemes immediately after the implementation of infection control measures (i.e., 1080 of 1410 firms received their first compensation for reduced activity in terms of significant loss of turnover in March–April 2020). Table 3 also reports user numbers by the last observed sub-period of compensation use for each user generation. This table provides an overview of variation in the duration of compensation use.
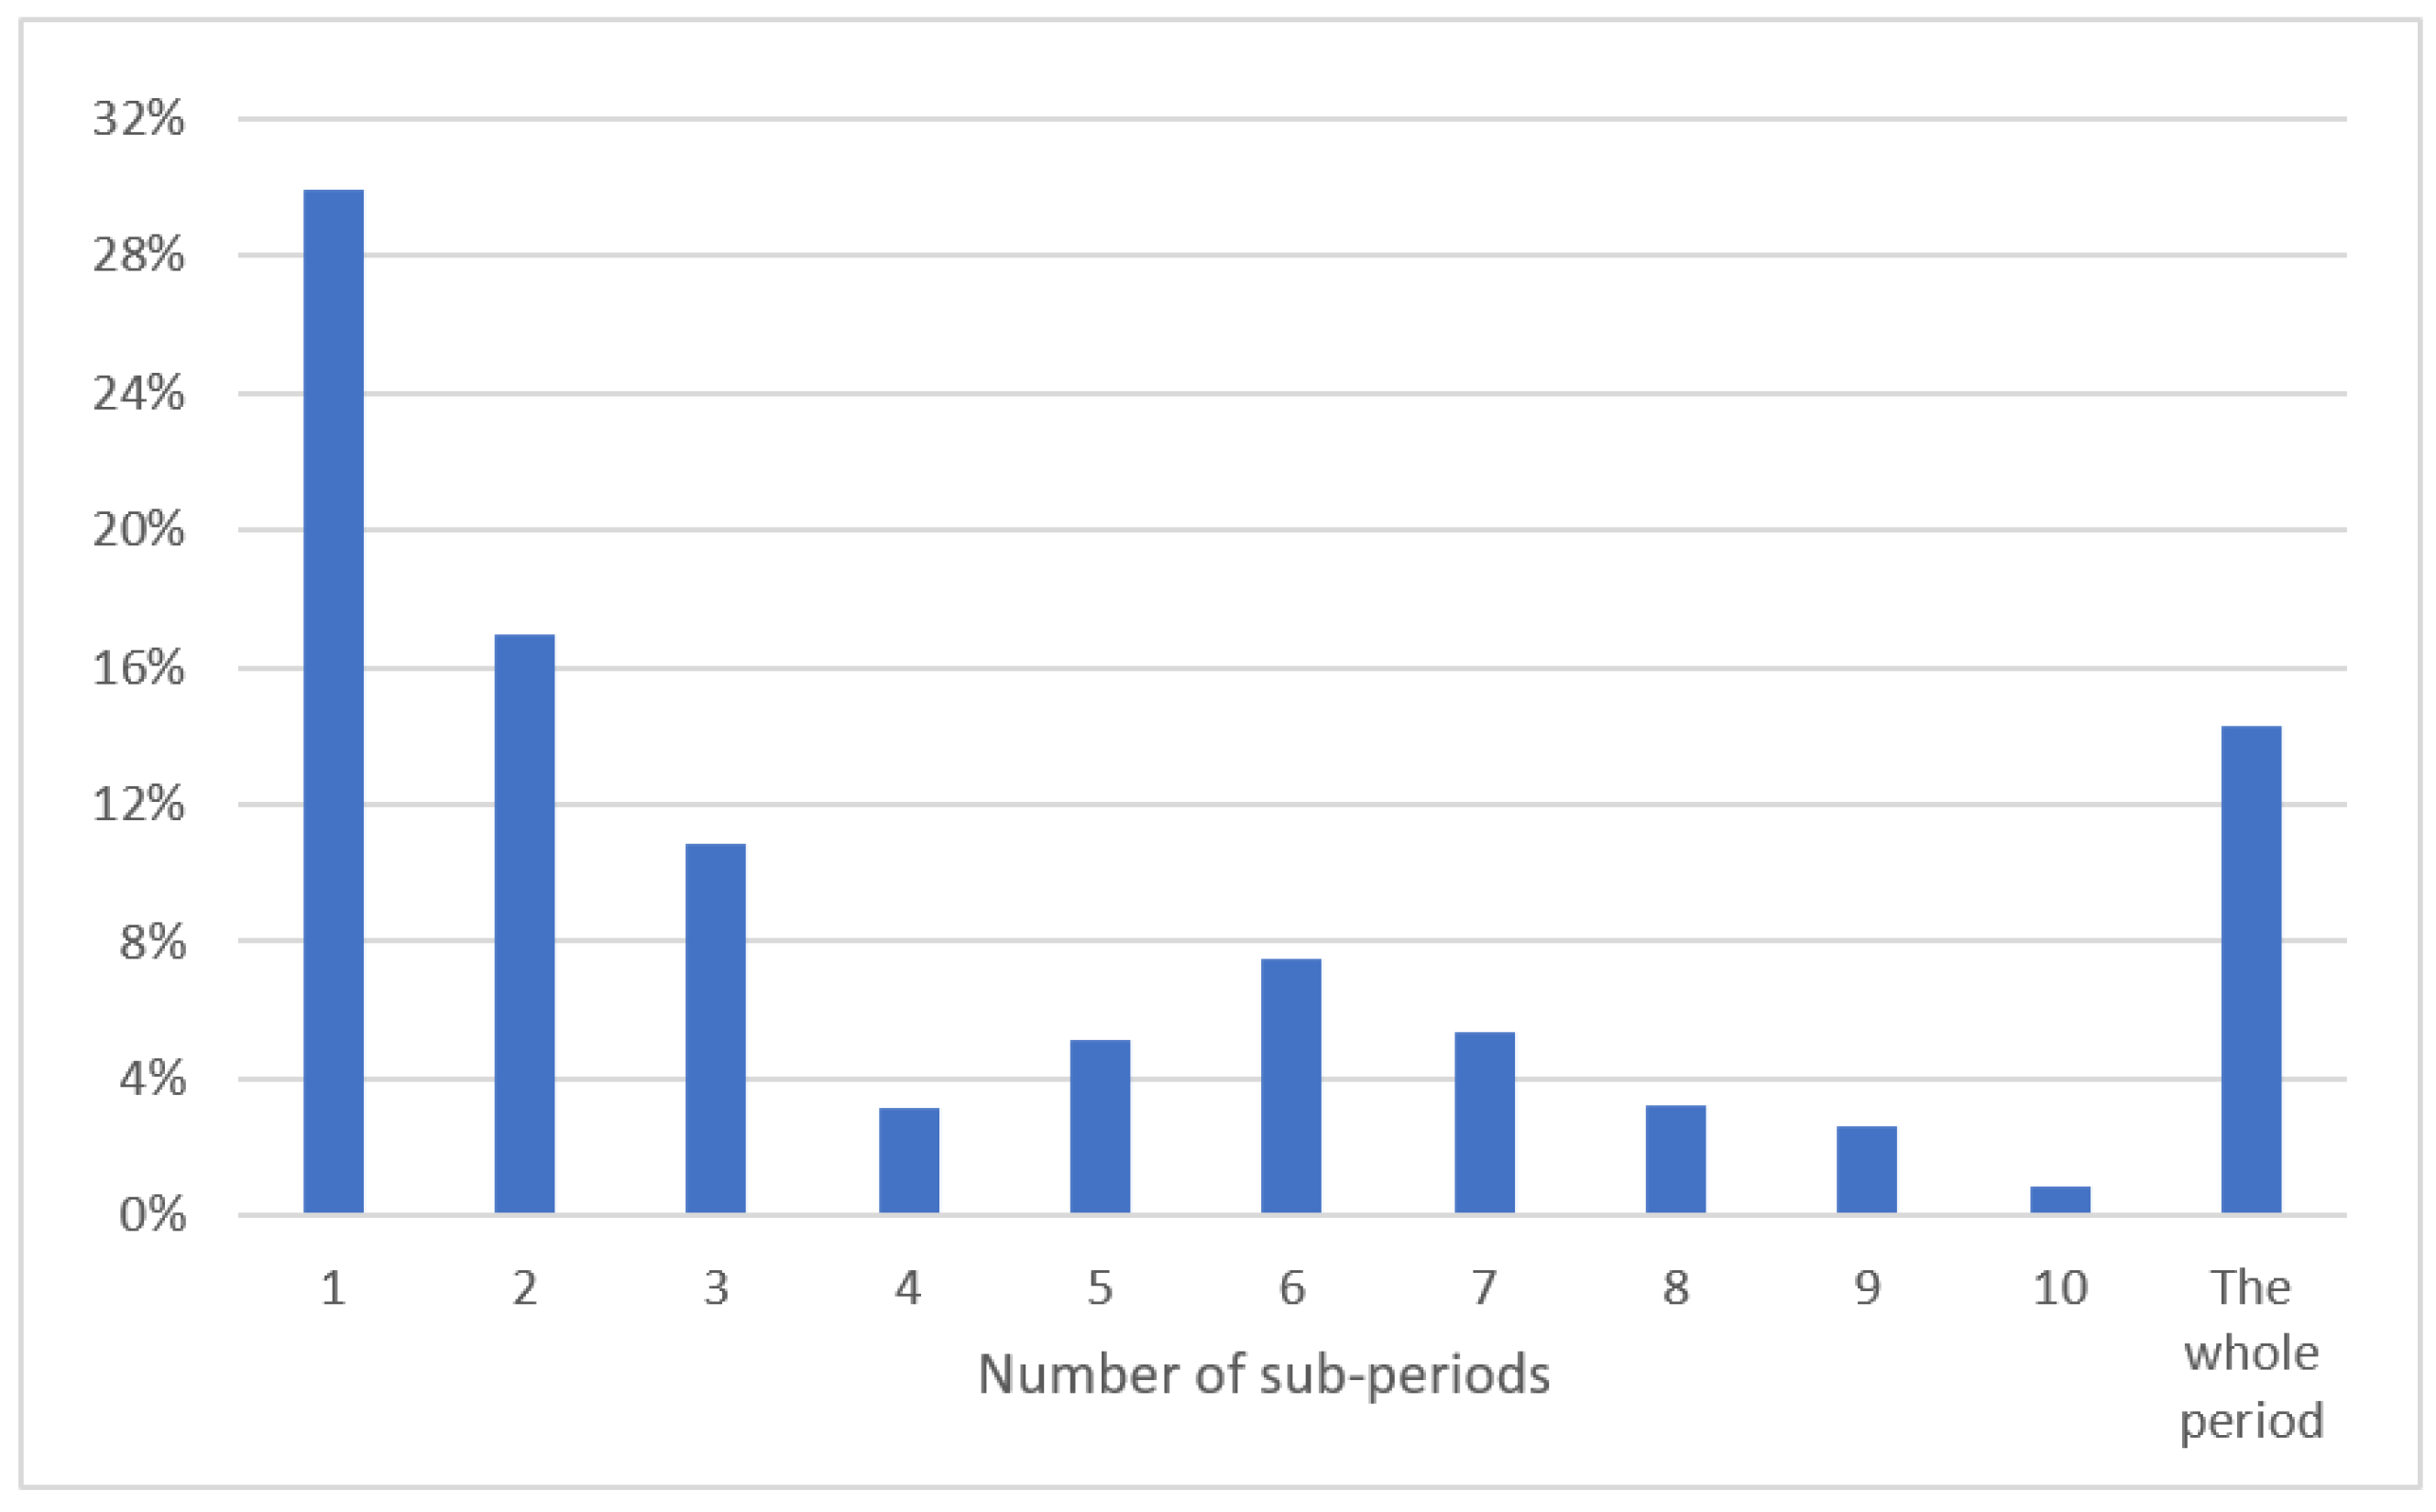
Figure 2 shows that 30 percent of users received compensation for a marked loss of turnover during only one sub-period, while 17 percent used compensation schemes in two sub-periods and 11 percent in three. At the other extreme, we observe that about 14 percent of users used compensation schemes throughout the whole pandemic period.
Further, we will explore whether there is any relationship between various approaches to innovation among Norwegian firms (as developed by Capasso and Rybalka [12]) and firm resilience to the COVID-19 crisis indicated by no or short use of COVID-19-related compensation schemes.
4. Empirical Model and Estimation Results for Resilience
Let us now consider a model for resilience. Let RES* be a latent variable that measures the extent of a firm’s resilience to the crisis. The lower the value of RES*, the higher the firm’s probability of being affected negatively by the pandemic in the form of losing turnover and/or downsizing. We assume that a firm’s resilience to the crisis depends on, among other characteristics, their innovativeness:
where is a latent variable that measures the extent of a firm’s creativity/research activity and is represented by a vector of factor scores for different approaches to innovation estimated by [12], while is the share of employees with upper secondary education and is a vector of other observed firm characteristics (i.e., firm size, age, industry, location and a constant term), α, β and γ are vectors of interest, is a constant term and is an error term.
As a measure of , we first use an indicator of whether a firm used compensation schemes related to the marked loss of turnover due to the pandemic in the given sub-period or not, i.e., a dummy variable that is equal to 1 in the case of use and 0 in the case of non-use of compensation schemes in the given sub-period. This model is then estimated for the whole observation period and for each sub-period separately. (Note that we do not have time series for firms’ characteristics at a detailed level such as month to month. These characteristics are fixed at the pre-crisis level as provided by CIS2018. However, variation over time in the use of the compensation schemes allows us to estimate the extent of resilience of a given firm at different stages of the pandemic.) The estimation results for different approaches to innovation, by sub-period, are presented in Table 4.
From Table 4, we see that the strongest negative association with the marked loss of turnover (indicated by the use of compensation schemes), and hence with highest resilience to the crisis, is displayed by “active R&D doers”. The firms associated with this approach to innovation had the lowest probability of using compensation schemes both at the start of the pandemic and through the whole observation period. Other approaches to innovation strongly associated with more resilient firms are used by “innovation suppliers” and “knowledge absorbers”. Having a higher share of skilled employees also implies a lower probability of a marked loss of turnover during the pandemic, and hence higher resilience to the crisis.
The strongest positive association with the marked loss of turnover throughout the observational period is demonstrated by “strategic adapters”, i.e., firms whose main strategy is to produce high-quality specialised products. “Customer-oriented service suppliers”, “hard-trying innovators” and “early technology adopters” are also strongly associated with marked loss of turnover both at the start of pandemic and in some sub-periods. While “radical innovators” demonstrate a higher probability of marked loss of turnover (indicated by the use of compensation schemes) in the later sub-periods, “process developers”, “innovation promisers” and “individual standard service suppliers” do not show any particular pattern with respect to the use of compensation schemes.
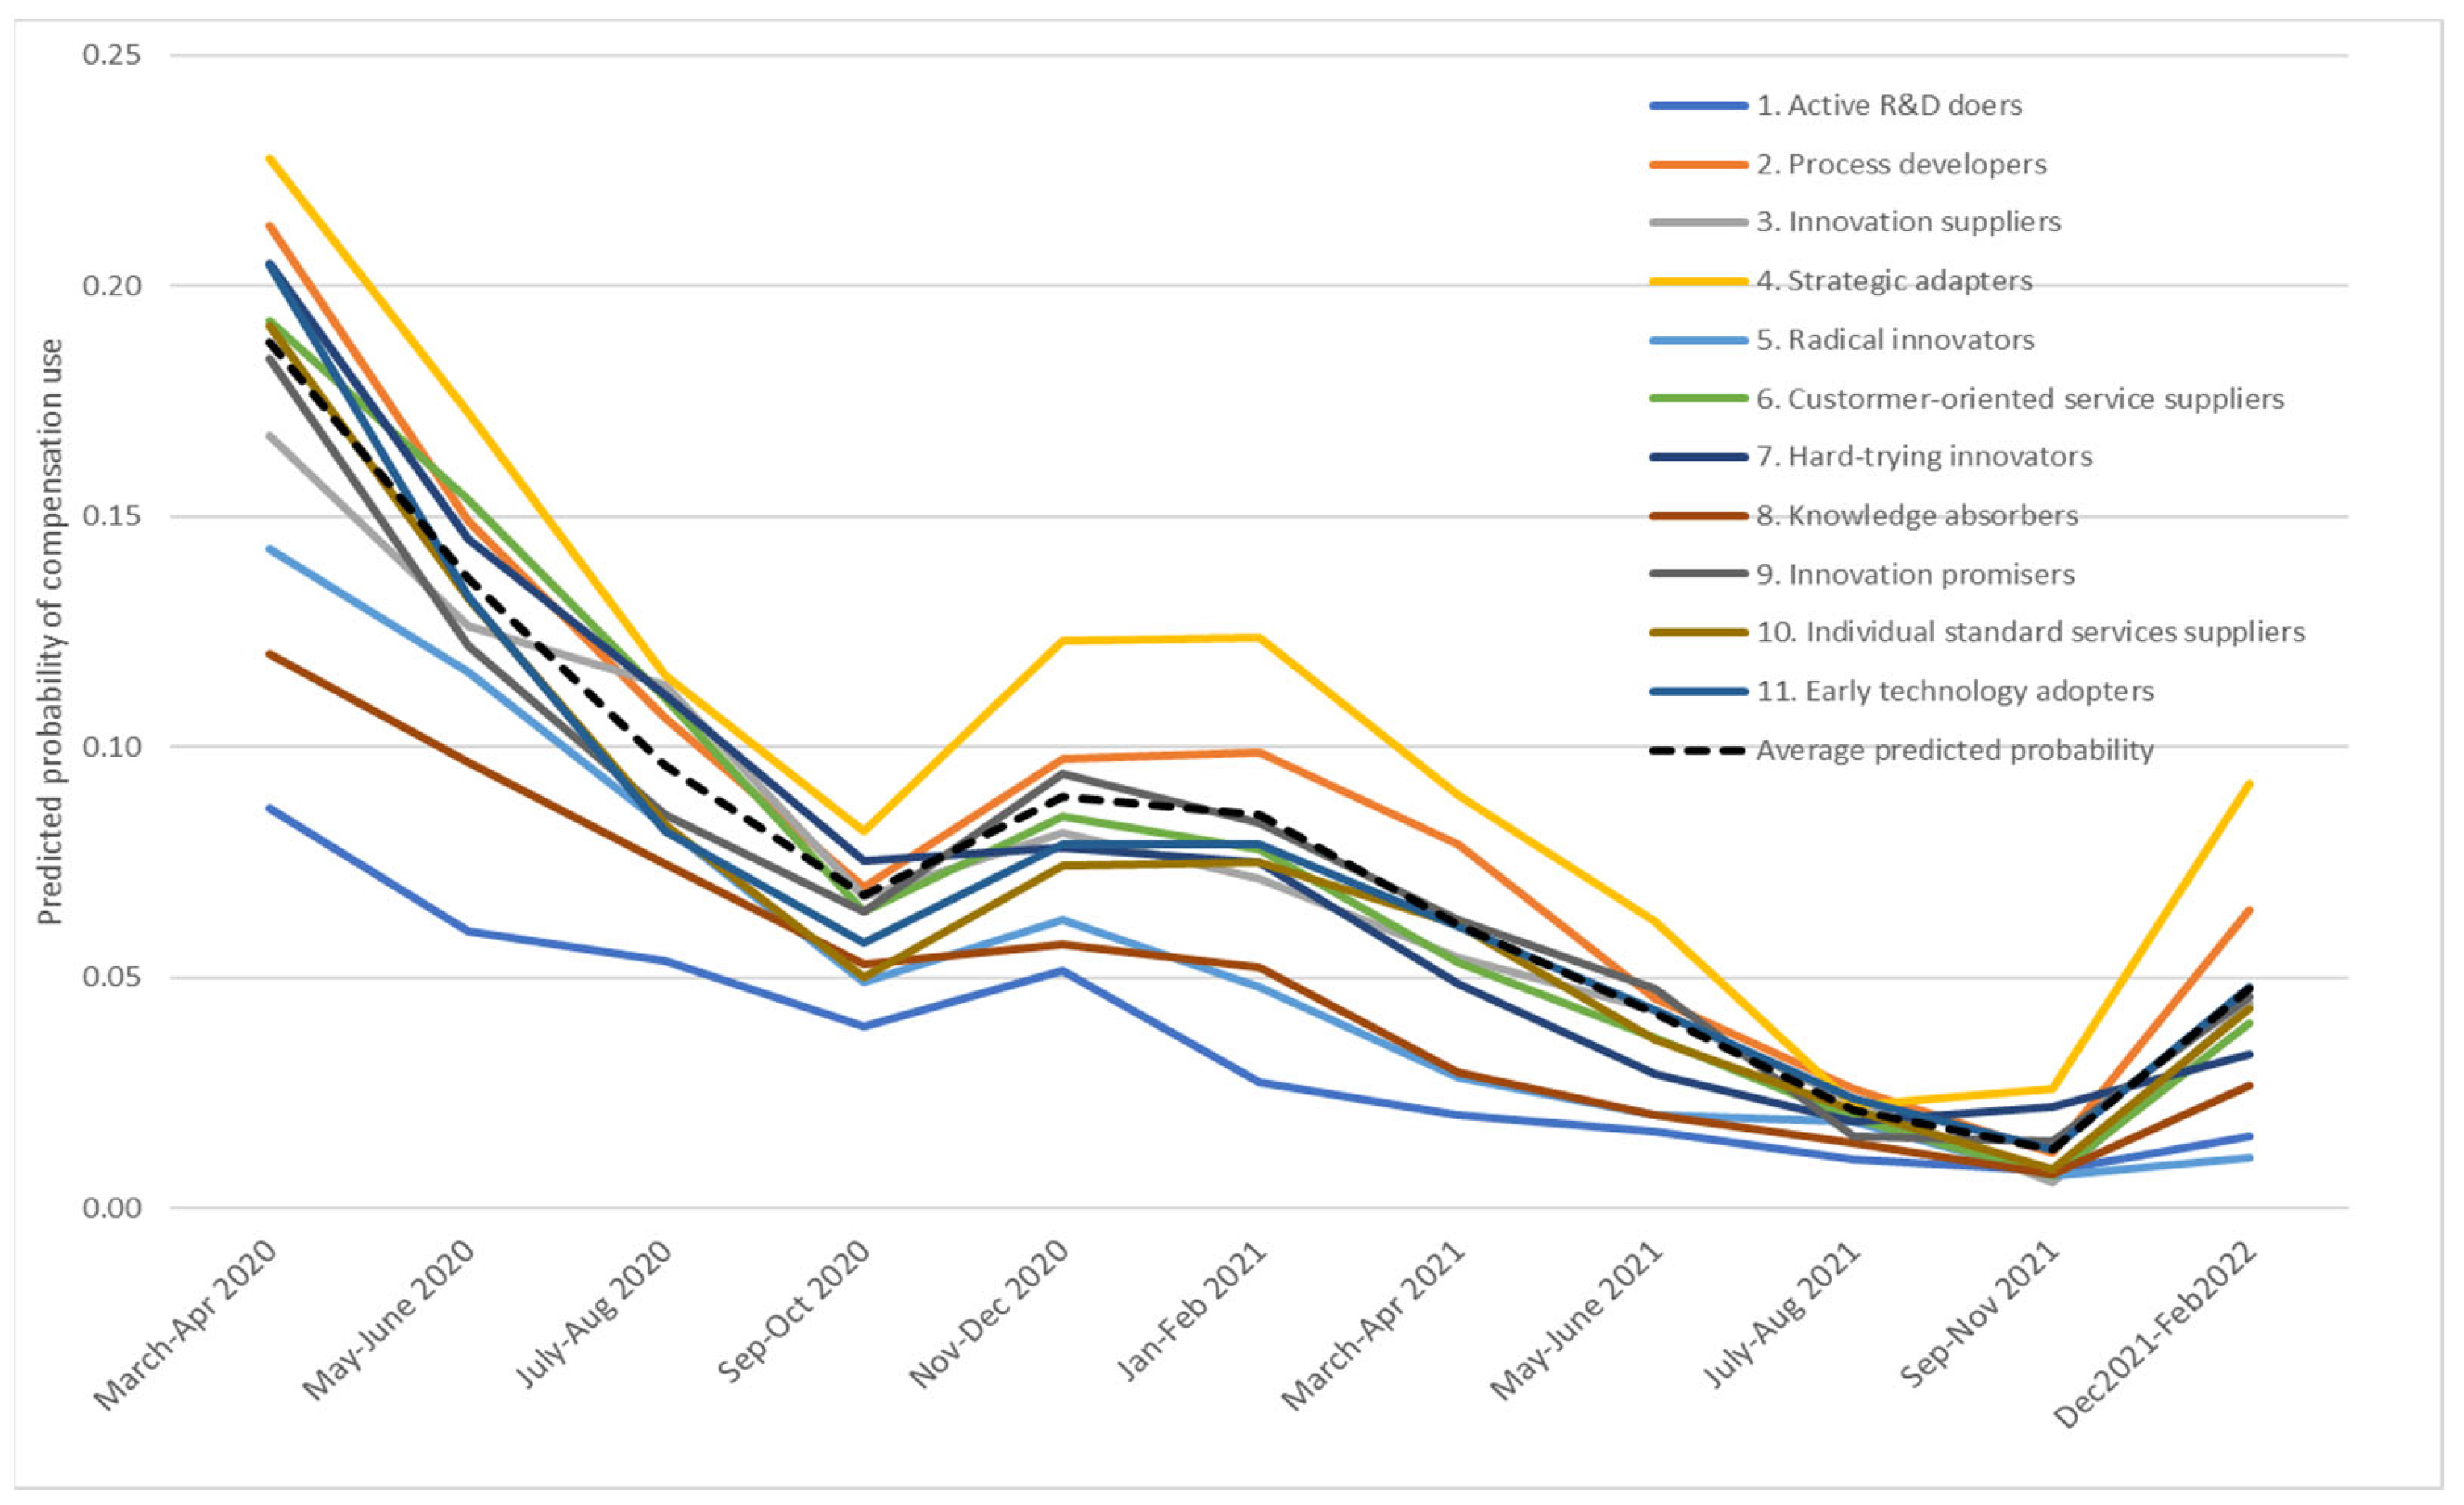
To illustrate the relationship between different approaches to innovation and firm resilience to the crisis, we calculate an average predicted probability of firms using compensation schemes for each sub-period among the 10 percent of firms with the highest scores for the respective approaches to innovation. This relationship is presented in Figure 3. We see from Figure 3 that the average predicted probability of using COVID-19-related compensation has an expected shape, increasing in periods with stricter infection control measures and decreasing when they are relaxed. While “active R&D doers” had the lowest predicted probability of compensation use throughout the period, “strategic adapters” had the highest predicted probability. Moreover, firms that scored high for being “strategic adapters” had the highest volatility for probability of compensation use, implying that firms of this type were probably restricted in adapting their products and services or finding new customer groups through the period, and hence had a marked loss of turnover more frequently (the predicted level of compensation use during the third wave of the pandemic by this group was almost the same as during the second wave).
We also use an indicator for whether firms furloughed their employees due to the pandemic or not as well as suffering a marked loss of turnover, to check which innovative firms were impacted especially severely by the lockdown of the economy in March 2020. The support scheme for furloughed employees was available from March to August 2020 (see Table 1 for a description of the scheme) and the additional analysis is conducted only for this period. The model (1) is then estimated as a bivariate probit model where the latent variable is represented by a system of two equations for two binary indicators, one for using the compensation schemes related to the marked loss of turnover and the other for furloughing employees due to the pandemic in the given sub-period. The results are presented in Table 5.
The results in Table 5 support the finding that “active R&D doers” were most resilient to the COVID-19 crisis in the short run, i.e., firms that applied this approach to innovation had the lowest probability of both using compensation for loss of turnover and furloughing employees. This finding applies to all three sub-periods from March to August 2020. Having a higher share of skilled employees also implies greater resilience to the crisis in terms of both turnover and furloughing. At the same time, “innovation suppliers” and “knowledge absorbers” that were more resilient in terms of turnover do not display any significant pattern with respect to furloughing.
On the contrary, “strategic adapters”, “customer-oriented service suppliers” and “hard- trying innovators” had the strongest positive association with both marked loss of turnover and furloughing, especially just after the economic lockdown (i.e., in March–April 2020). While “early technology adopters” have a stronger association with marked loss of turnover, “individual standard service suppliers” prove to be less resilient in terms of furloughing. However, both results apply only to the first sub-period just after lockdown and do not hold true in the later sub-periods.
We also conduct an analysis of the duration of use of compensation to check whether the pattern we have observed for “strategic adapters” holds through the period and whether other types of innovative firms were affected by the pandemic more frequently and hence proved to be less resilient in the long-run.
5. Estimation Results for Duration of Compensation Use
While previous models give an indication on what types of innovative firms were more (less) resilient to the COVID-19 crisis in the short-run and in general, we also want to investigate what types of firms suffered a long-term negative impact of the pandemic. For this purpose, we first apply probit model (1), but with dependent variable RES* associated with an indicator for the number of sub-periods for which a firm used compensation schemes (see Assumption 2). This model is applied conditionally to the use of compensation schemes and is estimated for i = 1, …, 1410 (the number of firms in our sample that used COVID-19-related compensation schemes during the period March 2020–February 2022). We then apply a duration model to estimate a firm’s probability of exiting from the compensation schemes in the given sub-period (conditional on the use of compensation until this sub-period) versus using compensation schemes until the end of pandemic, i.e., until the last wave of the pandemic in December 2021–February 2022. (The duration model is a statistical model that estimates the amount of time it takes for a certain event to occur. This type of model is commonly used in economics to study, e.g., state dependence in unemployment and the duration of receipt of welfare benefits. They are also used in fields such as finance to forecast the length of time it will take to pay off a loan, in engineering to forecast the length of time it will take to complete a project, and in health research to study survival rates for different medical treatments, also then called ‘survival analysis’.) The estimation results for the duration of compensation use for the different approaches to innovation are presented in Table 6.
From the estimation results by probit models with duration as a dependent variable grouped as 1, 2–3, 4–10 or 11 sub-periods, we see that the strongest positive association with the shortest use of compensation schemes is demonstrated by “individual standard service suppliers” (i.e., firms applying this approach to innovation had a high probability of exiting from compensation schemes after only the first period of use). (The reason for such a grouping is too few observations of exits in some of the sub-periods (see Table 3). At the same time, we want to focus on the case of early exits, i.e., after first use and after 2–3 sub-periods, and on the “never” exits, i.e., firms that used the compensation scheme through the whole observation period.) “Individual standard service suppliers”, with individuals and households as their main customer groups, main market in Norway and main strategy of “introducing new goods and services”, seem to have adapted their products very quickly to the new conditions of the pandemic, and so reduced their loss of turnover quickly.
At the other extreme, we observe that the longest use of compensation schemes, and hence the lowest long-term resilience to the crisis, is again demonstrated by “strategic adapters”. Other approaches to innovation that are more strongly associated with less resilient firms in the long run are “process developers”. In general, firms with a high score for being “process developers” were not significantly more or less resilient than an average firm (see results in Table 4), but among users of compensation this group of firms seems to be more state dependent than others. These results are robust to the choice of estimation model and are confirmed by the results from the duration model (2) (see last two columns in Table 6), where the coefficient in the hazard function for exit from compensation use before the end of the pandemic is negative for both “strategic adapters” and “process developers”, implying significantly lower hazard ratios and hence a higher rate of “survival” in the compensation schemes. (We have tested different specifications of the survival model in Stata, both as a proportional hazard (PH) model applying exponential and Weibull regression specifications and as an accelerated failure-time (AFT) model applying exponential, Weibull, lognormal and loglogistic regression specifications. The result for “strategic adapters” was robust to the choice of survival model, while the result for “process developers” was significant in PH-model specifications, but not in the AFT-model specifications.)
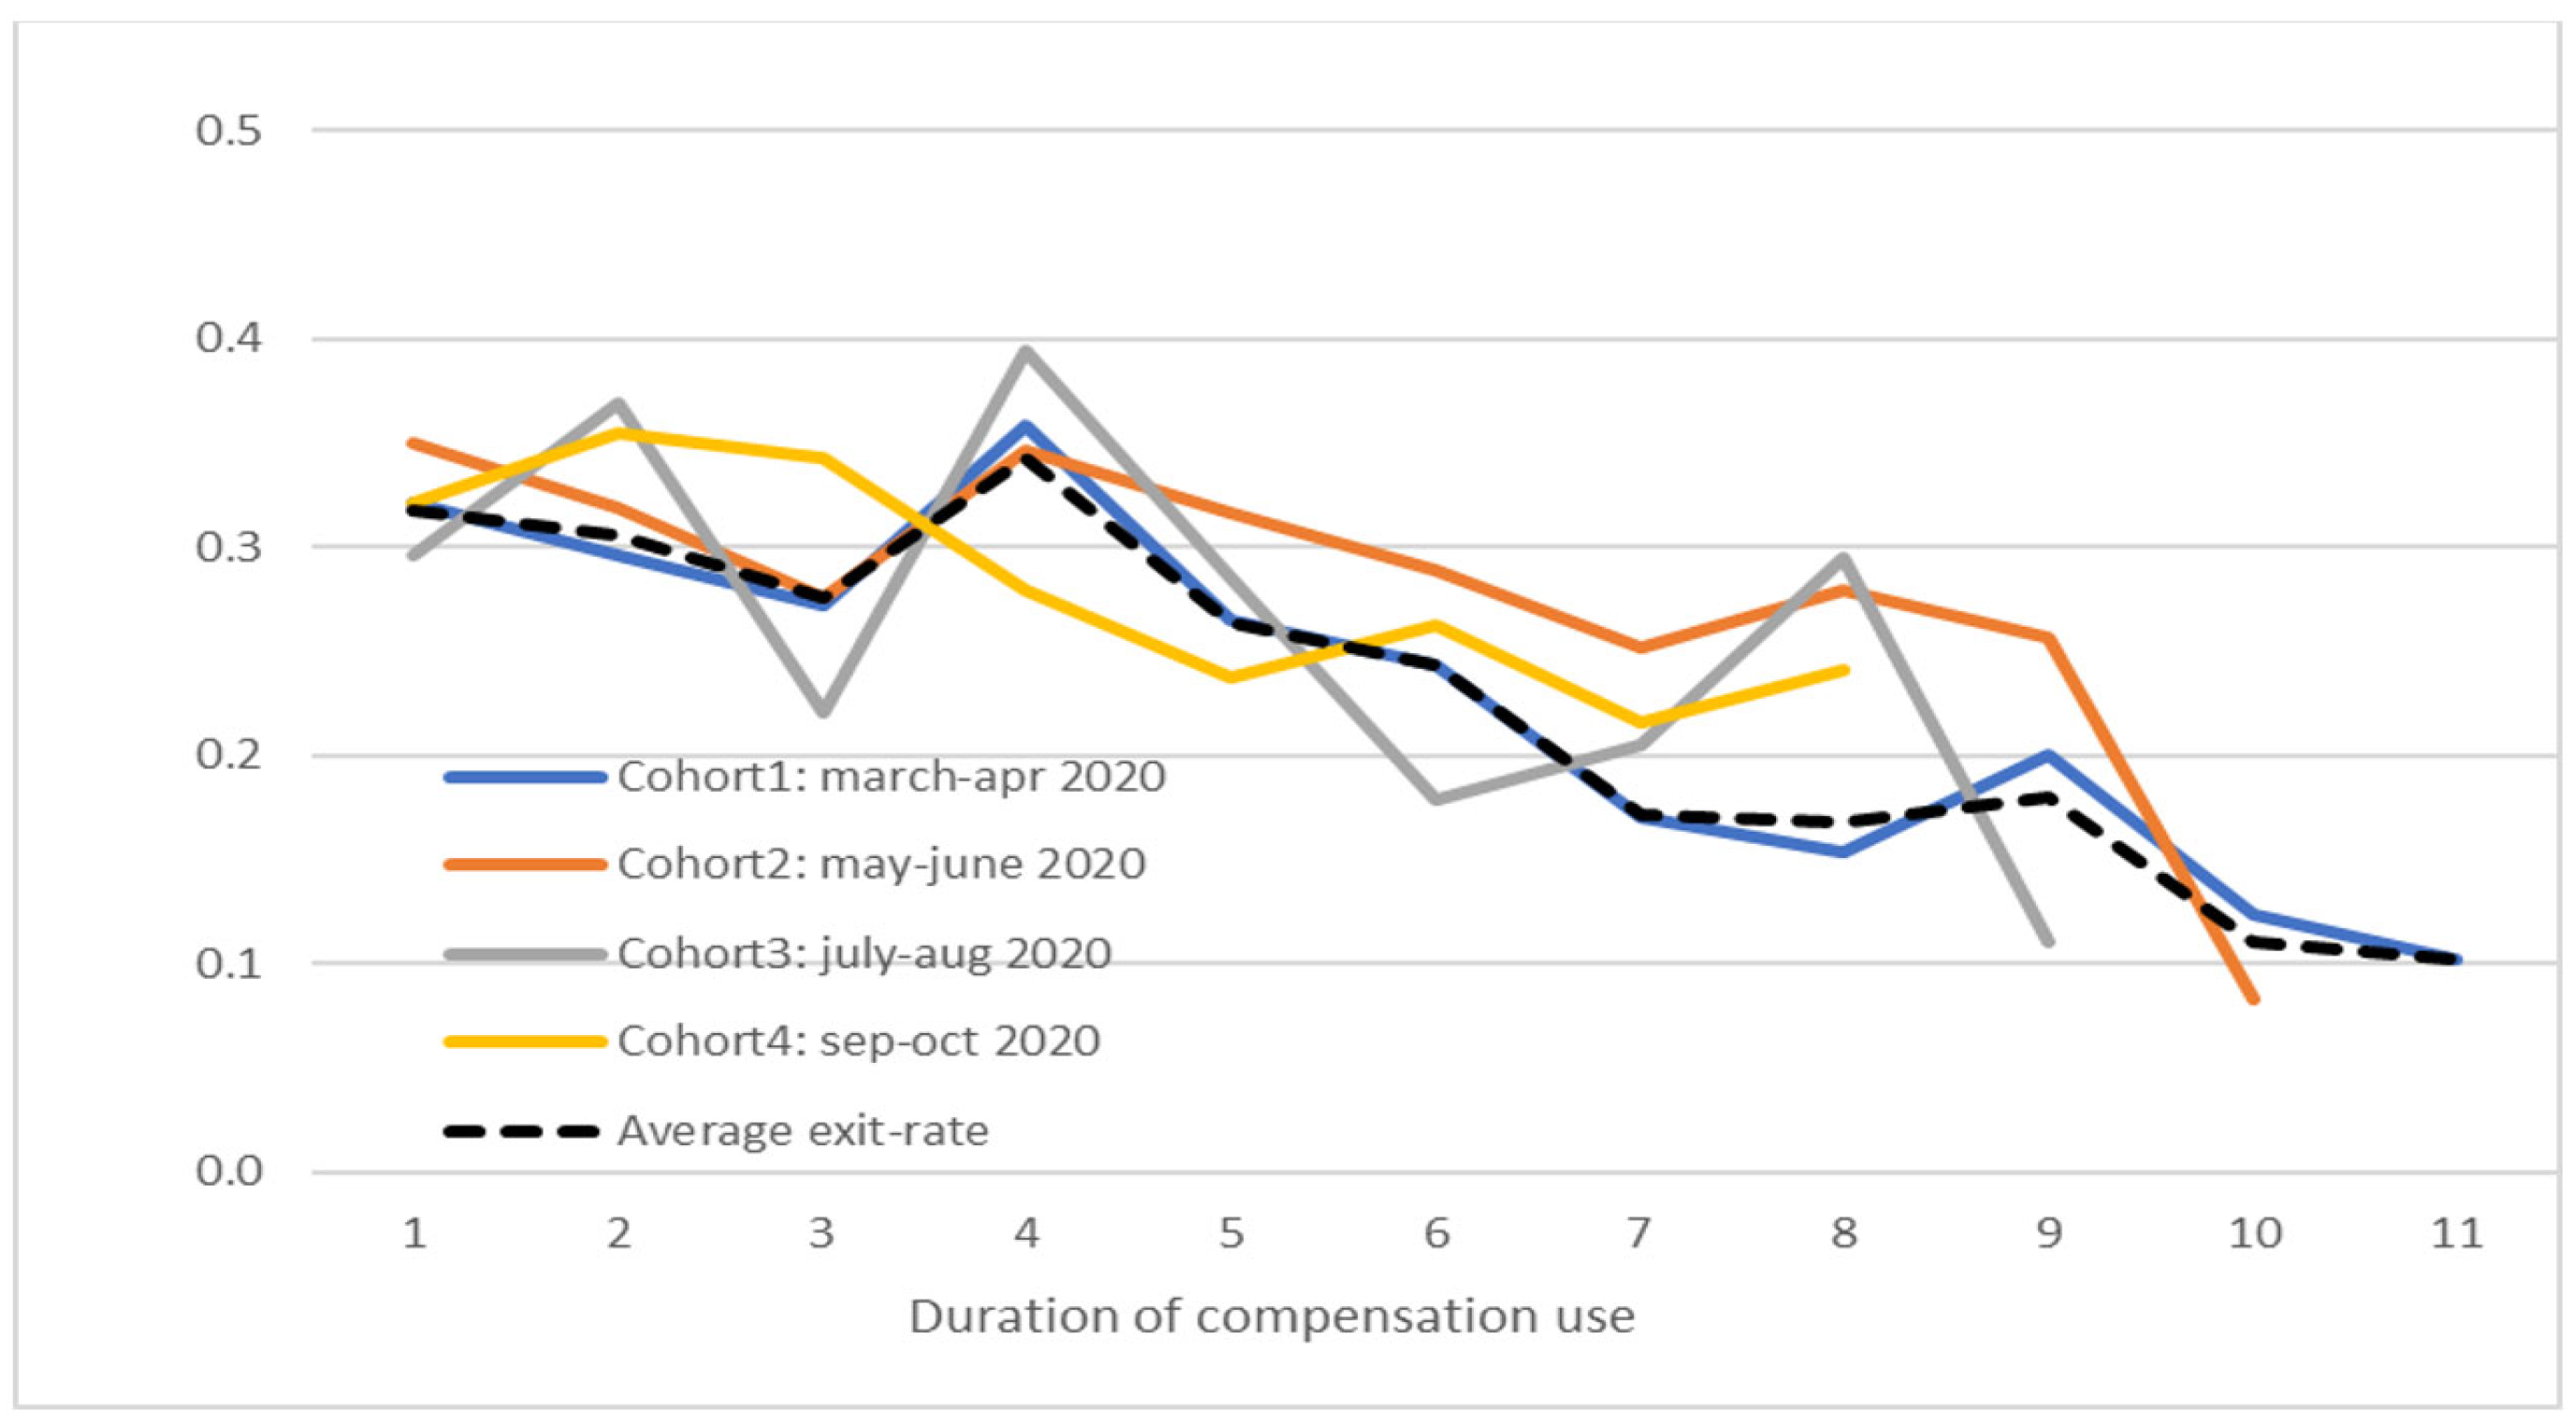
Figure 4 shows the average predicted exit rates from the duration model by duration of compensation use for all users and by user cohort for the first four cohorts. (Due to few observations and hence the high volatility of the results for other cohorts, these are not represented in the figure.) We see that the average predicted exit rate has a negative trend, i.e., the longer the duration of the compensation use, the lower the exit rate is. This finding is in line with established literature on the state dependence, for example, in the receipt of benefits by some types of individuals, the longer they remain unemployed [46].
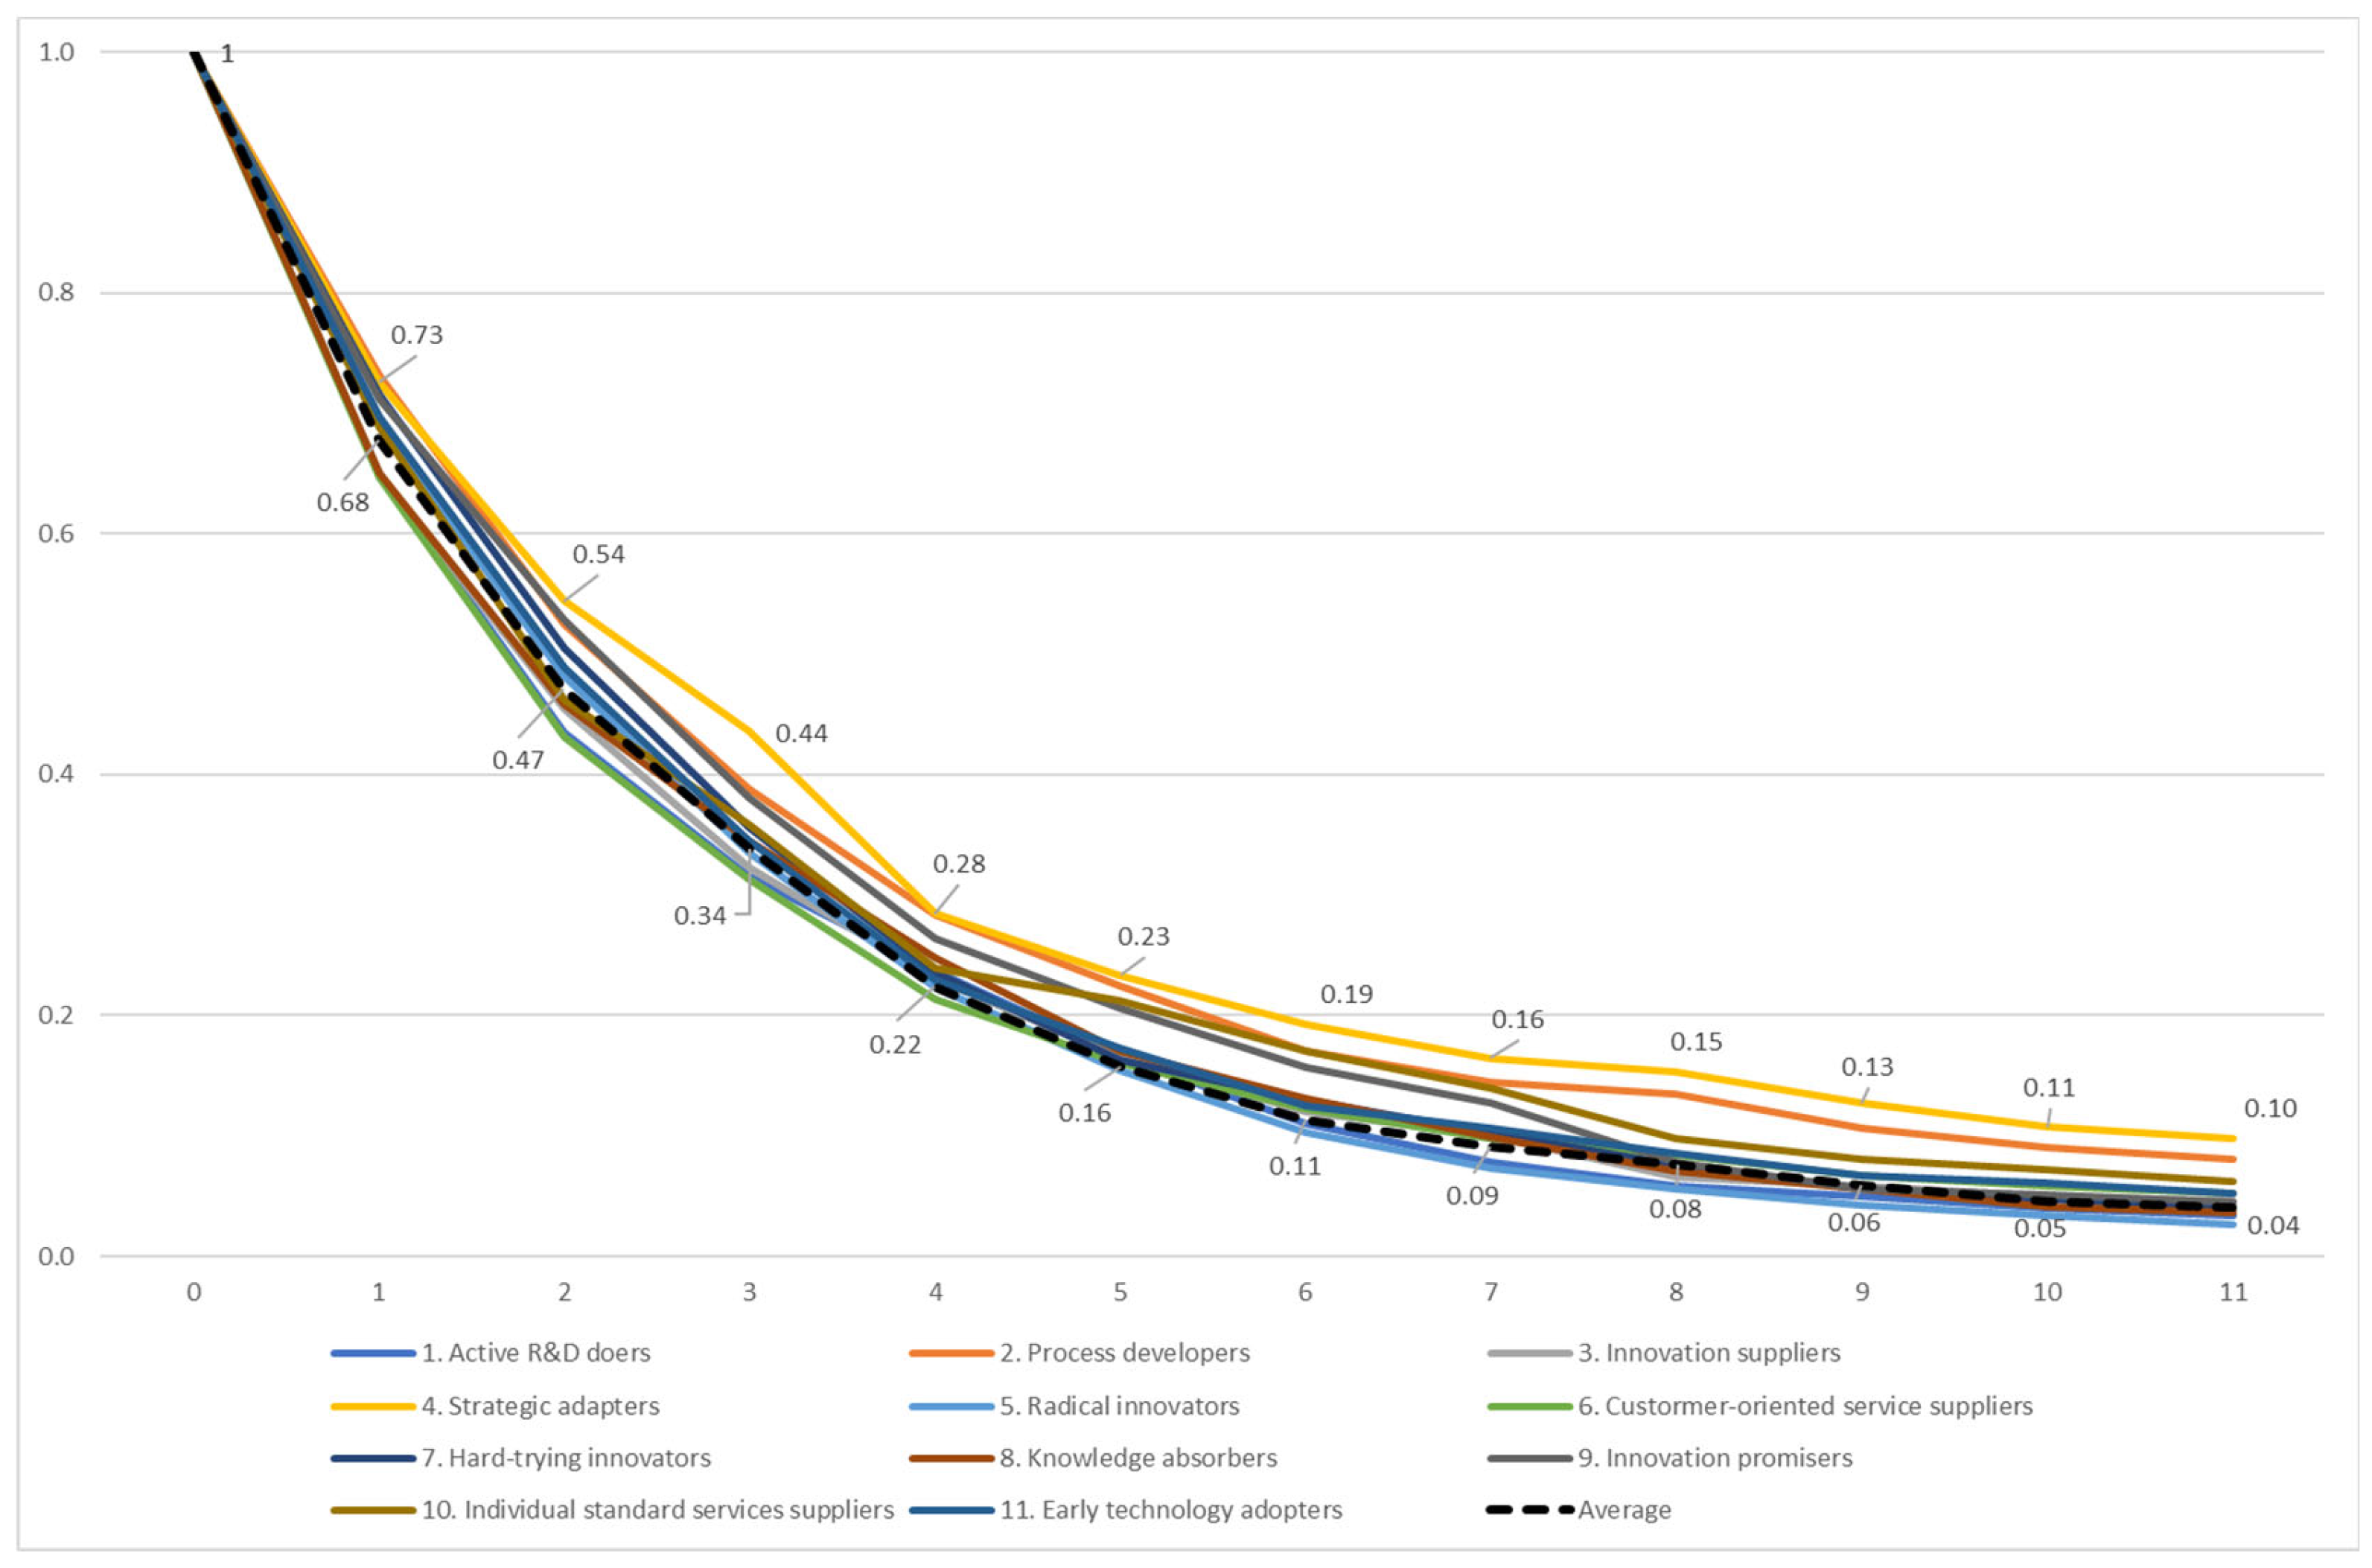
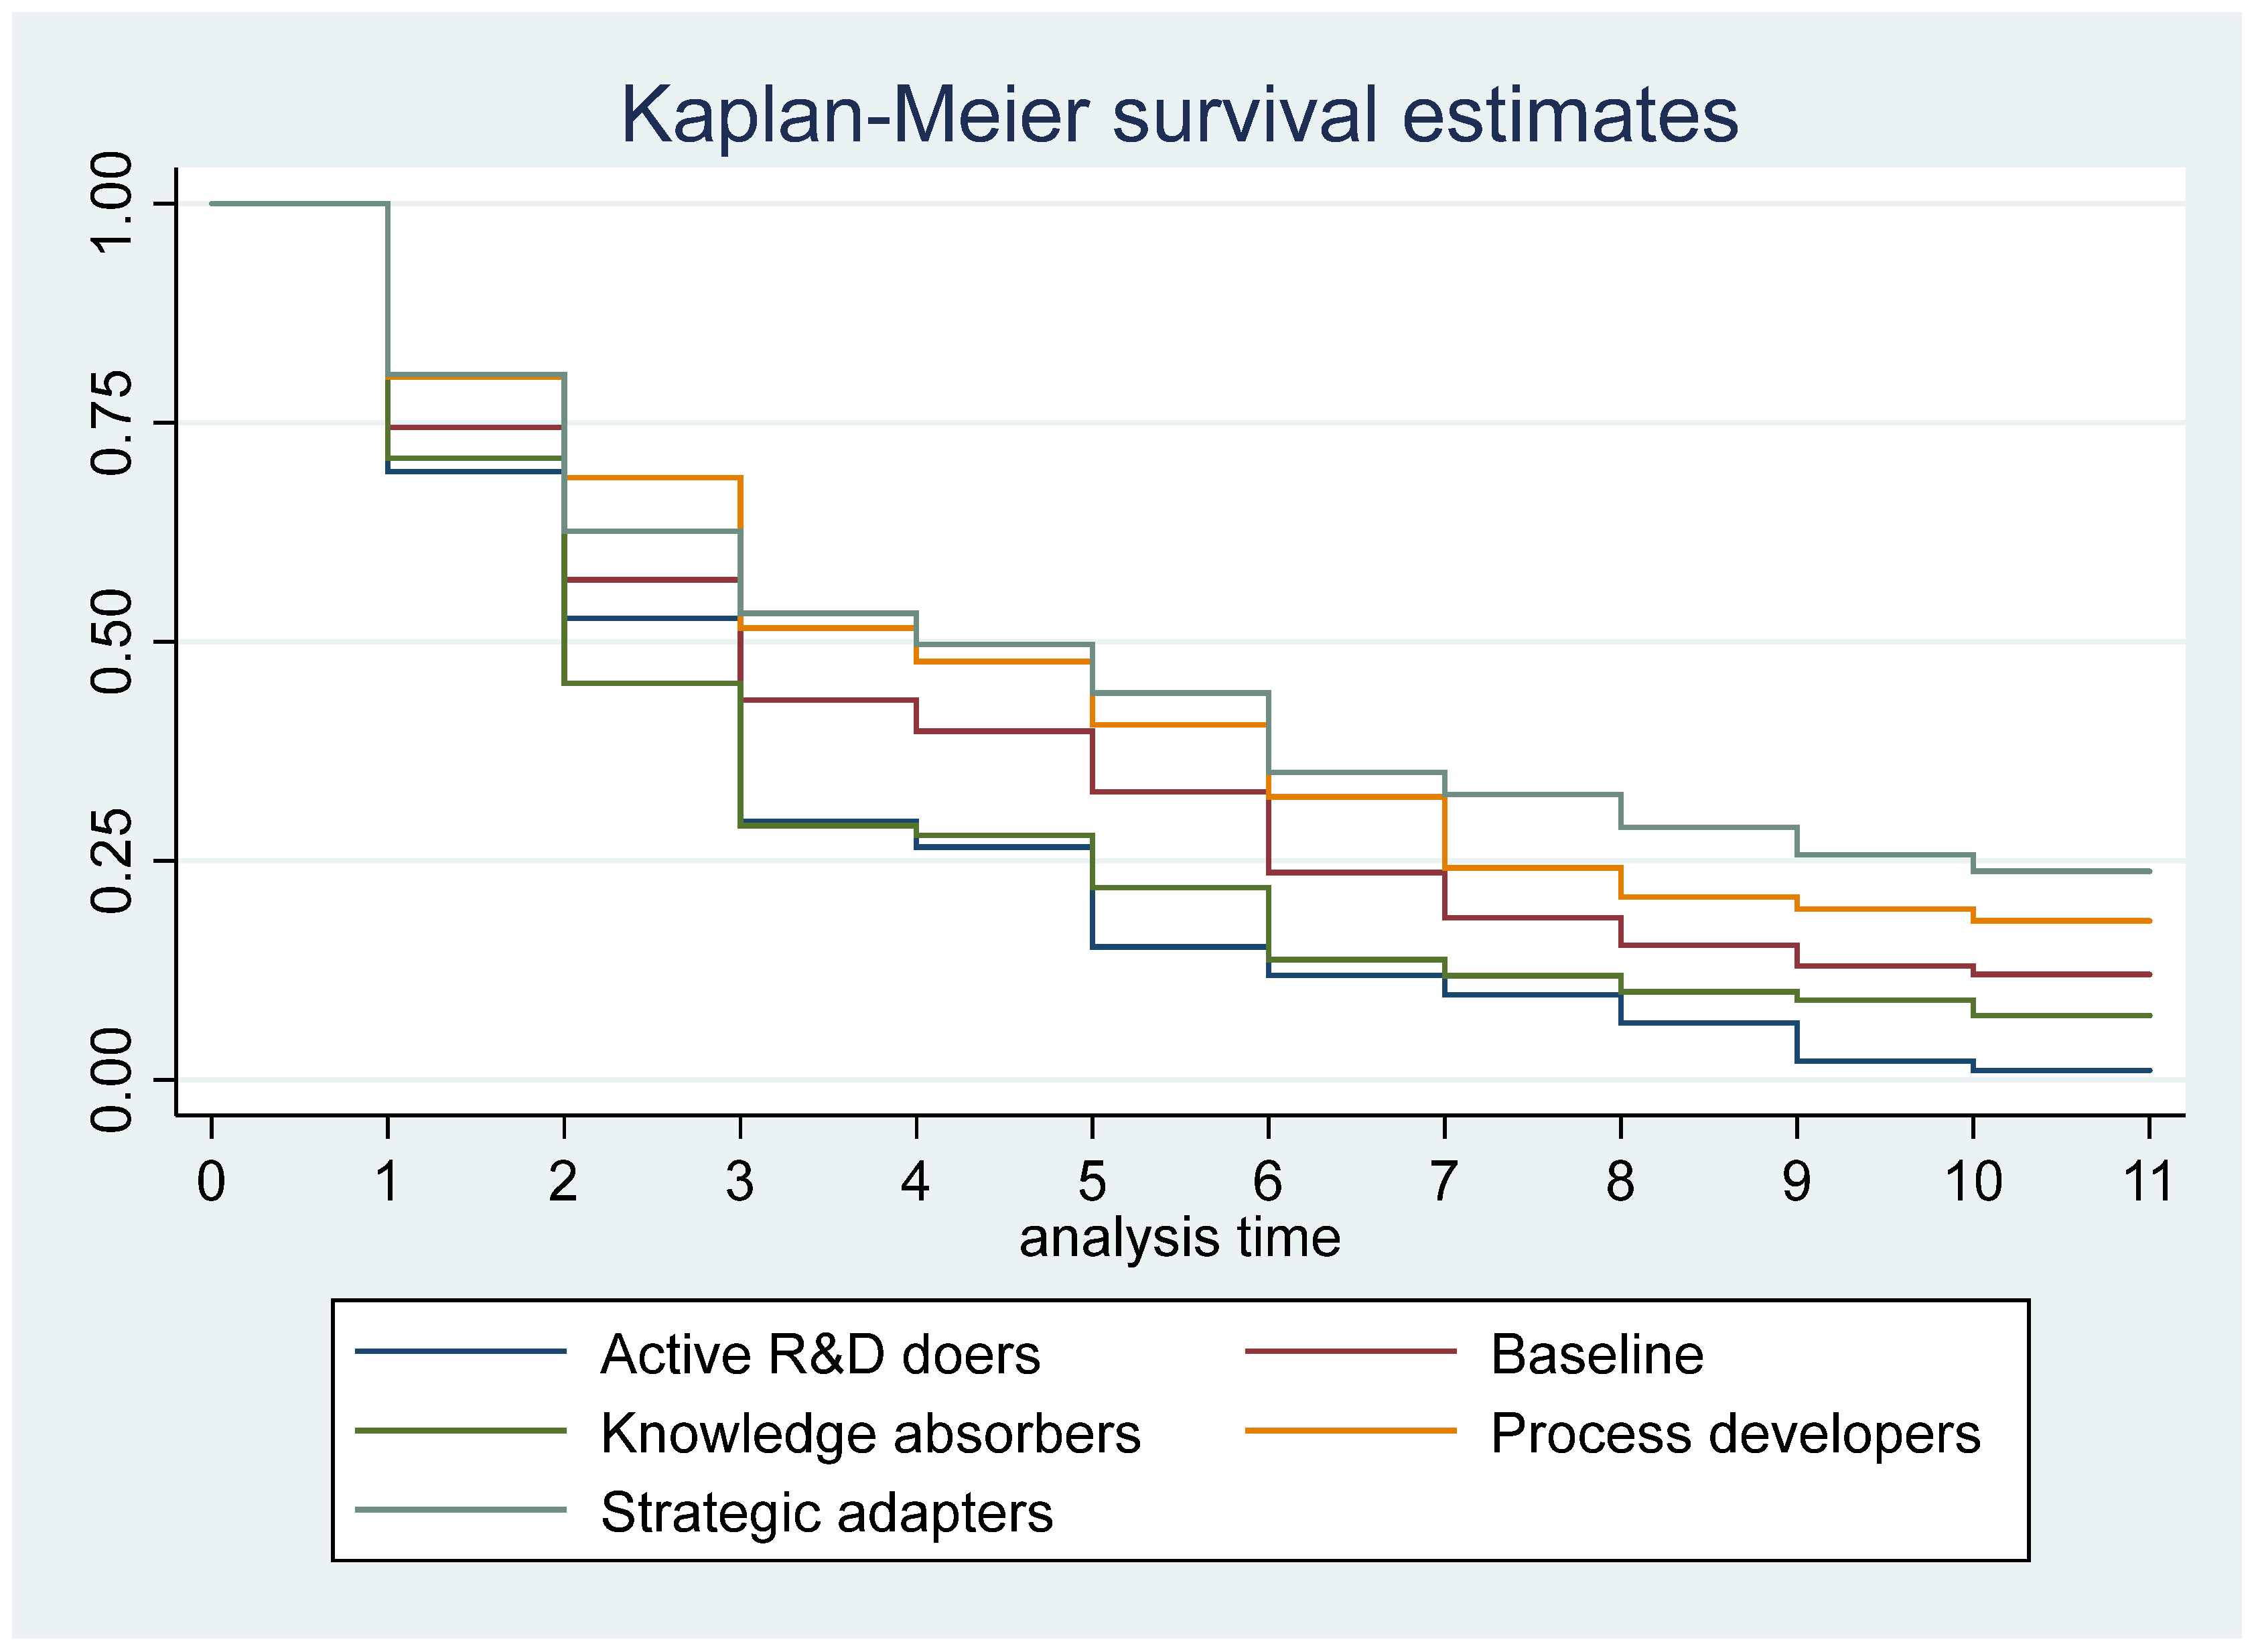
To illustrate the relationship between different approaches to innovation and firms’ duration of compensation use, we calculate the average predicted exit rates for the 10 percent of firms with the highest scores for their respective approaches to innovation. These average predicted exit rates are then used to construct “survival in the compensation schemes” estimates for each of the types of innovative firms. Figure 5 demonstrates “survival” estimates based on the parametric duration model, with results presented in Table 5. We also compare them to the Kaplan–Meier “survival” estimates from the non-parametric model presented in (see Figure A1 in Appendix A). We see from both figures that “strategic adapters” and “process developers” stayed longer in the compensation schemes (more of them “survived in the compensation schemes” until the end of the period), while “active R&D doers” and “knowledge absorbers” exited faster from the compensation schemes.
All in all, our results confirm that firms responded differently to the crises depending on their approaches to innovation prior to the crisis (after controlling for other firm characteristics). The next chapter presents a discussion based on our findings.
6. Discussion
This paper sheds light on which innovative Norwegian companies were most resilient to the economic crisis due to the COVID-19 pandemic. All Norwegian firms experienced a shock due to the overnight lockdown of Norwegian society in March 2020. There was great uncertainty as to how long the lockdown would last and whether it would be gradually relaxed. Using information on the use of different compensation schemes introduced by the Norwegian government, we test which firms were most resilient to this shock. Our main assumption is that only the most resilient firms neither used the compensation schemes related to loss of turnover or furloughed their employees. Further, we assume that in the long run, the more resilient user firms used the schemes for a shorter time than the less resilient.
The literature shows that a profound crisis, such as the COVID-19 pandemic, affects the environment in which firms navigate. A crisis may also cause a change in innovation patterns. For example, the financial crisis in the late 2000s changed the landscape and identikit of innovators from exploiting pre-existing capabilities, engaging in formal R&D and being well established, to being smaller, younger, not dependent on pre-existing capabilities and exploiting new opportunities and new markets [15]. Our main hypothesis is that pre-existing innovative capabilities do contribute to resilience to a crisis.
Our findings show that all firms were indeed affected by the initial shock. However, we also find differences as to which firms experienced a marked loss of turnover and furloughing (and therefore used the compensation schemes) and the duration of using the compensation with respect to their approach to innovation prior to the crisis. The main characteristic of the most resilient firms, i.e., those with the lowest probability of using compensation schemes, both at the beginning of and throughout the whole period of pandemic, is that they are “active R&D doers”. These are firms with innovation activities based on formal R&D activities; they often collaborate on R&D and innovation, they are no strangers to public measures supporting R&D and innovation activities, their main market tends to be outside Norway, and the novelty level of their innovation is also high (i.e., they introduce new products that are new to the marked outside Norway). This result is in line with previous empirical research that concludes that firms with regular R&D and innovation investment (measured as a high share of turnover) and collaboration with others are more likely to have the innovative capacity to adapt fairly quickly to the new reality [15].
Our results also indicate that “innovative suppliers” and “knowledge absorbers” used the compensation schemes to a lesser extent, and hence were more resilient to the crisis. “Innovative suppliers” are active users of intellectual property rights with a national or international market. “Knowledge absorbers”, on the other hand, have no formal R&D expenditure, and their main customer group is often public sector organisations, which is a possible explanation for why this non-R&D group was more resilient to the crisis than other innovative firms, at least by our measures.
Conversely, our results show that firms that are “strategic adapters” are least resilient firms, i.e., those with the highest probability of using compensation schemes, both at an early stage and throughout. They also had a greater tendency to furlough their employees as a short-term response to the lockdown in March 2020. According to the taxonomy used here, “strategic adapters” are firms that focus on high-quality products, improving existing products and trying to satisfy established customer groups. In other words, these firms focus on very incremental innovation. Notably, there is a lack of R&D and innovation activities in this particular group. The description indicates a lower level of innovation capacity and a lack of ability to adjust to new demands from the market. Moreover, the focus on more high-end products to an established group of customers seems to be a risky strategy in times of crisis when customers are less concerned with high quality and possibly quite expensive products.
Another group attempting to customise their products to their clients is the “customer-oriented service suppliers”. They are shown to be less resilient to the crisis in the short run and particularly exposed in the early stages of the pandemic. Results for later sub-periods indicate that this group was neither more nor less resilient than an average firm. The last group of firms that is shown to be less resilient to the crisis is the “hard-trying innovators”. These firms tried to be innovative before the crisis, but they find the innovation process difficult and score high on all type of factors that hamper innovation. Not surprisingly, these firms also struggled during the crisis.
To sum up, our results indicate that firms with higher innovation capacity, in terms of formal R&D activity on a regular basis and frequent collaboration on R&D and innovation with others, were more resilient to the crisis. Conversely, the group appearing to be least resilient to the crisis, the “strategic adapters”, clearly has a lower level of innovation capacity. In this respect, our results are supporting anticipation of Archibugi and Filippetti [15], who suggest that pre-existing capabilities are important factors enabling companies to be resilient in terms of innovation activities in response to crises.
Our results provide valuable insights for policymakers. R&D and innovation support schemes are often evaluated according to their ability to provide premium rents in the form of “higher than expected” growth, in terms of either value added or employment. However, these schemes also play a significant role in supporting R&D and innovation activities that build capacity. Capacity-building is not easy to measure, but it becomes evident in times of crisis. Our results indicate that “active R&D-doers”, who receive extensive public support for their R&D and innovation activities, were most resilient to the crisis, indicating that public support contributed to building capacity in these firms.
This paper also has some limitations, which at the same time can be seen as challenges for future research. At first, our study links degree of innovation capacity to resilience. However, other factors can also affect resilience, e.g., availability of “slack” resources (either financial or organisational) in the firm. With organisational slack firms are able to cope with, and take advantage of, sudden changes in demand, whereas financial slack allows firms to withstand crisis and change the direction of their investments [15]. Hence, the further extension of the model with other important factors for resilience would be interesting to explore. Second, the use of compensation schemes as a measure of resilience just indicates that the given firm had suffered from the negative impact of the crisis; it does not indicate how much it suffered. We have just exploited information that a firm had experienced a significant loss in turnover (i.e., at least 30 percent loss per month compared to the same month in 2019) or that it had furloughed employees but not how many. In the future, one might use more detailed information on changes in turnover and labour stock to study how negative the impact of the crisis was.
It is also important to keep in mind the specificities of Norway with respect to other countries in its response to the COVID-19 crisis. Comparisons with other countries given such specificities and replication of our analysis in a different context might be difficult. However, we believe that some of our ideas can be applied in the future when studying heterogeneity in the responses to the crises by either using similar measures (i.e., loss/increase in turnover and/or furloughing employees) given heterogeneity in the approaches to innovation. Finally, our results are relevant for the resilience to the specific type of crisis caused by pandemic and are not necessary representative for all types of crises. However, they are supporting the previous results on the importance of being innovative for the crisis resilience.
Summing up, the COVID-19 pandemic caused a major exogenous shock, and though it obviously caused a lot of despair, it also provided a unique opportunity to conduct new research. In this paper, we have used unique data covering firms’ activities up to February 2022, exploring their variation in approaches to innovation prior to the crisis. Further research on this topic should use newer CIS surveys to examine whether innovation patterns themselves have been affected by the crisis. For instance, to what extent have R&D and innovation investment been affected by the crisis for the different groups according to our taxonomy? Additionally, what firms have been most agile, increasing their R&D and innovation investment during the crisis? These are two examples of further research areas that will provide a better understanding of how the concepts of agility, resilience and firms’ innovative capabilities are related.
Author Contributions
Conceptualization, M.R. and M.S.M.; methodology, M.R.; software, M.R.; validation, M.R. and M.S.M.; formal analysis, M.R.; investigation, M.R. and M.S.M.; resources, M.R. and M.S.M.; data curation, M.R.; writing—original draft preparation, M.R. and M.S.M.; writing—review and editing, M.R. and M.S.M.; visualization, M.R.; supervision, M.R. and M.S.M.; project administration, M.R.; funding acquisition, M.R. and M.S.M. All authors have read and agreed to the published version of the manuscript.
Funding
This research was funded by the Research Council of Norway (grant number 316585).
Institutional Review Board Statement
Not applicable.
Informed Consent Statement
Not applicable.
Data Availability Statement
The data from the 2018 Norwegian Innovation Survey and on users of public support for businesses can be requested to Statistics Norway at https://www.ssb.no/en/data-til-forskning/utlan-av-data-til-forskere (accessed on 1 June 2022). The data on users of Business compensation scheme are also available at https://www.skatteetaten.no/kompensasjonsordning/innsyn/ for the period March–August 2020 (accessed on 1 June 2022), and at https://data.brreg.no/kompensasjonsordning/innsyn/ for the period September 2020–February 2022 (accessed on 1 June 2022). The data on users of Salary compensation scheme are available at https://www.skatteetaten.no/lonnstilskudd/ (accessed on 1 June 2022).
Acknowledgments
We thank the participants at the research seminar organised by the Institute for Social Research (ISF) in Oslo on 16 December 2021 and participants at the seminar organised by Innovation Norway in Oslo on 17 February 2022 for useful comments and suggestions. Responsibility for any errors and the views expressed are attributable solely to the authors.
Conflicts of Interest
The authors declare no conflict of interest.
Appendix A. Approaches to Innovation Based on CIS2018 for Norwegian Firms and other Supplementary Material
Table A1 describes eleven innovation patterns that were most common among Norwegian firms prior to the COVID-19 pandemic as identified by Capasso and Rybalka [12]. Their main assumption is that individual firms may practice different approaches to innovation, so that scores obtained by factor analysis may highlight which of the approaches are applied by the firm. A firm might also have very low or negative scores for all approaches to innovation, indicating that this particular firm does not perform any innovation activity. For more details on definition of indicators, factor loadings from each particular indicator into the factor and correspondence of identified approaches to innovation with sector-based taxonomies by Pavitt [25] and Miozzo-Soete [28], see Capasso and Rybalka [12].

Table A1.
Main characteristics for approaches to innovation based on CIS2018 for Norwegian firms.
| Approaches to Innovation | Main Characteristics |
|---|---|
| 1. Active R&D doers | Practise formal R&D activities on a regular basis (both intramural and extramural) Cooperate often with others Receive mainly public support for R&D and innovation Main market: outside Norway |
| 2. Process developers | High score on all types of process innovation Main strategy: improve existing goods or services Cooperate within own group on the local/regional level Innovation expenditures go mainly to machinery, equipment and software based on new technology |
| 3. Innovation suppliers | Use actively different types of IPR Sell, license out and exchange their own IPR to/with others Innovation expenditures go mainly to purchasing services from others Main market: not local/regional |
| 4. Strategic adaptors | Main strategies: focus on developing high-quality products, on improving existing products and on satisfying established customer groups Customise their products Implement machinery, equipment and software based on new technology |
| 5. Radical innovators | Conduct formal R&D activities on a regular basis Introduce product innovation with a high degree of novelty (new product on the national or international market) Engage in active patenting and license out their IPR Cooperate with customers outside Norway Main market: outside Norway |
| 6. Customer-oriented service suppliers | Main strategy: focus on customer-specific solutions Practise “co-creation” and “customisation” of their products Introduce service innovation with local/regional/national novelty Cooperate with private customers and the public sector |
| 7. Hard-trying innovators | Irregular R&D activity, innovation spending mainly on own personnel High score on all types of factors that hamper innovation Try to cooperate with competitors locally Introduce product innovation that is new to the firm or local market |
| 8. Knowledge absorbers | Actively use all knowledge acquisition channels Offer goods and services co-created with users, often public sector organisations Practise skills upgrading, regular brainstorming sessions, cross-functional work groups or teams No formal R&D activities or significant innovation expenditures and no innovation introduced Implement machinery, equipment and software based mainly on existing technology |
| 9. Innovation promisers | Have not introduced any innovation, but have plans to increase their innovation spending Have recently obtained funding (both private and public) for innovation Have some formal R&D activities Main strategy: focus on one or a small number of key goods or services Main marked: outside the EU |
| 10. Individual standard service suppliers | Main strategy: introduce new goods or services Oriented towards households and individuals as main customers Innovation spending mainly on own personnel Introduce service innovation with novelty at local/regional/national level Main market: Norway |
| 11. Early technology adopters | Invest in machinery, equipment and software based on new technology Expect reduction in innovation expenditures in the next period Have recently obtained funding for innovation through a loan Introduce new products that are new to the firm Cooperate with suppliers |
Source: Table 1 in [12]. https://doi.org/10.3390/businesses2010004 (accessed on 8 November 2022).
Figure A1.
“Survival” in the compensation schemes by approach to innovation and duration of compensation use based on the non-parametric duration model. March 2020–February 2022.
Figure A1.
“Survival” in the compensation schemes by approach to innovation and duration of compensation use based on the non-parametric duration model. March 2020–February 2022.

References
- OECD. The New Economy—Beyond the Hype; OECD: Paris, France, 2001.
- OECD. Innovation and Growth: Rationale for an Innovation Strategy; OECD: Paris, France, 2007.
- OECD. The Future of Productivity; OECD: Paris, France, 2015.
- Hall, B.; Lerner, J. The Financing of R&D and Innovation. In Handbook of the Economics of Innovation; Hall, B., Rosenberg, N., Eds.; North-Holland: Oxford, UK, 2010; pp. 609–639. [Google Scholar] [CrossRef]
- Muldur, U.; Corvers, F.; Delange, H.; Dratwa, J.; Heimberger, D.; Solan, B.; Vanslembrouck, S. A New Deal for an Effective European Research Policy: The Design and Impacts of the 7th Framework Programme; Springer: Dordrecht, The Netherlands, 2006. [Google Scholar]
- Mohnen, P.; Hall, B.H. Innovation and Productivity: An Update. Eurasian Bus. Rev. 2013, 3, 47–65. [Google Scholar] [CrossRef]
- Akpan, I.J.; Udoh, E.A.; Adebisi, B. Small business awareness and adoption of state-of-the-art technologies in emerging and developing markets, and lessons from the COVID-19 pandemic. J. Small Bus. Enterp. 2020, 34, 123–140. [Google Scholar] [CrossRef]
- Morgan, T.; Anokhin, S.; Laurel, O.; Wesley, F. SME response to major exogenous shocks: The bright and dark sides of business model pivoting. Int. Small Bus. J. 2020, 38, 369–379. [Google Scholar] [CrossRef]
- Thorgren, S.; Williams, T.A. Staying alive during an unfolding crisis: How SMEs ward off impending disaster. J. Bus. Ventur. Insights 2020, 14, e00187. [Google Scholar] [CrossRef]
- OECD. Oslo Manual 2018; OECD: Paris, France, 2018.
- Peters, B.; Dasch, B.; Hud, M.; Köhler, C. Employment and innovation in recessions: Firm-level evidence from European Countries. Ind. Corp. Chang. 2022, 31, 1460–1493. [Google Scholar] [CrossRef]
- Capasso, M.; Rybalka, M. Innovation Pattern Heterogeneity: Data-Driven Retrieval of Firms’ Approaches to Innovation. Businesses 2022, 2, 54–81. [Google Scholar] [CrossRef]
- Cumming, G.S.; Barnes, G.; Perz, S.; Schmink, M.; Sieving, K.E.; Southworth, J.; Binford, M.; Holt, B.D.; Stickler, C.; Van Holt, T. An exploratory framework for the empirical measurement of resilience. Ecosystems 2005, 8, 975–987. [Google Scholar] [CrossRef]
- Burnard, K.; Bhamra, R. Organisational resilience: Development of a conceptual framework for organisational responses. Int. J. Prod. Res. 2011, 49, 5581–5599. [Google Scholar] [CrossRef]
- Archibugi, D.; Filippetti, A. Innovation and Economic Crisis; Routledge: London, UK, 2012. [Google Scholar]
- Jansen, J.J.P.; Van Den Bosch, F.A.J.; Volberda, H.W. Managing Potential and Realized Absorptive Capacity: How do Organizational Antecedents Matter. Acad. Manag. J. 2005, 48, 999–1015. [Google Scholar] [CrossRef]
- Dimitropoulos, P.E. R&D investments and profitability during the crisis: Evidence from Greece. R&D Manag. 2020, 50, 587–598. [Google Scholar] [CrossRef]
- Makkonen, H.; Pohjola, M.; Olkkonen, R.; Koponen, A. Dynamic capabilities and firm performance in a financial crisis. J. Bus. Res. 2014, 67, 2707–2719. [Google Scholar] [CrossRef]
- Weaven, S.; Quach, S.; Thaichon, P.; Frazer, L.; Billot, K.; Grace, D. Surviving an economic downturn: Dynamic Capabilities of SMEs. J. Bus. Res. 2021, 128, 109–123. [Google Scholar] [CrossRef]
- IMF. World Economic Outlook, April 2020: The Great Lockdown; IMF: Washington, DC, USA, 2020. [Google Scholar]
- Schumpeter, J.A. Business Cycle: A Theoretical, Historical and Statistical Analysis of the Capitalist Process; McGraw-Hill: New York, NY, USA, 1939. [Google Scholar]
- Perez, C. After crisis: Creative construction. Open Democr. 2009, 5, 8–12. Available online: https://www.opendemocracy.net/en/how-to-make-economic-crisis-creative/ (accessed on 3 November 2022).
- Juergensen, J.; Guimón, J.; Narula, R. European SMEs amidst the COVID-19 crisis: Assessing impact and policy responses. J. Ind. Bus. Econ. 2020, 47, 499–510. [Google Scholar] [CrossRef]
- Simola, H. The Impact of COVID-19 on Global Value Chains; BOFIT Policy Brief 2/2021; Bank of Finland: Helsinki, Finland, 2021. [Google Scholar]
- Hermundsdottir, F.; Haneberg, D.; Aspelund, A. Anayzing the impact of COVID-19 on environmental innovations in manufactoring firms. Technol. Soc. 2022, 68, 101918. [Google Scholar] [CrossRef]
- Dosi, G. Technological paradigms and technological trajectories: A suggested interpretation of the determinants and directions of technical change. Res. Policy 1982, 11, 147–162. [Google Scholar] [CrossRef]
- Antonelli, C. Innovation, New Technologies: Financial Crisis, Corporate Reform and Institutional Transition; Routledge: Oxford, UK, 2002. [Google Scholar]
- Perez, C. Technological revolutions and techno-economic paradigms. Camb. J. Econ. 2010, 34, 185–202. [Google Scholar] [CrossRef]
- Schumpeter, J.A. The Theory of Economic Development; Harvard University Press: Cambridge, MA, USA, 1934. [Google Scholar]
- Schumpeter, J.A. Capitalism, Socialism and Democracy; Harper: New York, NY, USA, 1942. [Google Scholar]
- Freeman, C.; Clark, J.; Soete, L. Unemployment and Technical Innovation; Frances Pinter: London, UK, 1982. [Google Scholar]
- Pavitt, K. Sectoral patterns of technological change: Towards a taxonomy and a theory. Res. Policy 1984, 13, 343–373. [Google Scholar] [CrossRef]
- Malerba, F.; Orsenigo, L. Schumpeterian patterns of innovation. Camb. J. Econ. 1995, 19, 47–65. [Google Scholar]
- European Commission. Innobarometer; DG Enterprise and Industry: Brussels, Belgium, 2009.
- Lichtenthaler, U. Absorptive Capacity, Environmental Turbulence, and the Complementarity of Organizational Learning Processes. Acad. Manag. J. 2009, 52, 822–846. [Google Scholar] [CrossRef]
- Barney, J. Firm Resources and Sustained Competitive Advantage. J. Manag. 1991, 17, 99–120. [Google Scholar] [CrossRef]
- Nelson, R.R.; Winter, S.G. An Evolutionary Theory of Economic Change; Harvard University Press: Cambridge, MA, USA, 1982. [Google Scholar]
- Teece, D.; Pisano, G. The Dynamic Capabilities of Firms: An Introduction. Ind. Corp. Chang. 1994, 3, 537–556. [Google Scholar] [CrossRef]
- Teece, D.J.; Pisano, G.; Shuen, A. Dynamic Capabilities and Strategic Management. Strateg. Manag. J. 1997, 18, 509–533. [Google Scholar] [CrossRef]
- Miozzo, M.; Soete, L. Internationalization of services: A technological perspective. Technol. Forecast. Soc. Change 2001, 67, 159–185. [Google Scholar] [CrossRef]
- De Jong, J.P.; Marsili, O. The fruit flies of innovations: A taxonomy of innovative small firms. Res. Policy 2006, 35, 213–229. [Google Scholar] [CrossRef]
- Leiponen, A.; Drejer, I. What exactly are technological regimes? Intra-industry heterogeneity in the organization of innovation activities. Res. Policy 2007, 36, 1221–1238. [Google Scholar] [CrossRef]
- Rybalka, M. Hvilke Næringer Har Fått Mest i Kontantstøtte? (in Norwegian; What Industries Have Got Most Support via Business Compensation Scheme), News Article 12 June 2020, Statistics Norway, Oslo. Available online: https://www.ssb.no/teknologi-og-innovasjon/artikler-og-publikasjoner/hvilke-naeringer-har-fatt-mest-i-kontantstotte (accessed on 29 November 2022).
- Rybalka, M. The Innovative Input Mix: Assessing The Importance Of R&D and ICT Investments for Firm Performance in Manufacturing and Services; Discussion paper 801; Statistics Norway: Oslo, Norway, 2015.
- Holden, S.; Bjørnland, H.C.; von Brasch, T.; Løken, K.V.; Sæther, E.M.; Torstensen, K.N.; Torvik, R. COVID-19—Analyse Av økonomiske Tiltak, Insentiver for Vekst og Omstilling (in Norwegian; The Analysis of COVID-19–Related Economic Measures). Report for the Norwegian Ministry of Finance. 2020. Available online: https://www.regjeringen.no/contentassets/5be3089013d34ad0abf953f2f88ff343/covid-19--analyse-av--okonomiske-tiltak-insentiver-for-vekst-og-omstilling-26.-mai-20202.pdf (accessed on 29 November 2022).
- Heckman, J.J.; Borjas, G. Does Unemployment Cause Future Unemployment? Definitions, Questions and Answers from a Continuous Time Model of Heterogeneity and State Dependence. Economica 1980, 47, 247–283. [Google Scholar] [CrossRef]
Figure 1.
Number of firms that used (a) business compensation scheme and (b) salary compensation scheme (in total and represented in CIS2018). March 2020–February 2022.
Figure 1.
Number of firms that used (a) business compensation scheme and (b) salary compensation scheme (in total and represented in CIS2018). March 2020–February 2022.

Figure 2.
Share of users of COVID-19-related compensation by duration of use.

Figure 3.
Average predicted probabilities of use of COVID-19-related compensation by sub-period and approach to innovation. March 2020–February 2022. Averages are calculated for the 10 percent of firms with highest scores for their respective approaches to innovation.
Figure 3.
Average predicted probabilities of use of COVID-19-related compensation by sub-period and approach to innovation. March 2020–February 2022. Averages are calculated for the 10 percent of firms with highest scores for their respective approaches to innovation.

Figure 4.
Average predicted exit rates from compensation schemes by duration and user cohort. March 2020–February 2022.
Figure 4.
Average predicted exit rates from compensation schemes by duration and user cohort. March 2020–February 2022.

Figure 5.
“Survival” in the compensation schemes by approach to innovation and duration. March 2020–February 2022. Based on the average predicted exit rates among the 10 percent of firms with the highest scores for their respective approaches to innovation.
Figure 5.
“Survival” in the compensation schemes by approach to innovation and duration. March 2020–February 2022. Based on the average predicted exit rates among the 10 percent of firms with the highest scores for their respective approaches to innovation.

Table 1.
Description of COVID-19-related compensation schemes for businesses in Norway used in the analysis.
Table 1.
Description of COVID-19-related compensation schemes for businesses in Norway used in the analysis.
| Name (Original Name in Parentheses) | Description | Responsible Agency | Available in the Period |
|---|---|---|---|
| Business compensation scheme (Kompensasjonsordningen for næringslivet) | Applied to enterprises with a significant loss of turnover, i.e., 30 percent loss or higher per month compared to the same month in 2019, due to the COVID-19 situation (20 percent in March 2020) | The Norwegian Tax Administration/The Brønnøysund Register Centre (the latter from January 2021) | March 2020– February 2022 |
| Compensation up to 50–70 percent of unavoidable costs (80–90 percent as of March–April 2020) | |||
| Salary compensation scheme (Lønnsstøtteordningen) | Applied to enterprises with a pronounced loss of turnover. i.e., 20 percent loss or more per month compared to the same month in 2019, due to the COVID-19 situation | The Norwegian Tax Administration | 3 periods: July 2020– December 2020 March 2021– August 2021 December 2021– February 2022 |
| At least 40 (50) percent of turnover is obtained by establishments that are affected (in)directly by infection control measures. (The government developed a detailed list with definitions and examples of what could be treated as direct and indirect effects of the pandemic. All these descriptions are available in Norwegian on the government website www.regjeringen.no (accessed on 11 April 2022), but it is beyond the scope of this paper to go into these details) | |||
| Covers up to 80% of wage costs (or NOK 30,000 per month per person) for permanent employees to keep them active at work instead of being furloughed. (The highest amount of support was given in cases of 100% loss of turnover, overwise the following formula was used to calculate the amount of support per employee: [3000 + (30,000 − 3000) × (turnover loss − 20%)/(100% − 20%)]) | |||
| Salary compensation for furloughed employees (Lønnskompensasjon til permitterte) | Applied to employees who were furloughed due to the COVID-19 situation | Norwegian Labour and Welfare Administration (NAV) | March 2020– August 2020 |
| Compensation for wages for the first 20 days of being furloughed | |||
| First 2 days are paid by the firm, 18 days are paid by NAV |
Table 2.
Description of size, age and share of skilled employees in firms in the final sample.
| Firm Characteristic | Obs | Mean | Std. Dev. | Min | Median | Max |
|---|---|---|---|---|---|---|
| Number of employees | 6108 | 98 | 383 | 5 | 32 | 17,998 |
| Turnover (mill. NOK) | 6108 | 496 | 5595 | 0 | 6 | 412,000 |
| Firm age (in years) | 6108 | 22 | 16 | 2 | 20 | 177 |
| Share of high-skilled empl. | 6108 | 0.70 | 0.22 | 0 | 0.73 | 1 |
Table 3.
Descriptive statistics for firms’ first and last use of compensation schemes.
| Sub-Period of First | Sub-Period of Last Observed Use of Schemes | |||||||||||
|---|---|---|---|---|---|---|---|---|---|---|---|---|
| Use of Schemes | Total | 1 | 2 | 3 | 4 | 5 | 6 | 7 | 8 | 9 | 10 | 11 |
| 1. March–April 2020 | 1080 | 268 | 175 | 119 | 25 | 53 | 95 | 68 | 40 | 27 | 8 | 202 |
| 2. May–June 2020 | 90 | 33 | 23 | 8 | 8 | 7 | 2 | 2 | 2 | 1 | 4 | |
| 3. July–August 2020 | 82 | 48 | 5 | 8 | 5 | 1 | 3 | 2 | 1 | 9 | ||
| 4. September–October 2020 | 66 | 13 | 25 | 13 | 2 | 5 | 3 | 2 | 3 | |||
| 5. November–December 2020 | 29 | 16 | 4 | 2 | 3 | 0 | 2 | 2 | ||||
| 6. January–February 2021 | 31 | 22 | 3 | 0 | 2 | 3 | 1 | |||||
| 7. March–April 2021 | 12 | 5 | 1 | 3 | 0 | 3 | ||||||
| 8. May–June 2021 | 1 | 0 | 1 | 0 | 0 | |||||||
| 9. July–August 2021 | 1 | 1 | 0 | 0 | ||||||||
| 10. September–November 2021 | 5 | 3 | 2 | |||||||||
| 11. December 2021–February 2022 | 13 | 13 | ||||||||||
| Total | 1410 | 268 | 208 | 190 | 51 | 110 | 146 | 83 | 54 | 41 | 20 | 239 |
Table 4.
Estimation results for probability of use of COVID-19-related compensation by sub-period. March 2020–February 2022.
Table 4.
Estimation results for probability of use of COVID-19-related compensation by sub-period. March 2020–February 2022.
| Sub-Period | ||||||||||||
|---|---|---|---|---|---|---|---|---|---|---|---|---|
| Variable | March–April 2020 | May–June 2020 | July–August 2020 | September–October 2020 | November–December 2020 | January–February 2021 | March–April 2021 | May–June 2021 | July–August 2021 | September–November 2021 | December 2021–February 2022 | The Whole Period |
| Approaches to innovation: | ||||||||||||
| 1. Active R&D doers | −0.556 *** | −0.512 *** | −0.298 *** | −0.213 * | 0.01 | −0.524 *** | −0.369 ** | −0.159 | −0.388 * | −0.06 | −0.228 | −0.488 *** |
| 2. Process developers | 0.059 | −0.026 | −0.01 | −0.028 | 0.024 | 0.034 | 0.134 | −0.045 | 0.041 | 0.019 | 0.264 ** | 0.046 |
| 3. Innovation suppliers | −0.122 * | −0.150 ** | 0.098 | −0.013 | −0.019 | −0.153 * | −0.076 | 0.057 | −0.066 | −0.453 ** | −0.205 | −0.133 ** |
| 4. Strategic adapters | 0.170 *** | 0.207 *** | 0.160 ** | −0.003 | 0.135 * | 0.212 ** | 0.184 * | 0.132 | −0.051 | 0.424 * | 0.730 *** | 0.137 ** |
| 5. Radical innovators | −0.027 | 0.033 | 0.045 | 0.021 | 0.127 * | 0.025 | 0.073 | 0.192 * | 0.267 ** | 0.092 | −0.098 | −0.011 |
| 6. Customer-oriented service suppl. | 0.163 *** | 0.190 *** | 0.157 *** | −0.001 | 0.058 | 0.046 | 0.041 | 0.071 | −0.065 | −0.153 | 0.183 * | 0.153 *** |
| 7. Hard-trying innovators | 0.132 *** | 0.086 | 0.164 *** | 0.111 * | 0.044 | −0.015 | 0.071 | 0.066 | 0.12 | 0.406 *** | 0.114 | 0.144 *** |
| 8. Knowledge absorbers | −0.150 ** | −0.04 | −0.054 | −0.03 | 0.018 | −0.037 | −0.146 | −0.13 | −0.033 | −0.103 | 0.266 ** | −0.140 ** |
| 9. Innovation promisers | −0.013 | −0.144 * | −0.137 | −0.042 | 0.002 | −0.115 | −0.06 | 0.095 | −0.283 | 0.151 | −0.207 | −0.025 |
| 10. Indiv. standard service suppl. | 0.082 | −0.032 | −0.051 | −0.229 *** | −0.165 ** | −0.127 | −0.042 | −0.192 * | −0.197 | −0.290 * | −0.118 | 0.041 |
| 11. Early technology adopters | 0.161 ** | 0.041 | −0.019 | 0.002 | 0.045 | 0.119 | 0.218 ** | 0.262 ** | 0.229 | 0.013 | 0.306 ** | 0.131 ** |
| Share of skilled employees | −0.537 *** | −0.290 ** | −0.036 | 0.105 | −0.2 | −0.485 *** | −0.191 | −0.073 | 0.493 | −0.117 | −0.298 | −0.571 *** |
| Number of observations | 6108 | 6102 | 6088 | 6068 | 6030 | 6014 | 5998 | 5987 | 5978 | 5954 | 5919 | 6108 |
| Constant term | −0.446 * | −1.257 *** | −1.741 *** | −2.179 *** | −1.813 *** | −1.341 *** | −1.732 *** | −1.853 *** | −2.304 *** | −1.963 *** | −2.518 *** | −0.333 |
| Log likelihood | −2183.2 | −1857.7 | −1520.2 | −1168.9 | −1215.7 | −1160.8 | −807.7 | −577.4 | −358.2 | −208.4 | −536.4 | −2563.7 |
| Pseudo R2 | 0.215 | 0.204 | 0.174 | 0.143 | 0.252 | 0.279 | 0.336 | 0.346 | 0.214 | 0.156 | 0.442 | 0.223 |
Notes: All regressions include dummies for firm size, age, industry and location and are estimated as a probit model in Stata. Dependent variable: binary indicator for use of COVID-19-related compensation schemes in the corresponding period. *** p < 0.01, ** p < 0.05, * p < 0.1.
Table 5.
Estimation results for probability of using COVID-19-related compensation together with furloughing by sub-period. March–August 2020.
Table 5.
Estimation results for probability of using COVID-19-related compensation together with furloughing by sub-period. March–August 2020.
| March–April 2020 | May–June 2020 | July–August 2020 | |||||||
|---|---|---|---|---|---|---|---|---|---|
| Variable | Compensation | Furloughing | P11 ^ | Compensation | Furloughing | P11 ^ | Compensation | Furloughing | P11 ^ |
| Approaches to innovation: | |||||||||
| 1. Active R&D doers | −0.616 *** | −0.336 *** | 0.059 | −0.571 *** | −0.460 *** | 0.013 | −0.346 *** | −0.311 *** | 0.010 |
| 2. Process developers | 0.059 | 0.012 | 0.168 | −0.021 | −0.047 | 0.037 | −0.05 | −0.036 | 0.021 |
| 3. Innovation suppliers | −0.130 ** | 0.007 | 0.135 | −0.147 ** | −0.016 | 0.035 | 0.024 | −0.039 | 0.023 |
| 4. Strategic adapters | 0.185 *** | 0.181 *** | 0.187 | 0.210 *** | 0.197 *** | 0.047 | 0.159 ** | 0.112 | 0.024 |
| 5. Radical innovators | −0.025 | −0.059 | 0.107 | 0.039 | −0.109 * | 0.023 | 0.042 | 0.043 | 0.016 |
| 6. Customer-oriented service suppliers | 0.144 *** | 0.084 ** | 0.152 | 0.172 *** | 0.034 | 0.034 | 0.138 ** | 0.093 | 0.022 |
| 7. Hard-trying innovators | 0.135 *** | 0.152 *** | 0.166 | 0.084 | 0.001 | 0.033 | 0.213 *** | 0.061 | 0.021 |
| 8. Knowledge absorbers | −0.186 *** | −0.05 | 0.092 | −0.09 | −0.031 | 0.026 | −0.155 ** | −0.142 * | 0.014 |
| 9. Innovation promisers | −0.012 | −0.113 * | 0.139 | −0.164 ** | −0.076 | 0.027 | −0.170 * | −0.061 | 0.014 |
| 10. Individual standard service suppliers | 0.069 | 0.129 *** | 0.141 | −0.032 | 0.052 | 0.031 | −0.114 | −0.045 | 0.015 |
| 11. Early technology adopters | 0.179 *** | 0.049 | 0.160 | 0.058 | 0.024 | 0.032 | −0.002 | −0.073 | 0.016 |
| Share of skilled employees | −0.520 *** | −0.500 *** | 0.059 | −0.227 * | −0.244 * | 0.013 | 0.031 | 0.22 | 0.010 |
| Number of observations | 6108 | 6102 | 6088 | ||||||
| Constant term | −0.069 | −1.421 *** | −2.062 *** | ||||||
| Rho | 0.569 *** | 0.292 *** | 0.373 *** | ||||||
Notes: All regressions include dummies for firm size, age, industry and location and were estimated according to maximum likelihood as a bivariate probit model in Stata, where the pair of random disturbance terms is assumed to be jointly i.i.d. and normally distributed, with rho being their correlation coefficient. Dependent variables: binary indicator for use of COVID-19-related compensation schemes in the corresponding sub-period in the first equation and binary indicator for furloughed employees in the corresponding sub-period in the second equation. ^ Average predicted propensities from the bivariate probit, where P11 refers to the combination [1,1], i.e., the firm has both used the compensation schemes for the marked loss of turnover and furloughed its employees in the corresponding sub-period. Averages are calculated for the 10 percent of firms with highest scores for their respective approaches to innovation. *** p < 0.01, ** p < 0.05, * p < 0.1.
Table 6.
Estimation results for different models of duration of compensation use. March 2020–February 2022.
Table 6.
Estimation results for different models of duration of compensation use. March 2020–February 2022.
| (1) Probit Models by Duration of Compensation Use | (2) Duration Model | |||||
|---|---|---|---|---|---|---|
| Approaches to Innovation | 1 Sub- Period | 2–3 Sub- Periods | 4–10 Sub-Periods | The Whole Period | Hazard Function for Exit | Hazard Ratios |
| 1. Active R&D doers | 0.056 | 0.190 | −0.187 | −0.025 | 0.125 | 1.133 |
| 2. Process developers | 0.078 | −0.185 * | 0.013 | 0.316 ** | −0.151 * | 0.860 * |
| 3. Innovation suppliers | −0.071 | 0.109 | −0.083 | −0.100 | 0.119 | 1.126 |
| 4. Strategic adapters | −0.010 | −0.182 | −0.060 | 0.546 *** | −0.234 ** | 0.791 ** |
| 5. Radical innovators | −0.151 | 0.069 | 0.128 | −0.071 | −0.043 | 0.958 |
| 6. Customer-oriented service suppl. | −0.107 | 0.027 | −0.018 | 0.183 | −0.057 | 0.945 |
| 7. Hard-trying innovators | −0.002 | −0.010 | −0.009 | 0.199 | −0.073 | 0.930 |
| 8. Knowledge absorbers | −0.164 | 0.135 | −0.068 | 0.283 * | −0.114 | 0.892 |
| 9. Innovation promisers | 0.183 | −0.005 | −0.115 | 0.106 | 0.021 | 1.021 |
| 10. Individual standard service suppl. | 0.234 ** | −0.116 | −0.052 | −0.192 | 0.110 | 1.116 |
| 11. Early technology adopters | 0.042 | −0.108 | −0.059 | 0.295* | −0.060 | 0.942 |
| Number of observations | 1392 | 1392 | 1392 | 1203 | 1410 | |
| Constant term | −0.065 | −1.377 ** | −0.626 * | −1.773 *** | 0.315 *** | |
| Log likelihood | −742.7 | −762.3 | −798.3 | −379.9 | −1550.2 | |
| Pseudo R2 | 0.117 | 0.076 | 0.037 | 0.302 | - | |
Notes: All regressions include a constant, share of skilled employees, dummies for firm size, age, industry and location and are estimated (1) as separate probit models and (2) as an exponential proportional hazard model in Stata. Dependent variables: (1) binary indicator for use of COVID-19-related compensation schemes during the respective number of sub-periods, i.e., 1, 2–3, 4–9 or 10–11 sub-periods; (2) duration of compensation use in number of sub-periods being equal from 1 to 11. *** p < 0.01, ** p < 0.05, * p < 0.1.
Disclaimer/Publisher’s Note: The statements, opinions and data contained in all publications are solely those of the individual author(s) and contributor(s) and not of MDPI and/or the editor(s). MDPI and/or the editor(s) disclaim responsibility for any injury to people or property resulting from any ideas, methods, instructions or products referred to in the content. |
© 2023 by the authors. Licensee MDPI, Basel, Switzerland. This article is an open access article distributed under the terms and conditions of the Creative Commons Attribution (CC BY) license (https://creativecommons.org/licenses/by/4.0/).
Share and Cite
MDPI and ACS Style
Rybalka, M.; Mark, M.S. Innovation Pattern Heterogeneity and Crisis Resilience. Businesses 2023, 3, 323-346. https://doi.org/10.3390/businesses3020021
AMA Style
Rybalka M, Mark MS. Innovation Pattern Heterogeneity and Crisis Resilience. Businesses. 2023; 3(2):323-346. https://doi.org/10.3390/businesses3020021
Chicago/Turabian StyleRybalka, Marina, and Michael Spjelkavik Mark. 2023. "Innovation Pattern Heterogeneity and Crisis Resilience" Businesses 3, no. 2: 323-346. https://doi.org/10.3390/businesses3020021