
Photocatalyzed Production of Urea as a Hydrogen–Storage Material by TiO2–Based Materials


1
Departamento de Ingeniería Química y Bioprocesos, Escuela de Ingeniería, Pontificia Universidad Católica de Chile, Av. Vicuña Mackenna 4860, Macul, Santiago 7820436, Chile
2
Escuela de Geología, Facultad de Ingeniería, Universidad Santo Tomás, Santiago 8370003, Chile
3
Departamento de Química Inorgánica, Pontificia Universidad Católica de Chile, Av. Vicuña Mackenna 4860, Macul, Santiago 7820436, Chile
4
Centro de Investigación en Nanotecnología y Materiales Avanzados (CIEN–UC), Pontificia Universidad Católica de Chile, Av. Vicuña Mackenna 4860, Macul, Santiago 7820436, Chile
5
Centro de Investigación en Energía UC (CE–UC), Pontificia Universidad Católica de Chile, Av. Vicuña Mackenna 4860, Macul, Santiago 7820436, Chile
*
Author to whom correspondence should be addressed.
Photochem 2022, 2(3), 539-562; https://doi.org/10.3390/photochem2030038
Submission received: 30 April 2022
/
Revised: 8 July 2022
/
Accepted: 9 July 2022
/
Published: 15 July 2022
(This article belongs to the Special Issue Synthesis and Application of Titania (TiO2))
Abstract
:This review analyzes the photocatalyzed urea syntheses by TiO2–based materials. The most outstanding works in synthesizing urea from the simultaneous photocatalyzed reduction of carbon dioxide and nitrogen compounds are reviewed and discussed. Urea has been widely used in the agricultural industry as a fertilizer. It represents more than 50% of the nitrogen fertilizer market, and its global demand has increased more than 100 times in the last decades. In energy terms, urea has been considered a hydrogen–storage (6.71 wt.%) and ammonia–storage (56.7 wt.%) compound, giving it fuel potential. Urea properties meet the requirements of the US Department of Energy for hydrogen–storage substances, meanly because urea crystalizes, allowing storage and safe transportation. Conventional industrial urea synthesis is energy–intensive (3.2–5.5 GJ ton−1) since it requires high pressures and temperatures, so developing a photocatalyzed synthesis at ambient temperature and pressure is an attractive alternative to conventional synthesis. Due to the lack of reports for directly catalyzed urea synthesis, this review is based on the most prominent works. We provide details of developed experimental set–ups, amounts of products reported, the advantages and difficulties of the synthesis, and the scope of the technological and energetic challenges faced by TiO2–based photocatalyst materials used for urea synthesis. The possibility of scaling photocatalysis technology was evaluated as well. We hope this review invites exploring and developing a technology based on clean and renewable energies for industrial urea production.
1. Introduction
Synthetic nitrogen–based fertilizers such as urea (CO2(NH2)2) have become essential for intensive agriculture and global food production. The industrial production of urea began in the 1920s with the development of the Bosch–Meiser process, and since then, its global demand has been increasing year after year. Approximately 90% of urea is used as a fertilizer, and the remaining percentage represents its uses as an additive in different industries. Urea can be used as a ruminant feed additive [1,2] or chemically synthesized to make urea–based herbicides or pesticides [3,4,5]. Other non–fertilizer uses of urea include manufacturing plastic materials, additives in fire retardants, tobacco products, some wines, and the cosmetic industry [6]. Urea is even used in fuels, helping reduce NOx gases in combustion engines through selective catalytic reduction (SCR) systems [7,8]. However, one of the most exciting uses of urea is in energy storage technology because urea can be considered a hydrogen and ammonia storage material.
Previous research has widely documented different energy storage technologies, their classifications, properties, and applications [9,10,11]. A convenient energy storage technology is chemical energy storage (CES), which can use reversible chemical reactions to store and use energy. Most studies on CES technologies are based on hydrogen energy storage (HES) because hydrogen gas (H2) is considered a clean energy carrier [12]. The combustion of hydrogen with oxygen produces water vapor, and from the reverse reaction, it is possible to produce green hydrogen:
CES allows the indirect availability of hydrogen, as it occurs in aqueous solutions of ammonia (NH3) or methanol (CH3OH). Unlike carbon–based hydrogen–storage substances, nitrogen compounds can develop cleaner combustion because their reaction products are nitrogen (N2), water, and a low concentration of CO2, as in the case of urea (CO(NH2)2) combustion [13,14]:
The energy interest in urea arises when it simultaneously considers its capacity to store ammonia (52.7 wt.%) and hydrogen (6.71 wt.%). There are also other hydrogen–storage compounds with a higher percentage of hydrogen than urea, such as ammonia (17.6 wt.%), hydrazine (11.2. wt.%), and methanol (12.6 wt.%) or cyclohexane (7.2 wt.%), which could be like liquid fuels. However, they still face problems about safety because they are flammable, toxic, or environmentally hazardous substances [15]. Urea, on the other hand, has better properties than some liquid fuels, such as energy density (16.9 MJ L−1) and high solubility (1079 g L−1), and it also overcomes the disadvantages of toxicity and volatility [16]. Urea is a stable compound at room temperature and atmospheric pressure, non–flammable, crystallizable, and storable in granules or pellets, allowing easy and safe storage and transportation [15].
Urea is an interesting candidate for alternative fuels since it reaches the goals set by the United States Department of Energy (US DOE), which has defined requirements that hydrogen–storage materials must meet to be used as fuels [17]. Some goals of the US DOE projected for the year 2025 for hydrogen–storage materials include [18]:
- -
- High storage capacity, a minimum of 6.5 wt.% of H2 abundance, and 50 g L−1 of H2 availability in the material;
- -
- Low cost, less than USD 266 per kilogram of hydrogen;
- -
- Operating ambient temperature between −40 °C and 60 °C;
- -
- Low toxicity, non–explosive, and possibly inert storage for water and oxygen.
Therefore, urea is an attractive alternative for fuel applications, suitable for electro–oxidation systems such as direct combustion cells where urea degradation produces non–toxic compounds such as CO2, N2, and H2, according to Equation (2) [14]. Moreover, it is possible to use urea (U) mixed with ammonium nitrate (NH4NO3, AN) to produce fuel (UAN fuel), which consists of 60% AN, 15% urea, and 25% water by mass, generating a gas effluent composed of 73% water, 21.6% N2, and 5.4% CO2 [19]. Another fuel option is a mixture of ammonium hydroxide (NH4OH, AH) with urea (AHU fuel) with relatively clean combustion effluent products [13]. The combustion reactions for UAN and AHU are presented below:
Despite the advantages and possible uses of urea as a hydrogen–storage material and fuel, its use has not yet been massively exploited. One of the main problems is that its industrial production continues to be energy–intensive. This paper revisits one of the least explored urea synthesis alternatives, photocatalyzed synthesis by TiO2–based materials. Few studies have investigated the photocatalyzed synthesis of urea using TiO2–based materials, which were analyzed in this review, evaluating the systems used, amounts of products formed, difficulties, advantages, disadvantages, and projections of this technology as a natural alternative to industrial production.
2. Industrial Synthesis of Urea and Alternative Syntheses
The industrial production of urea from CO2 and NH3 began in 1922 with the development of the Bosch–Meiser process. According to this process, about 0.750 tons of CO2 must be consumed to produce a ton of urea. However, urea is not recognized as a storage or capture species of CO2 since 2.27 tons of CO2–eq are released per ton of CO2 [20]. Nowadays, the industrial process continues to use the same reactions tied to a pressure higher than 100 atm and temperatures above 170 °C to form ammonium carbamate, which subsequently dehydrates to generate urea and water [21] as presented in the following reactions:
There are few reports of urea synthesis under ambient conditions. A proposed alternative to industrial synthesis is to form urea by negative corona discharge in the gas phase, in which electronegative ammonia anions and radicals can reduce CO2 into solid urea with an 82.16% yield at 1 atm and 20 °C [22]. Catalysts such as hematite (–Fe2O3) nanowires [23], zinc oxide (ZnO) [24], and cupric oxide (CuO) [25] have been used to produce urea as well. The catalysts as –Fe2O3 adsorb H2, N2, and CO2 to form urea under the influence of magnetic fields with high yield from >600 ppm to 11,243 ppm depending on catalyst, gas flow rates, and magnetic field. In terms of the use of catalysts, transition metals such as palladium (Pd), nickel (Ni), ruthenium (Ru), cobalt (Co), rhodium (Ro), and gold (Au), among others, have been used to convert amines into urea by oxidative carbonylation [26], and techniques such as catalysis in ionic liquids [27,28,29]. These syntheses are more sustainable alternatives to the reagent phosgene (COCl2) used for synthesizing compounds from amines such as urea and its derivatives. However, they have not yet been used at industrial levels.
Phosgene has been used to produce urea and urea–based compounds. This powerful reagent is used to generate carbonyl groups due to its highly electrophilic center, which is nucleophilically attacked by alcohols and amines, allowing the formation of compounds of agrochemical interest, such as urea [30], as described in the following reaction:
Although the compounds synthesized with phosgene show good yields (60–90%), it is a highly toxic compound, and the Chemical Weapons Convention has strictly regulated its use and manufacturing. Phosgene was even used as a chemical weapon in World War I (1914–1918), known as “white star”. Nowadays, phosgene substitutes have been used to design new synthesis routes to urea or urea derivatives. Some alternatives to phosgene have been catalysts or reagents such as dimethyl carbonate, dimethyl sulfate, ethylene carbonate, bis(4–nitrophenyl) carbonate, 1–1–carbonylbisimidazole, S,S–dimethyldithiocarbonate, among others [27,31,32]. However, these alternative syntheses have not been developed on an industrial scale for urea.
The electrochemical synthesis of urea has shown a high potential to be considered an alternative to industrial production. The first report was presented in 1995 by M. Shibata, K. Yoshida, and N. Furuya [31]. Their work opened a new field of exploration for this type of synthesis with the main advantage of controlling the electrochemical potential for forming urea from nitrate ions (NO3−) as a nitrogen source and CO2 as a carbon source. However, electrochemical synthesis still has the disadvantage of the costs of the metals used for the electrode coating, such as gold (Au) or platinum (Pt). Additionally, a lack of information on the selectivity or formation of by–products in the reports presented for urea synthesis has not allowed an objective evaluation of the scalability of this technology.
The production of urea from urine is considered a possible sustainability synthesis [32,33] since a human excretes 1.5 L per day of urine with an average urea concentration of 22–23 g per liter of urine [15]. Still, the main challenge is separating and stabilizing the urea from feces and other components in the wastewater. Another sustainable approach to urea production is using bacteria that catabolize the arginine [34,35]. Although urea production from urine could be a viable alternative route, further development of this technology is still required, especially in optimizing substrate stabilization.
Recent proposals for urea production consider industrial systems powered by solar and wind energy as sustainable alternatives [36,37,38] or biomass as NH3 and CO2 sources [39]. However, these systems produce energy from non–conventional renewable sources to power cells and reactors used for urea synthesis, which continue to be based on the classical industrial synthesis of carbamate formation and subsequent dehydration (see Equations (6) and (7), respectively).
Few studies propose using direct solar or radiant energy for urea synthesis by photocatalysis. One of the latest publications in this field presents the simultaneous photocatalyzed reduction of NH3 and CO2 on palladium nanoparticles with promising results [40]. This review analyzes a hardly explored alternative route to industrial urea synthesis: photochemical production using TiO2–based materials. We revisit the papers that have reported the simultaneous photochemical reduction of CO2 and nitrogen species such as NH3, NO3−, NO2−, or N2 to form urea using TiO2 surfaces. It has been observed that urea generation by photocatalysis can be performed at ambient pressure and room temperature, emerging as an attractive and viable alternative to developing and evaluating the current alternative syntheses.
3. Developments in the Photocatalyzed Production of Urea Using TiO2–Based Materials
Urea production by photocatalysis was first reported in 1998 by S. Kuwabata, H. Yamauchi, and H. Yoneyama [41]. This research group presented the simultaneous reduction of CO2 and nitrate ion (NO3−) using titanium dioxide nanocrystals (Q–TiO2) with sizes ranging from 1.0 to 7.5 nm, which were immobilized in a film of polyvinylpyrrolidone gel (Q–TiO2/PVPD). A 500 W high–pressure mercury arc lamp was used as a light source for the experiments, in which wavelengths below 300 nm were removed with a glass filter.
S. Kuwabata et al. [41] reported a concentration of about 1.9 mM urea in a 5 h photocatalysis using a Q–TiO2/PVPD film in polypropylene carbonate (PC) solutions saturated with CO2 in the presence of LiNO3 and using 2–Propanol as an electron donor species. However, when using Q–TiO2 colloidal and TiO2 P–25 colloidal, under the same conditions, they obtained an approximate concentration of 7.3 × 10⁻² mM and 3.3 × 10⁻² mM, respectively.
The results obtained by the Q–TiO2/PVPD film were promising since a lower concentration of urea was expected as a product because of the belief that the use of the Q–TiO2 photocatalyst particles fixed in a polymeric film reduces the area exposed to the solution as opposed to using suspended photocatalyst particles. S. Kuwabata et al. [41] justified their results by studying the photo–oxidation of the urea formed, determining that urea and 2–propanol compete for active sites on the surface of Q–TiO2, degrading and decreasing their concentration in the solution. According to research, using Q–TiO2 in suspension increases the collision frequency and interaction between urea and the catalyst surface. The interface interaction generates a more significant reaction and increases the degradation of the already–formed products.
However, the concentration of the products formed by the urea degradation via photo–oxidation does not contribute directly to the secondary reactions leading to by–products such as methanol, ammonia, acetone, and hydrogen. The concentrations observed for the by–products remain proportional to urea formation, as shown in Table 1, whose results were obtained after photoreductions were made for 5 h.
S. Kuwabata et al. [41] used reduced species such as NH2OH or NO2, replicating the experimental conditions for the Q–TiO2/PVPD film, reaching urea concentrations close to 5.6 and 2.9 mM, respectively, in 1 h. These results concluded that the limiting step of photocatalyzed urea production is the formation of reduced NO3− ions species.
B.-J. Liu, T. Torimoto, and H. Yoneyama [42] subsequently generated urea reaching concentrations of 3 mM using a film of TiO2 nanocrystals embedded in SiO2 matrices (Q–TiO2/SiO2). This experiment proposed the photochemical reduction of CO2 saturated in a LiNO3 solution, using 2–propanol as an electron donor. The system was irradiated for 5 h with a 500 W mercury arc lamp.
B.-J. Liu et al. [42] reported that urea selectivity regarding other products, such as formate (HCO2−) and carbon monoxide (CO), is influenced by the type of solvent used in the reaction and its dielectric constant (see Table 2). This research group previously reported a systematic study of the photoinduced reduction of CO2 in solvents such as carbon tetrachloride, dichloromethane, 2–propanol, ethylene glycol monoethyl ether, acetonitrile, sulfolane, propylene carbonate, and water, obtaining in this last one a complete reduction of CO2 to formic acid [43].
The results presented by B.-J. Liu et al. [42] showed that the NO3− ion reduction reaction is the determining step in producing urea and NH3 as synthesis products. Urea and NH3 concentrations increase by increasing the concentration of NO3− as opposed to the concentration of HCO2− that remained relatively constant. Similar results were presented by S. Kuwabata et al. [41] using TiO2 particles supported on a surface, justifying that the Q–TiO2/SiO2 film has a higher photocatalytic activity since the particles have a negative change in the edge of the conduction band caused by the effect of the quantization and the specific surface area estimated at 290 m2 g−1.
In 2005, a new proposal for the photochemical synthesis of urea arose at the hands of D.G. Shchukin and H. Möhwald [44]. They proposed using microenvironments to synthesize complex compounds, allowing dimensions, structure, and morphology specificity. These microenvironments correspond to polyelectrolyte capsules, consisting of polyamine hydrochloride (PAH) and polystyrene sulfonate (PSS), which allow permeability to inorganic macromolecules and nanoparticles, depending on the solvent, pH, or ionic strength of the means. Under this methodology, it was possible to perform the photocatalyzed urea synthesis on TiO2 nanoparticles, using CO2 and NO3− ions as a precursor, where polyvinyl alcohol (PVA) fulfills the role of electron donor. Figure 1 shows an assembly scheme for these spherical microreactors.
D.G. Shchukin and H. Möhwald [44] reported a concentration close to 1.1 mM of urea, using spherical microreactors with a 2.2 μm diameter in an aqueous solution saturated with CO2 in the presence of 0.1 M NaNO3, followed by 5 h of irradiation with a 200 W Xg–He lamp. It was possible to observe a slight increase in urea concentration at 1.7 mM when incorporating copper (Cu) nanodeposits on TiO2 particles. A simultaneous photocatalysis was expected both on the TiO2 particles and on the surface of the Cu, which increased the reduction of the NO3− to NH4+ ions, considered the determining step for urea formation.
The results of D.G. Shchukin and H. Möhwald [44] suggest that the main advantage of using microreactors is controlling reagents in the volume determined for the reaction. Furthermore, the confinement and the ability to control the input of substances give the possibility of modeling biochemical processes of living cells.
Later, E.A. Ustinovich et al. [45] reported urea synthesis by the photoinduced reduction of CO2 in the presence of NO3− ions, using TiO2 stabilized in perfluorodecalin (PFD:TiO2) emulsions and 2–propanol as electron donor species. A 120 W high–pressure mercury vapor lamp was used as a light source. After one hour of irradiation, the concentration of urea was 0.54 mM and 1.1 mM using PFD:TiO2 and PFD:TiO2/Cu, respectively. The high efficiency and selectivity observed in urea formation, as observed in Table 3, are attributed to a high concentration of CO2 in the oleic phase, granting favorable conditions to stabilize intermediary species, allowing the formation of C–N bonds [46].
E.A. Ustinovich et al. [45] demonstrated that PFD emulsions could dissolve a considerable amount of O2 and CO2, 45 mL/100 mL and 134 mL/100 mL, respectively, which usually demand high pressures. This methodology allowed the accumulation of different organic compounds, whether substrates, intermediates, or products, favoring light–induced reactions.
It is important to note that E.A. Ustinovich et al. [45] established that using concentrations higher than 1.0 M NaNO3 as a source of N does not significantly increase urea concentration. Hence, this concentration is the saturation limit value of NaNO3 for solutions used in photocatalyzed urea production.
One of the latest publications on photocatalyzed urea production using TiO2 was presented by B. Srinivas et al. [21]. The research group studied urea synthesis using KNO3 solutions as a source of N in the presence of 2–propanol or oxalic acid as electron donor, producing CO2 in–situ as a reaction product. After 6 h of UV irradiation, using a 250 W high–pressure mercury lamp, it was possible to obtain urea concentrations close to 0.20, 0.10, and 0.31 mM, using TiO2, iron titanate (Fe2TiO5), and iron titanate supported on proton exchange zeolite Socony Mobil–5 (Fe2TiO5/HZSM–5) as a photocatalyst, respectively.
B. Srinivas et al. [21] showed that using iron titanates supported in HZSM–5 promotes the separation of photoinduced charges, enhancing urea selectivity. Additionally, zeolites presented high adsorption of CO2 and NH3, which, according to the research, was produced in–situ on the catalyst surface. The condensation for urea formation is facilitated by the adsorption property in the zeolite that inhibits the polymerization of the products.
In a recent report by H. Maimaiti et al. [47], the photocatalyzed synthesis of urea was performed on carbon nanotubes (CNTs) with Fe/Ti3+–TiO2 composite as catalyst (Ti3+–TiO2/Fe–CNTs). This research group has established that urea synthesis from the simultaneous reduction of N2 and CO2 in H2O is related to the arrangement of Ti3+ sites and oxygen vacancies on the catalyst surface. The Ti3+ sites act as the active center of N2 and oxygen vacancies acts as the active center for CO2 on the Ti3+–TiO2 surface. H. Maimaiti et al. [47] state that urea formation is achieved by adsorption and activation, converting the N2 and CO2 molecules into a cyclic intermediate that is transformed into two urea molecules. This research reports a urea yield of 710.1 mol L−1 g−1 after 4 h of reaction using a 300 W high–pressure mercury lamp as the light source.
Although the trend indicates the use of photocatalysts fixed on a surface which enables better control over the reaction solution, and then the separation of the catalyst from the reaction solution, H. Maimaiti et al. [47] propose using a catalyst supported on CNTs to improve the dispersion in water. However, the catalysts used have an Fe core, which allows their rapid and simple separation from the reaction solution using an external magnetic field.
Table 4 summarizes the highest urea concentration obtained by each reported work, according to the experimental set–up proposed by each author mentioned above. Since the photocatalyzed urea syntheses were performed under different experimental conditions, a direct comparison of the results obtained is limited. Table 4 shows the urea concentration normalized by the irradiation time used in each work. The reaction yields or quantum yields could not be considered for comparing results because these data were not reported in most of the works studied.
When urea concentration is normalized by hours of irradiation, it is possible to observe how the solution or support used plays an essential role in stabilizing the reagents and intermediate species. For example, PFD emulsions allow the dissolving of high concentrations of gaseous substrates at room pressure, increasing the availability of CO2, favoring urea formation, and stabilizing TiO2 particles. Moreover, using reduced species such as NO or NH2OH as a nitrogen source favors the generation of intermediate species, modifying selectivity by by–products, as S. Kuwabata et al. [41] reported.
Contrary to what was thought, using supported TiO2 particles, in some cases, favors urea synthesis. Modifying the size of the supported particles allows changing the semiconductor band–gap. It should be considered that reactions on supported catalysts are governed by diffusion phenomena and can be controlled more easily. In addition, the use of support surfaces makes it possible to avoid particle aggregation in solution, reduce irradiation shielding, and prevent reactions depending on particle collision phenomena, allowing, in turn, better adsorption and even increasing the spatial selectivity of reactants and products.
The above is critical in scaling these technologies because separating and recovering a suspended catalyst from an aqueous solution using filtration systems or more complex unit operations could increase production costs. The use of catalysts with magnetic properties that could be removed from the reaction solution by applying a magnetic field is a possible solution for the use of suspension catalysts.
The confinement of the reaction space in low–scale photoreactors such as microcapsules or microreactors allows the control of the diffusion, input, or output flow of reactants and products and the specificity of the synthesis, stereochemistry, and functionalization of the products formed. The spherical microreactors evaluated produce lower mobility of the compounds, enhancing the interaction between the reactant species and the photocatalyst particles and increasing the concentration of the desired products.
A constant flow of the gases used as a source of C and N is a relevant factor. Considering the low solubility of gases in aqueous media and the time necessary to perform the photocatalytic reduction studied, a high and constant concentration of C and N sources is required to optimize the urea production flow. As presented in Section 6 of this review, in many photocatalyzed system reports, the by–products tend to be the higher concentration.
Even though each experimental set–up proposed has an improvement or an innovation to the photocatalysis technology, there are still many edges to explore in urea synthesis photocatalyzed by TiO2–based materials.
4. Use of Titanium Dioxide in Urea Photocatalyzed Synthesis
TiO2 is an n–type semiconductor, widely used in photovoltaic cells, electrochemical sensors, biological applications, and environmental remediation, mainly for its chemical stability, optical/electronic properties, commercial availability, low cost, and low toxicity [48,49].
TiO2 is commonly found in three polymorphic forms: rutile, anatase, and brookite. Each crystal phase assembles as octahedra with six oxygen anions shared by three titanium (IV) cations. Each TiO2 crystal phase has a different shape, structure, density, and refractive index. In turn, metastable anatase and brookite structures can be thermally restructured into stable rutile. Although the rutile crystal phase has the highest structural stability [50], it is hard to find and is a challenge for industrial manufacturing [51].
Regarding the optical properties of TiO2, it has been determined that the refractive indexes for rutile and anatase phases are 2.7 and 2.5, respectively [50]. The values of index refraction for TiO2 are associated with the oxidized metals with the ability to scatter photons. Therefore, the rutile reflects light more efficiently [50,52]. However, the most remarkable property of TiO2 is its ability to absorb light in the ultraviolet (UV) region, which is approximately 4% of the solar spectrum [53,54,55].
TiO2’s ability to absorb UV light is due to its wide band–gap of 2.96, 3.02, and 3.2 eV for the brookite, rutile, and anatase, respectively [56]. When TiO2 absorbs UV light, an electron (e−) is excited by absorbing photonic energy (hv), equal to or greater than the semiconductor band–gap. This absorbed energy causes the photoexcited electron to jump from the valence band (VB) to the conduction band (CB), generating a hole (h+) in the valence band, as it is described in the following equation [56]:
Photoexcited electrons migrate to the surface, becoming reduction centers for electron–accepting species (A). Similarly, the holes generated in the VB can be considered oxidation sites for electron donor species (D). However, there is also the possibility that electrons and holes are recombined within the semiconductor and do not reach its surface, decreasing the efficiency of the catalyst, as shown in Figure 2A.
Catalyst doping and co–doping reduce the recombination phenomenon [56] and narrow the band–gap [57]. The modifications on the TiO2 surface can be: (1) The incorporation of a metallic element such as copper [58], iron [59], palladium [60], or gold [61], among others. Non–metallic doping is also possible, such as nitrogen [62], carbon [63], graphene [64], fluorine [65], or sulfur [66], among others. (2) Generating a composite or a heterojunction with another semiconductor with a lower band–gap, increasing the availability of photogenerated electrons since they can be stabilized in the lower energy conduction band and even increase the sensitivity of the system to the absorption of wavelengths of lower energy [67]. (3) Using a sensitizing dye (S), such as an organometallic compound, that can inject electrons into the semiconductor conduction band when the oxidant energy level of the dye (S*) is more negative than the conduction band [68]. Figure 2B illustrates the possibilities for doping the catalyst.
Figure 3 compares the charge transfer when TiO2 is doped with a metal or non–metal. Metallic species can narrow the band–gap of TiO2 and plasmon resonances of metal nanoparticles, allowing an increase in visible light absorption [57]. In addition, metals can act like an “electron trap” by capturing photogenerated electrons, increasing their surface availability and increasing the charge transfer efficiency [69]. A non–metal species can produce half–filled states below the CB, reducing the band–gap of the TiO2 [57].
On the other hand, the band–gap narrowing can be modified by intrinsic defects in TiO2 such as oxygen vacancies, Ti interstitials, Ti vacancies, impurities, and interfacial defects. Oxygen vacancies are the most common type of intrinsic defect in TiO2 and are formed by removing neutral O2 atoms from the TiO2 lattice, increasing the electrons, and creating Ti3+ ions in the lattice [57]. Therefore, oxygen vacancies are considered the main active sites in TiO2 and are relevant for the photocatalyzed reduction of CO2 and nitrogen compounds for urea synthesis, as will be discussed in Section 5.
Figure 4 shows the position of the bands for some semiconductors with a photochemical response relative to the CO2 reduction potentials [70] and NO3− [71]. The band position of TiO2 favors the formation of NH3 from NO3−, a necessary step for the formation of urea. Although other semiconductors can absorb radiant energy and perform the reduction of nitrate ions, not all have the same qualities as TiO2. The properties of TiO2, such as chemical stability, production costs, low toxicity, or oxygen vacancy, have made it one of the most widely used photocatalysts in the last two decades [72].
TiO2 nanoparticles suspended in aqueous solutions have proven efficient in degrading by photoinduction: organic compounds, drugs, cosmetics, and sometimes heavy metals [73]. However, according to the methodologies described in this review, these photochemical systems may have low control over reaction products [74], as in the case of urea formation. Furthermore, the development of the reactions can be affected by the loss of radiant energy, which must cross the bulk solution where the reactions are carried out until reaching the surface of the catalyst to achieve the photoexcitation of the electrons. Photocatalyzed systems require electron donor species, usually organic molecules [68], which are oxidized and could produce unwanted by–products, interfering with the expected reactions.
TiO2 and TiO2–based photocatalysts have been widely used for the photochemical conversion of both CO2 [70,74] and nitrogenous species such as NO3− [75,76,77,78,79,80], NO2− [81,82,83,84,85], N2 [86,87,88,89,90,91], and NH3/NH4+ [92,93,94], among others, to give rise to species of higher energy value or industrial interest. However, few studies have proposed the simultaneous photochemical conversion of CO2 and nitrogen species to obtain more complex compounds such as urea. Therefore, there are still possibilities to explore new synthesis routes for urea, which represents a high value for the industry by using TiO2–based materials.
5. Proposed Reactions and Mechanism for Photocatalyzed Urea Synthesis
Urea synthesis from NH3 and CO2 is known as the Bazarov reaction and is the basis of large–scale industrial production. The first reaction to form carbamate from NH3 and CO2 is fast and exothermic (see Equation (5)). The second reaction is a slow and slightly endothermic reaction of carbamate dehydration to form urea (see Equation (6)). The standard Gibbs free energy change at 25 °C and 1 atm for carbamate formation from NH3 and CO2 and subsequent dehydration are −23.8 kJ and +16.7 kJ, respectively [22]. The overall reaction of urea synthesis from NH3 and CO2 is exothermic, with a Gibbs free energy value of −7.1 kJ.
However, the reactions involved in urea synthesis have limitations, such as elevated temperatures (170–220 °C), because the reactions are performed only in a liquid phase [95]. Moreover, high pressure (125–250 bar) is needed to force the gaseous reagents into the reaction solution [95]. Adding, the NH3/CO2 ratio is another important parameter that is used in industrial synthesis in a higher than the stoichiometric ratio. Since NH3 is more soluble than CO2, it is possible to form an ammonia–enriched azeotrope NH3–CO2 (ratio greater than 3 mol mol−1), which favors the formation of urea and decreases the required pressure to perform the reaction [95]. Therefore evaluating new synthesis routes for urea at ambient temperature and pressure is an attractive challenge.
On the other hand, the mechanism of the photocatalyzed urea synthesis is not well known, mainly because of the limited development and scant reports. The work of S. Kuwabata et al. [41] suggests that urea should be formed by simultaneously reducing CO2 and NO3−. This reduction would require 16 e− to produce 1 mol of product, according to the following multi–electron reaction:
The following reactions for urea formation are also proposed, depending on the source of carbon or nitrogen used in the photocatalyzed synthesis studied:
Forming urea in each reaction is feasible by multi–electron reduction of the substrates. These reductions are possible thanks to the participation of semiconductors that allow this electron transfer. It has been reported that TiO2–based semiconductors used in quantum sizes have a photochemical activity more significant for multi–electron reactions [41,96]. It has been calculated that the crystal phase of pure anatase with a diameter of 3 nm can store an average of about six to nine electrons per TiO2 particle that are needed to photoreduce nitrate or ammonia using five or eight electrons, respectively [97]. The nitrate and ammonia reduction mechanism by electrons photoexcited from TiO2 are as follows in Scheme 1:
The agglomeration of nanoscale TiO2 can occur easily, decreasing its photocatalytic performance. Usually, carbon nanotubes are used to support the TiO2 to avoid agglomeration, allowing dispersion due to the one–dimensional morphology and stability. Moreover, the carbon nanotubes can improve the transfer of photoexcited electrons and the adsorption of electron acceptor molecules [98,99,100,101].
The importance of controlling the pH of the solution has also been reported, considering the requirement of H+ to reduce nitrogen species such as NO3− [102,103]. When TiO2 is used in a reaction solution with a pH value below the point of zero charge (pHpzc) of 6.25, electrostatic interaction between species such as NO3− and the surface of TiO2 is favored [78]:
D.G. Shchukin et al. [44] introduced that the limiting step for photochemical urea synthesis corresponds to reducing NO3− to NH4+. The ammonium formed should react with the CO•− radical ion to produce urea [20]. B. Srinivas et al. [21] also coined the concept of a radical ion according to the electron donor used, either oxalic acid or 2–propanol. Using oxalic acid, the formation of the radical ion CO2•−, a species with a high reduction power , is described in the following reaction:
The CO2 formed in Equation (14) diffuses in the aqueous solution producing carbonic acid, dissociating, and releasing protons into the solution. Afterward, NO3− ions can be adsorbed on the surface of TiO2, where the reduction occurred, to give rise to NH4+ by ten photogenerated electrons, depending on the reaction:
To avoid or reduce NH4+ formation, B. Srinivas et al. [21] propose using TiO2 supported in the zeolite. This support would give stability to the intermediate species of NO3− ion reduction by the following proposed mechanism in Scheme 2:
Regarding the by–products, S. Kuwabata et al. [41] propose that in photoinduced reduction reactions, in which 2–propanol (CH3CH(OH)CH3) is used as an electron donor, acetone (CO(CH3)2) is formed as the main product (Equation (16)). The formation of acetone is thermodynamically favored with a of reaction estimated at −1059 kJ mol−1
Using other carbon or nitrogen sources also allows obtaining a negative for forming acetone from 2–propanol. However, high energy may be required to overcome the activation energy barrier that involves a reduction with multiple electrons as the hydration of N2 to NH3, where its is −159 kJ mol−1 [41].
Besides, using 2–propanol as an electron donor implies the formation of the radical ion (CH3)2•C–OH, which could capture the holes of the valence band of TiO2, generating acetone, and in turn, it would remain reacted to produce CO2 in the solution, as described in the following reactions:
Subsequently, it is assumed that the CO2 and NH4+ species generated in–situ react to form ammonium carbamate, which by dehydration produces urea. B. Srinivas et al. [21] have proposed two speculative mechanisms to describe this process. In the first mechanism, amino acid formation and subsequent dehydration are formed. In the second mechanism, an amide will be obtained by hydroxylation with a hydroxyl radical, followed by an amination, carbamate form, and its subsequent urea dehydration. The proposed speculative mechanisms are developed in Scheme 3:
The use of zeolites to support photocatalyst particles would have the double function of adsorbing both reactants and products, given the stereochemical selectivity of zeolite. B. Srinivas et al. [21] report the polymerization and condensation of products from urea and ammonium are not observed when using zeolites as support, unlike using TiO2 in suspension where the products could continue to react, producing by–products. Scheme 4 shows the speculative mechanism of urea formation using TiO2 supported on zeolites.
Surface defects on TiO2 are essential as active and adsorption sites for CO2 and nitrogen compounds. H. Maimaiti et al. [47] suggest that Ti3+ sites and oxygen vacancies act as the active centers for N2 and CO2 molecules, respectively. Then, if N2 and CO2 are on the same plane, the photocatalysis may be activated simultaneously to form a C–N ring intermediate in situ and subsequently to form urea. Figure 5 shows the mechanism of photocatalyzed reduction for N2 and CO2 molecules on TiO2.
When the N2 molecule is absorbed on Ti3+ sites, the photoexcited electrons can form active intermediates such as –N=N–, –HN–NH–, H2N–. In turn, CO2 is bent by oxygen vacancy adsorption, and the C=O bond is broken. A C–H bond is formed by the effect of active electrons and protons. The Ti3+–TiO2 structure acts as a photocatalyst with double active sites [47]. Defects on the TiO2 surface such as oxygen vacancies can easily be formed by electron bombardment, sputtering, or the thermal annealing of the surface to high temperatures [104], but an excess of crystal defects increases the recombination rate of e−/h+ pair photoinduction [47].
The photocatalytic activity of TiO2 (anatase, rutile, and brookite) are governed by the defects present on the surface, which are not sensitive to their morphology and particle size; however, it strongly depends on the crystal phases. Figure 6 illustrates the dependence between band–edge position, e−/h+ pair photoinduction, and the crystal phases.
When electrons are trapped at the defects, their reactivity decreases, so the recombination with holes also reduces. Therefore the lifetime of holes becomes longer, then the photocatalytic oxidation activity increases. If the polymorphism of TiO2 is compared for the photocatalyzed reductions of nitrogen compounds and CO2 to form urea, the arrangement favoring reductions is required. Anatase exhibits the highest reduction activity since most electrons survive as free or shallowly trapped [105]. In turn, rutile shows higher oxidation activity, and brookite shows higher activity in several reactions because both electrons and holes are reactive.
H. Maimaiti et al. [47] reported modifications to the band–edge by incorporating defects by thermal annealing. The highest concentration of urea reported was obtained when TiO2 was calcined at 400 °C. Figure 7 shows the band–gap shift.
Despite approximating the mechanism of urea formation by the photoinduced reduction of CO2 and NO3−, there is still no complete clarity of its generation due to scarce reports. A possible way to study the mechanisms is to perform a free energy diagram through density functional theory (DFT) calculations for the proposed structures, as has been reported for electrocatalytic studies of urea formation from CO2 and NO3− [106]. However, in this type of study, it is necessary to consider the factors that favor the formation of urea by photocatalysis about the production of other by–products. This will depend as much on the experimental set–up, catalyst defects, carbon or nitrogen source, electron donor substances, and even the source of radiant energy used.
6. Distribution of Reported Products
Table 5 compiles the distribution of products formed in the photocatalyzed urea synthesis reported by each author studied in this review. The products have been ordered based on the photocatalyst, irradiation time, carbon and nitrogen source, electron donor, and solvent used.
The concentrations in mM presented in Table 5 were obtained from the data available in tables and charts reported by the authors cited. The considerations made to get the concentrations indicated in this table are described according to superscript letters.
The acronyms used in Table 5 correspond to Polyvinylpyrrolidinone (PVPD), Propylene carbonate (PC), Acetonitrile (Ac), Ethylene glycol monoethyl ether (Eg), Sulfolane (Sf), Poly (vinyl alcohol) MW ~15,000 (PVA), Poly (allylamine hydrochloride) MW ~50,000 (PAH), Poly (styrene sulfonate) MW ~70,000 (PSS) and Proton–exchange Zeolite Socony Mobil–5 (HZSM–5).
Even though it is not possible to produce isolated urea in all the cases studied, it is possible to appreciate how the different photocatalytic arrangements and the modification of the experimental conditions have allowed specialization in urea formation through the years of research reducing the presence of by–products.
The highest urea concentration (approx. 4.56 mM) was obtained using Q–TiO2/PVPD as a photocatalyst. However, under the experimental conditions, urea formation can be considered a by–product against the acetone concentration (28.40 mM approx.).
Considering the duration of the photocatalysis made it possible to produce a urea concentration of approximately 1.1 mM in 1 h, using PFD:TiO2/Cu as a photocatalyst, the properties of which were described previously. This system allowed the authors to reduce the presence of other species derived from the reduction of nitrate ions such as formate, whose approximate concentration was 0.03 mM, allowing it to be considered as a reaction by–product.
In all experimental set–ups where CO2 was used as a carbon donor source, reduced species such as acetone, formate, methanol, or carbon monoxide are obtained as products. These compounds could act as interfering substances since they can compete for the active sites of the photocatalyst, decreasing the nitrate ion photocatalyzed reduction reaction. In the cases where the electron donor species 2–propanol or oxalic acid was used as a carbon donor, only urea was produced and also reduced species of nitrate ions such as NH3 or NO2−, demonstrating once again that this reduction is the most critical step for urea formation.
Although it has been possible to increase the specialization for urea formation in the various photocatalyzed reactions and different experimental set–ups proposed, there are still considerable challenges and opportunities to generate a system that allows scalability using renewable energy sources such as solar energy.
7. Energy Consumption and Technology Scaling
B Srinivas et al. [21] scaled their experimental set–up five times, which allowed them to work in a 500 mL batch reactor and study the progress of product formation during 12 h of lighting, using 8.3 mM KNO3 as a nitrogen source and 2–propanol 5% v/v as a source of CO2, which, in turn, acts as an electron donor. This experiment reports a conversion of nitrate to products of 90% and a urea formation yield of 18%, approximately.
Given the difficulty of directly comparing the different technologies or experimental configurations addressed in this review, evaluating the scaling based on the energy consumption required to obtain urea was proposed. Developing this energy evaluation was considered the most significant amount of urea according to the experimental set–up presented by each author. The data was reported as MWh ton−1 allowing its comparison with the industrial process of obtaining urea. Table 6 compares the calculated energy consumption required to produce one ton of urea according to the data reported. The considerations made for Table 6 are described according to superscript letters.
It is estimated globally that the energy consumption for industrial urea production is in the range of 3.2–5.5 GJ ton−1 [107,108], equivalent to ~0.8–1.5 MWh ton−1. According to Table 6, the energy required to produce one ton of urea from each experimental set–up exceeds the energy value needed for an industrial urea production plant due to considering the lamp irradiation as an energy source. Another factor to consider in this analysis is the active area that captures the energy radiated on the photocatalytic systems. In this last case, the least amount of energy required corresponds to the method proposed by D.G. Shchukin et al. [44], which uses a cell with a quartz window of 1 cm in diameter, in which there is a solution with suspended microcapsules, and Cu/TiO2 is used as a catalyst inside.
However, more efficient energy sources and lower costs should be considered for an industrial scaling of a photocatalyst system, such as light–emitting diodes (LEDs). Traditional lamps used for photocatalysis, such as fluorescent or mercury arc lamps, have a regular use of 500–2000 h and can reach temperatures above 600 °C in their operation, requiring constant cooling. Meanwhile, an LED is mercury–free, has an average life of use of 25,000 to 100,000 h, has higher energy and electrical efficiency, and is smaller than a traditional lamp, allowing for optimizing experimental designs, among other characteristics [109,110,111,112]. Undoubtedly, the best available radiant energy is solar energy, considered an inexhaustible energy source. It is estimated that around 5 × 10⁴ exajoules of solar energy reach the earth annually. An effective global solar irradiance is between 60 and 250 W m−2 (equivalent to 70% of the total available irradiance) [113]. The most irradiated places on the planet are the southwest of North America, west of South America, southwest of Africa, northwest of the Arabian Peninsula, the Tibetan Plateau, and Australia, with values higher than 2.5 MWh m−2 annually, making these places especially suitable for the installation of photovoltaic plants [114]. Therefore, a promising future is expected for developing photocatalytic systems based on solar energy. However, there are still many challenges and opportunities, especially in optimizing the energy absorbed and utilized by photocatalyst materials.
8. Conclusions and Perspectives
According to the most outstanding publications, the photocatalyzed synthesis of urea using TiO2–based materials has been reviewed. Urea production has taken great interest not only for being the most widely used fertilizer worldwide but also for its potential use as a clean fuel that can be safely stored and transported. The use of TiO2 for the photocatalytic conversion of CO2 and nitrogen compounds to obtain urea, as an alternative proposal to industrial production, remains a promising future prospect since it is possible to activate these systems using solar energy.
Despite the progress made in photocatalyzed urea synthesis using modified and supported TiO2 nanoparticles, improvements are still needed to optimize radiant energy absorption, shifting from UV light to visible light via doping with metals, non–metals, semiconductors, or sensitized dyes. Increasing the ability to absorb visible light would allow sunlight to be used more efficiently as photoactivation energy to TiO2–based materials.
Although it has been possible to determine that the photocatalyzed reaction of urea formation from CO2 and nitrogen compounds is a simultaneous reaction reduction, the mechanism has not been determined yet. Studies in the area are still required, such as an analysis of DFT to evaluate the free energy of intermediary conformations or steps to propose a photocatalyzed urea synthesis pathway, which will allow for more efficient engineering of TiO2–based catalyst designs.
Given the difficulty of directly comparing the different photocatalysis experimental set–ups, it is necessary to report efficiency parameters that allow a comparative analysis of the developed technologies, such as reactor design parameters, light intensity, quantum yield, reaction temperature, catalyst load, the effect of matrices, and surface defects, among others.
Energy consumption analysis demonstrated that photocatalytic systems, dependent on conventional lamps for obtaining energy, have low energy efficiency, increasing their consumption in several units to reach an industrial process. However, one way to improve this energy efficiency is using new, more efficient, and lower–cost energy sources such as lighting systems based on light–emitting diodes or LEDs. Furthermore, new ways to optimize the TiO2–based photocatalysts should be proposed to scale photocatalytic technology, using doping elements, forming composites, or using sensitizers to optimize light–harvesting, especially when solar energy is considered for the development of photovoltaic plants.
One alternative route to reach the world demand for urea is photo–electrocatalysis, which complements the photocatalysis syntheses with the electrocatalysis processes. The latter alternative has been shown to achieve higher urea concentrations, so it is one step closer to becoming a real alternative to industrial synthesis.
We hope that this review generates interest in developing alternative photocatalytic TiO2–based technologies that are friendly to the environment and sustainable for producing products of worldwide demand, especially in those highly polluting or energy–demanding industries.
Author Contributions
F.M.-T., M.I. and C.S.-N. wrote the manuscript, discussed the content, provided the concept, and reviewed the paper prior to submission. All authors have read and agreed to the published version of the manuscript.
Funding
This work was funded by ANID (CONICYT) grant number 21171065, Millenium Institute on Green Ammonia as Energy Vector MIGA, ANID/Millennium Science Initiative Program/ICN2021_023, and FONDECYT REGULAR 1221179.
Institutional Review Board Statement
Not Applicable.
Informed Consent Statement
Not Applicable.
Data Availability Statement
Not applicable.
Acknowledgments
FONDEQUIP programs EQM150101 and EQM150020. The authors also thank the Laboratory of Coordination Chemistry and Electrocatalysis at the Faculty of Chemistry Pontificia Universidad Católica de Chile and the Laboratory of Renewable Energy and Waste Treatments at the School of Engineering Pontificia Universidad Católica de Chile.
Conflicts of Interest
The authors declare no conflict of interest.
References
- Jin, D.; Zhao, S.; Zheng, N.; Beckers, Y.; Wang, J. Urea Metabolism and Regulation by Rumen Bacterial Urease in Ruminants—A Review. Ann. Anim. Sci. 2018, 18, 303–318. [Google Scholar] [CrossRef] [Green Version]
- Patra, A.K.; Aschenbach, J.R. Ureases in the Gastrointestinal Tracts of Ruminant and Monogastric Animals and Their Implication in Urea-N/Ammonia Metabolism: A Review. J. Adv. Res. 2018, 13, 39–50. [Google Scholar] [CrossRef] [PubMed]
- De Ventura, T.; Zanirato, V. Recent Advances in the Synthesis of Sulfonylureas. Eur. J. Org. Chem. 2021, 2021, 1201–1214. [Google Scholar] [CrossRef]
- Berrada, H.; Font, G.; Moltó, J.C. Determination of Urea Pesticide Residues in Vegetable, Soil, and Water Samples. Crit. Rev. Anal. Chem. 2003, 33, 19–41. [Google Scholar] [CrossRef]
- Amine-Khodja, A.; Boulkamh, A.; Boule, P. Photochemical Behaviour of Phenylurea Herbicides. Photochem.Photobiol.Sci. 2004, 3, 145–156. [Google Scholar] [CrossRef]
- Glibert, P.M.; Harrison, J.; Heil, C.; Seitzinger, S. Escalating Worldwide Use of Urea—A Global Change Contributing to Coastal Eutrophication. Biogeochemistry 2006, 77, 441–463. [Google Scholar] [CrossRef]
- Liu, Y.; Zhao, J.; Lee, J.-M. Conventional and New Materials for Selective Catalytic Reduction (SCR) of NOx. ChemCatChem 2018, 10, 1499–1511. [Google Scholar] [CrossRef]
- Lee, J.; Theis, J.R.; Kyriakidou, E.A. Vehicle Emissions Trapping Materials: Successes, Challenges, and the Path Forward. Appl. Catal. B Environ. 2019, 243, 397–414. [Google Scholar] [CrossRef]
- Aneke, M.; Wang, M. Energy Storage Technologies and Real Life Applications—A State of the Art Review. Appl. Energy 2016, 179, 350–377. [Google Scholar] [CrossRef] [Green Version]
- Olabi, A.G.; Onumaegbu, C.; Wilberforce, T.; Ramadan, M.; Abdelkareem, M.A.; Al-Alami, A.H. Critical Review of Energy Storage Systems. Energy 2021, 214, 118987. [Google Scholar] [CrossRef]
- Tan, K.M.; Babu, T.S.; Ramachandaramurthy, V.K.; Kasinathan, P.; Solanki, S.G.; Raveendran, S.K. Empowering Smart Grid: A Comprehensive Review of Energy Storage Technology and Application with Renewable Energy Integration. J. Energy Storage 2021, 39, 102591. [Google Scholar] [CrossRef]
- Schlapbach, L.; Züttel, A. Hydrogen-Storage Materials for Mobile Applications. Nature 2001, 414, 353–358. [Google Scholar] [CrossRef]
- Elishav, O. The Nitrogen Economy: Economic Feasibility Analysis of Nitrogen-Based Fuels as Energy Carriers. Appl. Energy 2017, 185, 183–188. [Google Scholar] [CrossRef]
- Ye, K.; Wang, G.; Cao, D.; Wang, G. Recent Advances in the Electro–Oxidation of Urea for Direct Urea Fuel Cell and Urea Electrolysis. Top Curr. Chem. 2018, 376, 42. [Google Scholar] [CrossRef]
- Rollinson, A.N.; Jones, J.; Dupont, V.; Twigg, M.V. Urea as a Hydrogen Carrier: A Perspective on Its Potential for Safe, Sustainable and Long-Term Energy Supply. Energy Environ. Sci. 2011, 4, 1216. [Google Scholar] [CrossRef] [Green Version]
- Xu, W.; Wu, Z.; Tao, S. Urea-Based Fuel Cells and Electrocatalysts for Urea Oxidation. Energy Technol. 2016, 4, 1329–1337. [Google Scholar] [CrossRef] [Green Version]
- Lan, R.; Irvine, J.T.S.; Tao, S. Ammonia and Related Chemicals as Potential Indirect Hydrogen Storage Materials. Int. J. Hydrog. Energy 2012, 37, 1482–1494. [Google Scholar] [CrossRef]
- U.S. Drive Hydrogen Production Tech Team Roadmap 2017. Available online: https://www.energy.gov/sites/prod/files/2017/11/f46/HPTT%20Roadmap%20FY17%20Final_No,202017 (accessed on 23 March 2022).
- Grinberg Dana, A.; Shter, G.E.; Grader, G.S. Nitrogen-Based Alternative Fuels: Progress and Future Prospects. Energy Technol. 2016, 4, 7–18. [Google Scholar] [CrossRef] [Green Version]
- Rafiee, A.; Rajab Khalilpour, K.; Milani, D.; Panahi, M. Trends in CO2 Conversion and Utilization: A Review from Process Systems Perspective. J. Environ. Chem. Eng. 2018, 6, 5771–5794. [Google Scholar] [CrossRef]
- Srinivas, B.; Kumari, V.D.; Sadanandam, G.; Hymavathi, C.; Subrahmanyam, M.; De, B.R. Photocatalytic Synthesis of Urea from in Situ Generated Ammonia and Carbon Dioxide. Photochem. Photobiol. 2012, 88, 233–241. [Google Scholar] [CrossRef]
- Xiang, X.; Guo, L.; Wu, X.; Ma, X.; Xia, Y. Urea Formation from Carbon Dioxide and Ammonia at Atmospheric Pressure. Environ. Chem. Lett. 2012, 10, 295–300. [Google Scholar] [CrossRef]
- Yahya, N.; Qureshi, S.; ur Rehman, Z.; Alqasem, B.; Fai Kait, C. Green Urea Synthesis Catalyzed by Hematite Nanowires in Magnetic Field. J. Magn. Magn. Mater. 2017, 428, 469–480. [Google Scholar] [CrossRef]
- Alqasem, B.; Sikiru, S.; Ali, E.M.; Elraies, K.A.; Yahya, N.; Rostami, A.; Ganeson, M.; Nyuk, C.M.; Qureshi, S. Effect of Electromagnetic Energy on Net Spin Orientation of Nanocatalyst for Enhanced Green Urea Synthesis. J. Mater. Res. Technol. 2020, 9, 16497–16512. [Google Scholar] [CrossRef]
- Yahya, N.; Alqasem, B.; Irfan, M.; Qureshi, S.; Rehman, Z.U.; Shafie, A.; Soleimani, H. The Effect of Saturation Magnetization of Nanocatalyst and Oscillating Magnetic Field for Green Urea Synthesis. Phys. B Condens. Matter 2017, 507, 95–106. [Google Scholar] [CrossRef]
- Díaz, D.J.; Darko, A.K.; McElwee-White, L. Transition Metal-Catalyzed Oxidative Carbonylation of Amines to Ureas. Eur. J. Org. Chem. 2007, 2007, 4453–4465. [Google Scholar] [CrossRef]
- Shi, F.; Deng, Y.; SiMa, T.; Peng, J.; Gu, Y.; Qiao, B. Alternatives to Phosgene and Carbon Monoxide: Synthesis of Symmetric Urea Derivatives with Carbon Dioxide in Ionic Liquids. Angew. Chem. Int. Ed. 2003, 42, 3257–3260. [Google Scholar] [CrossRef]
- Nguyen, D.S.; Cho, J.K.; Shin, S.-H.; Mishra, D.K.; Kim, Y.J. Reusable Polystyrene-Functionalized Basic Ionic Liquids as Catalysts for Carboxylation of Amines to Disubstituted Ureas. ACS Sustain. Chem. Eng. 2016, 4, 451–460. [Google Scholar] [CrossRef]
- He, X.; Li, X.-Y.; Song, Y.; Xia, S.-M.; Lang, X.-D.; He, L.-N. Synthesis of Urea Derivatives Using Carbon Dioxide as Carbonylation Reagent in Ionic Liquids. Curr. Organocatalysis 2017, 4, 112–121. [Google Scholar] [CrossRef]
- Andraos, J. A Green Metrics Assessment of Phosgene and Phosgene-Free Syntheses of Industrially Important Commodity Chemicals. Pure Appl. Chem. 2012, 84, 827–860. [Google Scholar] [CrossRef]
- Shibata, M.; Yoshida, K.; Furuya, N. Electrochemical Synthesis of Urea on Reduction of Carbon Dioxide with Nitrate and Nitrite Ions Using Cu-Loaded Gas-Diffusion Electrode. J. Electroanal. Chem. 1995, 387, 143–145. [Google Scholar] [CrossRef]
- Zhang, Y.; Li, Z.; Zhao, Y.; Chen, S.; Mahmood, I.B. Stabilization of Source-Separated Human Urine by Chemical Oxidation. Water Sci. Technol. 2013, 67, 1901–1907. [Google Scholar] [CrossRef] [PubMed]
- Senecal, J.; Vinnerås, B. Urea Stabilisation and Concentration for Urine-Diverting Dry Toilets: Urine Dehydration in Ash. Sci. Total Environ. 2017, 586, 650–657. [Google Scholar] [CrossRef] [PubMed]
- Pedersen, H.; Lomstein, B.A.; Blackburn, T.H. Evidence for Bacterial Urea Production in Marine Sediments. FEMS Microbiol. Ecol. 1993, 12, 51–59. [Google Scholar] [CrossRef]
- Tuchman, M.; Rajagopal, B.S.; McCann, M.T.; Malamy, M.H. Enhanced Production of Arginine and Urea by Genetically Engineered Escherichia Coli K-12 Strains. Appl. Environ. Microbiol. 1997, 63, 33–38. [Google Scholar] [CrossRef] [PubMed] [Green Version]
- Alfian, M.; Purwanto, W.W. Multi-objective Optimization of Green Urea Production. Energy Sci. Eng. 2019, 7, 292–304. [Google Scholar] [CrossRef]
- Ishaq, H.; Dincer, I. Multi-Objective Optimization and Analysis of a Solar Energy Driven Steam and Autothermal Combined Reforming System with Natural Gas. J. Nat. Gas Sci. Eng. 2019, 69, 102927. [Google Scholar] [CrossRef]
- Ishaq, H.; Siddiqui, O.; Chehade, G.; Dincer, I. A Solar and Wind Driven Energy System for Hydrogen and Urea Production with CO2 Capturing. Int. J. Hydrog. Energy 2021, 46, 4749–4760. [Google Scholar] [CrossRef]
- Zhang, H.; Wang, L.; Van herle, J.; Maréchal, F.; Desideri, U. Techno-Economic Comparison of 100% Renewable Urea Production Processes. Appl. Energy 2021, 284, 116401. [Google Scholar] [CrossRef]
- Xia, M.; Mao, C.; Gu, A.; Tountas, A.A.; Qiu, C.; Wood, T.E.; Li, Y.F.; Ulmer, U.; Xu, Y.; Viasus, C.J.; et al. Solar Urea: Towards a Sustainable Fertilizer Industry. Angew. Chem. Int. Ed. 2022, 61, e202110158. [Google Scholar] [CrossRef]
- Kuwabata, S.; Yamauchi, H.; Yoneyama, H. Urea Photosynthesis from Inorganic Carbon and Nitrogen Compounds Using TiO 2 as Photocatalyst. Langmuir 1998, 14, 1899–1904. [Google Scholar] [CrossRef]
- Liu, B.-J.; Torimoto, T.; Yoneyama, H. Photocatalytic Reduction of Carbon Dioxide in the Presence of Nitrate Using TiO2 Nanocrystal Photocatalyst Embedded in SiO2 Matrices. J. Photochem. Photobiol. A Chem. 1998, 115, 227–230. [Google Scholar] [CrossRef]
- Torimoto, T.; Liu, B.-J.; Yoneyama, H. Effect of Solvents on Photocatalytic Reduction of Carbon Dioxide Using Semiconductor Photocatalysts. Stud. Surf. Sci. Catal. 1998, 114, 553–556. [Google Scholar] [CrossRef]
- Shchukin, D.G.; Möhwald, H. Urea Photosynthesis inside Polyelectrolyte Capsules: Effect of Confined Media. Langmuir 2005, 21, 5582–5587. [Google Scholar] [CrossRef] [PubMed]
- Ustinovich, E.A.; Shchukin, D.G.; Sviridov, D.V. Heterogeneous Photocatalysis in Titania-Stabilized Perfluorocarbon-in-Water Emulsions: Urea Photosynthesis and Chloroform Photodegradation. J. Photochem. Photobiol. A Chem. 2005, 175, 249–252. [Google Scholar] [CrossRef]
- Shchukin, D.; Sviridov, D. Photocatalytic Processes in Spatially Confined Micro- and Nanoreactors. J. Photochem. Photobiol. C Photochem. Rev. 2006, 7, 23–39. [Google Scholar] [CrossRef]
- Maimaiti, H.; Xu, B.; Sun, J.; Feng, L. Photocatalytic Synthesis of Urea (CO2/N2/H2O) on Coal–Based Carbon Nanotubes with the Fe-Core-Supported Ti3+–TiO2 Composite Catalyst. ACS Sustain. Chem. Eng. 2021, 9, 6991–7002. [Google Scholar] [CrossRef]
- Sun, B.; Liu, Y.; Lou, F.; Chen, P. White-Light-Controlled Resistive Switching Chearacteristics of TiO2/Cu2O Composite Nanorods Array. Chem. Phys. 2015, 457, 28–31. [Google Scholar] [CrossRef]
- Xiong, Z.; Lei, Z.; Kuang, C.-C.; Chen, X.; Gong, B.; Zhao, Y.; Zhang, J.; Zheng, C.; Wu, J.C.S. Selective Photocatalytic Reduction of CO2 into CH4 over Pt-Cu2O TiO2 Nanocrystals: The Interaction between Pt and Cu2O Cocatalysts. Appl. Catal. B Environ. 2017, 202, 695–703. [Google Scholar] [CrossRef]
- Racovita, A.D. Titanium Dioxide: Structure, Impact, and Toxicity. IJERPH 2022, 19, 5681. [Google Scholar] [CrossRef]
- Shand, M.; Anderson, J.A. Aqueous Phase Photocatalytic Nitrate Destruction Using Titania Based Materials: Routes to Enhanced Performance and Prospects for Visible Light Activation. Catal. Sci. Technol. 2013, 3, 879. [Google Scholar] [CrossRef]
- Braun, J.H.; Baidins, A.; Marganski, R.E. TiO2 Pigment Technology: A Review. Prog. Org. Coat. 1992, 20, 105–138. [Google Scholar] [CrossRef]
- Hua, Z.; Dai, Z.; Bai, X.; Ye, Z.; Wang, P.; Gu, H.; Huang, X. Copper Nanoparticles Sensitized TiO2 Nanotube Arrays Electrode with Enhanced Photoelectrocatalytic Activity for Diclofenac Degradation. Chem. Eng. J. 2016, 283, 514–523. [Google Scholar] [CrossRef]
- Luttrell, T.; Halpegamage, S.; Tao, J.; Kramer, A.; Sutter, E.; Batzill, M. Why Is Anatase a Better Photocatalyst than Rutile? - Model Studies on Epitaxial TiO2 Films. Sci. Rep. 2015, 4, 4043. [Google Scholar] [CrossRef] [Green Version]
- Ananthakumar, S.; Ramkumar, J.; Babu, S.M. Semiconductor Nanoparticles Sensitized TiO2 Nanotubes for High Efficiency Solar Cell Devices. Renew. Sustain. Energy Rev. 2016, 57, 1307–1321. [Google Scholar] [CrossRef]
- Gupta, S.M.; Tripathi, M. A Review of TiO2 Nanoparticles. Chin. Sci. Bull. 2011, 56, 1639–1657. [Google Scholar] [CrossRef] [Green Version]
- Nair, R.V.; Gummaluri, V.S.; Matham, M.V.; C, V. A Review on Optical Bandgap Engineering in TiO2 Nanostructures via Doping and Intrinsic Vacancy Modulation towards Visible Light Applications. J. Phys. D Appl. Phys. 2022, 55, 313003. [Google Scholar] [CrossRef]
- Colón, G.; Maicu, M.; Hidalgo, M.C.; Navío, J.A. Cu-Doped TiO2 Systems with Improved Photocatalytic Activity. Appl. Catal. B Environ. 2006, 67, 41–51. [Google Scholar] [CrossRef]
- Zahid, R.; Manzoor, M.; Rafiq, A.; Ikram, M.; Nafees, M.; Butt, A.R.; Hussain, S.G.; Ali, S. Influence of Iron Doping on Structural, Optical and Magnetic Properties of TiO2 Nanoparticles. Electron. Mater. Lett. 2018, 14, 587–593. [Google Scholar] [CrossRef]
- Al-Azri, Z.H.N.; Chen, W.-T.; Chan, A.; Jovic, V.; Ina, T.; Idriss, H.; Waterhouse, G.I.N. The Roles of Metal Co-Catalysts and Reaction Media in Photocatalytic Hydrogen Production: Performance Evaluation of M/TiO2 Photocatalysts (M = Pd, Pt, Au) in Different Alcohol–Water Mixtures. J. Catal. 2015, 329, 355–367. [Google Scholar] [CrossRef]
- Ayati, A.; Ahmadpour, A.; Bamoharram, F.F.; Tanhaei, B.; Mänttäri, M.; Sillanpää, M. A Review on Catalytic Applications of Au/TiO2 Nanoparticles in the Removal of Water Pollutant. Chemosphere 2014, 107, 163–174. [Google Scholar] [CrossRef]
- Ansari, S.A.; Khan, M.M.; Ansari, M.O.; Cho, M.H. Nitrogen-Doped Titanium Dioxide (N-Doped TiO2) for Visible Light Photocatalysis. New J. Chem. 2016, 40, 3000–3009. [Google Scholar] [CrossRef]
- Ji, L.; Zhang, Y.; Miao, S.; Gong, M.; Liu, X. In Situ Synthesis of Carbon Doped TiO2 Nanotubes with an Enhanced Photocatalytic Performance under UV and Visible Light. Carbon 2017, 125, 544–550. [Google Scholar] [CrossRef]
- Lee, J.S.; You, K.H.; Park, C.B. Highly Photoactive, Low Bandgap TiO2 Nanoparticles Wrapped by Graphene. Adv. Mater. 2012, 5. [Google Scholar]
- Li, Q.; Shang, J.K. Self-Organized Nitrogen and Fluorine Co-Doped Titanium Oxide Nanotube Arrays with Enhanced Visible Light Photocatalytic Performance. Environ. Sci. Technol. 2009, 43, 8923–8929. [Google Scholar] [CrossRef] [PubMed]
- Andoshe, D.M.; Yim, K.; Sohn, W.; Kim, C.; Kim, T.L.; Kwon, K.C.; Hong, K.; Choi, S.; Moon, C.W.; Hong, S.-P.; et al. One-Pot Synthesis of Sulfur and Nitrogen Codoped Titanium Dioxide Nanorod Arrays for Superior Photoelectrochemical Water Oxidation. Appl. Catal. B Environ. 2018, 234, 213–222. [Google Scholar] [CrossRef]
- Yin, H.; Wang, X.; Wang, L.; Nie, Q.; Zhang, Y.; Wu, W. Cu2O/TiO2 Heterostructured Hollow Sphere with Enhanced Visible Light Photocatalytic Activity. Mater. Res. Bull. 2015, 72, 176–183. [Google Scholar] [CrossRef]
- Frank, A.J.; Kopidakis, N.; van de Lagemaat, J. Electrons in Nanostructured TiO2 Solar Cells: Transport, Recombination and Photovoltaic Properties. Coord. Chem. Rev. 2004, 248, 1165–1179. [Google Scholar] [CrossRef]
- Liu, G.; Hoivik, N.; Wang, K.; Jakobsen, H. Engineering TiO2 Nanomaterials for CO2 Conversion/Solar Fuels. Sol. Energy Mater. Sol. Cells 2012, 105, 53–68. [Google Scholar] [CrossRef]
- Wei, L.; Yu, C.; Zhang, Q.; Liu, H.; Wang, Y. TiO2–Based Heterojunction Photocatalysts for Photocatalytic Reduction of CO 2 into Solar Fuels. J. Mater. Chem. A 2018, 6, 22411–22436. [Google Scholar] [CrossRef]
- Garcia-Segura, S.; Lanzarini-Lopes, M.; Hristovski, K.; Westerhoff, P. Electrocatalytic Reduction of Nitrate: Fundamentals to Full-Scale Water Treatment Applications. Appl. Catal. B Environ. 2018, 236, 546–568. [Google Scholar] [CrossRef]
- Guo, Q.; Zhou, C.; Ma, Z.; Yang, X. Fundamentals of TiO2 Photocatalysis: Concepts, Mechanisms, and Challenges. Adv. Mater. 2019, 31, 1901997. [Google Scholar] [CrossRef] [PubMed]
- Adeleye, A.S.; Conway, J.R.; Garner, K.; Huang, Y.; Su, Y.; Keller, A.A. Engineered Nanomaterials for Water Treatment and Remediation: Costs, Benefits, and Applicability. Chem. Eng. J. 2016, 286, 640–662. [Google Scholar] [CrossRef] [Green Version]
- Chen, D.; Zhang, X.; Lee, A.F. Synthetic Strategies to Nanostructured Photocatalysts for CO2 Reduction to Solar Fuels and Chemicals. J. Mater. Chem. A 2015, 3, 14487–14516. [Google Scholar] [CrossRef] [Green Version]
- Doudrick, K.; Yang, T.; Hristovski, K.; Westerhoff, P. Photocatalytic Nitrate Reduction in Water: Managing the Hole Scavenger and Reaction by-Product Selectivity. Appl. Catal. B Environ. 2013, 136–137, 40–47. [Google Scholar] [CrossRef]
- Hérissan, A.; Meichtry, J.M.; Remita, H.; Colbeau-Justin, C.; Litter, M.I. Reduction of Nitrate by Heterogeneous Photocatalysis over Pure and Radiolytically Modified TiO2 Samples in the Presence of Formic Acid. Catal. Today 2017, 281, 101–108. [Google Scholar] [CrossRef]
- Kobwittaya, K.; Sirivithayapakorn, S. Photocatalytic Reduction of Nitrate over Fe-Modified TiO2. APCBEE Procedia 2014, 10, 321–325. [Google Scholar] [CrossRef] [Green Version]
- Tugaoen, H.O.; Garcia-Segura, S.; Hristovski, K.; Westerhoff, P. Challenges in Photocatalytic Reduction of Nitrate as a Water Treatment Technology. Sci. Total Environ. 2017, 599–600, 1524–1551. [Google Scholar] [CrossRef]
- Matamala-Troncoso, F.; Ky Nguyen, C.; MacFarlane, D.R.; Isaacs, M.; Sáez-Navarrete, C. Facile Methodology to Generate Cu2O/TiO2 Heterojunction on FTO Electrode for Photoelectroreduction of Nitrate. Mater. Lett. 2021, 293, 129663. [Google Scholar] [CrossRef]
- Freire, J.M.A.; Matos, M.A.F.; Abreu, D.S.; Becker, H.; Diógenes, I.C.N.; Valentini, A.; Longhinotti, E. Nitrate Photocatalytic Reduction on TiO2: Metal Loaded, Synthesis and Anions Effect. J. Environ. Chem. Eng. 2020, 8, 103844. [Google Scholar] [CrossRef]
- Liu, L.-F.; Zhang, Y.; Yang, F.-L.; Chen, G.; Yu, J.C. Simultaneous Photocatalytic Removal of Ammonium and Nitrite in Water Using Ce3+–Ag+ Modified TiO2. Sep. Purif. Technol. 2009, 67, 244–248. [Google Scholar] [CrossRef]
- Ranjit, K.T.; Viswanathan, B. Photocatalytic Reduction of Nitrite and Nitrate Ions over Doped TiO2 Catalysts. J. Photochem. Photobiol. A Chem. 1997, 107, 215–220. [Google Scholar] [CrossRef]
- Ranjit, K.T.; Viswanathan, B. Photocatalytic Reduction of Nitrite and Nitrate Ions to Ammonia on M/TiO2 Catalysts. J. Photochem. Photobiol. A Chem. 1997, 108, 73–78. [Google Scholar] [CrossRef]
- Zhang, F.; Pi, Y.; Cui, J.; Yang, Y.; Zhang, X.; Guan, N. Unexpected Selective Photocatalytic Reduction of Nitrite to Nitrogen on Silver-Doped Titanium Dioxide. J. Phys. Chem. C 2007, 111, 3756–3761. [Google Scholar] [CrossRef]
- Huang, S.-R.; Huang, P.-J. Visible-Light Driven Graphene Oxide/Titanium Dioxide Hydrogels for Photocatalytic Reduction of Nitrite. J. Environ. Chem. Eng. 2022, 10, 106902. [Google Scholar] [CrossRef]
- Rao, N.N.; Dube, S.; Manjubala; Natarajan, P. Photocatalytic Reduction of Nitrogen over (Fe, Ru or Os)/TiO2 Catalysts. Appl. Catal. B Environ. 1994, 5, 33–42. [Google Scholar] [CrossRef]
- Krasae, N.; Wantala, K. Enhanced Nitrogen Selectivity for Nitrate Reduction on Cu–NZVI by TiO2 Photocatalysts under UV Irradiation. Appl. Surf. Sci. 2016, 380, 309–317. [Google Scholar] [CrossRef]
- Wang, T.; Li, B.; Liu, H.; Zhang, X.; Hocking, R.K.; Sun, C. First Principles Study of Single Fe Atom Supported on TiO2(001) for Nitrogen Reduction to Ammonia. Appl. Surf. Sci. 2022, 572, 151417. [Google Scholar] [CrossRef]
- Ranjit, K.T.; Viswanathan, B. Photocatalytic Reduction of Dinitrogen to Ammonia. Indian J. Chem. 1996, 35 A, 443–453. [Google Scholar]
- Sayão, F.A.; Nuñez, L.; Zanoni, M.V.B. Efficient Photoelectrochemical Reduction of Nitrite to Ammonium and Nitrogen Containing Gaseous Species Using Ti/TiO2 Nanotube Electrodes. J. Braz. Chem. Soc. 2014. [Google Scholar] [CrossRef]
- Zhang, X.; Zhang, G.; Zou, J. Nitrogen Reduction Utilizing Solvated Electrons Produced by Thermal Excitation of Trapped Electrons in Reduced Titanium Oxide. New J. Chem. 2018, 42, 6084–6090. [Google Scholar] [CrossRef]
- Yamazoe, S.; Okumura, T.; Tanaka, T. Photo-Oxidation of NH3 over Various TiO2. Catal. Today 2007, 120, 220–225. [Google Scholar] [CrossRef]
- Al Sawah, M.A.; Richard, D.; De Bellefon, C.; Chovelon, J.-M.; Ferronato, C. Dégradation photocatalytique des ions ammonium en présence de TiO2 dopé. Comptes Rendus Chim. 2010, 13, 502–507. [Google Scholar] [CrossRef]
- Bahadori, E.; Conte, F.; Tripodi, A.; Ramis, G.; Rossetti, I. Photocatalytic Selective Oxidation of Ammonia in a Semi-Batch Reactor: Unravelling the Effect of Reaction Conditions and Metal Co-Catalysts. Catalysts 2021, 11, 209. [Google Scholar] [CrossRef]
- Meessen, J. Urea Synthesis. Chem. Ing. Tech. 2014, 86, 2180–2189. [Google Scholar] [CrossRef]
- Li, X.; Tung, C.; Wu, L. Quantum Dot Assembly for Light-Driven Multielectron Redox Reactions, Such as Hydrogen Evolution and CO2 Reduction. Angew. Chem. Int. Ed. 2019, 58, 10804–10811. [Google Scholar] [CrossRef]
- Mohamed, H.H.; Mendive, C.B.; Dillert, R.; Bahnemann, D.W. Kinetic and Mechanistic Investigations of Multielectron Transfer Reactions Induced by Stored Electrons in TiO2 Nanoparticles: A Stopped Flow Study. J. Phys. Chem. A 2011, 115, 2139–2147. [Google Scholar] [CrossRef]
- Yu, J.; Ma, T.; Liu, S. Enhanced Photocatalytic Activity of Mesoporous TiO2 Aggregates by Embedding Carbon Nanotubes as Electron-Transfer Channel. Phys. Chem. Chem. Phys. 2011, 13, 3491–3501. [Google Scholar] [CrossRef]
- Ahmmad, B.; Kusumoto, Y.; Somekawa, S.; Ikeda, M. Carbon Nanotubes Synergistically Enhance Photocatalytic Activity of TiO2. Catal. Commun. 2008, 9, 1410–1413. [Google Scholar] [CrossRef]
- Guo, M.Y.; Liu, F.; Leung, Y.H.; Ng, A.M.C.; Djurišić, A.B.; Chan, W.K. TiO2–Carbon Nanotube Composites for Visible Photocatalysts—Influence of TiO2 Crystal Structure. Curr. Appl. Phys. 2013, 13, 1280–1287. [Google Scholar] [CrossRef]
- Chen, J.; Qiu, F.; Xu, W.; Cao, S.; Zhu, H. Recent Progress in Enhancing Photocatalytic Efficiency of TiO2–Based Materials. Appl. Catal. A Gen. 2015, 495, 131–140. [Google Scholar] [CrossRef]
- Kominami, H.; Furusho, A.; Murakami, S.; Inoue, H.; Kera, Y.; Ohtani, B. Effective Photocatalytic Reduction of Nitrate to Ammonia in an Aqueous Suspension of Metal-Loaded Titanium(IV) Oxide Particles in the Presence of Oxalic Acid. Catal. Lett. 2001, 76, 31–34. [Google Scholar] [CrossRef] [Green Version]
- Kominami, H.; Nakaseko, T.; Shimada, Y.; Furusho, A.; Inoue, H.; Murakami, S.; Kera, Y.; Ohtani, B. Selective Photocatalytic Reduction of Nitrate to Nitrogen Molecules in an Aqueous Suspension of Metal-Loaded Titanium(Iv) Oxide Particles. Chem. Commun. 2005, 2933–2935. [Google Scholar] [CrossRef] [PubMed]
- Thompson, T.L.; Yates, J.T. TiO2-Based Photocatalysis: Surface Defects, Oxygen and Charge Transfer. Top Catal. 2005, 35, 197–210. [Google Scholar] [CrossRef]
- Yamakata, A.; Vequizo, J.J.M. Curious Behaviors of Photogenerated Electrons and Holes at the Defects on Anatase, Rutile, and Brookite TiO2 Powders: A Review. J. Photochem. Photobiol. C Photochem. Rev. 2019, 40, 234–243. [Google Scholar] [CrossRef]
- Lv, C.; Zhong, L.; Liu, H.; Fang, Z.; Yan, C.; Chen, M.; Kong, Y.; Lee, C.; Liu, D.; Li, S.; et al. Selective Electrocatalytic Synthesis of Urea with Nitrate and Carbon Dioxide. Nat. Sustain. 2021, 4, 868–876. [Google Scholar] [CrossRef]
- Kermeli, K.; Worrell, E.; Graus, W.; Corsten, M. Energy Efficiency and Cost Saving Opportunities for Ammonia and Nitrogenous Fertilizer Production; United States Environmental Protection Agency: Washington, DC, USA, 2017; p. 163. [Google Scholar]
- International Fertilizer Industry Association Fertilizers. Climate Change and Enhancing Agricultural Productivity Sustainably; International Fertilizer Industry Association: Paris, France, 2009. [Google Scholar]
- Jo, W.-K.; Tayade, R.J. New Generation Energy-Efficient Light Source for Photocatalysis: LEDs for Environmental Applications. Ind. Eng. Chem. Res. 2014, 53, 2073–2084. [Google Scholar] [CrossRef]
- Khademalrasool, M.; Farbod, M.; Talebzadeh, M.D. The Improvement of Photocatalytic Processes: Design of a Photoreactor Using High-Power LEDs. J. Sci. Adv. Mater. Devices 2016, 1, 382–387. [Google Scholar] [CrossRef] [Green Version]
- Casado, C.; Timmers, R.; Sergejevs, A.; Clarke, C.T.; Allsopp, D.W.E.; Bowen, C.R.; van Grieken, R.; Marugán, J. Design and Validation of a LED-Based High Intensity Photocatalytic Reactor for Quantifying Activity Measurements. Chem. Eng. J. 2017, 327, 1043–1055. [Google Scholar] [CrossRef]
- Jo, W.-K.; Tayade, R.J. Recent Developments in Photocatalytic Dye Degradation upon Irradiation with Energy-Efficient Light Emitting Diodes. Chin. J. Catal. 2014, 35, 1781–1792. [Google Scholar] [CrossRef]
- Kabir, E.; Kumar, P.; Kumar, S.; Adelodun, A.A.; Kim, K.-H. Solar Energy: Potential and Future Prospects. Renew. Sustain. Energy Rev. 2018, 82, 894–900. [Google Scholar] [CrossRef]
- Prăvălie, R.; Patriche, C.; Bandoc, G. Spatial Assessment of Solar Energy Potential at Global Scale. A Geographical Approach. J. Clean. Prod. 2019, 209, 692–721. [Google Scholar] [CrossRef]
Figure 1.
Schematic illustration of the photocatalytic spherical microreactor assembly. Adapted from D.G. Shchukin et al. [44].
Figure 1.
Schematic illustration of the photocatalytic spherical microreactor assembly. Adapted from D.G. Shchukin et al. [44].

Figure 2.
Charge transfer diagram for TiO2. (A) Schematic representation of band–gap and the e−/h+ pair transfer on a photoexcited TiO2 surface. (B) Effect on charge transfer for a semiconductor, according to metal doping, composite semiconductor (CS), or dye–sensitized (S). Adapted from Liu et al. [69].
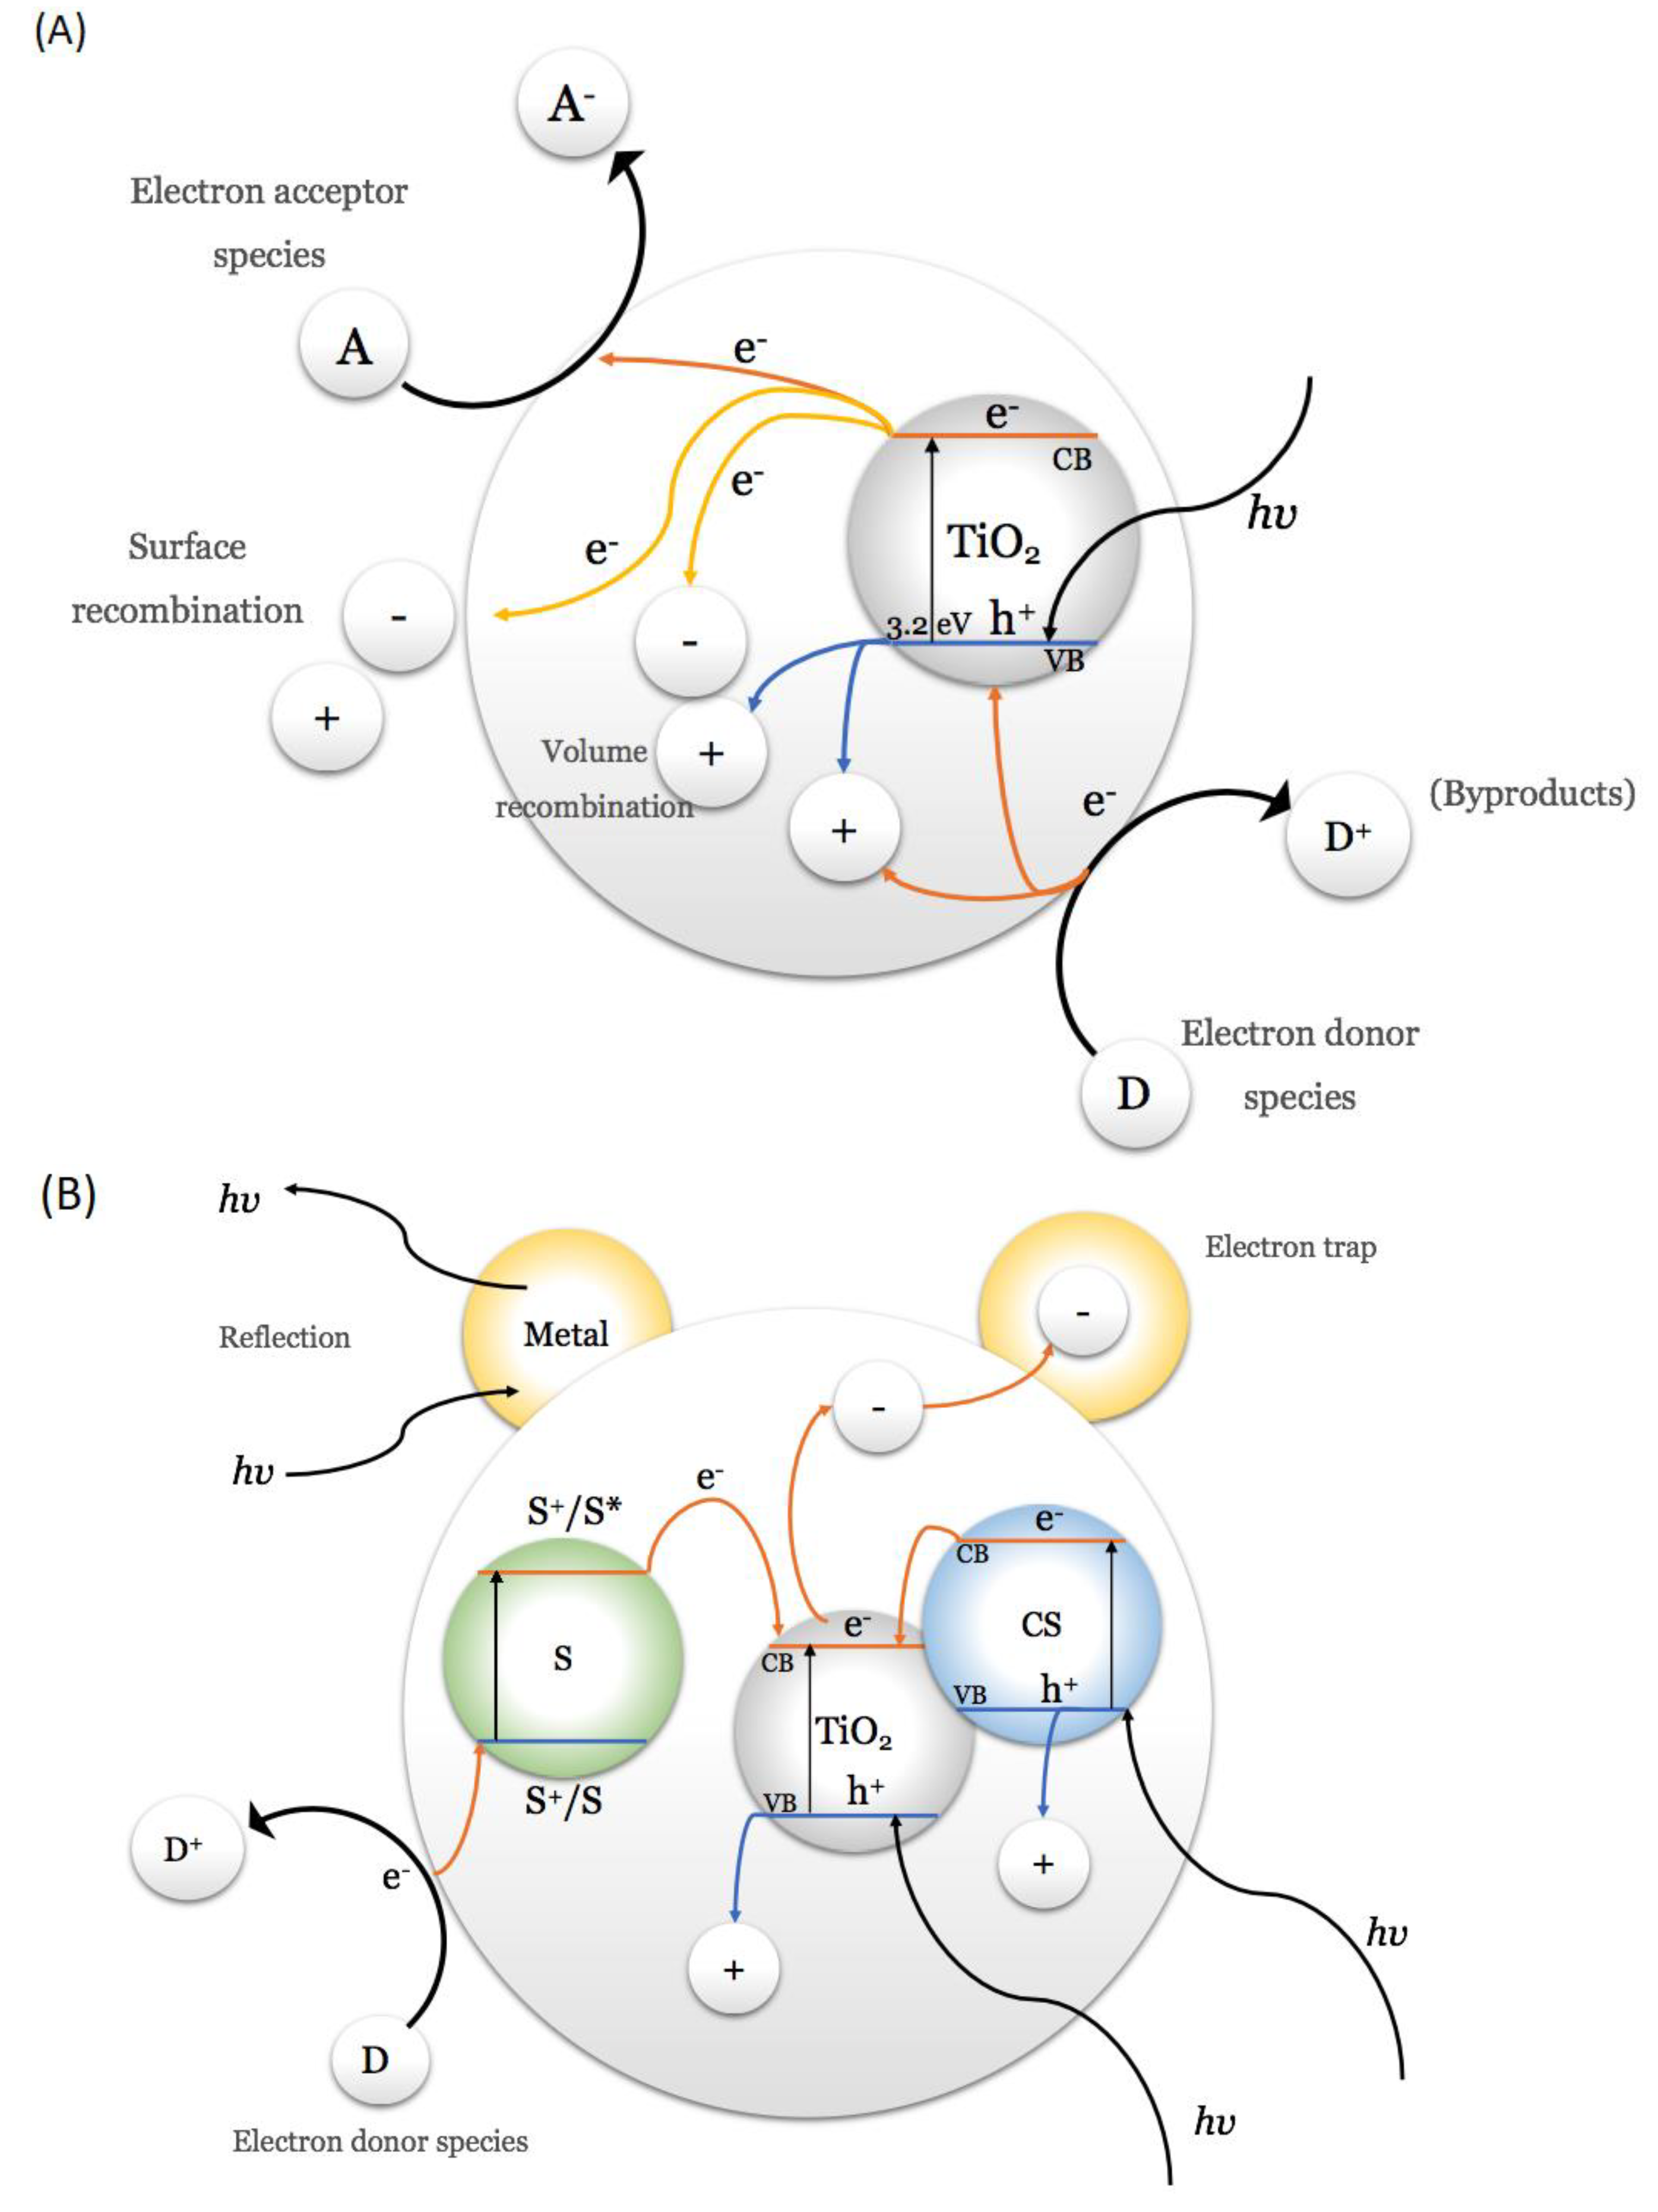
Figure 3.
Conduction band (CB) and valence band (VB) narrowing to TiO2 by doping. (A) Undoped, (B) metal–doped, and (C) non–metal doped. Adapted from R. Nair et al. [57].
Figure 3.
Conduction band (CB) and valence band (VB) narrowing to TiO2 by doping. (A) Undoped, (B) metal–doped, and (C) non–metal doped. Adapted from R. Nair et al. [57].

Figure 4.
Band–edge position of different semiconductors with photocatalytic properties. Band position relative to CO2 y NO3− reduction energy levels. Adapted from L. Wei et al. [70] and S. Garcia-Segura et al. [71].

Scheme 1.
Mechanisms of nitrate and nitrite ion reduction by a multi–electron transfer process on a TiO2 surface to produce N2 gas and ammonia. Adapted from H. Mohamed et al. [97].
Scheme 1.
Mechanisms of nitrate and nitrite ion reduction by a multi–electron transfer process on a TiO2 surface to produce N2 gas and ammonia. Adapted from H. Mohamed et al. [97].
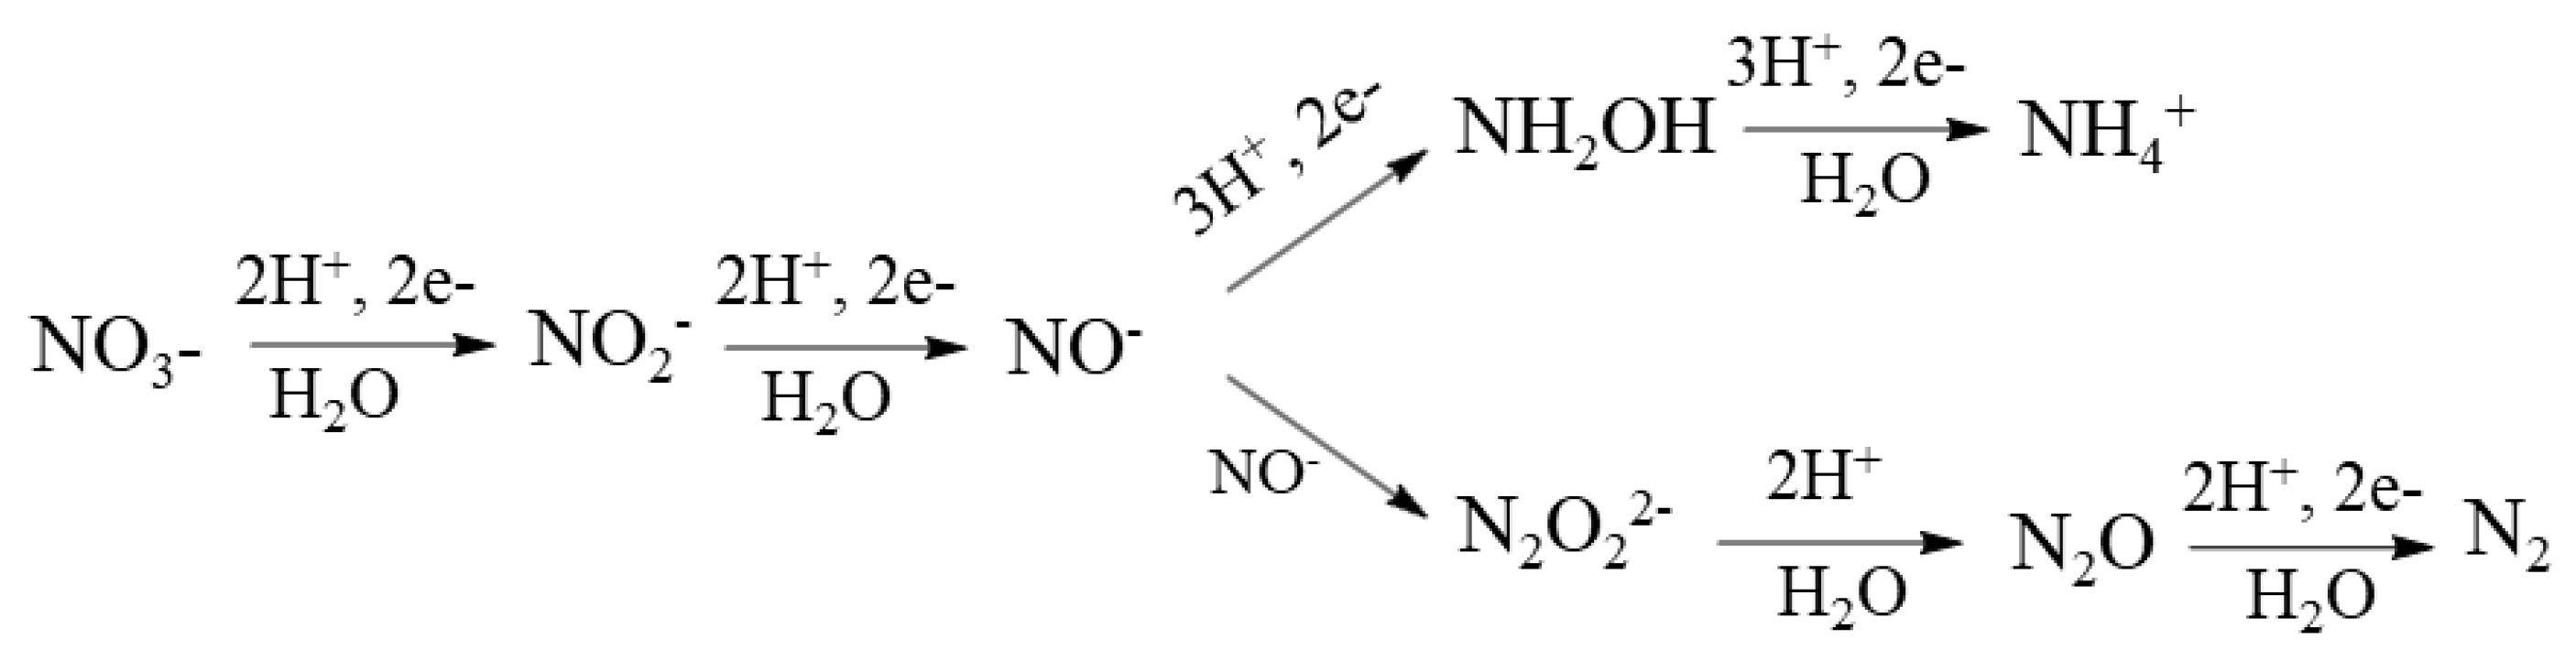
Scheme 2.
Speculative mechanism and representation of intermediate species stabilization during nitrate reduction and the prevention of ammonia oxidation over TiO2–zeolites. Adapted from B. Srinivas et al. [21].
Scheme 2.
Speculative mechanism and representation of intermediate species stabilization during nitrate reduction and the prevention of ammonia oxidation over TiO2–zeolites. Adapted from B. Srinivas et al. [21].

Scheme 3.
The speculative mechanisms for urea synthesis via amino acid and amide formation. Adapted from B. Srinivas et al. [21].
Scheme 3.
The speculative mechanisms for urea synthesis via amino acid and amide formation. Adapted from B. Srinivas et al. [21].
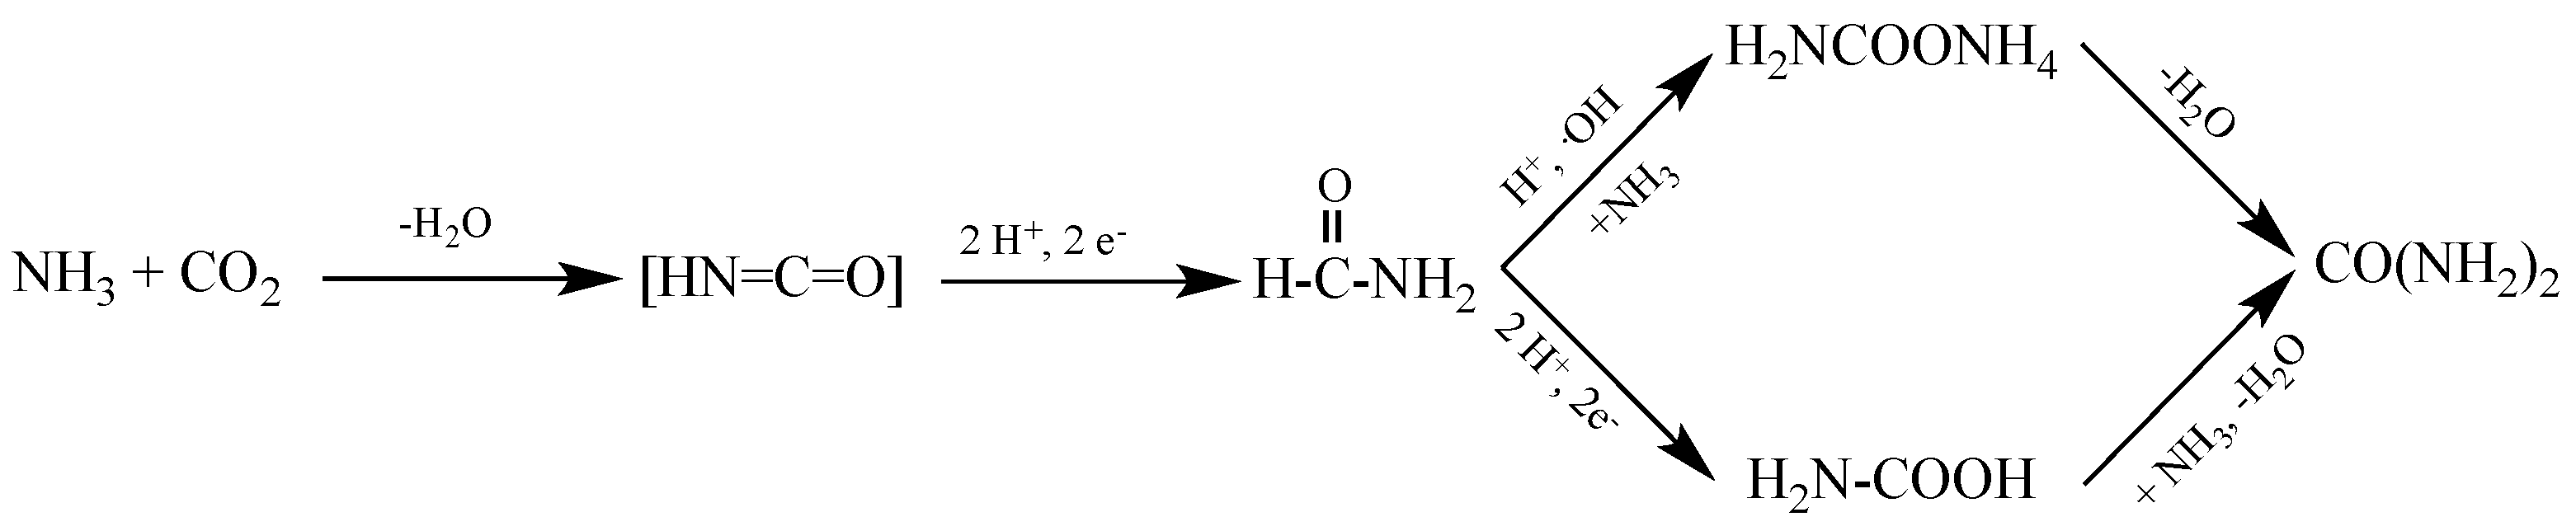
Scheme 4.
Schematic representation of urea formation on TiO2 supported on zeolites under illumination, Adapted from B. Srinivas et al. [21].
Scheme 4.
Schematic representation of urea formation on TiO2 supported on zeolites under illumination, Adapted from B. Srinivas et al. [21].
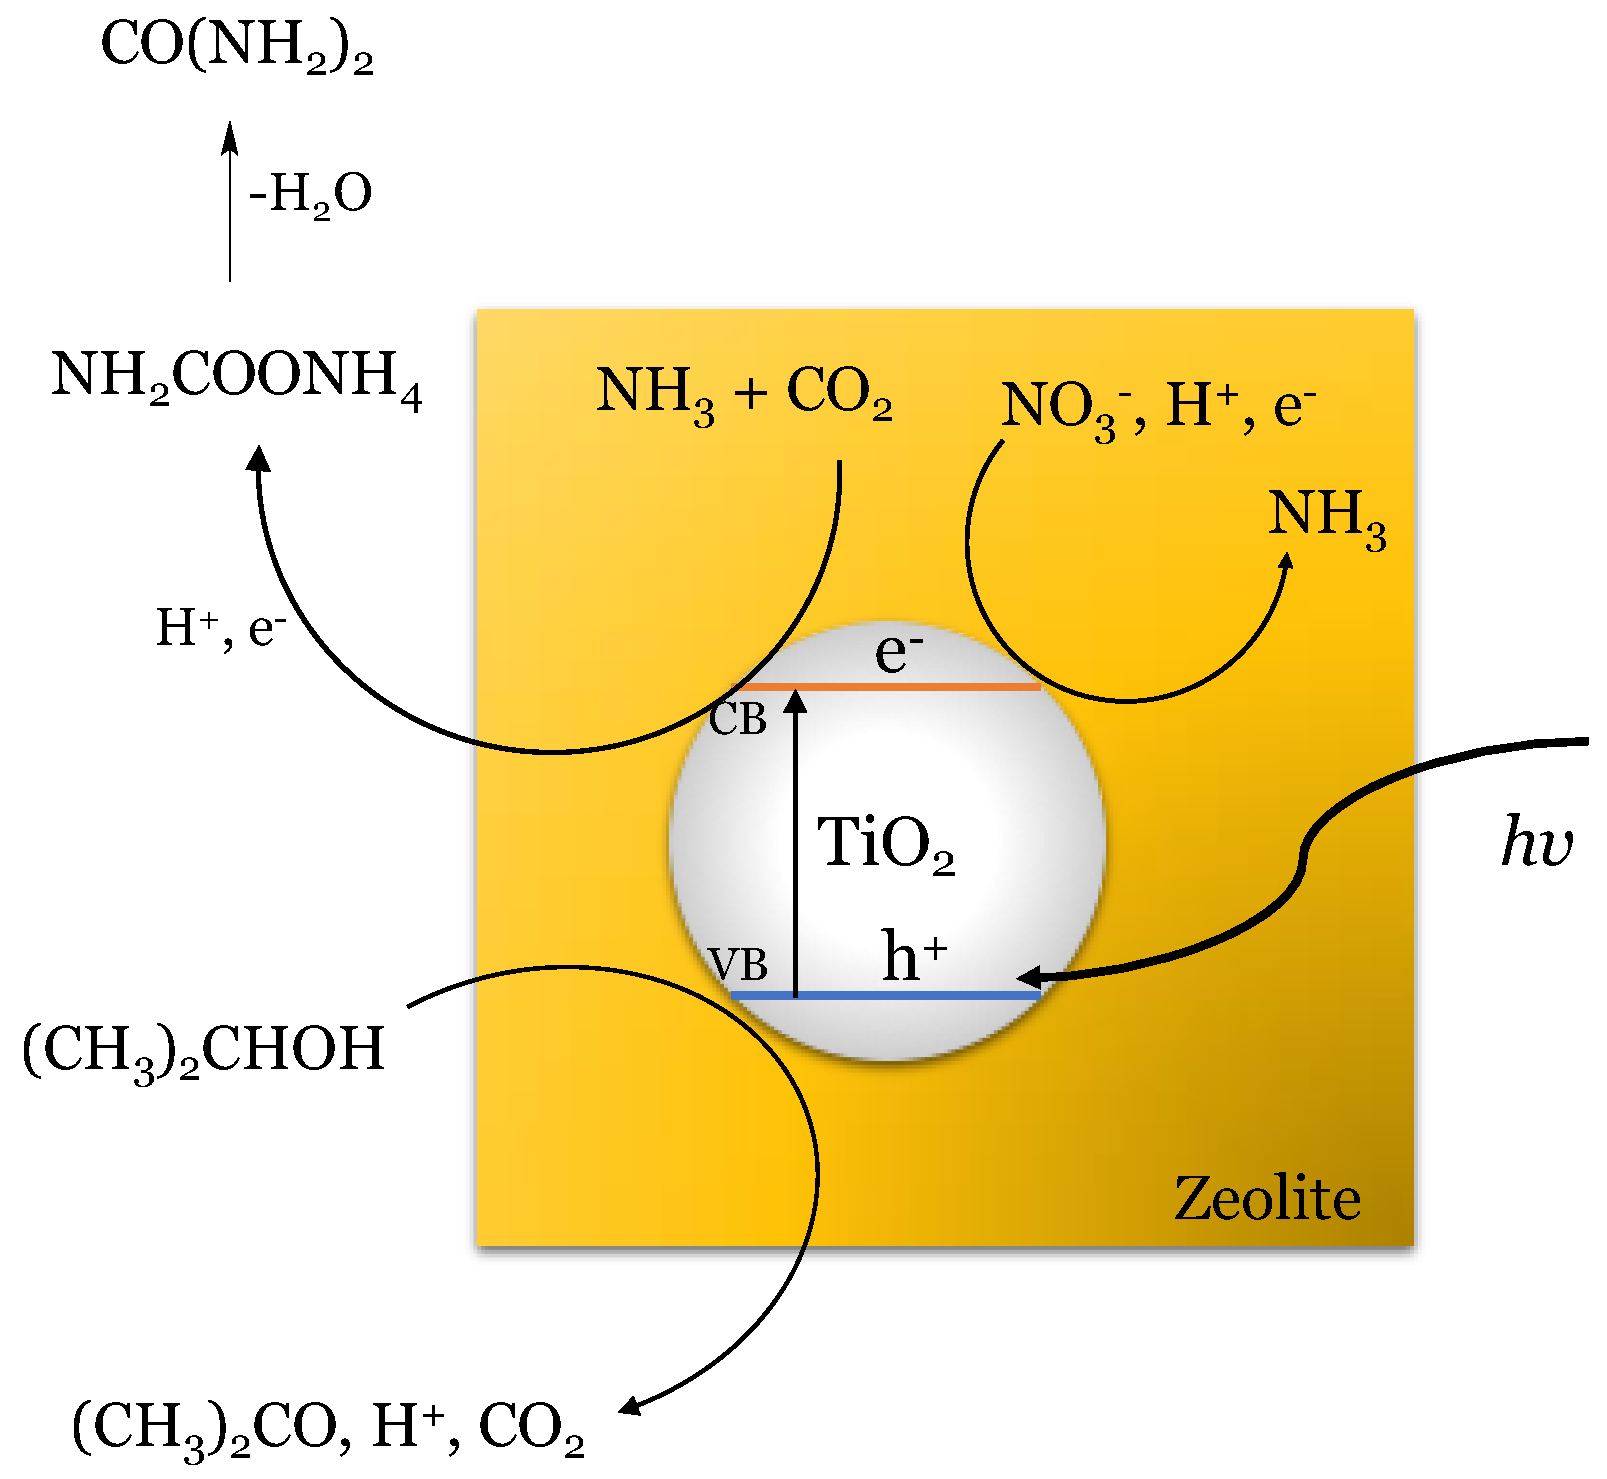
Figure 5.
Mechanism of the photocatalyzed reduction of N2 and CO2 simultaneously to form urea on the TiO2 surface. Adapted from H. Maimaiti et al. [47].
Figure 5.
Mechanism of the photocatalyzed reduction of N2 and CO2 simultaneously to form urea on the TiO2 surface. Adapted from H. Maimaiti et al. [47].
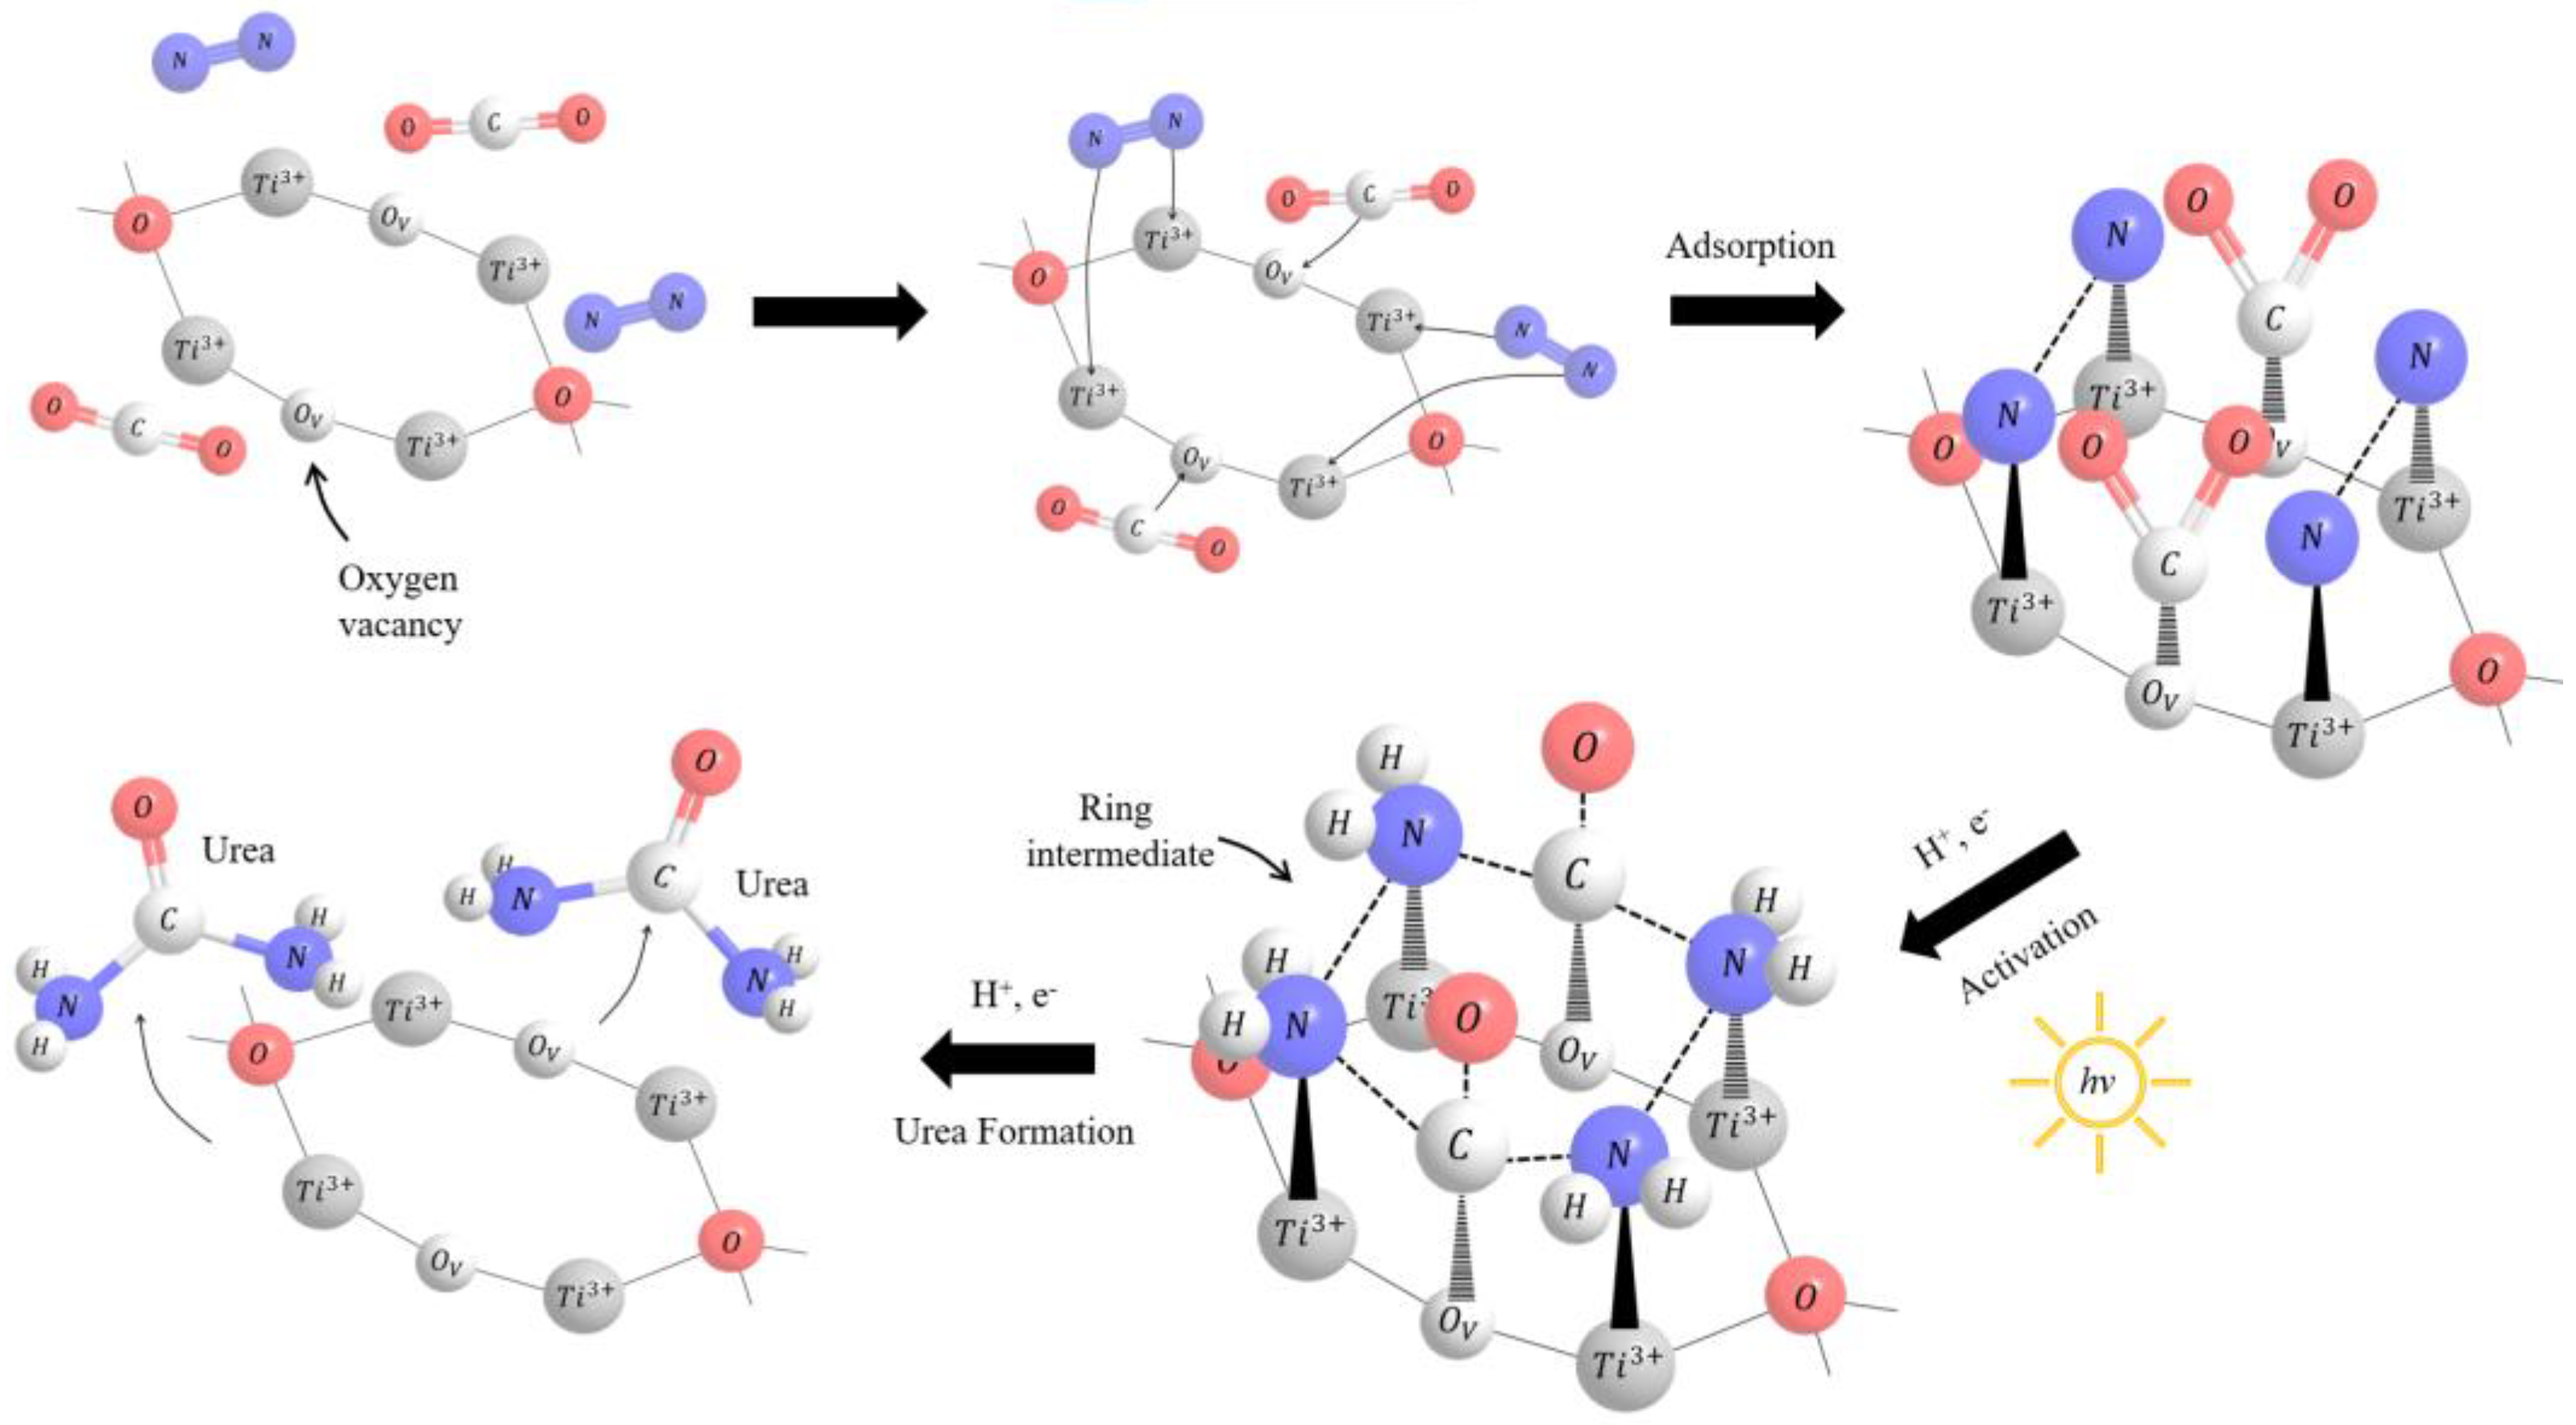
Figure 6.
Band–edge position and photoinduced e−/h+ pair by the defects on anatase, rutile, and brookite TiO2. Adapted from A. Yamakata et al. [105].
Figure 6.
Band–edge position and photoinduced e−/h+ pair by the defects on anatase, rutile, and brookite TiO2. Adapted from A. Yamakata et al. [105].
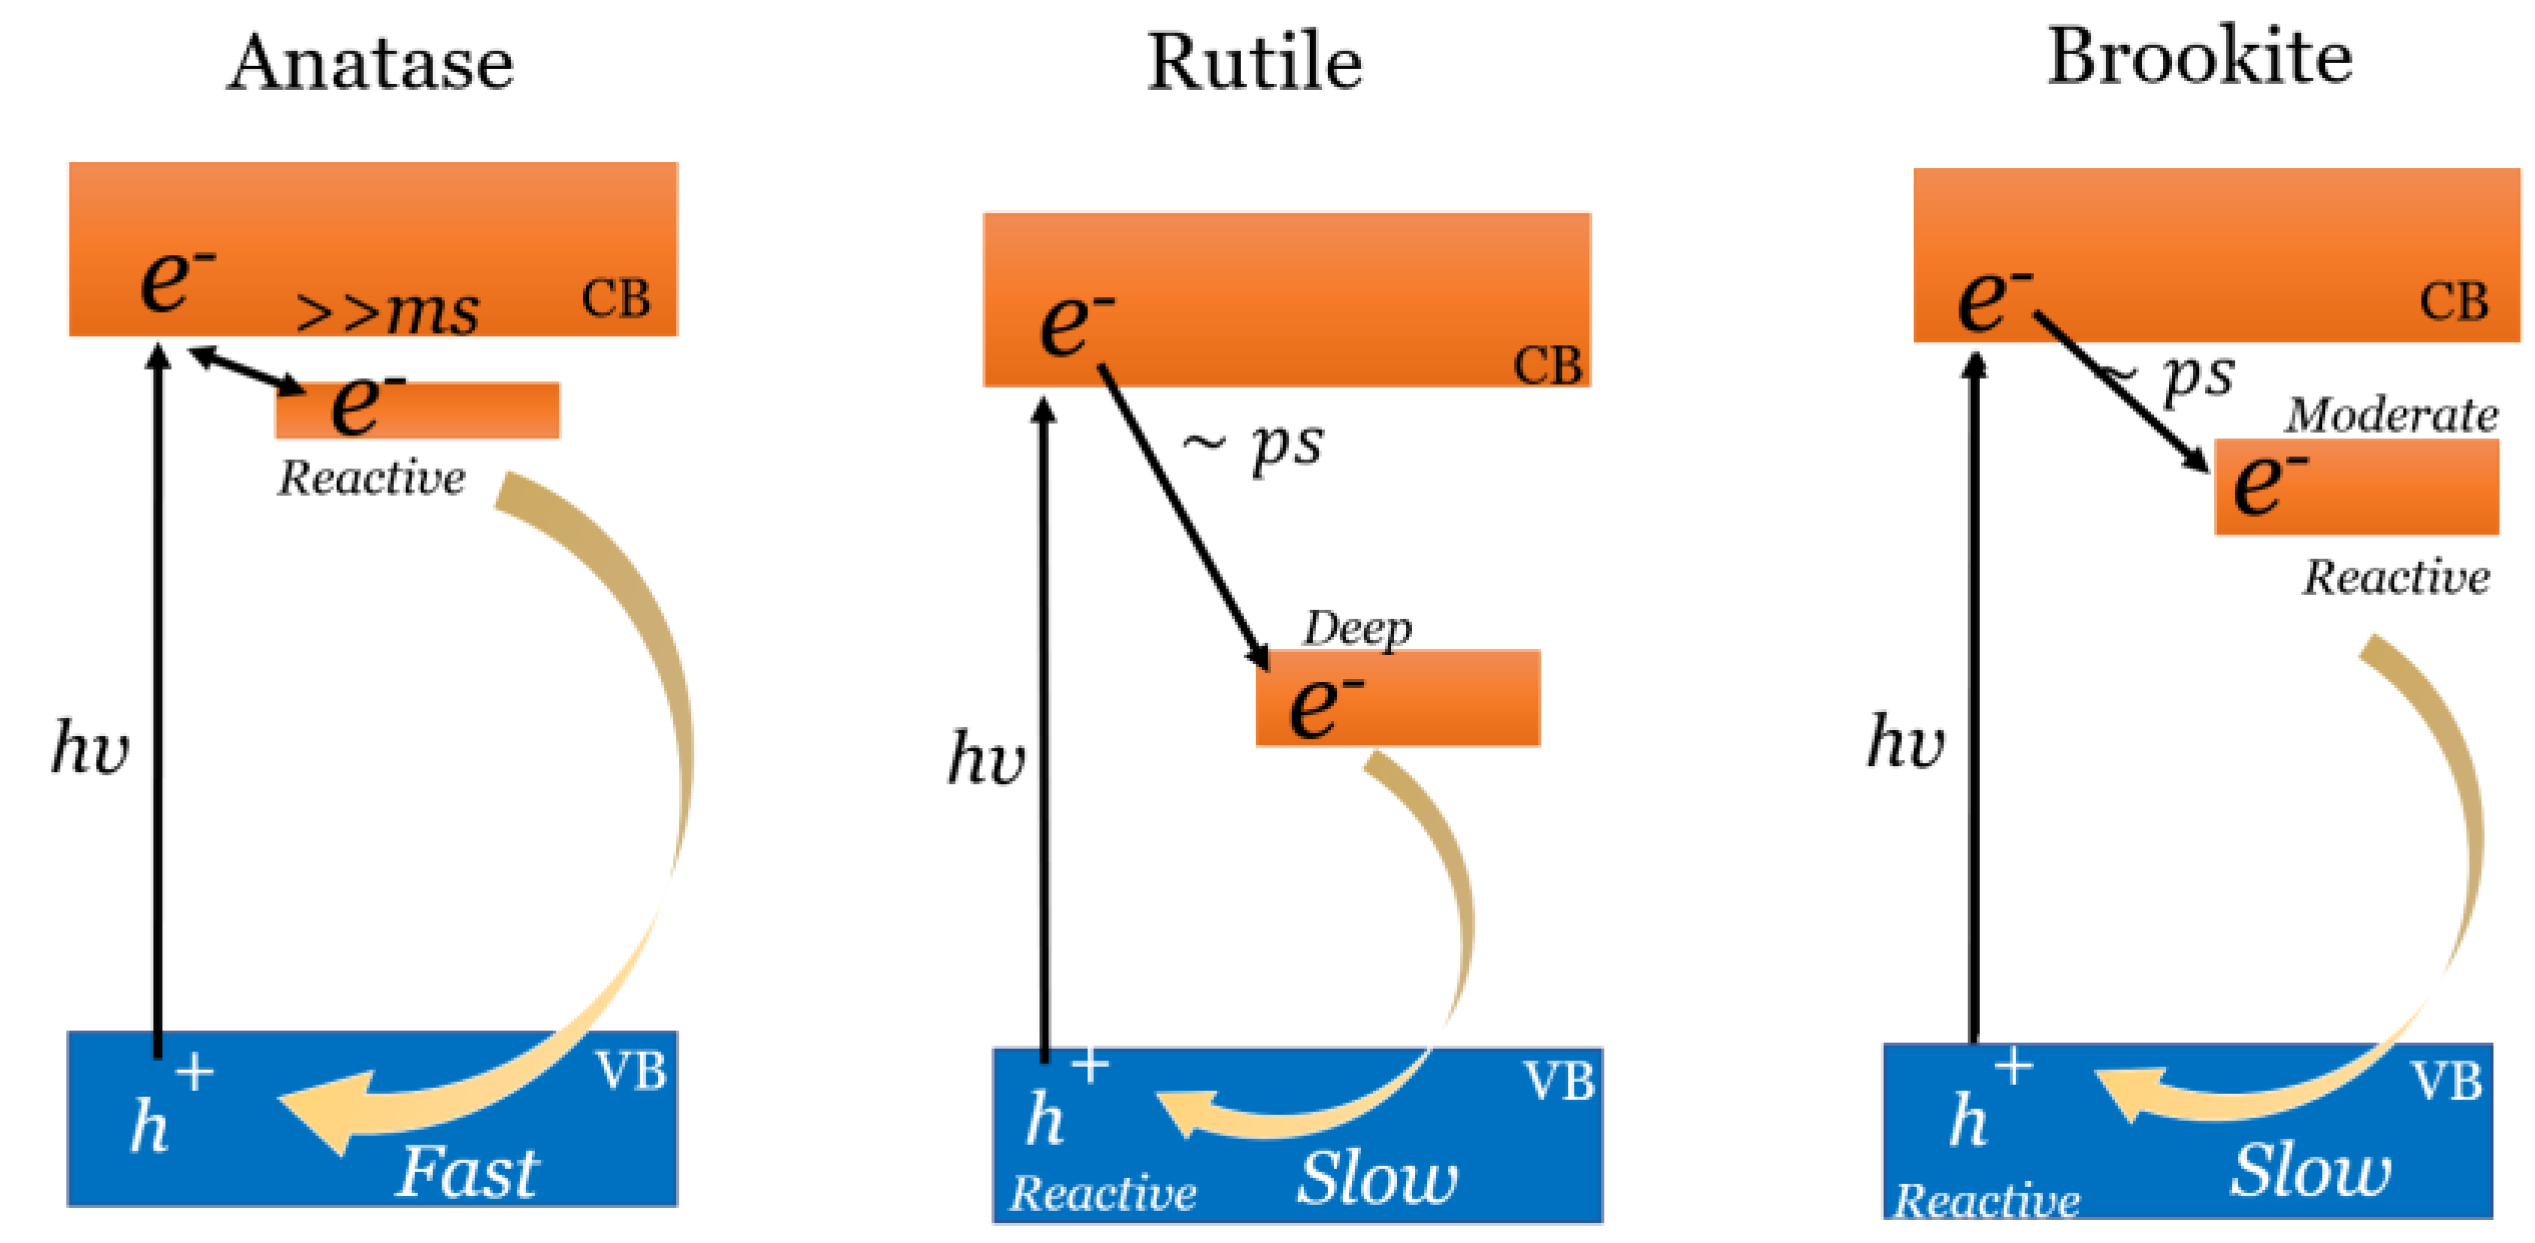
Figure 7.
Band–edge position of Ti3+–TiO2 relative to photocatalyzed reduction reactions. Heat treatment temperature (°C) applied to the catalyst: (A) 600, (B) 500, (C) 400, (D) 300, and (E) 200. Adapted from A. Yamakata et al. [105].
Figure 7.
Band–edge position of Ti3+–TiO2 relative to photocatalyzed reduction reactions. Heat treatment temperature (°C) applied to the catalyst: (A) 600, (B) 500, (C) 400, (D) 300, and (E) 200. Adapted from A. Yamakata et al. [105].
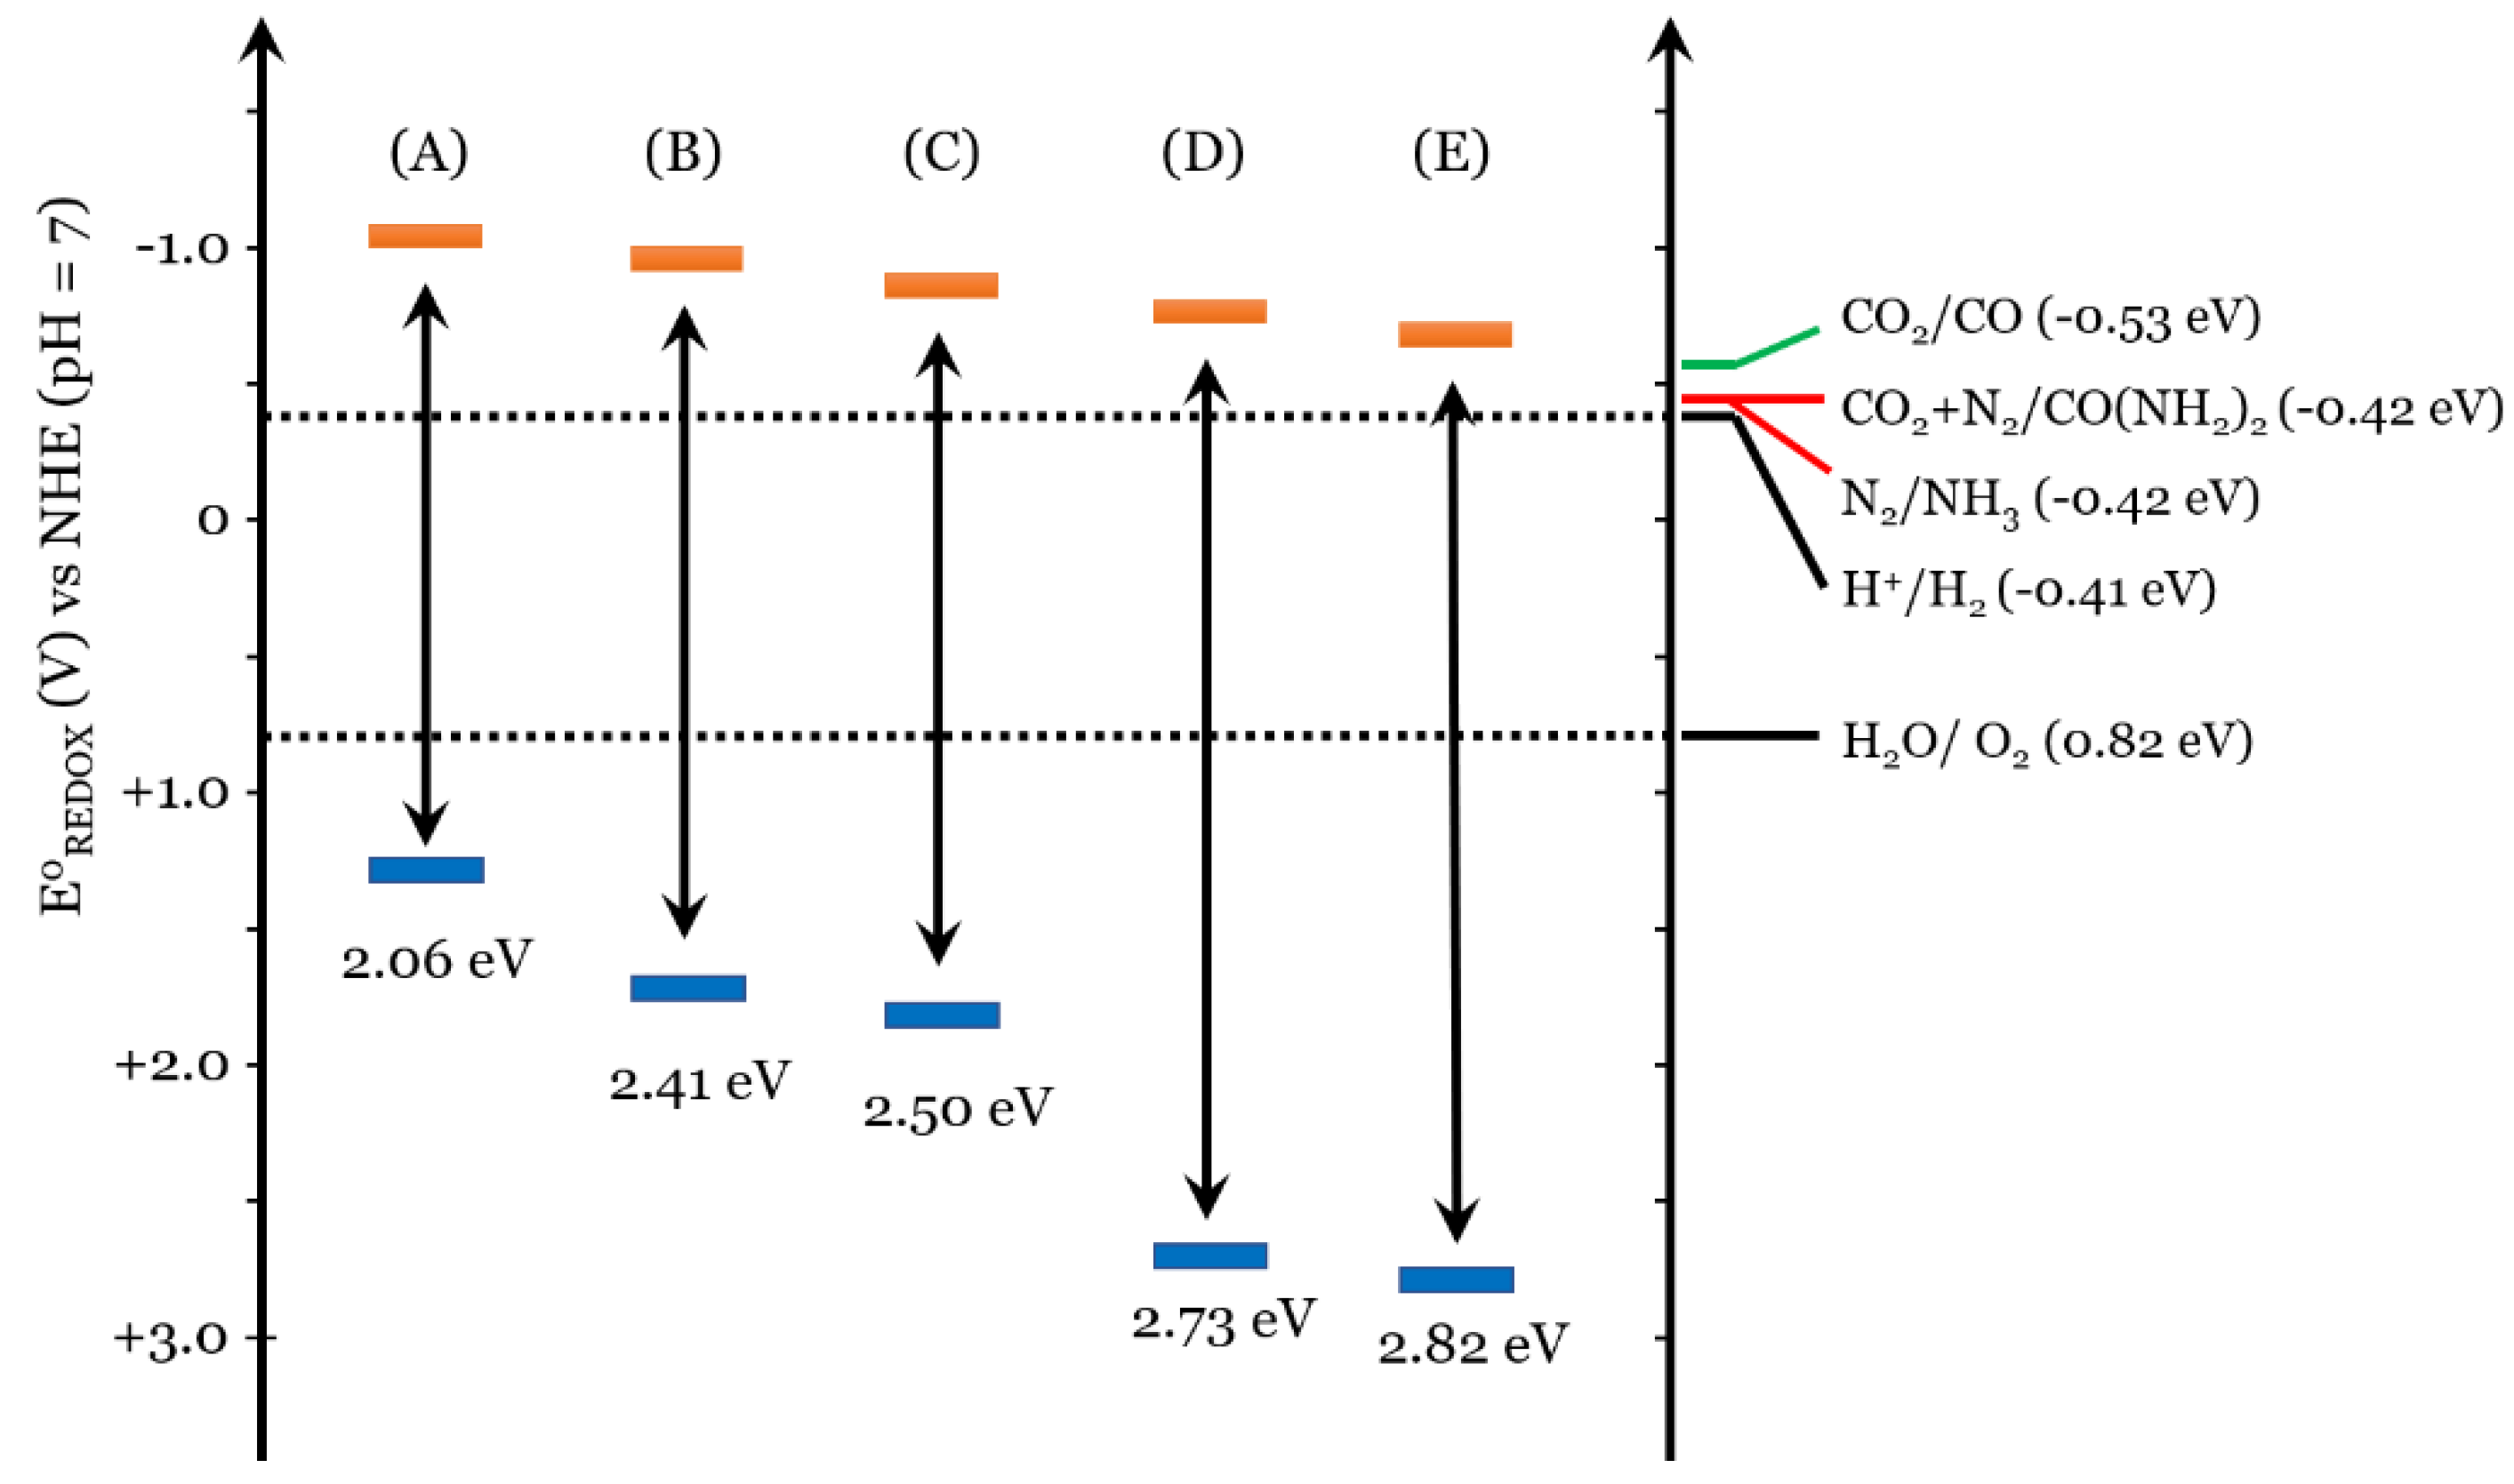

Table 1.
Amounts of products obtained by the photoinduced reduction of nitrate ions and carbon dioxide using different kinds of titanium dioxide photocatalysts. Adapted from S. Kuwabata et al. [41].
Table 1.
Amounts of products obtained by the photoinduced reduction of nitrate ions and carbon dioxide using different kinds of titanium dioxide photocatalysts. Adapted from S. Kuwabata et al. [41].
| Catalyst | Solvent | Amount of Products (µmol) | |||||
|---|---|---|---|---|---|---|---|
| Urea | Acetone | Methanol | NH4+ | H2 | Ti3+ | ||
| Q–TiO2/PVPD | PC | 5.6 | 61.0 | 1.2 | 2.7 | 0.18 | 0.14 |
| Q–TiO2 coloidal | PC | 0.22 | 2.5 | 0.12 | 0 | 0 | 0 |
| P–25 TiO2/PVPD | PC | 2.3 | 30.1 | 0.04 | 1.2 | 0.08 | – |
| P–25 Coloidal | PC | 0.1 | 1.1 | 0.05 | 0 | 0.06 | – |
| P–25 TiO2/PVPD | H2O | 0 | 0.07 | 0 | 0 | 0.01 | – |
Table 2.
Amount of product obtained by the photoinduced reduction reaction of lithium nitrate in solvents saturated with carbon dioxide. Adapted from T. Torimoto et al. [43].
Table 2.
Amount of product obtained by the photoinduced reduction reaction of lithium nitrate in solvents saturated with carbon dioxide. Adapted from T. Torimoto et al. [43].
| Solvent | Dielectric Constant, | Amount of Products (mM) (a) | |||
|---|---|---|---|---|---|
| Urea | NH3 | HCO2− | CO | ||
| Ethylene glycol monoethyl ether | 29.6 | 1.00 | 0.20 | 0.80 | 0.50 |
| Acetonitrile | 37.5 | 1.15 | 0.15 | 0.70 | 0.20 |
| Sulfolane | 43.0 | 1.00 | 0.20 | 0.40 | 0.25 |
| PC | 69.0 | 0.85 | 0.25 | 0.10 | 0.05 |
| Water | 78.5 | 2.75 | 0.75 | 0.10 | 0.05 |
(a) Calculated from data reported in diagrams and considering 5 cm3 as solution volume used in the cell.
Table 3.
Photoproduction ratio of urea and formate from 0.1 M NaNO3 solution with CO2 saturated using different TiO2 photocatalysts. Adapted from E.A. Ustinovich et al. [45].
Table 3.
Photoproduction ratio of urea and formate from 0.1 M NaNO3 solution with CO2 saturated using different TiO2 photocatalysts. Adapted from E.A. Ustinovich et al. [45].
| Catalyst | Amount of Products (mMh) (a) | Urea–Formate Ratio | |
|---|---|---|---|
| Urea | Formate | ||
| TiO2 | 0.28 | 0.11 | 2.5 |
| TiO2/Cu | 0.40 | 0.050 | 8.0 |
| PFD:TiO2 | 0.58 | 0.15 | 3.9 |
| PFD:TiO2/Cu | 1.12 | 0.025 | 45 |
(a) Calculated from data reported in diagrams.
Table 4.
Amount of urea synthesized by photocatalysis.
| Author | Catalyst | C Source | N Source | Solvent | Illumination Time, h | Urea, mM | Urea, mM h−1 |
|---|---|---|---|---|---|---|---|
| S. Kuwabata et al. [41] | Q–TiO2/PVPD | CO2, sat. | NH2OH 0.020 M (a) | PC | 1 | 5.7 (a,c) | 5.7 |
| B.-J. Liu et al. [42] | Q–TiO2/SiO2 | CO2, sat. | LiNO3 0.020 M | H2O | 5 | 2.75 (b) | 0.55 |
| D.G. Shchukin et al. [44] | Cu/TiO2–PVA–PAH/PSS (2.2 μm diameter) | CO2, sat. | NaNO3 0.1 M | H2O | 5 | 1.72 (c) | 0.34 |
| E.A. Ustinovich et al. [45] | Cu/TiO2:PFD | CO2, sat. | NaNO3 1.0 M | PDF:H2O | 1 | 1.1 (c,d) | 1.1 |
| B. Srinivas et al. [21] | Fe2TiO5(10wt%)/HZSM–5 | 2–propanol 1 v/v% | KNO3 0.016 M | H2O | 6 | 0.31 (e) | 0.052 |
| H. Maimaiti et al. [47] | Ti3+–TiO2/Fe–CNTs | CO2 (100 mL min−1 flow rate) | N2 (100 mL min−1 flow rate) | H2O | 4 | 0.710 (f) | 0.178 |
(a) Calculated from 3 cm3 volume of propylene carbonate solution used in the cell. (b) Calculated from data reported in charts and considering 5 cm3 as solution volume used in the cell. (c) Estimated value from data reported in charts. (d) Reported in mmol L−1 h−1, the normalized value per hour of irradiation is presented. (e) Converted from ppm to mmol L−1. (f) Converted from μmol L−1 g−1 and considered 1 g of catalyst.
Table 5.
Distribution of reaction products for photochemical urea synthesis.
| Amount of Products, mM | |||||||||||||||
| Photocatalyst | Time, h | C Source | N Source | Electron Donor | Solvent | Urea | NH3 | NH4+ | NO2− | (CH3)2CO | HCOO− | CH3OH | CO | H2 | Ref |
| Q–TiO2/PVPD | 5 (f) | CO2 sat. | LiNO3 0.020 M | 2–propanol 1.0 M | PC | 1.87 (a) | – | 0.90 (a) | – | 20.34 (a) | – | 0.40 (a) | – | 0.06 (a) | [41] |
| Q–TiO2 colloid | 5 (f) | CO2 sat. | LiNO3 0.020 M | 2–propanol 1.0 M | PC | 0.07 (a) | – | – | – | 0.83 (a) | – | 0.04 (a) | – | – | [41] |
| P–25 TiO2/PVPD | 5 (f) | CO2 sat. | LiNO3 0.020 M | 2–propanol 1.0 M | PC | 0.77 (a) | – | 0.40 (a) | – | 10.03 (a) | – | 0.01 (a) | – | 0.03 (a) | [41] |
| P–25 colloid | 5 (f) | CO2 sat. | LiNO3 0.020 M | 2–propanol 1.0 M | PC | 0.03 (a) | – | – | – | 0.04 (a) | – | 0.02 (a) | – | 0.02 (a) | [41] |
| P–25 TiO2/PVPD | 5 (f) | CO2 sat. | LiNO3 0.020 M | 2–propanol 1.0 M | H2O | – | – | – | – | 0.02 (a) | – | – | – | 0.003 (a) | [41] |
| Q–TiO2/PVPD | 5 (f) | CO sat. | LiNO3 0.020 M | 2–propanol 1.0 M | PC | 0.77 (a) | – | 1.4 (a) | – | 14.70 (a) | – | 0.97 (a) | – | 0.04 (a) | [41] |
| Q–TiO2/PVPD | 5 (f) | HCOOH 0.16 M | LiNO3 0.020 M | 2–propanol 1.0 M | PC | 1.9 (a) | – | 0.90 (a) | – | 19.03 (a) | – | – | – | 0.07 (a) | [41] |
| Q–TiO2/PVPD | 0.5 (f) | CO2 sat. | NH2OH 0.020 M | 2–propanol 1.0 M | PC | 2.99 (a,c) | – | 2.04 (a,c) | – | 8.88 (a,c) | – | 0.47 (a,c) | – | – | [41] |
| Q–TiO2/PVPD | 2 (f) | CO2 sat. | NO (gas) | 2–propanol 1.0 M | PC | 4.56 (a,c) | – | 0.41 (a,c) | – | 28.40 (a,c) | – | 0.34 (a) | – | – | [41] |
| Q–TiO2/SiO2 | 7 (f) | CO2 sat. | LiNO3 0.020 M | 2–propanol 1.0 M | Ac | 1.52 (b) | 0.24 (b) | – | – | 13.30 (b) | 0.84 (b) | – | 0.32 (b) | 0.004 (a,b) | [42] |
| Q–TiO2/SiO2 | 5 (f) | CO2 sat. | LiNO3 0.020 M | 2–propanol 1.0 M | Eg | 1.00 (b) | 0.20 (b) | – | – | – | 0.80 (b) | – | 0.50 (b) | – | [42] |
| Q–TiO2/SiO2 | 5 (f) | CO2 sat. | LiNO3 0.020 M | 2–propanol 1.0 M | Ac | 1.15 (b) | 0.15 (b) | – | – | – | 0.70 (b) | – | 0.20 (b) | – | [42] |
| Q–TiO2/SiO2 | 5 (f) | CO2 sat. | LiNO3 0.020 M | 2–propanol 1.0 M | Sf | 1.0 (b) | 0.20 (b) | – | – | – | 0.40 (b) | – | 0.25 (b) | – | [42] |
| Q–TiO2/SiO2 | 5 (f) | CO2 sat. | LiNO3 0.020 M | 2–propanol 1.0 M | PC | 0.85 (b) | 0.25 (b) | – | – | – | 0.10 (b) | – | 0.05 (b) | – | [42] |
| Q–TiO2/SiO2 | 5 (f) | CO2 sat. | LiNO3 0.020 M | 2–propanol 1.0 M | H2O | 2.75 (b) | 0.75 (b) | – | – | – | 0.10 (b) | – | 0.05 (b) | – | [42] |
| TiO2 | 5 (g) | CO2 sat. | NaNO3 0.1 M | PVA | PVA | 0.31 (c) | – | 0.04 (c) | – | – | 0.13 (c) | – | – | – | [44] |
| TiO2–PVA–PAH/PSS (8.1 μm capsule) | 5 (g) | CO2 sat. | NaNO3 0.1 M | PVA | PVA | 0.43 (c) | – | 0.08 (c) | – | – | 0.11 (c) | – | – | – | [44] |
| TiO2–PVA–PAH/PSS (4.2 μm capsule) | 5 (g) | CO2 sat. | NaNO3 0.1 M | PVA | PVA | 0.65 (c) | – | 0.15 (c) | – | – | 0.09 (c) | – | – | – | [44] |
| TiO2–PVA–PAH/PSS (2.2 μm capsule) | 5 (g) | CO2 sat. | NaNO3 0.1 M | PVA | PVA | 1.12 (c) | – | 0.38 (c) | – | – | 0.04 (c) | – | – | – | [44] |
| TiO2/Cu | 5 (g) | CO2 sat. | NaNO3 0.1 M | PVA | PVA | 0.49 (c) | – | 0.09 (c) | – | – | 0.21 (c) | – | – | – | [44] |
| TiO2/Cu–PVA–PAH/PSS (8.1 μm capsule) | 5 (g) | CO2 sat. | NaNO3 0.1 M | PVA | PVA | 0.70 (c) | – | 0.16 (c) | – | – | 0.19 (c) | – | – | – | [44] |
| TiO2/Cu–PVA–PAH/PSS (4.2 μm capsule) | 5 (g) | CO2 sat. | NaNO3 0.1 M | PVA | PVA | 1.05 (c) | – | 0.32 (c) | – | – | 0.23 (c) | – | – | – | [44] |
| TiO2/Cu–PVA–PAH/PSS (2.2 μm capsule) | 5 (g) | CO2 sat. | NaNO3 0.1 M | PVA | PVA | 1.72(c) | – | 0.67 (c) | – | – | 0.21 (c) | – | – | – | [44] |
| TiO2 | 1 (h) | CO2 sat. | NaNO3 1.0 M | 2–propanol 1.0 M | PFD–H2O | 0.3 (c,d) | – | – | – | 0.1 (c,d) | – | – | [45] | ||
| TiO2/Cu | 1 (h) | CO2 sat. | NaNO3 1.0 M | 2–propanol 1.0 M | PFD–H2O | 0.4 (c,d) | – | – | – | 0.1 (c,d) | – | – | [45] | ||
| PFD:TiO2 | 1 (h) | CO2 sat. | NaNO3 1.0 M | 2–propanol 1.0 M | PFD–H2O | 0.6 (c,d) | – | – | – | – | 0.2 (c,d) | – | – | [45] | |
| PFD:TiO2/Cu | 1 (h) | CO2 sat. | NaNO3 1.0 M | 2–propanol 1.0 M | PFD–H2O | 1.1 (c,d) | – | – | – | – | 0.03 (c,d) | – | – | [45] | |
| TiO2 | 6 (i) | Oxalic acid 1% w/v | KNO3 0.016 M | Oxalic acid 1% w/v | H2O | 0.18 (e) | 0.12 (e) | – | – | – | – | – | – | – | [21] |
| TiO2 | 6 (i) | Oxalic acid 1% w/v | KNO3 0.016 M | 2–propanol 1% v/v | H2O | 0.20 (e) | 0.15 (e) | – | – | – | – | – | – | – | [21] |
| TiO2 | 6 (i) | – | KNO3 0.016 M | – | H2O | – | 0.05 (e) | – | Trace | – | – | – | – | – | [21] |
| TiO2 (5% wt)–Zeolite | 6 (i) | 2–propanol 1% v/v | KNO3 0.016 M | 2–propanol 1% v/v | H2O | 0.07 (e) | 0.21 (e) | – | 0.1 (e) | – | – | – | – | – | [21] |
| TiO2 (10% wt)–Zeolite | 6 (i) | 2–propanol 1% v/v | KNO3 0.016 M | 2–propanol 1% v/v | H2O | 0.10 (e) | 0.11 (e) | – | 0.14 (e) | – | – | – | – | – | [21] |
| TiO2 (15% wt)–Zeolite | 6 (i) | 2–propanol 1% v/v | KNO3 0.016 M | 2–propanol 1% v/v | H2O | 0.05 (e) | 0.05 (e) | – | 0.08 (e) | – | – | – | – | – | [21] |
| Fe2TiO5 | 6 (i) | 2–propanol 1% v/v | KNO3 0.016 M | 2–propanol 1% v/v | H2O | 0.20 (e) | 0.05 (e) | – | 0.002 (e) | – | – | – | – | – | [21] |
| Fe2Ti2O7 | 6 (i) | 2–propanol 1% v/v | KNO3 0.016 M | 2–propanol 1% v/v | H2O | 0.09 (e) | 0.12 (e) | – | 0.01 (e) | – | – | – | – | – | [21] |
| Fe2TiO5 (10%wt)/HZSM–5 | 6 (i) | 2–propanol 1% v/v | KNO3 0.016 M | 2–propanol 1% v/v | H2O | 0.31 (e) | 0.15 (e) | – | 0.22 (e) | – | – | – | – | – | [21] |
| Fe2TiO5 (10%wt)/HZSM–5 | 6 (i) | 2–propanol 1% v/v | KNO3 0.016 M | Oxalic acid 1% w/v | H2O | 0.15 (e) | 0.09 (e) | – | 0.20 (e) | – | – | – | – | – | [21] |
| Fe2Ti2O7 (10%wt)/HZSM–5 | 6 (i) | 2–propanol 1% v/v | KNO3 0.016 M | 2–propanol 1% v/v | H2O | 0.12 (e) | 0.01 (e) | – | 0.03 (e) | – | – | – | – | – | [21] |
| Ti3+–TiO2 (200 °C) | 4 | – | N2 100 mL min−1 | CO2 100 mL min−1 | H2O | 0.0152 (j) | 0.0176 (j) | – | – | – | – | – | – | – | [47] |
| Ti3+–TiO2 (300 °C) | 4 | – | N2 100 mL min−1 | CO2 100 mL min−1 | H2O | 0.0298 (j) | 0.027 (j) | – | – | – | – | – | – | – | [47] |
| Ti3+–TiO2 (400 °C) | 4 | – | N2 100 mL min−1 | CO2 100 mL min−1 | H2O | 0.1543 (j) | 0.0778 (j) | – | – | – | – | – | – | – | [47] |
| Ti3+–TiO2 (500 °C) | 4 | – | N2 100 mL min−1 | CO2 100 mL min−1 | H2O | 0.0836 (j) | 0.2227 (j) | – | – | – | – | – | – | – | [47] |
| Ti3+–TiO2 (600 °C) | 4 | – | N2 100 mL min−1 | CO2 100 mL min−1 | H2O | 0.0631 (j) | 0.4529 (j) | – | – | – | – | – | – | – | [47] |
| 70%–Ti3+–TiO2/CNTs (400 °C) | 4 | – | N2 100 mL min−1 | CO2 100 mL min−1 | H2O | 0.3332 (j) | 0.0704 (j) | – | – | – | – | – | – | – | [47] |
| 75%–Ti3+–TiO2/CNTs (400 °C) | 4 | – | N2 100 mL min−1 | CO2 100 mL min−1 | H2O | 0.4079 (j) | 0.064.5 (j) | – | – | – | – | – | – | – | [47] |
| 80%–Ti3+–TiO2/CNTs (400 °C) | 4 | – | N2 100 mL min−1 | CO2 100 mL min−1 | H2O | 0.7101 (j) | 0.0727 (j) | – | – | – | – | – | – | – | [47] |
| 85%–Ti3+–TiO2/CNTs (400 °C) | 4 | – | N2 100 mL min−1 | CO2 100 mL min−1 | H2O | 0.414 (j) | 0.01621 (j) | – | – | – | – | – | – | – | [47] |
| 90%–Ti3+–TiO2/CNTs (400 °C) | 4 | – | N2 100 mL min−1 | CO2 100 mL min−1 | H2O | 0.1142 (j) | 0.03663 (j) | – | – | – | – | – | – | – | [47] |
(a) Calculated from 3 cm3 volume of propylene carbonate solution used in the cell. (b) Calculated from data reported in charts and considering 5 cm3 as the solution volume used in the cell. (c) Estimated value from data reported in charts. (d) Reported value in mmol L−1 h−1, the normalized value per hour of radiation is presented. (e) Converted from ppm to mmol L−1. Light source: (f) 500 W High–Pressure Hg arc lamp, (g) Hg–Xe Lamp, (h) 120 W High–pressure Hg lamp, (i) 250 W High–pressure Hg lamp. (j) Converted from μmol L−1 g−1 and considered 1 g of catalyst.
Table 6.
Energy consumption comparison required for urea production by data reported.
| Authors | Catalyst | Wattage Light Source, W | Irradiance, W cm−2 | Irradiated Effective Area, cm2 (a) | Illumination Time, h | Amount of Urea Produced, mg (e) | Energy Consumption, MWh cm−2 ton−1 | Energy Consumption, MWh ton−1 |
|---|---|---|---|---|---|---|---|---|
| S. Kuwabata et al. [41] | Q–TiO2/PVPD | 500 | 0.36 | 2.5 (b) | 1 | 1.03 (f) | 350 | 876 |
| B.-J. Liu et al. [42] | Q–TiO2/SiO2 | 500 | 1.00 | 2.0 (c) | 5 | 1.49 (g) | 6.05 × 10³ | 1.21 × 10⁴ |
| D.G. Shchukin et al. [44] | Cu/TiO2–PVA–PAH/PSS (2.2 μm diametre) | 120 | 0.02 | 0.79 (d) | 5 | 0.52 (g) | 194 | 152 |
| E.A. Ustinovich et al. [45] | Cu/TiO2:PFD | 120 | 20 | ND | 1 | 1.06 (h) | 1.89 × 10⁴ | – |
| B. Srinivas et al. [21] | Fe2TiO5(10wt%)/HZSM–5 | 250 | ND | ND | 6 | 1.86 (i) | – | – |
| H. Maimaiti et al. [47] | 80%–Ti3+–TiO2 | 300 | ND | ND | 4 | 0.7101 | – | – |
(a) Area reported under light source: (b) Pt mesh supported for Q–TiO2/PVPD film, (c) Quartz sheet support for QTiO2/SiO2 film, (d) 1 cm2 diameter quartz window in the cell used. (e) Data calculated from Table 4 and volume solution used in the cell used by the author: (f) 3 cm3, (g) 5 cm3, (h) A volume of 16 cm3 prepared emulsion, and (i) 100 cm3 of volume batch capacity was estimated. ND: No data available.
Publisher’s Note: MDPI stays neutral with regard to jurisdictional claims in published maps and institutional affiliations. |
© 2022 by the authors. Licensee MDPI, Basel, Switzerland. This article is an open access article distributed under the terms and conditions of the Creative Commons Attribution (CC BY) license (https://creativecommons.org/licenses/by/4.0/).
Share and Cite
MDPI and ACS Style
Matamala-Troncoso, F.; Isaacs, M.; Sáez-Navarrete, C. Photocatalyzed Production of Urea as a Hydrogen–Storage Material by TiO2–Based Materials. Photochem 2022, 2, 539-562. https://doi.org/10.3390/photochem2030038
AMA Style
Matamala-Troncoso F, Isaacs M, Sáez-Navarrete C. Photocatalyzed Production of Urea as a Hydrogen–Storage Material by TiO2–Based Materials. Photochem. 2022; 2(3):539-562. https://doi.org/10.3390/photochem2030038
Chicago/Turabian StyleMatamala-Troncoso, Felipe, Mauricio Isaacs, and César Sáez-Navarrete. 2022. "Photocatalyzed Production of Urea as a Hydrogen–Storage Material by TiO2–Based Materials" Photochem 2, no. 3: 539-562. https://doi.org/10.3390/photochem2030038