
Enhancing Bi2Te2.70Se0.30 Thermoelectric Module Performance through COMSOL Simulations

1
Department of Electrical and Electronic Engineering, Islamic University, Kushtia 7003, Bangladesh
2
Department of Electrical and Electronics Engineering, Manisa Celal Bayar University, Manisa 45140, Türkiye
*
Author to whom correspondence should be addressed.
Thermo 2024, 4(2), 185-201; https://doi.org/10.3390/thermo4020011
Submission received: 26 February 2024
/
Revised: 4 May 2024
/
Accepted: 5 May 2024
/
Published: 6 May 2024
(This article belongs to the Special Issue Numerical Simulations for Thermal Engineering and Thermodynamic Systems)
Abstract
:This research employs the COMSOL Multiphysics software (COMSOL 6.2) to conduct rigorous simulations and assess the performance of a thermoelectric module (TEM) meticulously crafted with alumina (Al2O3), copper (Cu), and Bi2Te2.70Se0.30 thermoelectric (TE) materials. The specific focus is on evaluating diverse aspects of the Bi2Te2.70Se0.30 thermoelectric generator (TEG). The TEM design incorporates Bi2Te2.70Se0.30 for TE legs of the p- and n-type positioned among the Cu layers, Cu as the electrical conductor, and Al2O3 serving as an electrical insulator between the top and bottom layers. A thorough investigation is conducted into critical parameters within the TEM, which include arc length, electric potential, normalized current density, temperature gradient, total heat source, and total net energy rate. The geometric configuration of the square-shaped Bi2Te2.70Se0.30 TEM, measuring 1 mm × 1 mm × 2.5 mm with a 0.25 mm Al2O3 thickness and a 0.125 mm Cu thickness, is scrutinized. This study delves into the transport phenomena of TE devices, exploring the impacts of the Seebeck coefficient (S), thermal conductivity (k), and electrical conductivity (σ) on the temperature differential across the leg geometry. Modeling studies underscore the substantial influence of S = ±2.41 × 10⁻³ V/K, revealing improved thermal conductivity and decreased electrical conductivity at lower temperatures. The findings highlight the Bi2Te2.70Se0.30 TEM’s high potential for TEG applications, offering valuable insights into design and performance considerations crucial for advancing TE technology.
1. Introduction
The escalating need to reduce reliance on fossil fuels and explore eco-friendly energy alternatives has spurred numerous research initiatives. Among these, the direct conversion of thermal energy to electricity through thermoelectricity has emerged as a promising avenue for addressing waste heat and enhancing energy efficiency. This approach has garnered global attention for its potential contributions to air conditioning, electricity generation, and the overall minimization of environmental impact. TE materials, with their unique ability to convert heat energy into electricity, are actively under investigation for their thermal characteristics, encompassing intricate crystal structures and promising potential [1]. In the pursuit of superior TE materials, optimizing key parameters such as Seebeck coefficients and electrical and thermal conductivity is of paramount importance. Materials achieving device-quality status exhibit favorable attributes, including high Seebeck coefficients, low thermal conductivity, and enhanced electrical conductivity [2]. In this regard, the Bi2Te3 material is especially important since it has an outstanding figure of merit without dimensions (ZT) of about 1 at ambient temperature. ZT = S2σT/k is the equation used to determine the ZT value, a crucial parameter. In this formula, the symbols S, σ, k, and T represent the Seebeck coefficient in V/K, electrical conductivity in S/m, thermal conductivity in W/(m×K), and temperature in Kelvin, respectively. A ZT value larger than unity is necessary for optimal outcomes, and increasing the ZT value is the primary objective in the development of TE devices. Despite maintaining an average ZT value of about 1.15 over the last four decades for commercial TE materials, recent laboratory research has shown potential for elevating ZT values by using low-dimensional features, like nanostructures, to reduce lattice (phonon) thermal conductivity and hence effectively hinder phonon transport [3].
The challenges associated with the relatively low conversion efficiency of TE technology hinder its widespread use. Strategies to improve the ZT value include boosting the power factor (S2σ) or lowering thermal conductivity through approaches like band structure engineering, the energy filtering effect, point defects, dislocation, and nanostructure engineering. Carrier mobility and concentration impact thermal and electrical conductivity, which is modifiable via band structure engineering. Energy filtering creates barriers to scattering phonons efficiently, reducing thermal conductivity without majorly affecting electrical conductivity. This study probes transport phenomena, analyzing the Seebeck coefficient, thermal conductivity, and electrical conductivity effects on temperature differentials within the device’s geometry. Notably, Bi2Te3-based alloys, renowned for use in commercial TE applications close to ambient temperature because of their exceptional power factor, have been extensively researched. Bi2Te2.70Se0.30 garners attention in materials science for its unique composition and exceptional TE performance. Researchers use TEM to delve into its intricate microstructure, especially for TEG advancement. Understanding its TE behavior, crucial for efficient heat-to-electricity conversion, relies on this interplay. TEM analysis assesses parameters like temperature distribution, electric potential, and heat-source temperature gradient, uncovering factors affecting its thermal performance [4]. It finds utility in energy harvesting, cooling devices, and TEGs. While p-type Bi2Te3-based materials exhibit very high ZT values of 1.4–1.8, the ZT of n-type Bi2Te3-based materials has seldom exceeded 1.0. Achieving a ZT of 1.2 for an n-type Bi2Te3-based alloy obtained through hot deforming and/or liquid-state manipulation is ascribed to the mutually beneficial interaction of a high power factor and a decrease in lattice thermal conductivity [5]. The efficacy of TEGs in generating power is intricately tied to both the properties of TE materials and operational conditions. Previous studies have primarily focused on the development and evaluation of Bi2Te3 and substances with nanostructures made from Bi2Te3, spanning a diverse range of TE applications [6,7,8,9,10]. The exceptional electrical and thermal properties of Bi2Te3 make it highly suitable for converting waste heat into electrical power. TEGs constructed with Bi2Te3 semiconductors find particular utility as stable and reliable power devices in electric generation applications such as space probes, remote sensors, and automotive waste heat recovery systems [11]. The Seebeck effect, fundamental to TEGs as solid-state devices, enables the harnessing of temperature gradients for electric power generation. This capability makes TEGs efficient solutions for scenarios involving temperature gradients. In [12], the authors explored novel modifications to the Seebeck effect to enhance TE efficiency and investigated unusual phenomena like TE effects in low-dimensional materials and the spin Seebeck effect to advance TE energy conversion, contributing to more efficient and sustainable power generation technologies. Numerical studies and simulations of TEG devices in COMSOL Multiphysics show great promise for additional study and a wide range of industrial applications. The ideal dimensions for TEMs have been found through the use of three-dimensional finite element simulations with COMSOL Multiphysics [13]. A research study has evaluated TE materials’ physics and design, including how leg dimensions affect TEM performance [14,15,16]. In TEG design, a pivotal consideration lies in the selection of semiconductor materials and setting the upper limit for the operational temperature of the TEG. Low internal resistance is desired in TEGs to increase electrical power output while minimizing power consumption [17]. Choosing the right semiconductor material is crucial for TEG efficiency. Reducing internal resistance, especially contact resistance, improves power output efficiency, which is vital for maximizing energy conversion and minimizing consumption. Contact resistance is a contributing factor to this internal resistance, and minimizing it is desirable [18]. In [18], the authors probably explored various approaches to decreasing contact resistance in TEGs. These methods offer better control over interface properties, diminish parasitic effects, boost electrical conductivity, and ultimately enhance TEG performance. Thermal conductivity changes with TEG temperature, and it is advantageous for this thermal conductivity to be lower than that of the permeability enclosure [19]. Bi2Te3-based alloys, recognized as premier room-temperature thermoelectric materials, find extensive use in thermoelectric refrigeration. Bi2Te2.70Se0.30 alloy ingots, fabricated through the zone-melting method, present practicality for large-scale commercial applications [20]. The Bi2Te2.70Se0.30 thin film is recognized as a Bi2Te3-based material exhibiting superior TE performance, characterized by the highest ZT or power factor at room temperature. The band gap values for Bi2Te2.70Se0.30 and Bi2Te3 thin films were determined to be 0.81 eV and 0.97 eV, respectively. The increase in the energy gap of the Bi2Te2.70Se0.30 has two reasons with respect to its thin film. Firstly, increased transparency is observed in the Bi2Te2.70Se0.30 thin layer in contrast to the Bi2Te3 thin film. Secondly, the Bi2Te2.70Se0.30 thin film exhibits a larger grain size (21.8 nm) in comparison to that of the Bi2Te3 thin film (10.8 nm) [21]. Despite the potential of various TE materials such as PbTe, GeTe, Bi2Te2.70Se0.30, and Bi0.5Sb1.50Te3, challenges related to excessive expense and inefficiency have limited their widespread utilization in diverse applications. This paper presents a comprehensive focus on the distinct facets of the doping procedures applied to Bi2Te3-based materials, addresses challenges, and proposes promising strategies for overcoming them. The emphasis on doping techniques for Bi2Te3-based materials is aimed at optimizing carrier mobility and concentration, both of which are essential for enhancing TE performance. The doping agents have proven especially effective in achieving this goal. In [22], the authors conclude that the manufacturing of nanostructured materials, the doping procedure, and specimen annealing contribute significantly to improving the performance of Bi2Te3-based TE materials. The study emphasizes the advantages of Bi2Te3-based TEM for thermal energy recovery over conventional methods, showing its suitability for heat flow scenarios [23]. Teffah et al. explore a novel TEC–TEG module with components wired in series, including TEC, TEG, and a heatsink [24]. They demonstrate how TEG, operating at voltages from 1 to 5 V, functions as a partial TEC cooling system, utilizing the Seebeck effect to convert waste heat into energy. The authors develop an efficient cooling and power generation model for TE cascades through theoretical analysis and experimental validation using COMSOL Multiphysics. Högblom et al. introduce a method for calculating contact resistances in TEGs, underscoring their significance for module performance [25]. Their study, incorporating full-scale modules, identifies these resistances using non-linear regression analysis combined with 3D finite element models and testing. Statistical analysis reveals the importance of considering contact resistances in TEG analysis, as neglecting them leads to a significant overestimation of heat flow and power production. This work provides valuable insights into optimizing TEG performance by reducing contact resistances.
This research employs COMSOL Multiphysics to comprehensively analyze a TEM incorporating alumina (Al2O3), copper (Cu), and Bi2Te2.70Se0.30 TE materials. Focusing on critical parameters such as normalized current density, electric potential, and temperature gradient, this study delves into transport phenomena, assessing the influences of the Seebeck coefficient (S), thermal conductivity (k), and electrical conductivity (σ) on the TEM’s performance. Emphasizing the substantial potential of the Bi2Te2.70Se0.30 TEM for TEG applications, this research provides valuable insights into design considerations crucial for advancing TE technology, laying the foundation for further exploration in the field. The aim of this work is to evaluate the thermal energy generation capability of the TEM with the material Bi2Te2.70Se0.30. It looks at important factors including arc length, electric potential, and temperature fluctuations inside the TEM, in addition to the impacts of factors like thermal conductivity and the Seebeck coefficient. Understanding how to advance and improve thermoelectric technology is the ultimate goal, especially for Bi2Te2.70Se0.30 TEMs that generate electricity. To improve this performance, the field can frequently employ a trial-and-error-less methodology. While this program has so far proven successful in assisting in the production of TEG, there may be a few distinct measurement parameters. Accurately modeling complex material properties and interfaces in COMSOL Multiphysics for TE materials and devices poses challenges, particularly in ensuring precision with TE properties. Validating simulation results against experimental data from other studies requires a direct comparison of simulated and measured values. Ensuring consistency across critical parameters is crucial for confirming the reliability and accuracy of the simulation in forecasting the performance of TE materials for TEG applications.
2. Materials and Methods
This process involves using alumina as the top and bottom layers’ insulators and with copper acting as conductors in between these insulator layers. Bi2Te2.70Se0.30 is used as both TE legs in the copper layers of the p- and n-type. Utilizing nanomaterial-based interface layers, such as graphene or carbon nanotubes, offers a promising approach to reducing contact resistance in TEGs. These materials exhibit superior thermal and electrical conductivity compared to traditional methods, minimizing interfacial barriers and enhancing energy transfer efficiency. By enhancing interface qualities and facilitating efficient heat and electrical transport, these advanced technologies surpass conventional methods like mechanical contacts or soldering. Leveraging novel materials and fabrication techniques enhances TEG performance and efficiency across various energy conversion applications, driving forward TE technology. The material properties utilized for simulation purposes are detailed in Table 1. The parameters employed in all the investigations were a load resistance of 0.42 ohms and an input voltage of 7.125 volts.
The internal resistances of the TE module negatively impact its efficiency, leading to power losses. One method to measure this impact is by considering the internal resistance of the TE module. The efficiency of the TE module, taking into account these internal resistances, can be calculated as follows:
where ΔT is the temperature difference across the TE module, I is the electric current flowing through the TE module, and is the internal resistance. When the internal resistance increases, so does the power loss, resulting in a decrease in the overall efficiency of the TE module. Therefore, it is essential to minimize internal resistances to maximize the performance of TE devices.
This study systematically investigates the influence of various factors on electric potential, temperature gradient, total net energy rate, and normalized current density, with a specific emphasis on evaluating key aspects of the Bi2Te2.70Se0.30 TEG. The analysis delves into the transport phenomena of TE devices, exploring the impacts of the Seebeck coefficient (S), thermal conductivity (k), and electrical conductivity (σ) on the temperature differential across the leg geometry. In fact, the height, breadth, and length of the Bi2Te2.70Se0.30 TEM as well as the thicknesses of the TE material layers (alumina and copper) used in the module are often important variables. We examined every parameter in our earlier report [26] in relation to a few crucial functions before making a parameter recommendation. In addition, the choice of TE materials and the arrangement of the p- and n-type legs are additional characteristics that could be considered when defining a module as standard. Every element of the studied TEM’s criteria is standard. The standard geometry of the Bi2Te2.70Se0.30 TEM is illustrated in Figure 1. According to an earlier report, the simulation illustrates the potential difference between its hot and cold sides, surface temperature variation with electric potential, normalized current density variation, and performance evaluation across different parameters.
Numerical modeling studies have been conducted using 3D finite element analysis within the COMSOL Multiphysics software to simulate TEGs. The governing equations for heat transfer in solids utilized in the simulation, based on the finite element method, are expressed as follows:
where represents the materials’ density (kg/m3), depicts the specific heat (J/(kg×K)), represents the velocity (m/s), represents the heat source (W/m3), represents the thermoelastic effects (W/m3), represents the conduction heat flux (W/m2), and indicates the temperature gradient (K/m). The heat flux in conduction is given below:
where is the thermal conductivity (W/(m×K)), represents the density of induced electric current (A/m2), and is the coefficient of Seebeck (V/K). Equations for electric currents are explained as follows:
where represents the current source (A/m3); is the electrical conductivity (S/m); represents the density of external current (A/m2); is the electric field (V/m); and represents the potential (V). Equations for TE effects are given below:
where represents the Peltier power or heat source (W/m3), and represents the Peltier coefficient (W/A×K). When there is a temperature difference between the hot and cold surfaces of the TEG, the TEG generates an open circuit voltage as expressed below:
where represents the open circuit voltage (V) of the TEG. When connecting a load resistor to the TEG, the expression for the generated power by the TEG is as follows:
where the internal resistance of the TEG is represented by , and refers to the external load resistance (Ω). Generated maximum power by the TEG is achieved when matching the values of = . The expression for the heat transfer at the TEG’s heated side is as follows:
where denotes the temperature (K) of the hot side of the TEG and represents the electric current (A). In the simulation of the heat equation, crucial initial parameters must be provided to accurately model the material’s thermal behavior. The simulation tool is provided with the initial parameters of a load resistance of 0.42 ohms and an input voltage of 7.125 volts. These parameters are then applied to the model input section, which utilizes a volume reference temperature of that is equal to 293.15 K. These parameters include defining the geometry of the system, specifying the material properties, setting boundary conditions to account for external influences like heat flux or convection, selecting appropriate solver settings, defining initial temperature distributions within the material, specifying time-dependent parameters if simulating transient behavior, setting meshing parameters for discretization, choosing the relevant physics interfaces, selecting suitable solvers, and specifying post-processing options for analyzing simulation results. In this investigation, all of these parameters ensure the fidelity of the simulation, providing valuable insights for the development of TE applications of Bi2Te2.70Se0.30.
3. Results and Discussion
Figure 2 illustrates the intriguing interaction of electric potential between the cold and hot sides in the Bi2Te2.70Se0.30 TEM analysis. In this investigation, a load resistance of 0.42 ohms and an input voltage of 7.125 volts were employed. The electric potential range spans from 3.37 × 10⁻⁷ to 7.12 volts across the cold and hot sides of the TEM. Understanding the electrical output of the TEM under varied conditions is essential for enhancing its performance.
The shift in electric potential explored in this study is instrumental in unraveling the intricate dynamics of TEG operation. It is crucial to evaluate and fine-tune the performance of TEGs to maximize the spectrum of potential TE energy conversion. This endeavor is pivotal in advancing the efficiency and applicability of TE technology. This voltage gradient signifies the difference in electrical potential between the two sides of the TEM, which is essential for driving the TE conversion process. When heat transfers from the heated to the cooled side, it generates a voltage potential that can be harnessed to produce electrical power through the Seebeck effect. The observed range of electric potential highlights the dynamic behavior of the TEG, indicating its responsiveness to changes in temperature differentials and its potential for efficient energy conversion. Understanding and optimizing this voltage range is crucial for maximizing the performance and efficiency of TE systems in various applications, including waste heat recovery, renewable energy generation, and thermal management. Moreover, studying how surface temperature changes with electric potential not only improves our comprehension of Bi2Te2.70Se0.30 behavior but also offers vital insights for enhancing its performance in real-world applications.
The difference in temperature between the TEM’s hot and cold sides strongly influences the electric potential generated. A higher temperature gradient typically results in a greater electric potential, as per the Seebeck effect. Figure 3 depicts the intricate relationship between surface temperature and electric potential for Bi2Te2.70Se0.30 TEMs. The inverse relationship between temperature and electric potential in TEGs underscores the importance of temperature regulation to maximize energy conversion efficiency. Lower temperatures on the cold side of the TEM yield higher electric potential outputs, emphasizing the necessity for reliable thermal management in TEG design and operation. This insight provides strategies for managing temperature differentials to optimize TEG performance, thereby enhancing efficiency and energy harvesting potential for practical applications such as waste heat recovery and renewable energy production.
Noteworthy fluctuations in electric potential are discerned across a temperature range spanning from 20 to 57.5 °C. The graph illustrates a comprehensive spectrum of electric potential, ranging from 3.67 to 7.125 volts, underscoring the nuanced interplay between temperature variations and electrical behavior. This inverse correlation between temperature and electric potential is of paramount importance in the quest to optimize the performance of TEGs [27]. This highlights how crucial temperature control is to optimizing TEG performance because lower temperatures increase electric potential outputs and improve energy conversion efficiency. These graphs provide thorough insights into the variables affecting TE energy conversion performance, directing development and operation for maximum efficiency. The significance of temperature regulation cannot be overstated, as the observed inverse relationship implies that lower temperatures yield higher electric potential outputs. The susceptibility of TEGs to temperature fluctuations underscores the critical need to fine-tune operational parameters to bolster overall efficiency in TE energy conversion endeavors. Leveraging this intrinsic characteristic holds immense promise for enhancing practical applications and elevating TEG performance standards. This evaluation is conducted under uniform conditions, maintaining consistent input electric potential and load resistance throughout the analysis.
The optimization of Bi2Te2.70Se0.30 TEM performance and its overall efficacy in TE energy conversion applications is contingent upon a multitude of interrelated elements. Scholars often conduct both modeling studies and experiments to determine the exact effect of normalized current density on the electric potential displayed by Bi2Te2.70Se0.30 TEMs in various operating conditions. These investigations shed light on the complex dynamics regulating the operation of Bi2Te2.70Se0.30 TEMs and offer insightful information for maximizing their usefulness in TE energy conversion applications. Improving doping procedures significantly enhances Bi2Te2.70Se0.30 TEM performance by enhancing electrical conductivity and Seebeck coefficients. This optimization increases TE performance, though it may incur higher material costs and complex fabrication. Additionally, optimizing inter-layer boundaries enhances device performance but may require careful material selection and additional processing steps, impacting manufacturing scalability. Achieving a balance between these trade-offs is crucial for maximizing the utility of Bi2Te2.70Se0.30 TEMs in energy conversion applications.
Figure 4 shows the variation of normalized current density with electric potential for Bi2Te2.70Se0.30 TEM. This is evaluated with the same input electric potential and load resistance. With respect to electric potential, the normalized current density ranges from 0.04 to 5.88 × 10⁴ A/m2. The optimal electric potential has been found to be 3.5628 V in order to improve performance. Finding the optimum electric potential at 3.5628 V is important for enhancing the TEG’s operation, as this range of electric potential enables us to observe how variations in current density impact the device. This illustration offers crucial insights into the structure and operation of the TEG by showing the electric potential and current density connections. Optimizing the electric potential at 3.5628 V is essential to increasing the TEG conversion efficiency. This value is found to be crucial to improving TEG performance as it makes it possible to observe how changes in current density influence the device. The TEG’s conversion efficiency can be improved by optimizing electric potential within this range, highlighting the significance of understanding and controlling this relationship in order to achieve optimal TEG performance. Since it enables us to examine the effects of differences in current density, determining the ideal electric potential at 3.5628 V is essential to enhancing the TEG’s performance. It is possible to make informative observations about how variations in current density impact the device’s functionality within this range of electric potential. For the purpose of improving TEG performance as a whole, we can better understand the relationship between electric potential and TEG efficiency by optimizing electric potential within this range. It highlights the sensitivity of the Bi2Te2.70Se0.30 TEM to changes in operating conditions by showing significant variations in current density for small variations in electric potential. The above discovery highlights the necessity of accurately adjusting electric potential in order to optimize TEG conversion efficiency and achieve optimal performance. Understanding this relationship is crucial for achieving optimal TEG performance [27]. The performance of Bi2Te2.70Se0.30 TEMs depends on several key parameters. Researchers can improve the performance of a variety of TE energy conversion applications by exploring the complexities of Bi2Te2.70Se0.30 TEMs.
A detailed analysis of the performance of several parameters relevant to Bi2Te2.70Se0.30 TEMs is shown in Figure 5. It provides a thorough analysis of several parameters related to the performance of the Bi2Te2.70Se0.30 TEM. This analysis contains the relationship between temperature fluctuation and arc length, which illustrates how temperature rises and falls along the TEM. The temperature gradient magnitude, which represents the extent of temperature variations across the TEM, is also shown by the analysis. Furthermore, the graph illustrates the overall heat source, showing the heat input into the TEM—a critical component in the knowledge of thermal energy generation and optimization. Moreover, it demonstrates the constant net energy rate on the hot and cold sides, highlighting the need to maintain overall efficiency for optimal TEM performance in TE energy conversion applications. Using thorough examination and testing, scientists hope to enhance the performance of the module, enabling its useful application in numerous TE energy conversion situations.
Load resistance and input electric potential variations profoundly affect Bi2Te2.70Se0.30 TEM behavior. Higher input potentials induce temperature and voltage gradients, elevating the output electric potential. Conversely, lower input potential enhances thermal stability but yields lower electric potential outputs. Similarly, load resistance impacts power generation and current flow; higher resistances may improve efficiency despite increasing internal losses, while lower resistances could lower output voltages but increase current flow. Balancing these factors is essential for optimizing TEM performance, ensuring stability and efficiency in TE energy conversion. Consistency in evaluating these factors across investigations is crucial. Studying the arc length versus temperature is crucial to comprehending the TEG’s functioning. The data indicate that the temperature increases from a steady starting point at 0.50 mm arc length to a maximum of 57.5 °C at 2.5 mm arc length. The temperature then stabilizes at a 3 mm arc length. This variation is critical for optimizing TEG performance since it shows critical spots where temperature peaks and stabilizes. These details provide adjustments to the operating parameters in order to attain the desired TE energy conversion [28]. Examining the temperature gradient magnitude in the same image, differences can be seen between 2.14 × 10⁻⁶ and 4.2 × 10⁴ K/m on the hot and cold sides of the TEG, indicating the size of temperature changes along the TEG. It is critical to comprehend these variances in order to optimize TEG performance and make direct adjustments to operational settings for efficient TE energy conversion. The graph depicting the total heat source ranges in values from 0 to 1.02 × 10⁷ W/m3 on both the hot and cool sides. This parameter reflects the heat input into the TEG, which has an impact on overall performance. Comprehending these variances is crucial for maximizing thermal energy generation through an understanding of heat dispersion and the application of adjustments that improve thermal energy conversion [29]. For the same context, the hot and cold sides of the TEG show a consistent value of 48.5 mW for the total net energy rate. This metric, which expresses net energy output, shows overall efficiency. This homogeneity must be maintained in order to optimize TEG performance in TE energy conversion applications [30].
The Seebeck coefficient, sometimes called TE power, measures how well a substance can generate an electric voltage in response to a temperature change. In Figure 6, the Seebeck coefficient represents the isotropic value of the domain. On the TEG’s hot and cold sides, the values range ±2.41 × 10⁻³ V/K. The generated voltage per unit temperature difference is approximately 2.41 millivolts per kelvin. Gaining insight into this variation is crucial for optimizing the efficiency of the TEG, as it provides insight into the temperature-dependent variations of the Seebeck coefficient.
It demonstrates that constant voltage generation per unit temperature differential is the result of uniform material properties or TEG operating circumstances. The constant Seebeck coefficient throughout each leg of the module serves as an indicator of this.
After analysis, the data are used to suggest adjustments to operational settings for improved TE energy conversion [31]. Figure 7 displays the Seebeck coefficient for p- and n-type TE legs in relation to temperature. The values of the TEG’s n- and p-type TE legs range from −2.41 × 10⁻³ to 2.41 × 10⁻³ V/K; opposition does not alter the worth. Gaining knowledge of this variance is essential to improving the effectiveness of the TEG and explaining how the Seebeck coefficient changes with temperature in different leg configurations. This knowledge can be applied to real-world applications to enhance TE energy conversion by altering operational conditions [32]. Conversely, in p- and n-type setups, where different semiconductor materials exhibit differing Seebeck coefficients, the variation of the Seebeck coefficient for each leg shows how temperature influences the material’s electrical properties. This variation is necessary to comprehend how temperature affects the energy conversion efficiency of thermoelectric modules and enables optimization through temperature-dependent changes in operational parameters.
A temperature-dependent isotropic value of thermal conductivity for the TEM is shown in the first section of Figure 8a. It displays how heat conduction is isotropic across the apparatus, indicating variations in the material’s composition and operating environment. In order to optimize TE energy conversion, operational factors must be varied. The thermal conductivity of Bi2Te2.70Se0.30, which is commonly used in TEGs, can vary with temperature and material purity [33]. It ranges from 0.48 to 400 W/m×K, going from the cool to the heated side. Figure 8b focuses on the impact of temperature on the thermal conductivity of TE legs. The practical applications of this information are essential in directing efforts towards improved TE energy conversion performance.
The second part of the picture illustrates how thermal conductivity is affected by the temperature of the p-type and n-type TE legs between 20 and 57.5 °C. The range of thermal conductivity values is 0.475 to 0.535 W/m×K, given an identical input electric potential and load resistance. The other focus is on the narrow range effect of temperature on specific TE legs’ thermal conductivity. This lower range suggests that the thermal conductivity of the TE legs responds to temperature changes more uniformly at this specific temperature range. This can be the result of the material’s basic characteristics or the specific TEG working circumstances. This finding is consistent with earlier findings [34] from other researchers, who have also noted comparable behavior in the doping of Bi2Te3.
The electrical conductivity of Bi2Te2.70Se0.30 TE materials is a critical attribute that enables them to efficiently transform temperature differences into electric current, which is the fundamental mechanism driving TE power generation. Doping and temperature control are critical to maximizing the electrical conductivity of these materials for practical applications. Figure 9a depicts the isotropic electrical conductivity value for the TEM as a function of temperature. The electrical conductivity ranges from 4.27 to 6 × 10⁷ S/m between the cold and hot sides. Figure 9b depicts how the TE legs’ electrical conductivity (p- and n-type) changes with temperature over the range of 20 to 57.5 °C. The large range of isotropic electrical conductivity found across the TEM indicates changes in material qualities and operating circumstances across the device. This conductivity range covers the behavior of the TE module as a whole, with special attention to the behavior of the TE legs, where electrical conductivity is distributed more narrowly. Because of the inherent qualities of the material, this shorter range predicts a more consistent response to temperature fluctuations within this particular temperature range.
In this region, electrical conductivity values range from 4.30 to 4.80 S/m for the same input electric potential and load resistance. Understanding these differences is required to provide the greatest potential for TEG performance. The first section explains how electric current travels within the device by examining the isotropic electrical conductivity of the TEM. The second portion emphasizes the effect of temperature on TE leg electrical conductivity. When changing the operating parameters to provide improved TE energy conversion, this is a crucial factor to take into account. High electrical conductivity is a desirable characteristic in TE materials as it directly contributes to improved performance, power output, and reliability in TE applications, thereby expanding their potential use in energy harvesting, cooling, and heating technologies [35]. Based on these data, which have practical implications, efforts should be made to improve TE energy conversion performance. These are some of this experiment’s main findings for Bi2Te2.70Se0.30 TEM. The Seebeck coefficient, thermal conductivity, and electrical conductivity all have a major impact on how well TEMs perform. The result demonstrates the TEM’s potential for use in various contexts and offers insightful data for the development of TE technology.
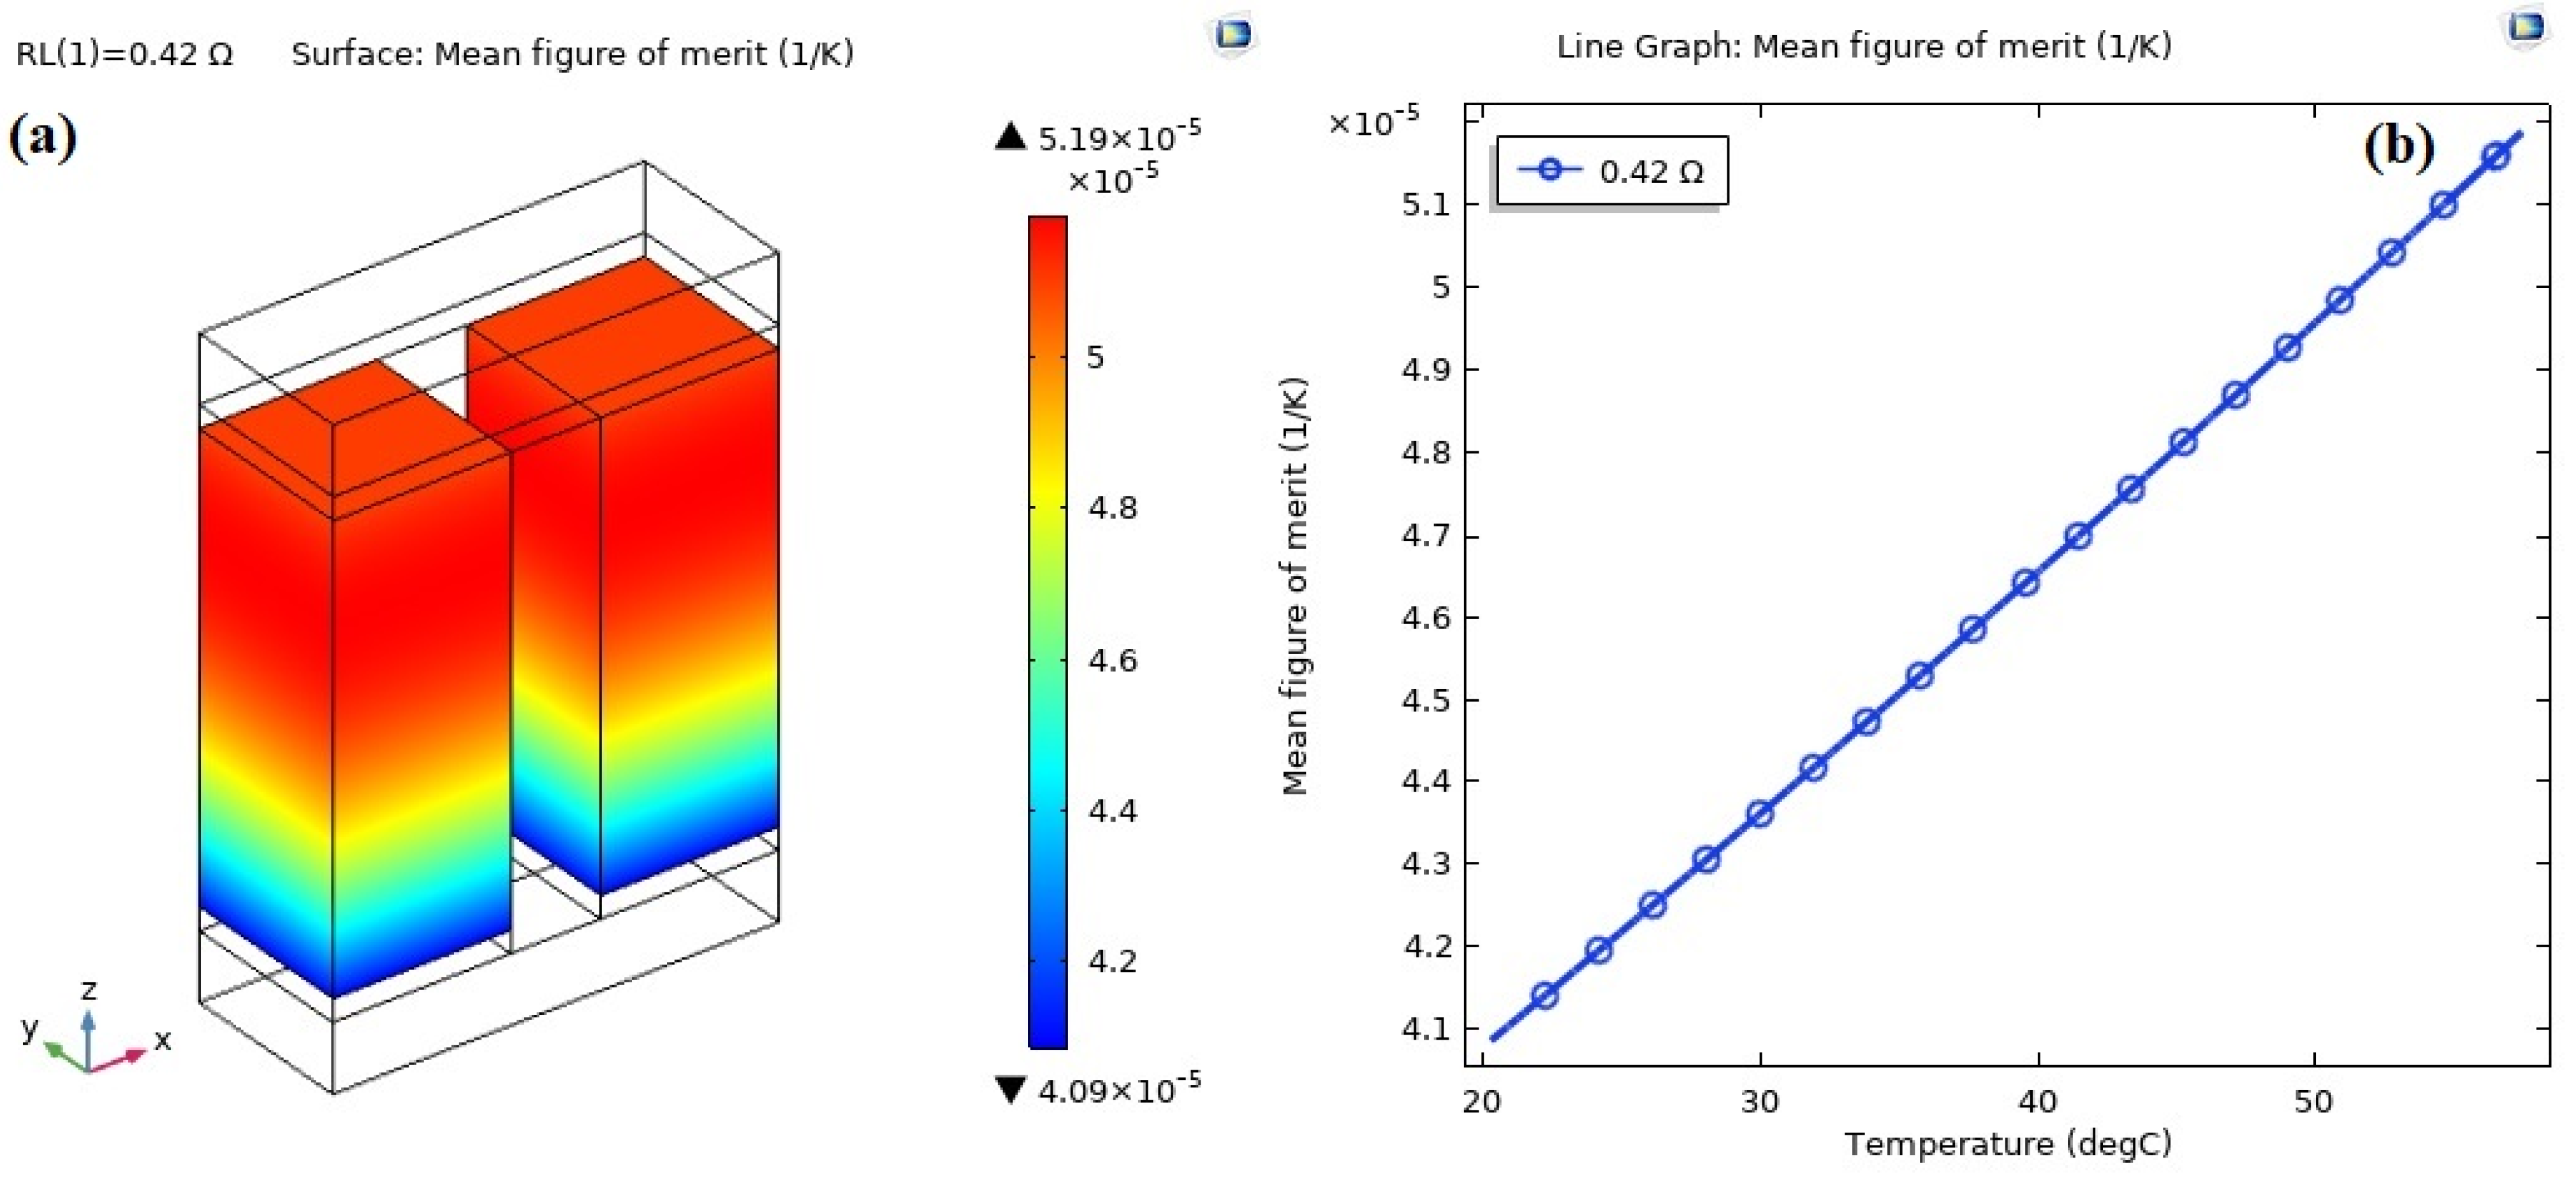
A TEG’s mean figure of merit, expressed in 1/K, includes its electrical conductivity, thermal conductivity, and Seebeck coefficient. The isotropic mean figure of merit throughout the device is depicted in Figure 10a of the TEM. It varies from 4.09 × 10⁻⁵ to 5.19 × 10⁻⁵ 1/K, showing variance from the cold side to the hot side. Figure 10b shows a line graph that illustrates how, while the input electric potential and load resistance are held constant, the mean figure of merit values vary with temperature between 20 and 57.5 °C. Understanding these variations is crucial for optimizing the performance of the TEG. The discussion in the first section emphasizes the significance of the mean figure of merit across the TEM, reflecting the efficiency with which the device converts thermal energy into electrical energy. The visual depiction of the mean figure of merit’s temperature-dependent change provides insightful information that helps optimize operational settings for improved TE energy conversion. This knowledge directs efforts towards attaining greater performance in TE energy conversion applications, acting as a useful guide. When optimizing the design and operation of TE systems, researchers and engineers can make well-informed judgments by having a thorough understanding of how the mean figure of merit varies with temperature. Through the utilization of these data, progress can be achieved in the creation of TE energy conversion technologies that are more practical and efficient.
This study’s main finding is that the Bi2Te2.70Se0.30 TEM has a great deal of promise for use in TEG applications. In comparison to the state-of-the-art, it highlights the significant impact of critical parameters on the performance of the TEM. These insights into design and performance considerations are vital for the advancement of TE technology.
4. Conclusions
In conclusion, this study includes exploring the complex nature of Bi2Te2.70Se0.30 TE materials and highlighting their particular TE performance and unique composition. Researchers show the material’s complex microstructure, which is crucial to the creation of TEG, using TEM assessment. The Seebeck coefficient can increase in the presence of nanoscale deposits or particles, which improves TE performance overall. This study highlights the material’s flexibility for use in TEGs, cooling devices, and energy harvesting. Particularly, this study focuses on the dynamics of the electric potential within the TEM, indicating how sensitive it is to changes in temperature and how effectively it can convert energy. The inverse relationship between electric potential and surface temperature illustrates how important managing temperature is when optimizing TEG performance. The optimal electric potential for increasing TEG efficiency is 3.5628 V, according to research on normalized current density. Analyzing factors such as net energy rate, temperature gradient, and arc length provides crucial data for optimizing operations. Through this study, engineers will be able to better understand material characteristics like electrical and thermal conductivity and the Seebeck coefficient, which will help them optimize conditions for improved TE energy conversion. Temperature variations impact the Seebeck coefficient, electrical conductivity, and thermal conductivity, affecting overall TE performance. The Seebeck effect demonstrates that temperature gradients enhance electron transport, leading to an increased electric potential. This comprehensive investigation provides a way for improvements in practical and efficient TE systems, offering enhanced efficiency in a range of applications. The impact of geometric configurations and material compositions on temperature differentials and energy conversion efficiency must be investigated in order to enhance TE technology. It provides a strong basis for the advancement of TE materials and devices in the future, leading researchers and engineers in the direction of developing TE energy conversion technologies that can be more efficient.
Author Contributions
Conceptualization, M.R.A.B.; methodology, M.K.H.; software, M.A.Ü.; formal analysis, M.K.H.; investigation, M.K.H.; resources, H.M.; data curation, M.R.A.B.; writing—original draft preparation, M.K.H.; writing—review and editing, M.R.A.B. and H.M. All authors have read and agreed to the published version of the manuscript.
Funding
This work has not obtained financial support from any source.
Data Availability Statement
The data presented in this study are available on request from the corresponding author.
Acknowledgments
The authors would like to thank the Department of Electrical and Electronic Engineering at Islamic University in Kushtia-7003, Bangladesh.
Conflicts of Interest
There are no competing interests between the authors and the publishing of this work. There are no other journals that have published this paper.
References
- Shastri, S.S.; Pandey, S.K. Theory of Energy Conversion between Heat and Electricity. Thermoelectr. Adv. Thermoelectr. Mater. 2021, 2, 21–53. [Google Scholar] [CrossRef]
- Yan, Q.; Kanatzidis, M.G. High-Performance Thermoelectrics and Challenges for Practical Devices. Nat. Mater. 2022, 21, 503–513. [Google Scholar] [CrossRef] [PubMed]
- Zhou, C.; Lee, Y.K.; Yu, Y.; Byun, S.; Luo, Z.-Z.; Lee, H.; Ge, B.; Lee, Y.-L.; Chen, X.; Lee, J.Y.; et al. Polycrystalline SnSe with a Thermoelectric Figure of Merit Greater than the Single Crystal. Nat. Mater. 2021, 20, 1378–1384. [Google Scholar] [CrossRef]
- Twaha, S.; Zhu, J.; Yan, Y.; Li, B. A Comprehensive Review of Thermoelectric Technology: Materials, Applications, Modelling and Performance Improvement. Renew. Sustain. Energy Rev. 2016, 65, 698–726. [Google Scholar] [CrossRef]
- Li, D.; Li, J.M.; Li, J.C.; Wang, Y.S.; Zhang, J.; Qin, X.Y.; Cao, Y.; Li, Y.S.; Tang, G.D. High Thermoelectric Performance of N-Type Bi2Te2.7Se0.3via Nanostructure Engineering. J. Mater. Chem. A 2018, 6, 9642–9649. [Google Scholar] [CrossRef]
- Mamur, H.; Bhuiyan, M.R.A. Characterization of Bi2Te3 Nanostructure by Using a Cost Effective Chemical Solution Route. Iran. J. Chem. Chem. Eng. 2020, 39, 23–33. [Google Scholar] [CrossRef]
- Bhuiyan, M.; Mamur, H.; Dilmaç, Ö. A Review on Performance Evaluation of Bi2Te3-Based and Some Other Thermoelectric Nanostructured Materials. Curr. Nanosci. 2021, 17, 423–446. [Google Scholar] [CrossRef]
- Mamur, H.; Üstüner, M.A.; Dilmaç, Ö.F.; Bhuiyan, M.R.A. Performance Evaluation of Bi2Te3-XSex (0.10 ≤ X ≤ 1.80) Thermoelectric Nanostructured Materials. Clean. Chem. Eng. 2022, 4, 100063. [Google Scholar] [CrossRef]
- Mamur, H.; Üstüner, M.A.; Korucu, H.; Bhuiyan, M.R.A. A Review of the Performance Evaluation of Thermoelectric Nanostructure Materials Bi2-XSbxTe3 (0.20 ≤ X ≤ 1.80). Clean. Chem. Eng. 2023, 6, 100101. [Google Scholar] [CrossRef]
- Bhuiyan, M.R.A.; Korucu, H.; Mamur, H.; Haque, M.M. Growth and Characterization of Bi2Te2.70Se0.30 Nanostructured Materials by Using a Cost-Effective Chemical Solution Route. J. Alloys Metall. Syst. 2023, 4, 100032. [Google Scholar] [CrossRef]
- Demir, M.E.; Dincer, I. Performance Assessment of a Thermoelectric Generator Applied to Exhaust Waste Heat Recovery. Appl. Therm. Eng. 2017, 120, 694–707. [Google Scholar] [CrossRef]
- Aridi, R.; Faraj, J.; Ali, S.; Lemenand, T.; Khaled, M. Thermoelectric Power Generators: State-of-the-Art, Heat Recovery Method, and Challenges. Electricity 2021, 2, 359–386. [Google Scholar] [CrossRef]
- Li, W.; Paul, M.C.; Montecucco, A.; Siviter, J.; Knox, A.R.; Sweet, T.; Gao, M.; Baig, H.; Mallick, T.K.; Han, G.; et al. Multiphysics Simulations of Thermoelectric Generator Modules with Cold and Hot Blocks and Effects of Some Factors. Case Stud. Therm. Eng. 2017, 10, 63–72. [Google Scholar] [CrossRef]
- Sahin, A.Z.; Yilbas, B.S. The Thermoelement as Thermoelectric Power Generator: Effect of Leg Geometry on the Efficiency and Power Generation. Energy Convers. Manag. 2013, 65, 26–32. [Google Scholar] [CrossRef]
- Şişik, B.; LeBlanc, S. The Influence of Leg Shape on Thermoelectric Performance under Constant Temperature and Heat Flux Boundary Conditions. Front. Mater. 2020, 7, 595955. [Google Scholar] [CrossRef]
- Xu, H.; Zhang, Q.; Yi, L.; Huang, S.; Yang, H.; Li, Y.; Guo, Z.; Hu, H.; Sun, P.; Tan, X.; et al. High Performance of Bi2Te3-Based Thermoelectric Generator Owing to Pressure in Fabrication Process. Appl. Energy 2022, 326, 119959. [Google Scholar] [CrossRef]
- Jouhara, H.; Żabnieńska-Góra, A.; Khordehgah, N.; Doraghi, Q.; Ahmad, L.; Norman, L.; Axcell, B.; Wrobel, L.; Dai, S. Thermoelectric Generator (TEG) Technologies and Applications. Int. J. Thermofluids 2021, 9, 100063. [Google Scholar] [CrossRef]
- Luo, Y.; Li, L.; Chen, Y.; Kim, C.N. Influence of Geometric Parameter and Contact Resistances on the Thermal-Electric Behavior of a Segmented TEG. Energy 2022, 254, 124487. [Google Scholar] [CrossRef]
- Wilhelmy, S.; Zimare, A.; Lippmann, S.; Rettenmayr, M. A Temperature Gradient Evaluation Method for Determining Temperature Dependent Thermal Conductivities. Meas. Sci. Technol. 2021, 32, 105601. [Google Scholar] [CrossRef]
- Zhang, W.; Liu, X.; Tian, Z.; Zhang, Y.; Li, X.-J.; Song, H. High Thermoelectric Performance of Large Size Bi2Te2.7Se0.3 Alloy Ingots. J. Electron. Mater. 2023, 52, 6682–6689. [Google Scholar] [CrossRef]
- Saberi, Y.; Sajjadi, S.A.; Mansouri, H. Comparison of Thermoelectric Properties of Bi2Te3 and Bi2Se0·3Te2.7 Thin Film Materials Synthesized by Hydrothermal Process and Thermal Evaporation. Ceram. Int. 2021, 47, 11547–11559. [Google Scholar] [CrossRef]
- Saberi, Y.; Sajjadi, S.A. A Comprehensive Review on the Effects of Doping Process on the Thermoelectric Properties of Bi2Te3 Based Alloys. J. Alloys Compd. 2022, 904, 163918. [Google Scholar] [CrossRef]
- Chen, X.; Yang, Z.; Yu, W.; Wang, R. Modeling and Experimental Study of a BiSbTeSe-Based Thermoelectric Module for Thermal Energy Recovery. J. Electron. Mater. 2020, 49, 3039–3051. [Google Scholar] [CrossRef]
- Teffah, K.; Zhang, Y.; Mou, X. Modeling and Experimentation of New Thermoelectric Cooler–Thermoelectric Generator Module. Energies 2018, 11, 576. [Google Scholar] [CrossRef]
- Högblom, O.; Andersson, R. Analysis of Thermoelectric Generator Performance by Use of Simulations and Experiments. J. Electron. Mater. 2014, 43, 2247–2254. [Google Scholar] [CrossRef]
- Hasan, M.K.; Haque, M.M.; Üstüner, M.A.; Mamur, H.; Bhuiyan, M.R.A. Optimizing the performance of Bi2Te3 TECs through numerical simulations using COMSOL multiphysics. J. Alloys Metall. Syst. 2024, 5, 100056. [Google Scholar] [CrossRef]
- Maduabuchi, C.; Lamba, R.; Ozoegwu, C.; Njoku, H.O.; Eke, M.; Gurevich, Y.G.; Ejiogu, E.C. Thomson Effect and Nonlinear Performance of Thermoelectric Generator. Heat Mass Transf. 2022, 58, 967–980, Erratum in Heat Mass. Transf. 2022, 58, 1027. [Google Scholar] [CrossRef]
- Williams, N.P.; Power, J.; Trimble, D.; O’Shaughnessy, S.M. An Experimental Evaluation of Thermoelectric Generator Performance under Cyclic Heating Regimes. Heat Mass Transf. 2022. [Google Scholar] [CrossRef]
- Crane, D.; LaGrandeur, J.; Jovovic, V.; Ranalli, M.; Adldinger, M.; Poliquin, E.; Dean, J.; Kossakovski, D.; Mazar, B.; Maranville, C. TEG On-Vehicle Performance and Model Validation and What It Means for Further TEG Development. J. Electron. Mater. 2013, 42, 1582–1591. [Google Scholar] [CrossRef]
- Sathiyamoorthy, S.; Kumar, R.; Neppolian, B.; Samiappan, D.; Singh, S.P.; Roy, S.; Dwivedi, N.; Veluswamy, P. Comprehensive Study and Realizing an Enhanced Efficiency of the Thermoelectric Generator Along with Its Thermomechanical Properties. J. Electron. Mater. 2021, 50, 1726–1734. [Google Scholar] [CrossRef]
- De Boor, J.; Müller, E. Data Analysis for Seebeck Coefficient Measurements. Rev. Sci. Instrum. 2013, 84, 065102. [Google Scholar] [CrossRef]
- Zhang, L.; Chen, X.; Sun, J.; Cai, H.; Li, H.; Cui, D. Development of Seebeck Coefficient Measurement System with Wide Range of Temperatures for Inorganic Material Measurement. In Proceedings of the 2015 IEEE 10th International Conference on Intelligent Sensors, Sensor Networks and Information Processing, ISSNIP 2015, Singapore, 7–9 April 2015. [Google Scholar] [CrossRef]
- Wudil, Y.S. Ensemble Learning-Based Investigation of Thermal Conductivity of Bi2Te2.7Se0.3-Based Thermoelectric Clean Energy Materials. Results Eng. 2023, 18, 101203. [Google Scholar] [CrossRef]
- Malik, I.; Srivastava, T.; Surthi, K.K.; Gayner, C.; Kar, K.K. Enhanced Thermoelectric Performance of N-Type Bi2Te3 Alloyed with Low Cost and Highly Abundant Sulfur. Mater. Chem. Phys. 2020, 255, 123598. [Google Scholar] [CrossRef]
- Yoshihama, H.; Kaneko, H. Design of Thermoelectric Materials with High Electrical Conductivity, High Seebeck Coefficient, and Low Thermal Conductivity. Anal. Sci. Adv. 2021, 2, 289–294. [Google Scholar] [CrossRef]
Figure 1.
Standard geometry of the Bi2Te2.70Se0.30 TEM (1 mm × 1 mm × 2.5 mm; copper thickness: 0.125 mm, alumina thickness: 0.250 mm).
Figure 1.
Standard geometry of the Bi2Te2.70Se0.30 TEM (1 mm × 1 mm × 2.5 mm; copper thickness: 0.125 mm, alumina thickness: 0.250 mm).

Figure 2.
The potential difference between the hot and cold sides of Bi2Te2.70Se0.30 TEM.
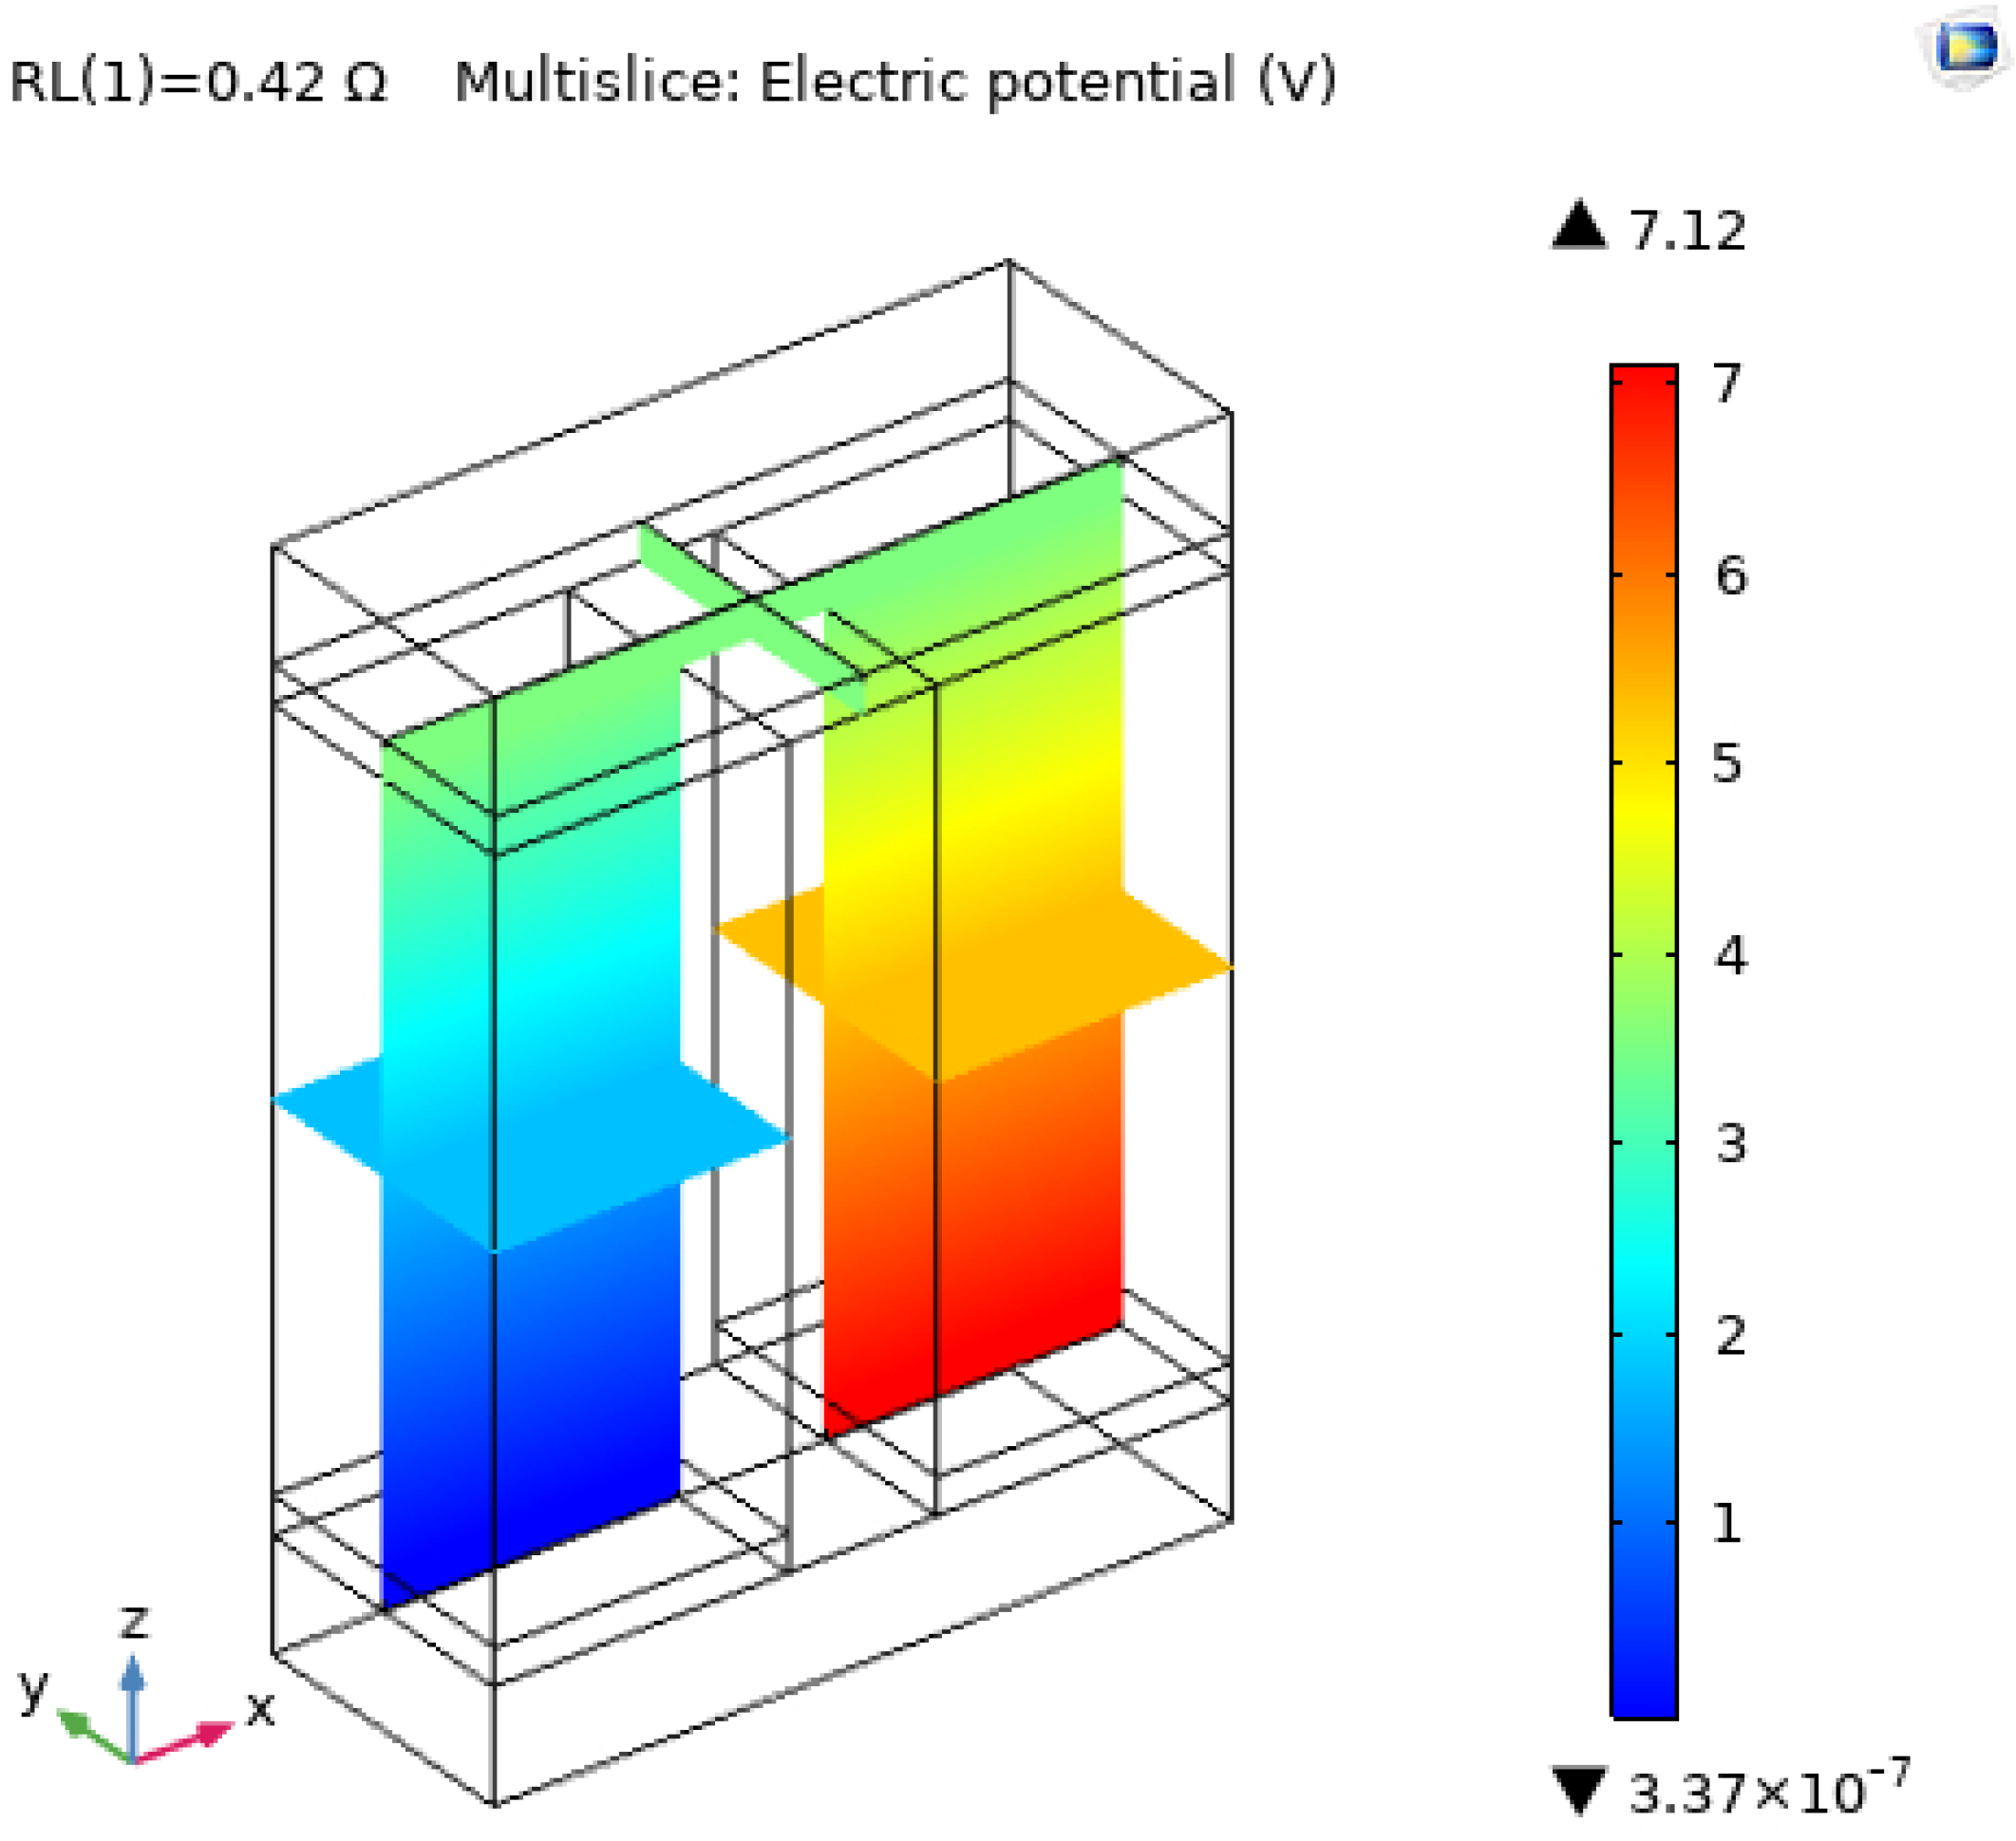
Figure 3.
Variation of surface temperature with electric potential for Bi2Te2.70Se0.30 TEM.

Figure 4.
Variation of normalized current density with electric potential for Bi2Te2.70Se0.30 TEM.
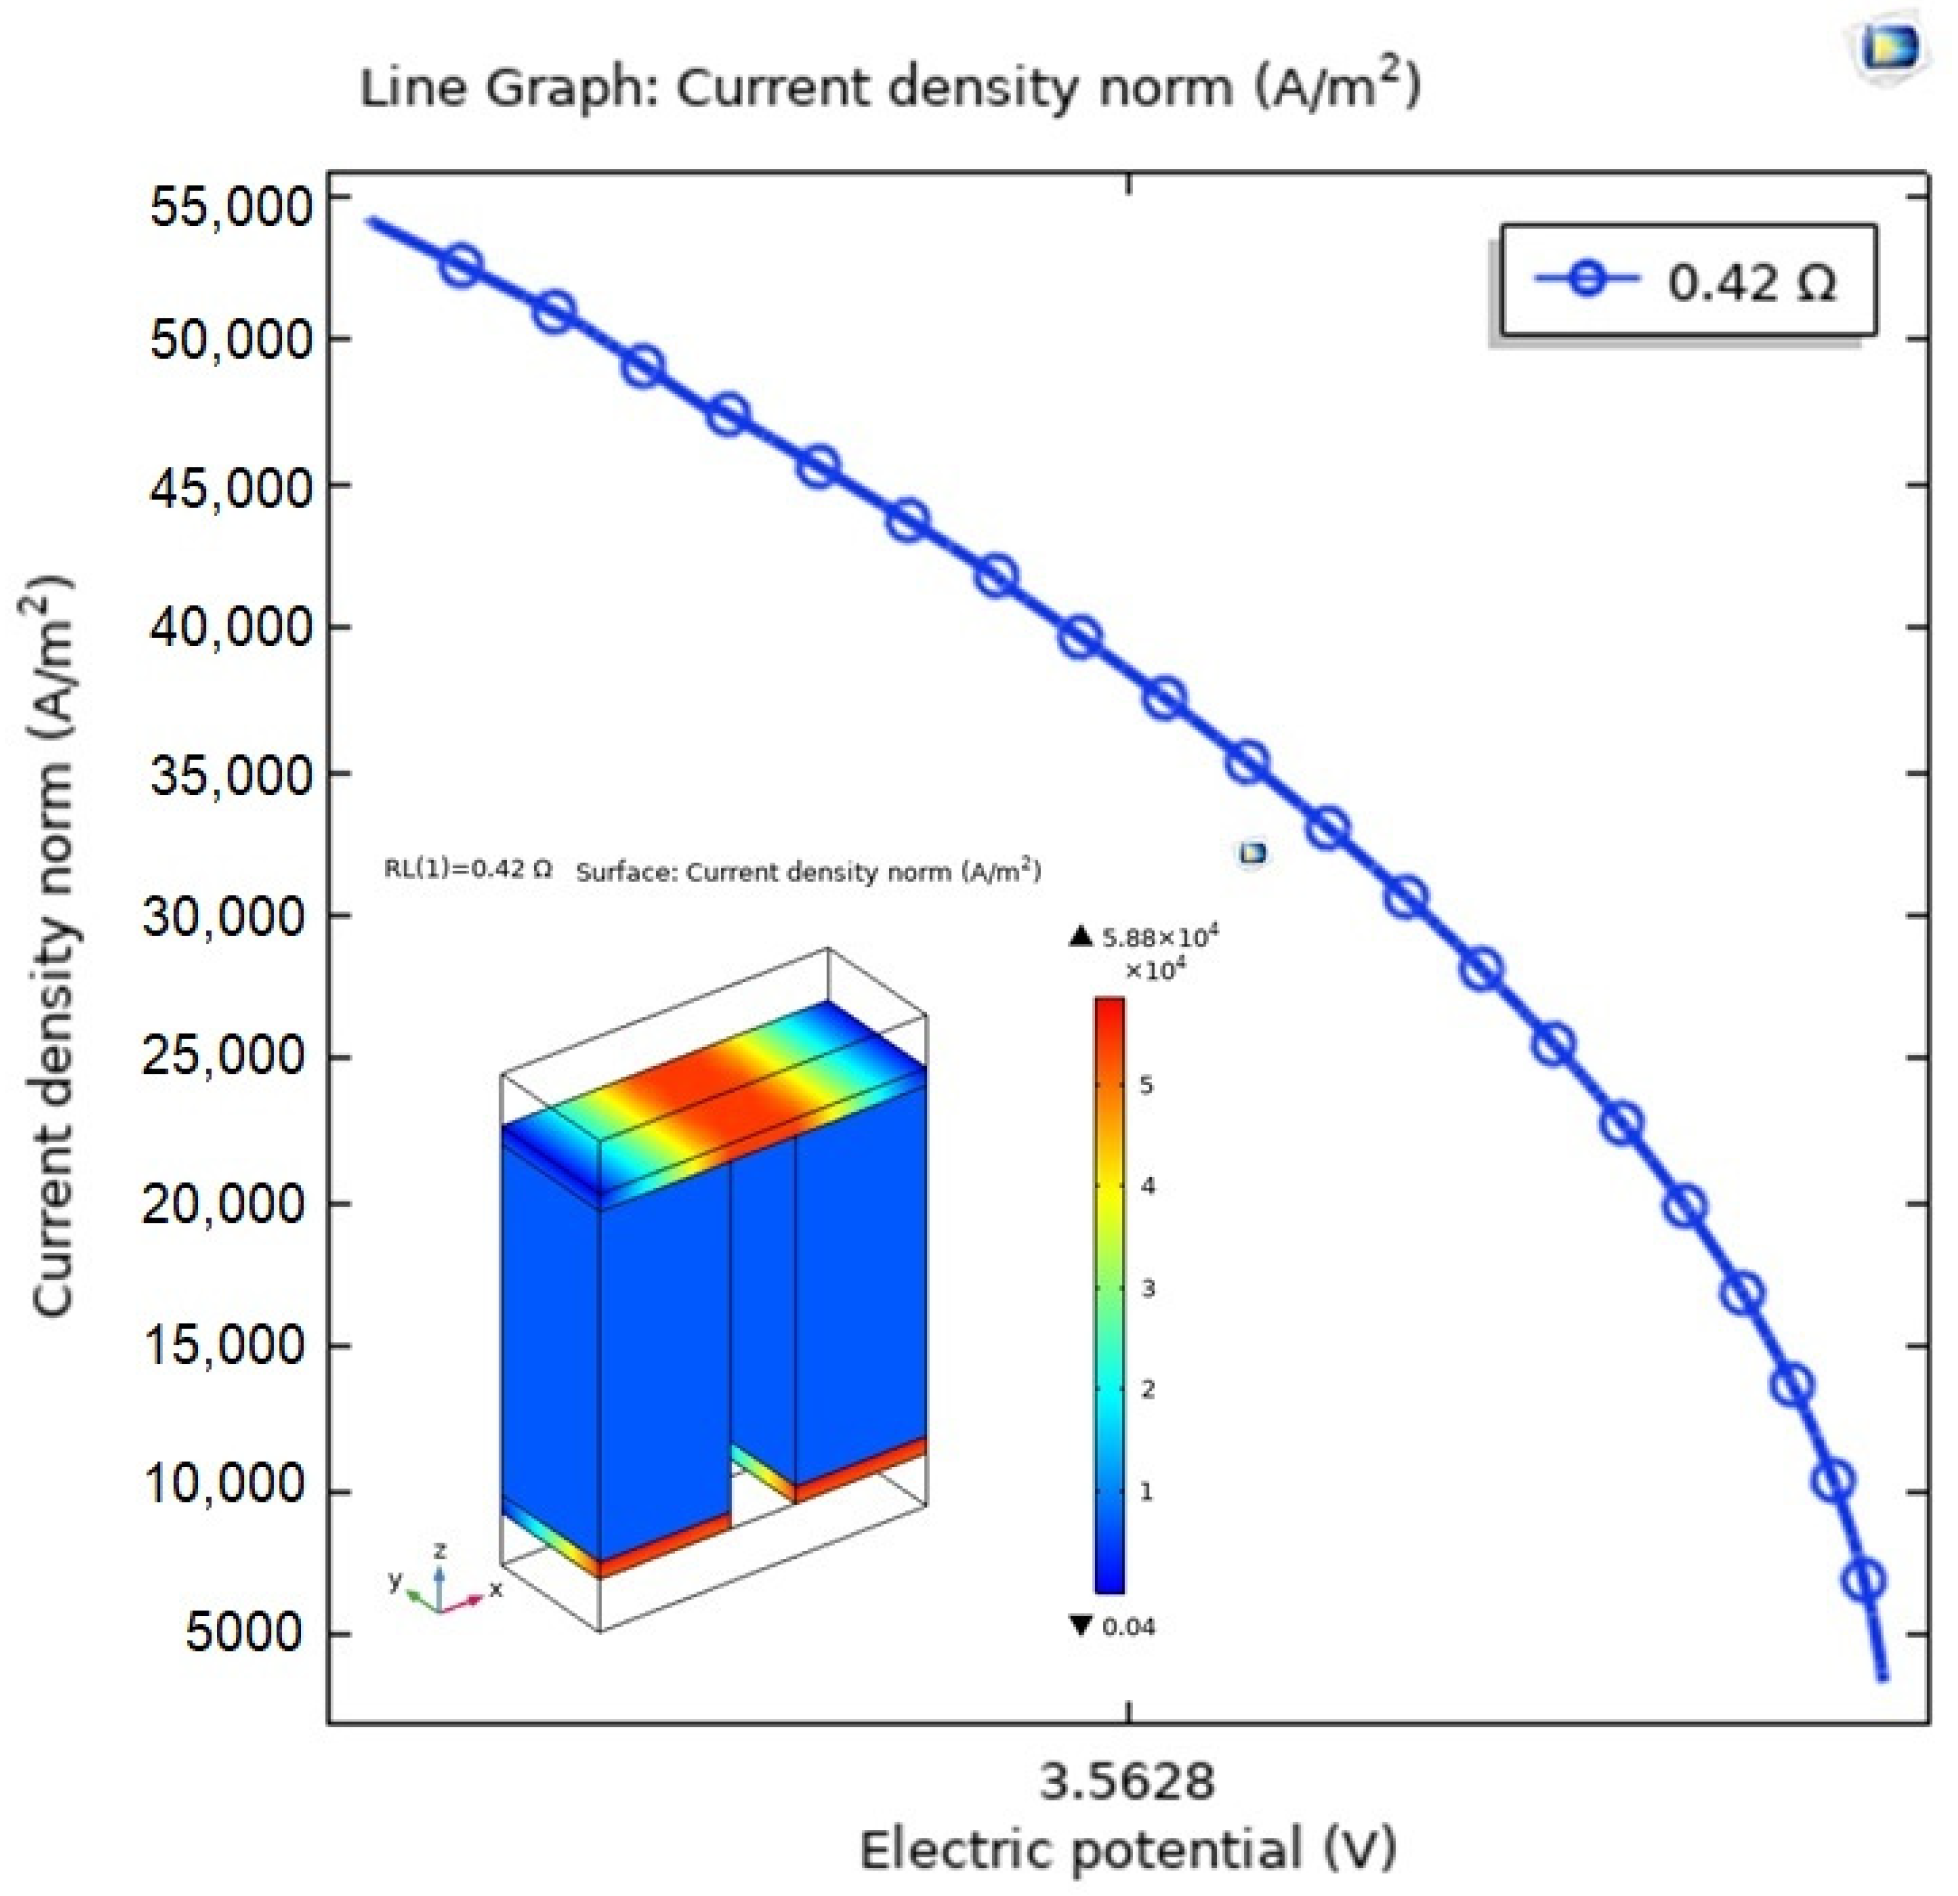
Figure 5.
Assessing the performance of various parameters for Bi2Te2.70Se0.30 TEM.
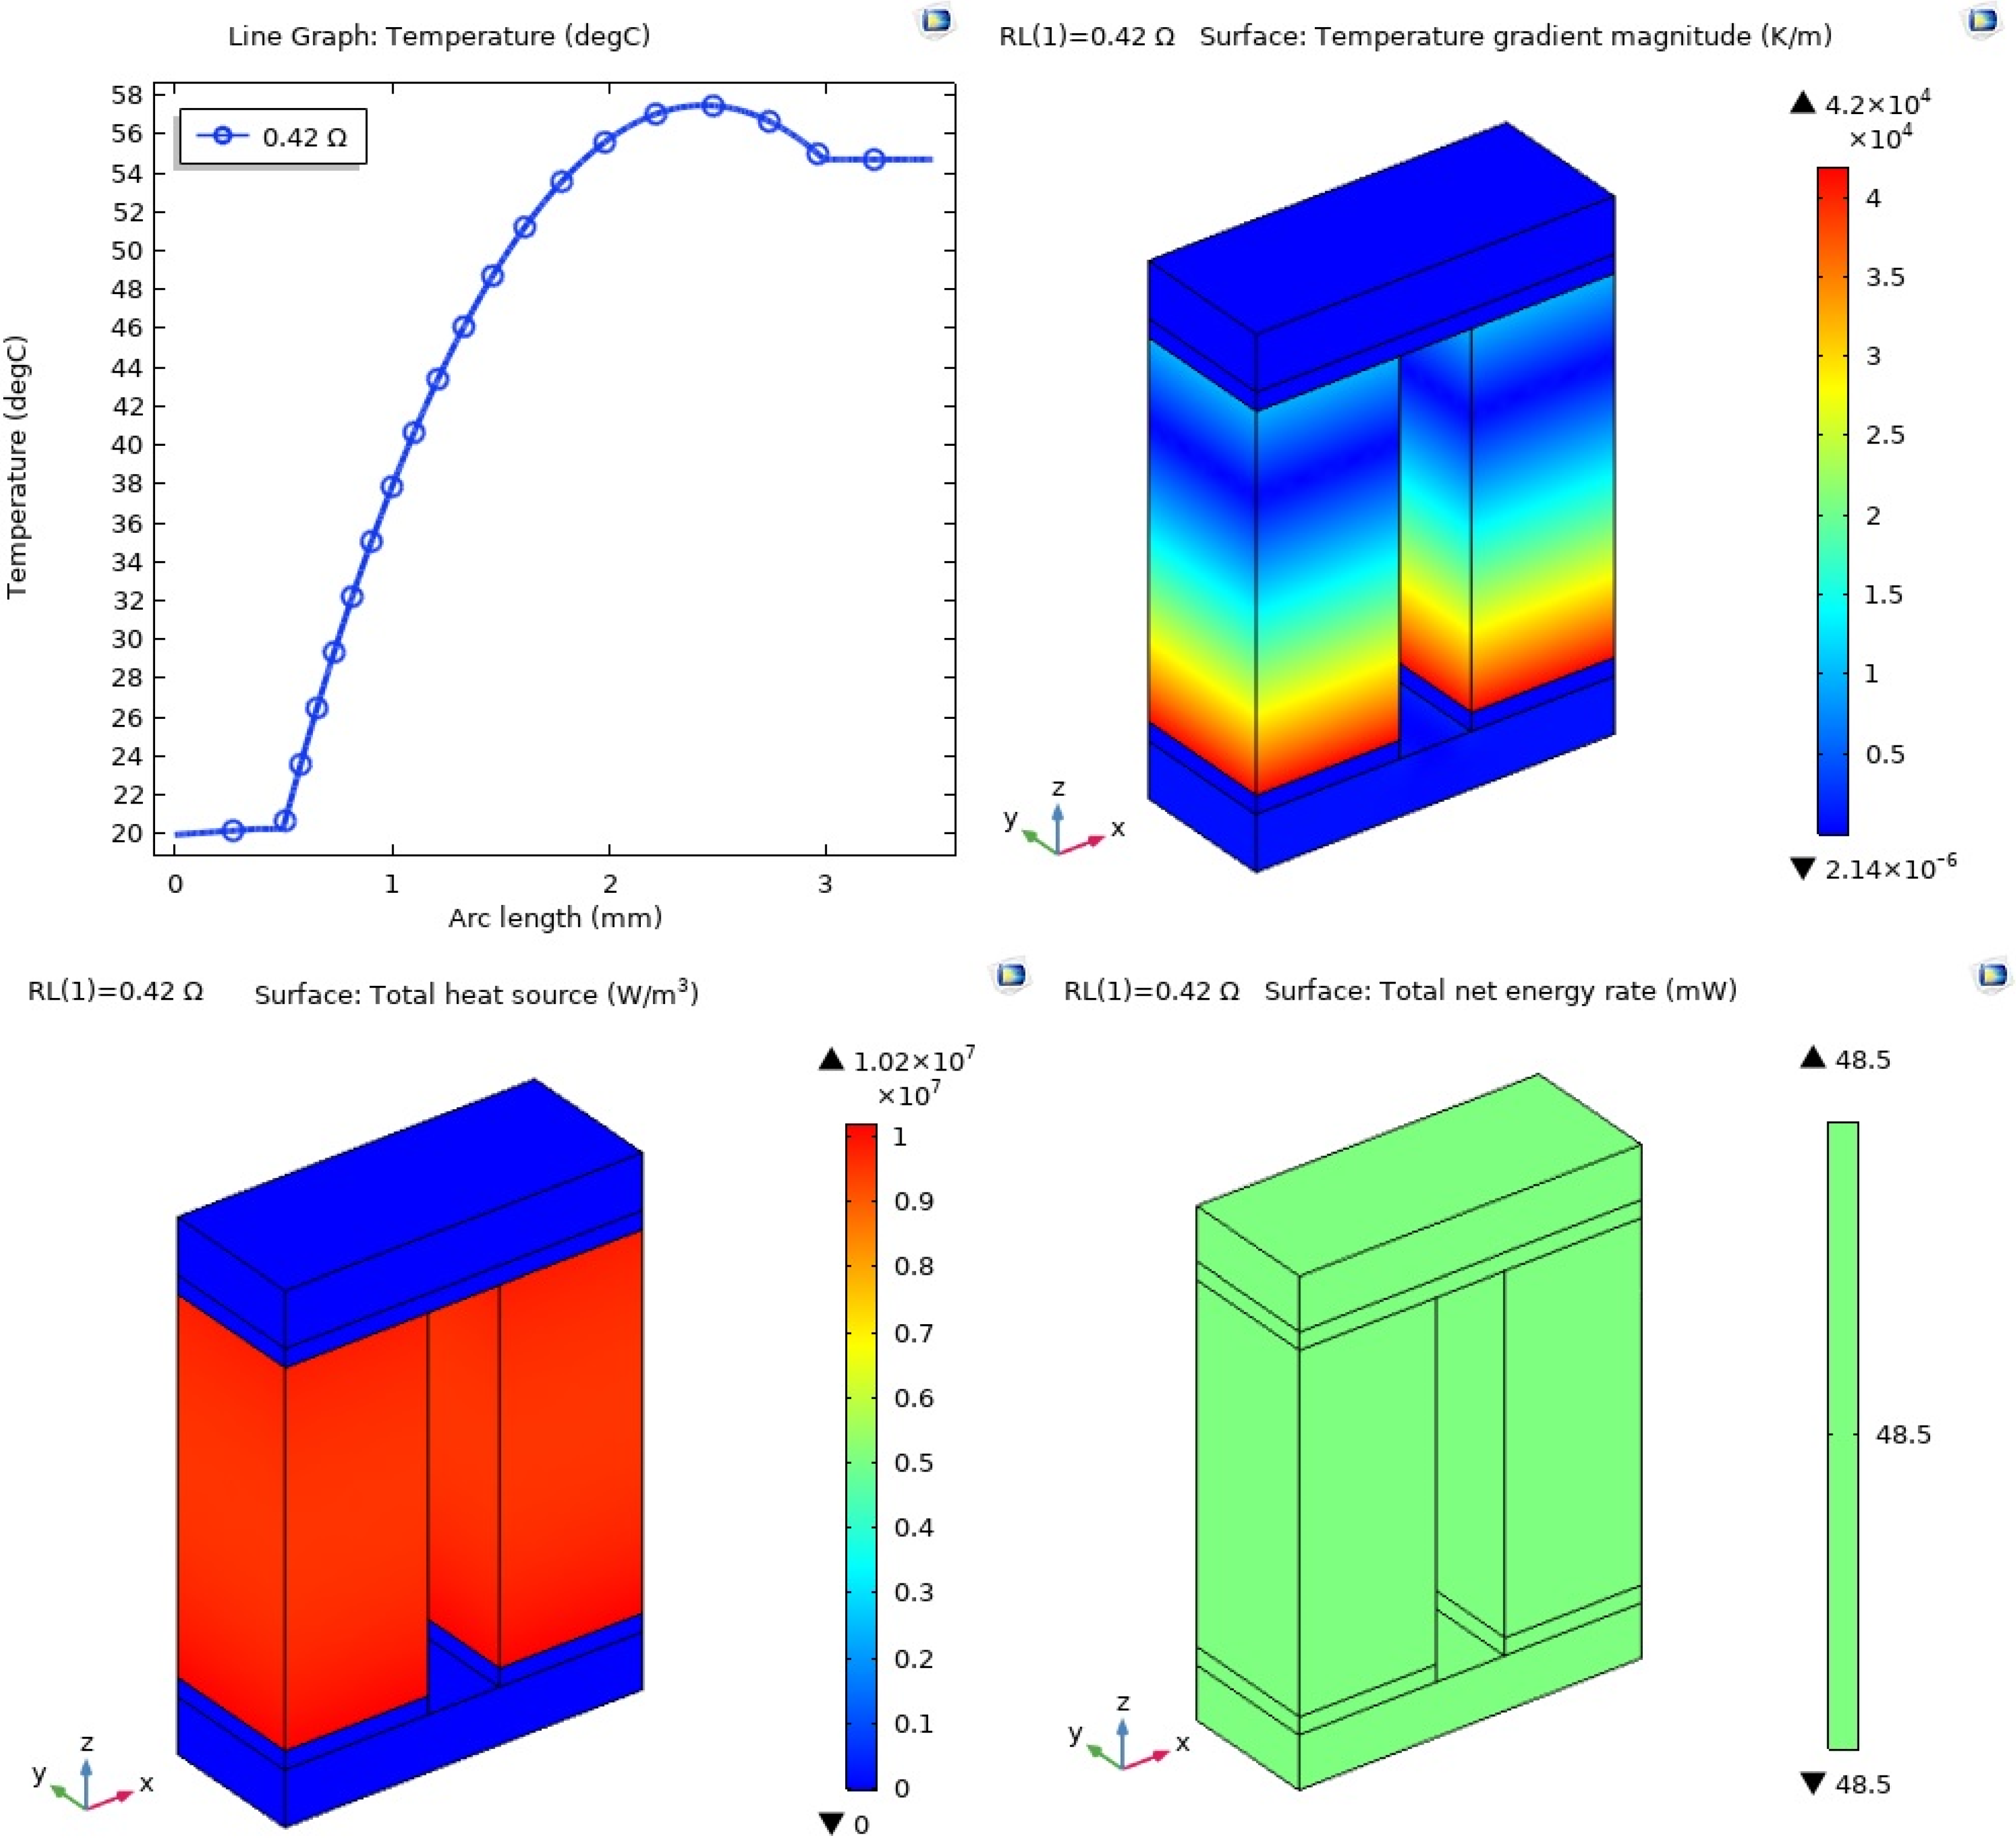
Figure 6.
Seebeck coefficient for the surface of Bi2Te2.70Se0.30 TEM.
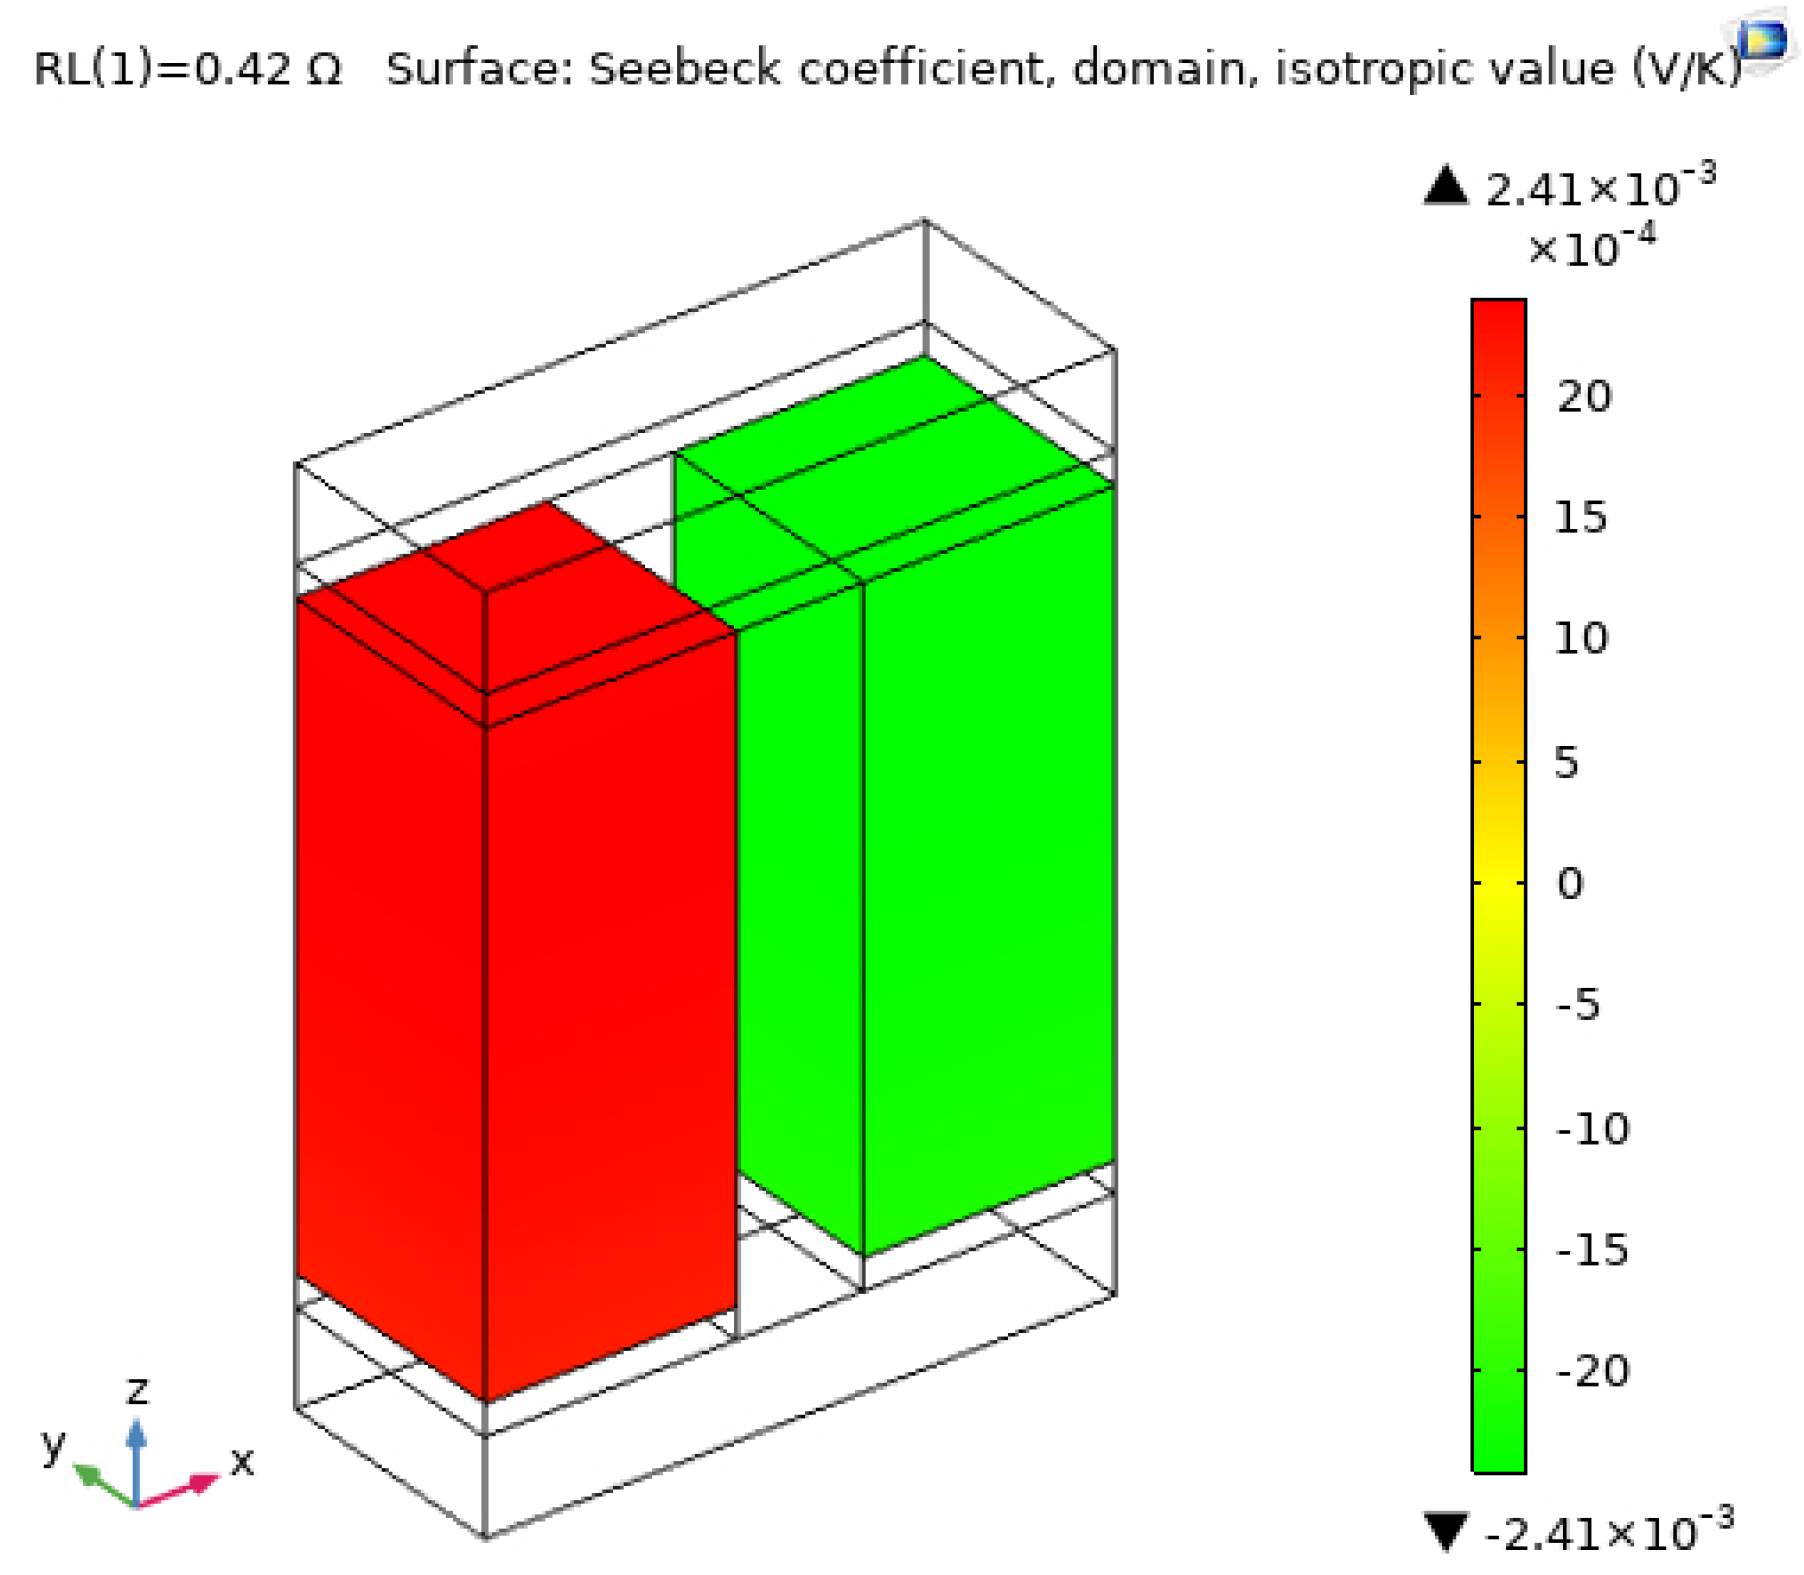
Figure 7.
Seebeck coefficient for the p- and n-type legs of Bi2Te2.70Se0.30 TEM.
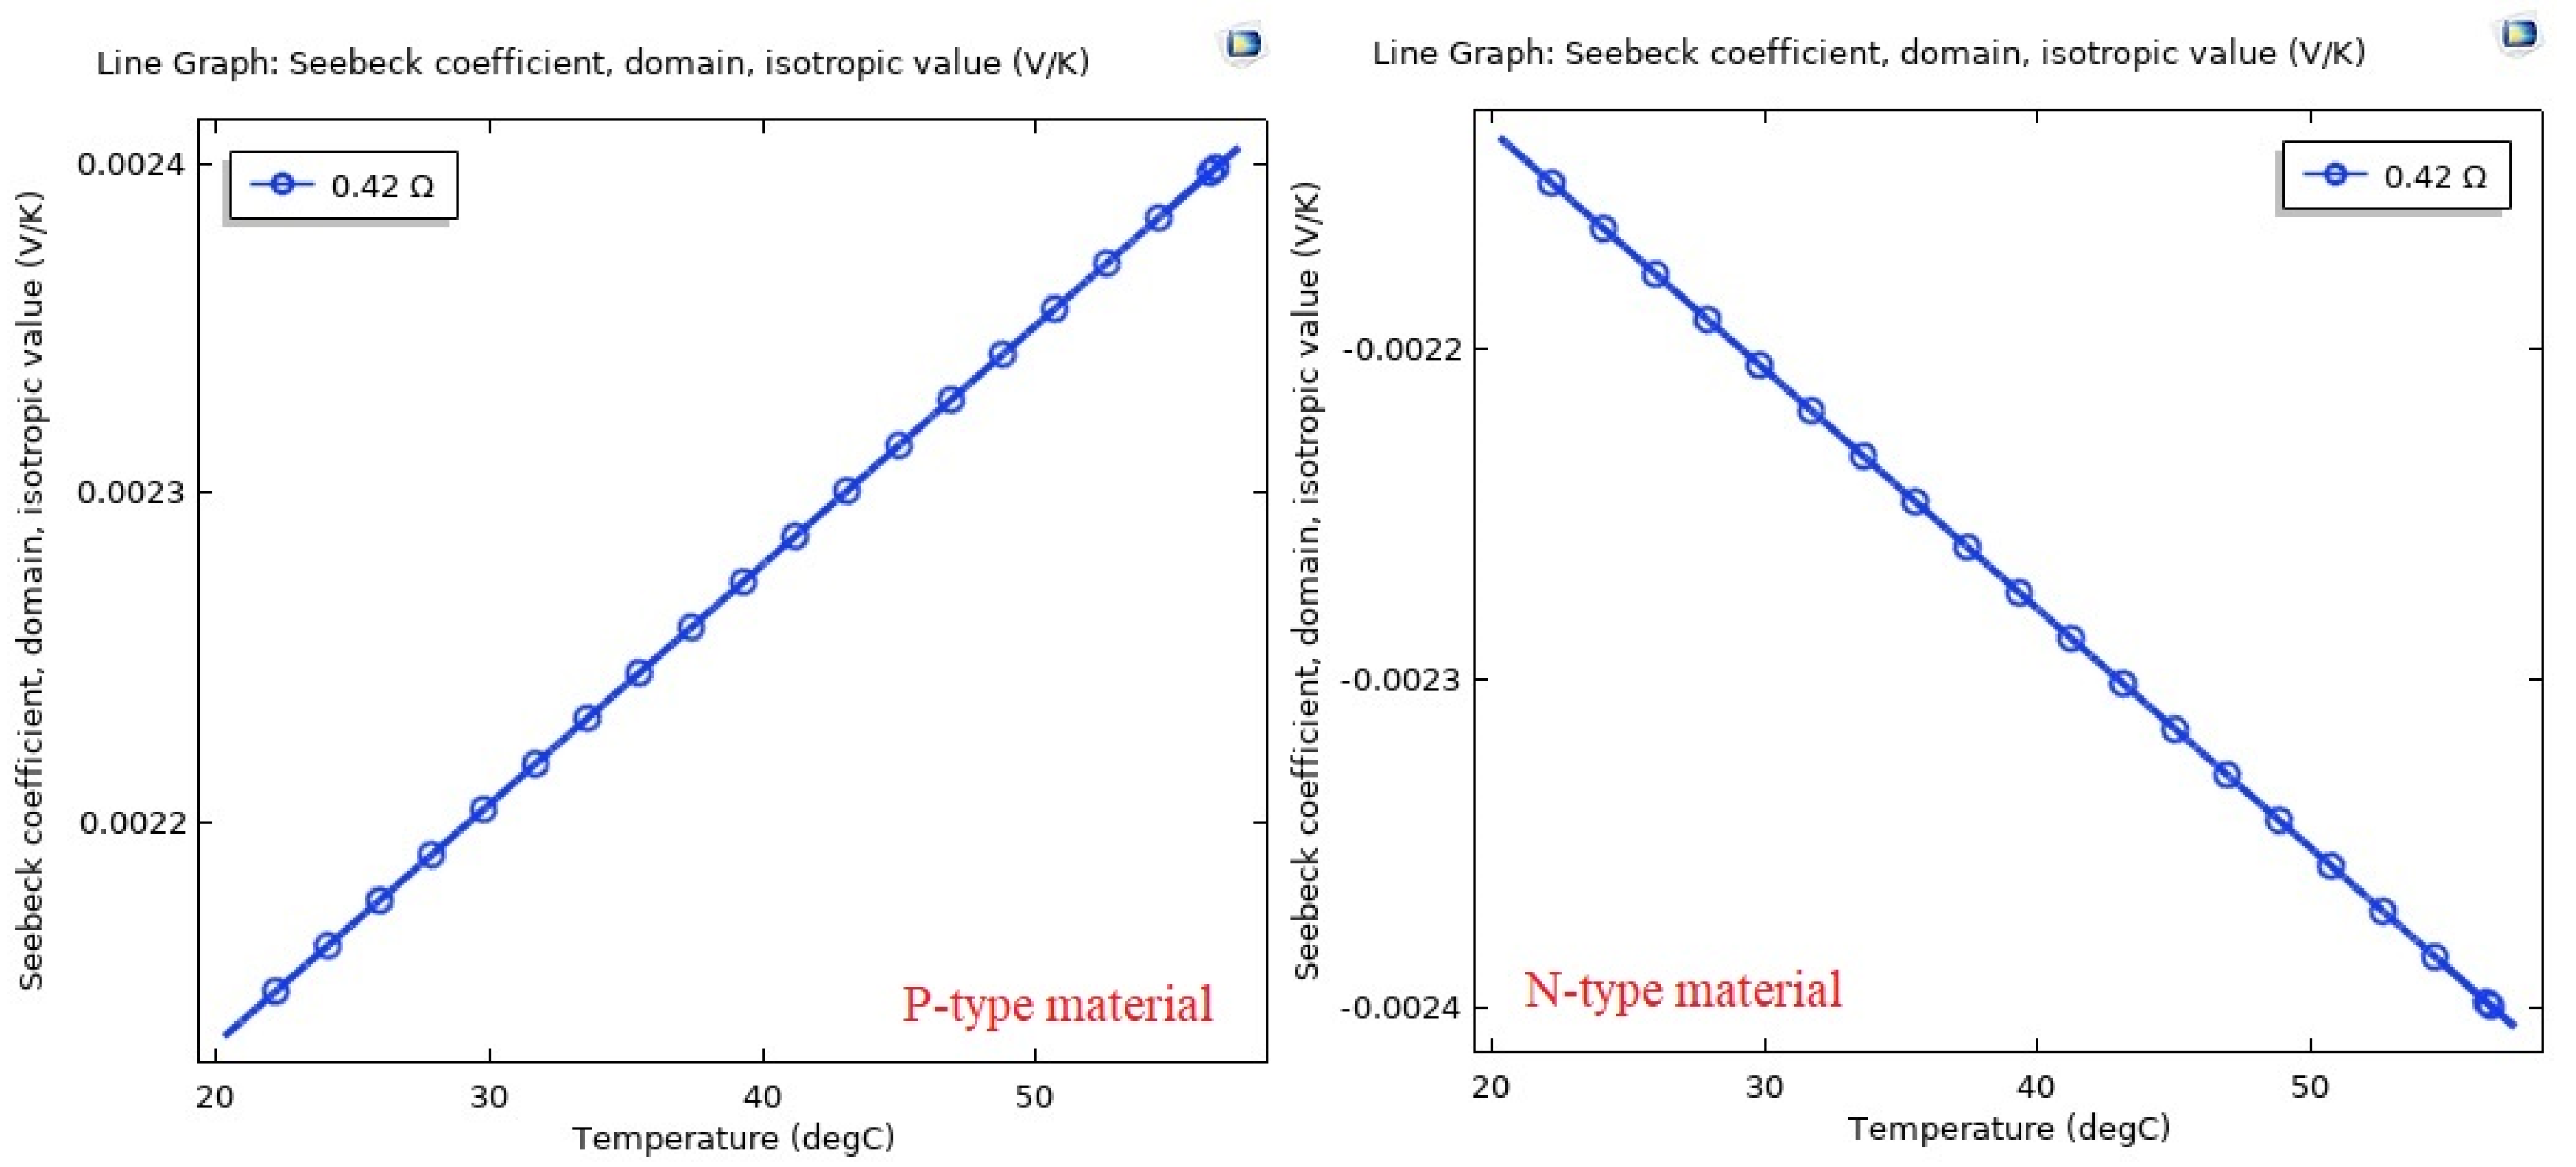
Figure 8.
Thermal conductivity (a) Surface (b) Line graph for Bi2Te2.70Se0.30 TEM.
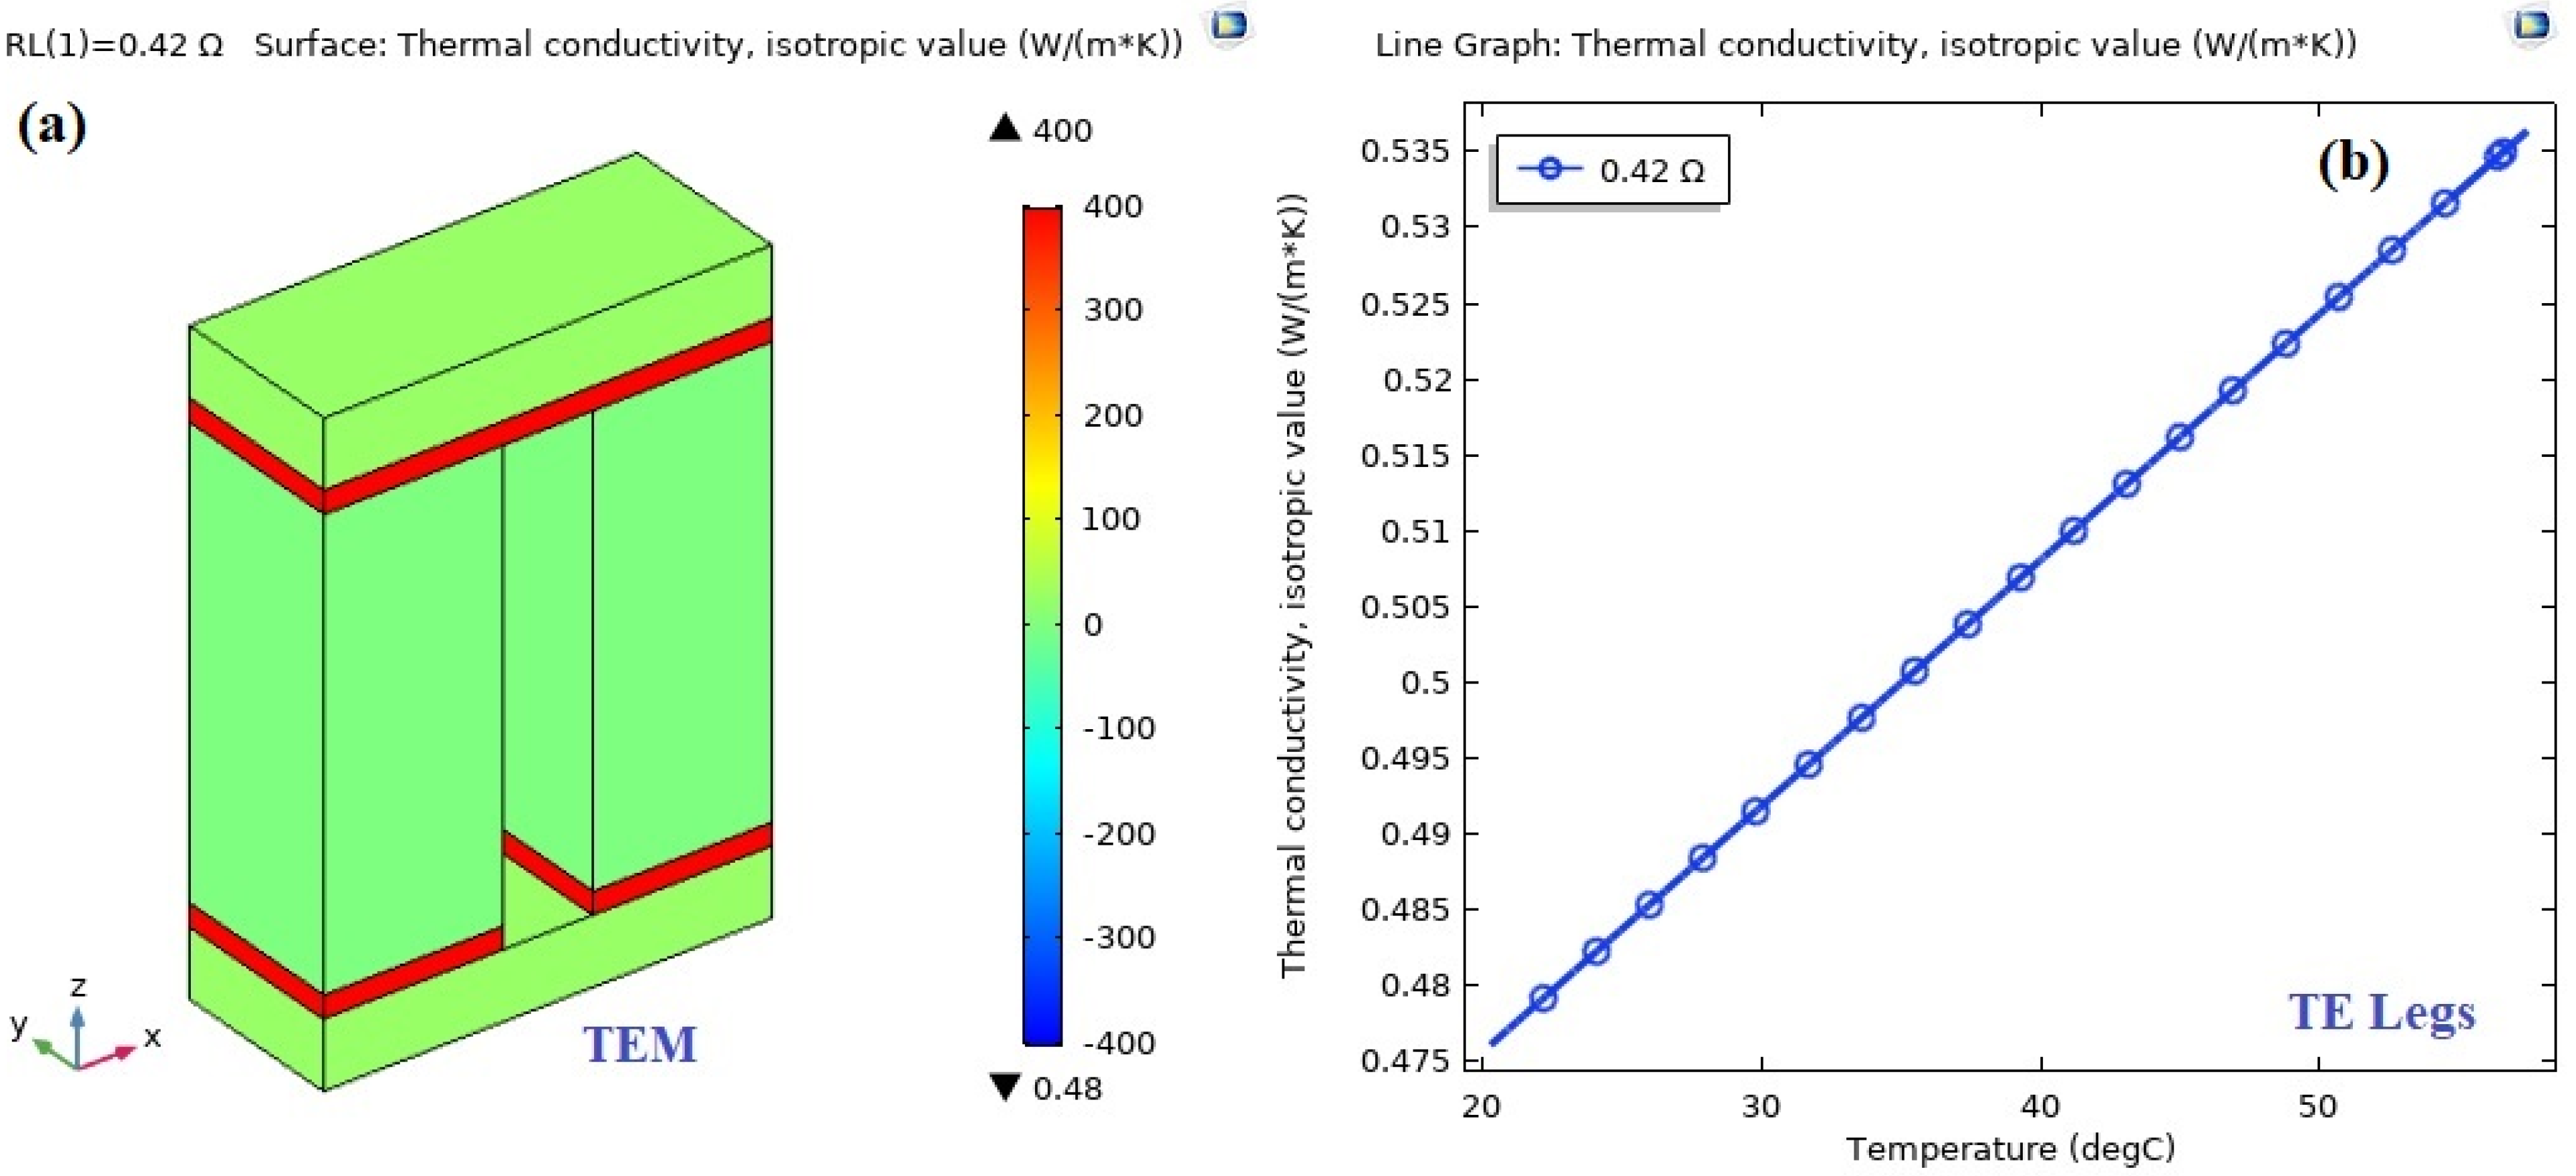
Figure 9.
Electrical conductivity (a) Surface (b) Line graph for Bi2Te2.70Se0.30 TEM.

Figure 10.
Mean figure (a) Surface (b) Line graph of merit for Bi2Te2.70Se0.30 TEM.

Table 1.
Input properties of the materials used in simulations.
| Materials | Seebeck Coefficient S (V/K) | Thermal Conductivity k (W/(m×K)) | Electrical Conductivity σ (S/m) | Density ρ (kg/m3) | Specific Heat Capacity Cp (J/(kg×K)) |
|---|---|---|---|---|---|
| Al2O3 | 3.5 × 10⁻⁶ | 27 | 0.0 | 3900 | 900 |
| Cu | 6.5 × 10⁻⁶ | 400 | 5.998 × 10⁷ | 8960 | 385 |
| P–type Bi2Te2.70Se0.30 | S (T) | k (T) | sigma (T) | 6.02 × 10³ | Cp(T[1/K]) |
| N–type Bi2Te2.70Se0.30 | –S (T) | k (T) | sigma (T) | 6.02 × 10³ | Cp(T[1/K]) |
Disclaimer/Publisher’s Note: The statements, opinions and data contained in all publications are solely those of the individual author(s) and contributor(s) and not of MDPI and/or the editor(s). MDPI and/or the editor(s) disclaim responsibility for any injury to people or property resulting from any ideas, methods, instructions or products referred to in the content. |
© 2024 by the authors. Licensee MDPI, Basel, Switzerland. This article is an open access article distributed under the terms and conditions of the Creative Commons Attribution (CC BY) license (https://creativecommons.org/licenses/by/4.0/).
Share and Cite
MDPI and ACS Style
Hasan, M.K.; Üstüner, M.A.; Mamur, H.; Bhuiyan, M.R.A. Enhancing Bi2Te2.70Se0.30 Thermoelectric Module Performance through COMSOL Simulations. Thermo 2024, 4, 185-201. https://doi.org/10.3390/thermo4020011
AMA Style
Hasan MK, Üstüner MA, Mamur H, Bhuiyan MRA. Enhancing Bi2Te2.70Se0.30 Thermoelectric Module Performance through COMSOL Simulations. Thermo. 2024; 4(2):185-201. https://doi.org/10.3390/thermo4020011
Chicago/Turabian StyleHasan, Md. Kamrul, Mehmet Ali Üstüner, Hayati Mamur, and Mohammad Ruhul Amin Bhuiyan. 2024. "Enhancing Bi2Te2.70Se0.30 Thermoelectric Module Performance through COMSOL Simulations" Thermo 4, no. 2: 185-201. https://doi.org/10.3390/thermo4020011