Article

Liquid Dynamics in the Upper Respiratory–Digestive System with Contracting Pharynx Motions and Varying Epiglottis Angles

1
Department of Biomedical Engineering, University of Massachusetts, Lowell, MA 01854, USA
2
Department of Mechanical Engineering, California Baptist University, Riverside, CA 92504, USA
3
Department of Otolaryngology-Head and Neck Surgery, Cleveland Clinic Lerner College of Medicine, 9501 Euclid Ave., Cleveland, OH 44195, USA
*
Author to whom correspondence should be addressed.
Liquids 2024, 4(2), 415-431; https://doi.org/10.3390/liquids4020022
Submission received: 16 January 2024 / Revised: 6 April 2024 / Accepted: 9 May 2024 / Published: 15 May 2024
(This article belongs to the Section Physics of Liquids)

Abstract

:
Swallowing disorders, or dysphagia, can lead to bolus aspiration in the airway, causing serious adverse health effects. Current clinical interventions for dysphagia are mainly empirical and often based on symptoms rather than etiology, of which a thorough understanding is still lacking. However, it is challenging to study the swallowing process that involves sequential structural motions and is inaccessible to standard visualization instruments. This study proposed an in vitro method to visualize swallowing hydrodynamics and identify the fundamental mechanisms underlying overflow aspirations. An anatomically accurate pharynx–epiglottis model was developed from patient-specific CT images of 623 µm isotropic resolution. A compliant half-pharynx cast was prepared to incorporate dynamic structures and visualize the flow dynamics in the mid-sagittal plane. Three locations of frequent overflow aspiration were identified: the epiglottis base, cuneiform tubular recesses, and the interarytenoid notch. Water had a consistently higher aspiration risk than a 1% w/v methylcellulose (MC) solution. The contracting–relaxing pharynx and flapping epiglottis spread the liquid film, causing a delayed esophageal entry and increased vallecular residual, which was more pronounced with the MC solution. Dispensing the liquid too slowly resulted in water aspiration, whereas this was not observed with the MC solution. An incomplete epiglottis inversion, such as horizontal or down-tilt 45°, aggravated the aspiration risks of water. This study suggests that it is practical to use anatomically accurate respiratory–digestive models to study the swallowing process by incorporating varying physiological details.

1. Introduction

Swallowing is a complex and coordinated process entailing the coordination of over thirty muscles and nerves to transport food safely and efficiently to the stomach [1,2]. Disorders in swallowing, or dysphagia, can lead to malnutrition, dehydration, and weight loss, severely impacting overall health [3]. Dysphagia increases the risk of aspiration, where liquid or food enters the lung, leading to aspiration pneumonia, a severe and potentially life-threatening condition [4,5]. Studies show that individuals suffering from dysphagia have a threefold increased risk of developing pneumonia, which is responsible for 67% of hospital admissions related to this condition and has been a major cause of mortality among nursing home residents [6]. The death rate due to aspiration pneumonia increases significantly with age, from 1% for those 40 years old and younger to 44% for those 85 years old and older [7]. Dysphagia becomes a more pressing issue as the American population over 65 will double within 40 years, reaching 80 million by 2040 [8]. Moreover, the demographic of adults aged 85 and older, who are the most susceptible to dysphagia, is expected to quadruple in 2000–2040.
Oropharyngeal dysphagia, a pathological condition that arises during the oropharyngeal phase, can markedly impact a person’s capacity to speak, swallow, or breathe [9]. Roughly 5% of the global adult population experiences dysphagia [10,11]. It is also noted that swallowing disorders can happen not only during eating/drinking but also at every moment, considering that an average person will swallow 1.0–1.5 L of saliva daily to maintain moisture and lubrication in respiratory–digestive tissues [12,13].
Gaps exist in dysphagia management, although extensive studies have contributed to our understanding of how the nervous system and muscles work together for swallowing, enhancing knowledge in both normal and pathological conditions [14,15,16]. These treatments typically concentrate more on clinical impairments or symptoms than addressing the underlying causes of disordered swallowing [17]. Aspiration may occur due to various causes, such as structural abnormalities, neurological disorders, or weakened muscles involved in swallowing. Clinically, oral cancer, neck–throat cancer, stroke, Alzheimer’s, and Parkinson’s diseases are often reported causes of swallowing disorders [18,19,20,21]. The underlying mechanisms of dysphagia can be intricate and hierarchical, as similar symptoms may emerge from different pathophysiologies, or a single pathophysiology might result in diverse symptoms. Therefore, it is recommended that interventions for dysphagia should be centered around the etiology, rather than primarily focusing on symptoms, which is the norm in current practices [17]. Nevertheless, in the absence of a thorough comprehension of the underlying mechanisms of aspiration, interventions will continue to be based on empirical evidence and speculation.
Several factors contribute to the challenges in devising effective interventions for dysphagia. Swallowing is a highly dynamic process that entails precise coordination of muscle movements [22]. Moreover, when aspiration occurs, the liquid often enters the laryngeal vestibule from the sides and moves inward, exhibiting complex three-dimensional dynamics. Capturing the kinematics of all pertinent structures is difficult with videofluoroscopy, whose 2D nature cannot visualize liquid flows in lateral directions [23]. On the other hand, a CT (4D or 3D) or dynamic MRI does not have a sufficient acquisition rate to fully capture the rapid motions of the involved structures. With current diagnostic tools, the kinematics of swallowing can only be observed in a 2D videofluoroscopy from a lateral view or a 3D endoscopy from a top view, neither of which can adequately depict the complex motions of the epiglottis, pharynx, or larynx. Moreover, understanding the mechanisms of dysphagia pathophysiology requires a multidisciplinary approach involving anatomy, physiology, engineering, and neurological sciences. From an engineering standpoint, dysphagia poses significant challenges due to its complex geometry, intricately coordinated kinematics, two-way coupled fluid–structure interactions, non-Newtonian fluids with varying viscosities, hyper-realistic materials, and multi-body dynamics. Computationally, these elements are still difficult to model and require substantial resources for simulation [24,25,26,27,28,29]. Experimentally, it is not easy to replicate synchronized, multi-component motions using electro-mechanical (robotic) systems [30,31,32,33,34,35,36,37].
This study aims to develop a biomechanical swallowing model and examine the liquid bolus hydrodynamics in the oropharyngeal tract under varying swallowing scenarios. Emphasis will be on identifying anatomical/physiological factors and liquid properties underlying dysphagia or aspiration. Specific aims include: (1) develop an anatomically accurate, compliant pharynx–epiglottis model using silicone rubber; (2) develop a dynamic biomechanical system to control motions of the pharynx and epiglottis; (3) visualize the hydrodynamics of liquid bolus in the oropharyngeal tract under static and dynamic conditions; and (4) identify precursory events leading to swallowing disorders, particularly under varying epiglottis angles. Observations from this study will offer a mid-sagittal view of the liquid dynamics surrounding the entrance of the laryngeal vestibule, thereby providing valuable insights into the mechanisms underlying aspiration, which is challenging to visualize in videofluoroscopic swallowing studies.

2. Materials and Methods

2.1. Study Design

We first studied the hydrodynamics of liquid bolus within the oropharynx with a contracting pharynx and a flapping epiglottis. The highly transient structural motions and fluid flows were recorded and subsequently examined in slow motion to identify shape–function correlations. We then deactivated the pharynx motion and recorded liquid flow dynamics with a flapping epiglottis only. Next, we considered cases with a stationary epiglottis at various angles to isolate the epiglottis angle effect in a controlled manner. It is hypothesized that learning the fluid–structure interactions in an anatomically accurate oropharyngeal geometry, with both dynamic and static structures, could shed valuable light on the fundamental mechanisms causing aspiration or dysphagia. Because we aimed to identify fluid dynamics features prone to aspiration and understand the mechanisms underlying these risk factors, only high-risk swallowing scenarios were presented, and the safe swallowing cases were excluded for concise reasons. The planned tests are listed in Table 1. Liquid bolus dynamics were studied in the oropharyngeal tract with both static and dynamic components. Three fixed epiglottis angles were considered to examine the fluid behavior variations due to the flapping epiglottis, i.e., up-tilt 45°, 0°, and down-tilt 45°.
To assess the impact of liquid consistency on the risk of aspiration, water (thin, Level 0) and a 1% w/v methylcellulose (MC) solution (mildly thick, Level 2) were tested. Note that a 2% w/v MC solution (moderately thick, Level 3) was also tested, but negligible aspiration was observed and thus not presented. To evaluate the swallowing effort, the liquid was dispensed at two different speeds, namely normal and slow, which involved dispensing 5 mL of liquid within 1 s and 3 s, respectively [38,39,40]. Each test was repeated at least three times to ensure consistency.

2.2. Pharynx–Epiglottis Geometry and Cast

In this study, the pharynx–epiglottis models were developed by modifying a respiratory tract model, which was originally constructed from CT images of an 18-year-old male (weighting 72 kg) by Corley et al. in 2015 at the Pacific Northwest National Laboratory (PNNL) [41]. The CT images used were acquired at a 623 µm isotropic resolution, allowing for the capture of detailed respiratory–swallowing anatomical features, such as the uvula, epiglottis, laryngeal vestibule, and glottis [41,42]. As shown in Figure 1a,b, a high level of similarity was observed between an in vivo specimen [43] and the 3D-printed pharynx–epiglottis model, whose dorsal pharynx was removed to reveal the epiglottis. It was evident that the current model faithfully preserved all crucial structures associated with deglutition/swallowing. The CT-reconstructed model closely resembled the cadaver-extracted specimen, especially in the leaf-shaped epiglottis and the laryngeal vestibule below it, which led to the glottal aperture (Figure 1a,b). Three flow channels or reservoirs were noteworthy: (1) the vallecula, a concave housing between the tongue and epiglottis; (2) the two upper pyriform fossae (i.e., the lateral channels between the side pharyngeal wall and the aryepiglottic fold); and (3) the lower pyriform fossae (i.e., pyriform sinuses) that served as the buffer zone for the fluid bolus before entering the esophagus (Figure 1b). The locations of the salivary glands and uvula are illustrated in Figure 1c. In a typical swallowing event, the epiglottis rapidly flips downward, covering the entrance to the laryngeal vestibule, and subsequently returns to its upright position post-swallowing.
The half-pharynx model (right side only) was created using a mold casting technique, as depicted in Figure 1d. Initially, the original mouth–throat model (M0, yellow) was expanded by 3 mm to form model M1. Subsequently, M1 was further expanded by 3 mm to create model M2 (in grey color). Liquid silicone (LET’S RESIN, Hong Kong, China) was poured into the gap between M0 and M2 and left to set for twelve hours, resulting in a flexible cast of M1 (in white color), with the wall thickness being around 6 mm (Figure 1d). This silicone is a room-temperature-vulcanizing (RTV) type of rubber and is composed of polydialkylsiloxane with terminal hydroxyl groups [44]. It exhibited impermeability to both water and the methylcellulose aqueous solution used in this study. Due to the cast molding process, the surface roughness and quality were typical of that found in the 3D geometry segmented from the CT-scanned images. Under careful visual scrutiny, there were no visually observable deviations between the CT-based geometric model and the model cast.
The half-epiglottis in this model could be bent to various angles, as shown in Figure 1f. The half-pharynx geometry was attached to a piece of plexiglass along the cast boundary except the epiglottis, which allowed for free motion of the epiglottis, as well as a clear visualization of the inner anatomical structures and fluorescent fluids. Of note, both ends of the model were open to the atmosphere and thus no significant internal pressure buildup in the pharynx was expected. Instead, the influences from the gravity and dynamic liquid–structure interactions on aspiration risks were evaluated.

2.3. Experimental Setup and Procedures

2.3.1. Control of Dynamic Structures

The contracting motion of the pharynx was effectuated using a gripper (Digi-Key, Thief River Falls, MN, USA), as shown in Figure 1e. The flapping motion of the epiglottis was controlled by a rotational actuator to flap downward and then return it to its original position. Figure 1f shows the kinematics of the epiglottis quantified by tracking the coordinates of three points on the epiglottis in 24 consecutive frames during one flapping cycle. Particular care was taken to prevent leaks through the interfaces between the dynamic structures and the plexiglass. All interfaces, except those interfacing with dynamic structures, were sealed using a Dow Corning 732 clear sealant (Dow Corning, Midland, MI, USA). The glottis had a maximum aperture width of 4.4 mm and was kept static in all tests.

2.3.2. Liquid Selection and Property Measurements

In this study, water and a 1% w/v methyl cellulose (MC) solution were selected as test liquids. This choice was informed by the International Dysphagia Diet Standardization Initiative (IDDSI) tests on MC solutions at different concentrations. The 1% w/v MC solution was classified as mildly thick (Level 2), whereas water was categorized as thin or Level 0. As a result, distinct hydrodynamic behaviors within the pharynx–epiglottis models and different reactions to varying swallowing conditions were anticipated between these two fluids [45].
The viscosity of the liquids was measured using a digital rotational viscometer (NDJ-5S, Cgoldenwall, Laguna Hills, CA, USA) [46]. To quantify the surface tension, a surface tensiometer (American 3B Scientific, Tucker, GA, USA) was employed, with each measurement conducted at least five times for accuracy. The liquid drops were dispensed using a Hamilton 81,242 500 µL threaded plunger syringe (Hamilton, Reno, NV, USA), which was equipped with a Metcal 922050-TE 0.5 in, 22-gauge stainless steel blunt tip needle (Metcal, Cypress, CA, USA). These drops were released onto a flat sample material positioned atop a horizontally leveled platform, ensuring precision in drop volume through the threaded dispenser of the plunger syringe.

2.3.3. Visualization and Recording

To visualize the dynamics of the liquid solutions, a water-soluble fluorescent green dye (GLO Effex, Murrieta, CA, USA) was mixed into them. The hydrodynamics of these dyed liquids were captured in videos, which were recorded in a low-light setting using a UV purple LED light. The wavelength of this light was in the range of 385–395 nm.

3. Results

3.1. Liquid Physical Property Measurement

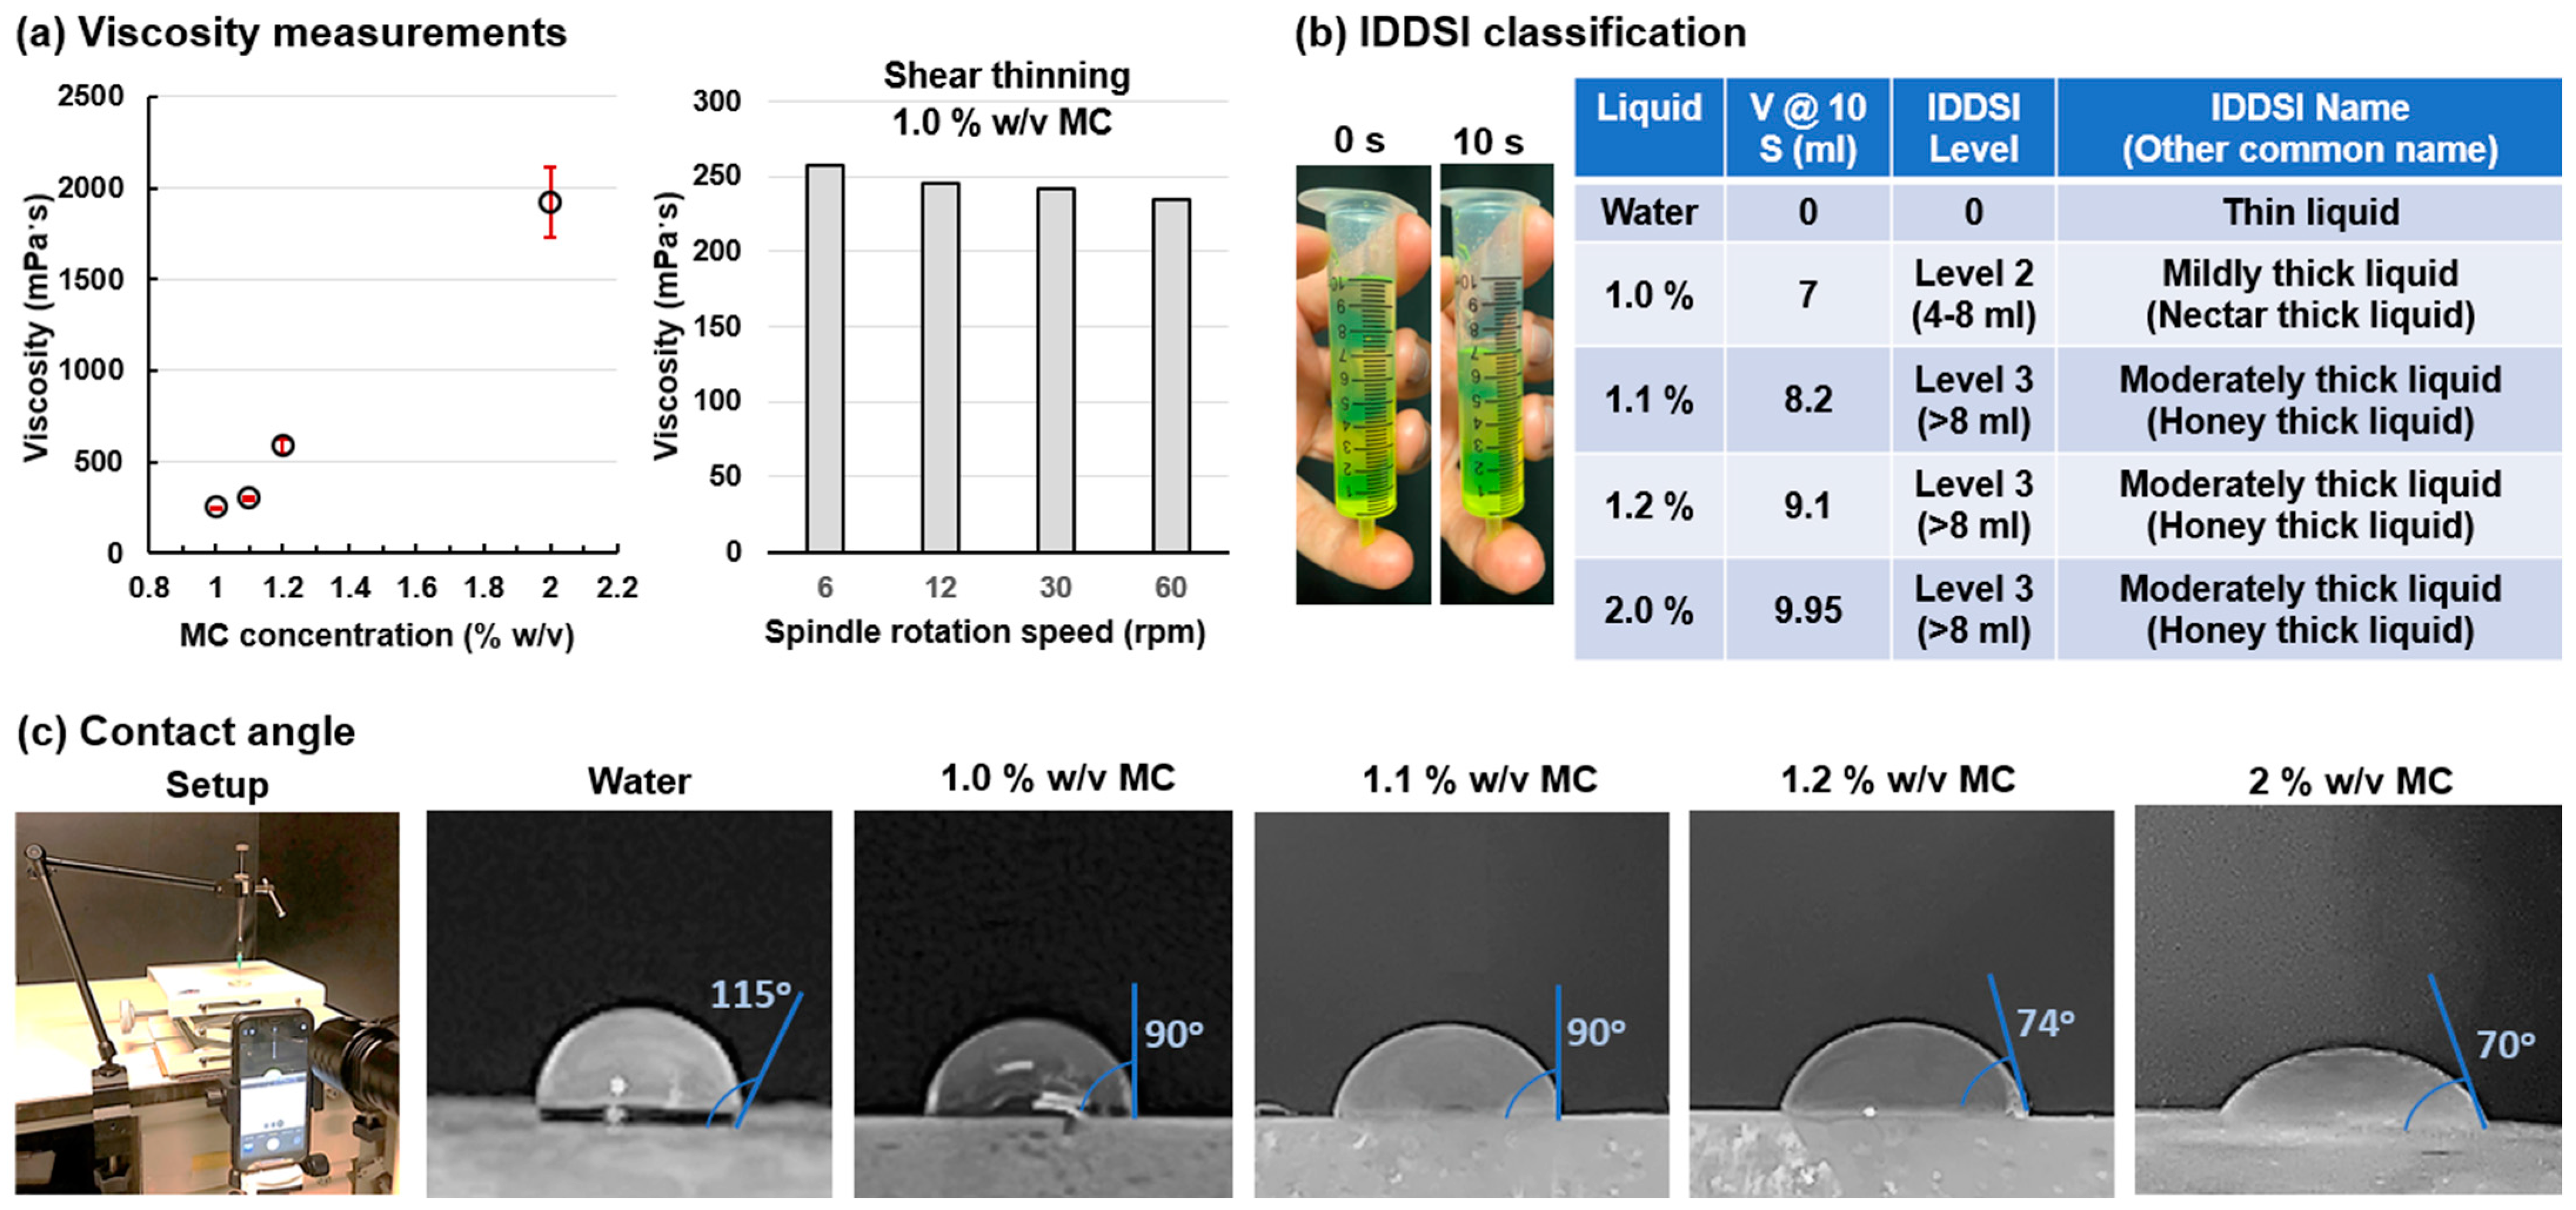
Figure 2a presents the measured viscosities of Methyl Cellulose (MC) solutions across different concentrations, ranging from 1 to 2% weight/volume (w/v). The data indicate a rapid increase in viscosity with the MC concentration. Specifically, the viscosity rose from 245 ± 8 millipascal-seconds (mPa·s) at a 1% concentration to 1922 ± 197 mPa·s when the concentration reached 2%. The liquids were also quantified using the International Dysphagia Diet Standardization Initiative (IDDSI) flow testing method by measuring the remaining volume after 10 s from a 10 mL syringe without the plunger (Figure 2b). Water is a thin liquid with low viscosity (1.0 mPa·s at 20 °C). The 1% MC solution is a mildly thick liquid or nectar-thick liquid, while MC solutions with concentrations of 1.1–2.0% are all moderately thick liquids (or honey-thick liquid). The shear thinning effect for the MC solution with a concentration of 1% w/v (referred to as 1% MC solution hereafter) is shown in the second panel of Figure 1a, which decreases from 257 to 237 mPa·s when the spindle rotation speed increases from 6 to 60 rpm. The contact angles of the liquid on a silicone resin plate are displayed in Figure 2c. As the concentration of the Methyl Cellulose (MC) solution increased, there was a slight reduction in the contact angle.

3.2. Liquid Flow Dynamics with Contracting Pharynx and Flapping Epiglottis

3.2.1. MC Solution of 1% w/v

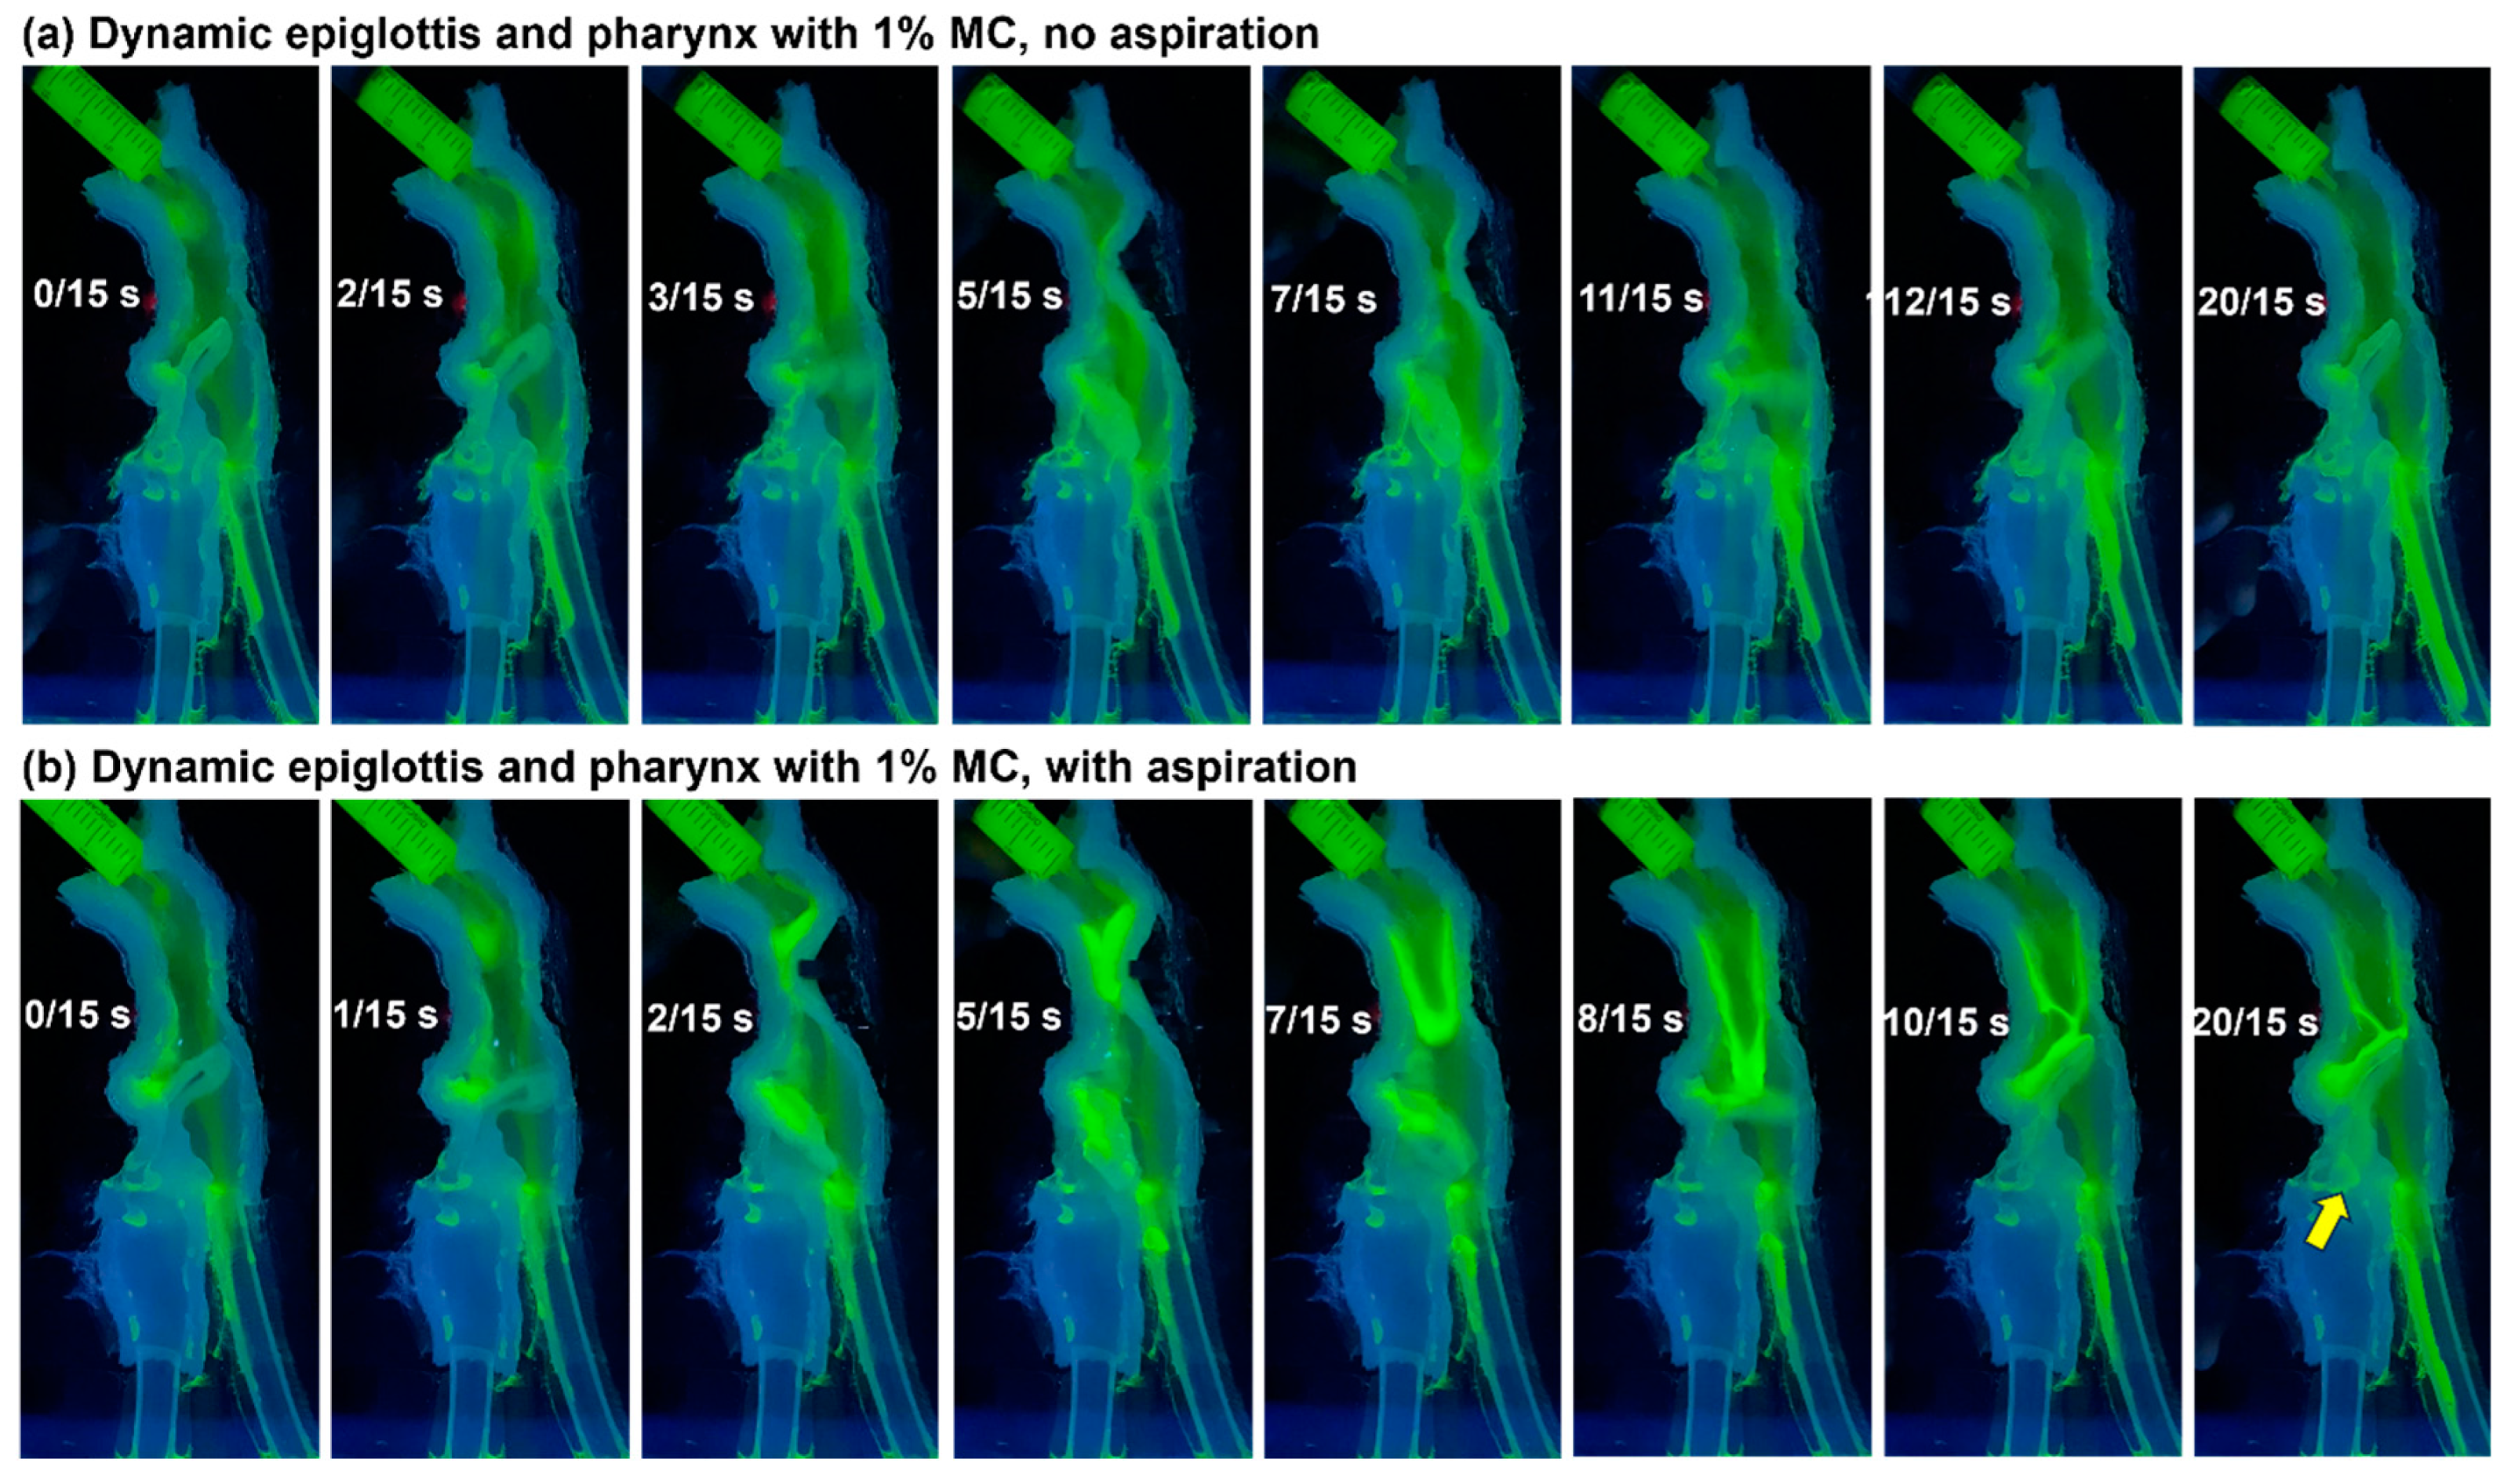
Figure 3a shows the temporal evolution of the liquid bolus dynamics under the influence of a contracting pharynx and flapping epiglottis. A recording of the corresponding bolus dynamics can be viewed in the Supplementary Video S1. The sequence began with dispensing the liquid to the posterior oropharynx (0/15 s); when the liquid bolus reached the middle of the pharynx (2/15 s), the pharynx started to compress the liquid bolus; at the same time, the epiglottis started to flap downward, reaching the horizontal position at 3/15 s. Note that the liquid in the esophagus at 0/15–3/15 s was reminiscent of the previous swallow. The liquid film lining the dorsal wall was deformed by the constricting pharynx (5/15 s), increasing its speed and being pushed toward the middle. This fluid stream then separated from the concave wall and fell onto the down-tilt epiglottis, guiding the liquid into the esophageal opening (5/15–7/15 s). By contrast, the liquid film lining the front wall (or tongue base) flowed along the convex surface of the upper epiglottis, either falling off the epiglottis edge or reaching the epiglottis tip. Between 7/15 and 12/15 s, the epiglottis reversed its motion, moving the liquid remaining on the epiglottis surface toward the vallecula, increasing the risk of off-edge aspiration. It was also noted that the pharynx relaxation led to continuous drainage of the liquid film on the dorsal and lateral walls of the pharynx, even after the epiglottis had fully returned to the resting position (12/15–20/15 s).
Figure 3b shows a scenario with an altered sequence of structural motions; in this example, the pharynx started to contract earlier, i.e., shortly after the onset of liquid dispensing (0/15 s), while the epiglottis flapping was synchronized with the pharynx constriction. As a result, the liquid dispensed between 2/15 s and 5/15 s was blocked by the constriction, leading to liquid accumulation in the oropharynx. At 7/15 s, the pharynx re-opened, and the accumulated liquid gushed out, driven by gravity. At the same time, the epiglottis flapped upward. The liquid and epiglottis met at 8/15 s when the epiglottis moved to a horizontal position. A stream was observed in the pyriform fossa below the epiglottis (8/15 s). As the epiglottis returned to the up-tilt position (10/15 s), two rivulets at the front and dorsal walls, respectively, dripped onto the epiglottis tip, which then flowed to the vallecula. As mentioned previously, liquid accumulated at the vallecula would increase the aspiration risk, which was noted at 20/15 s (yellow arrow).

3.2.2. Water

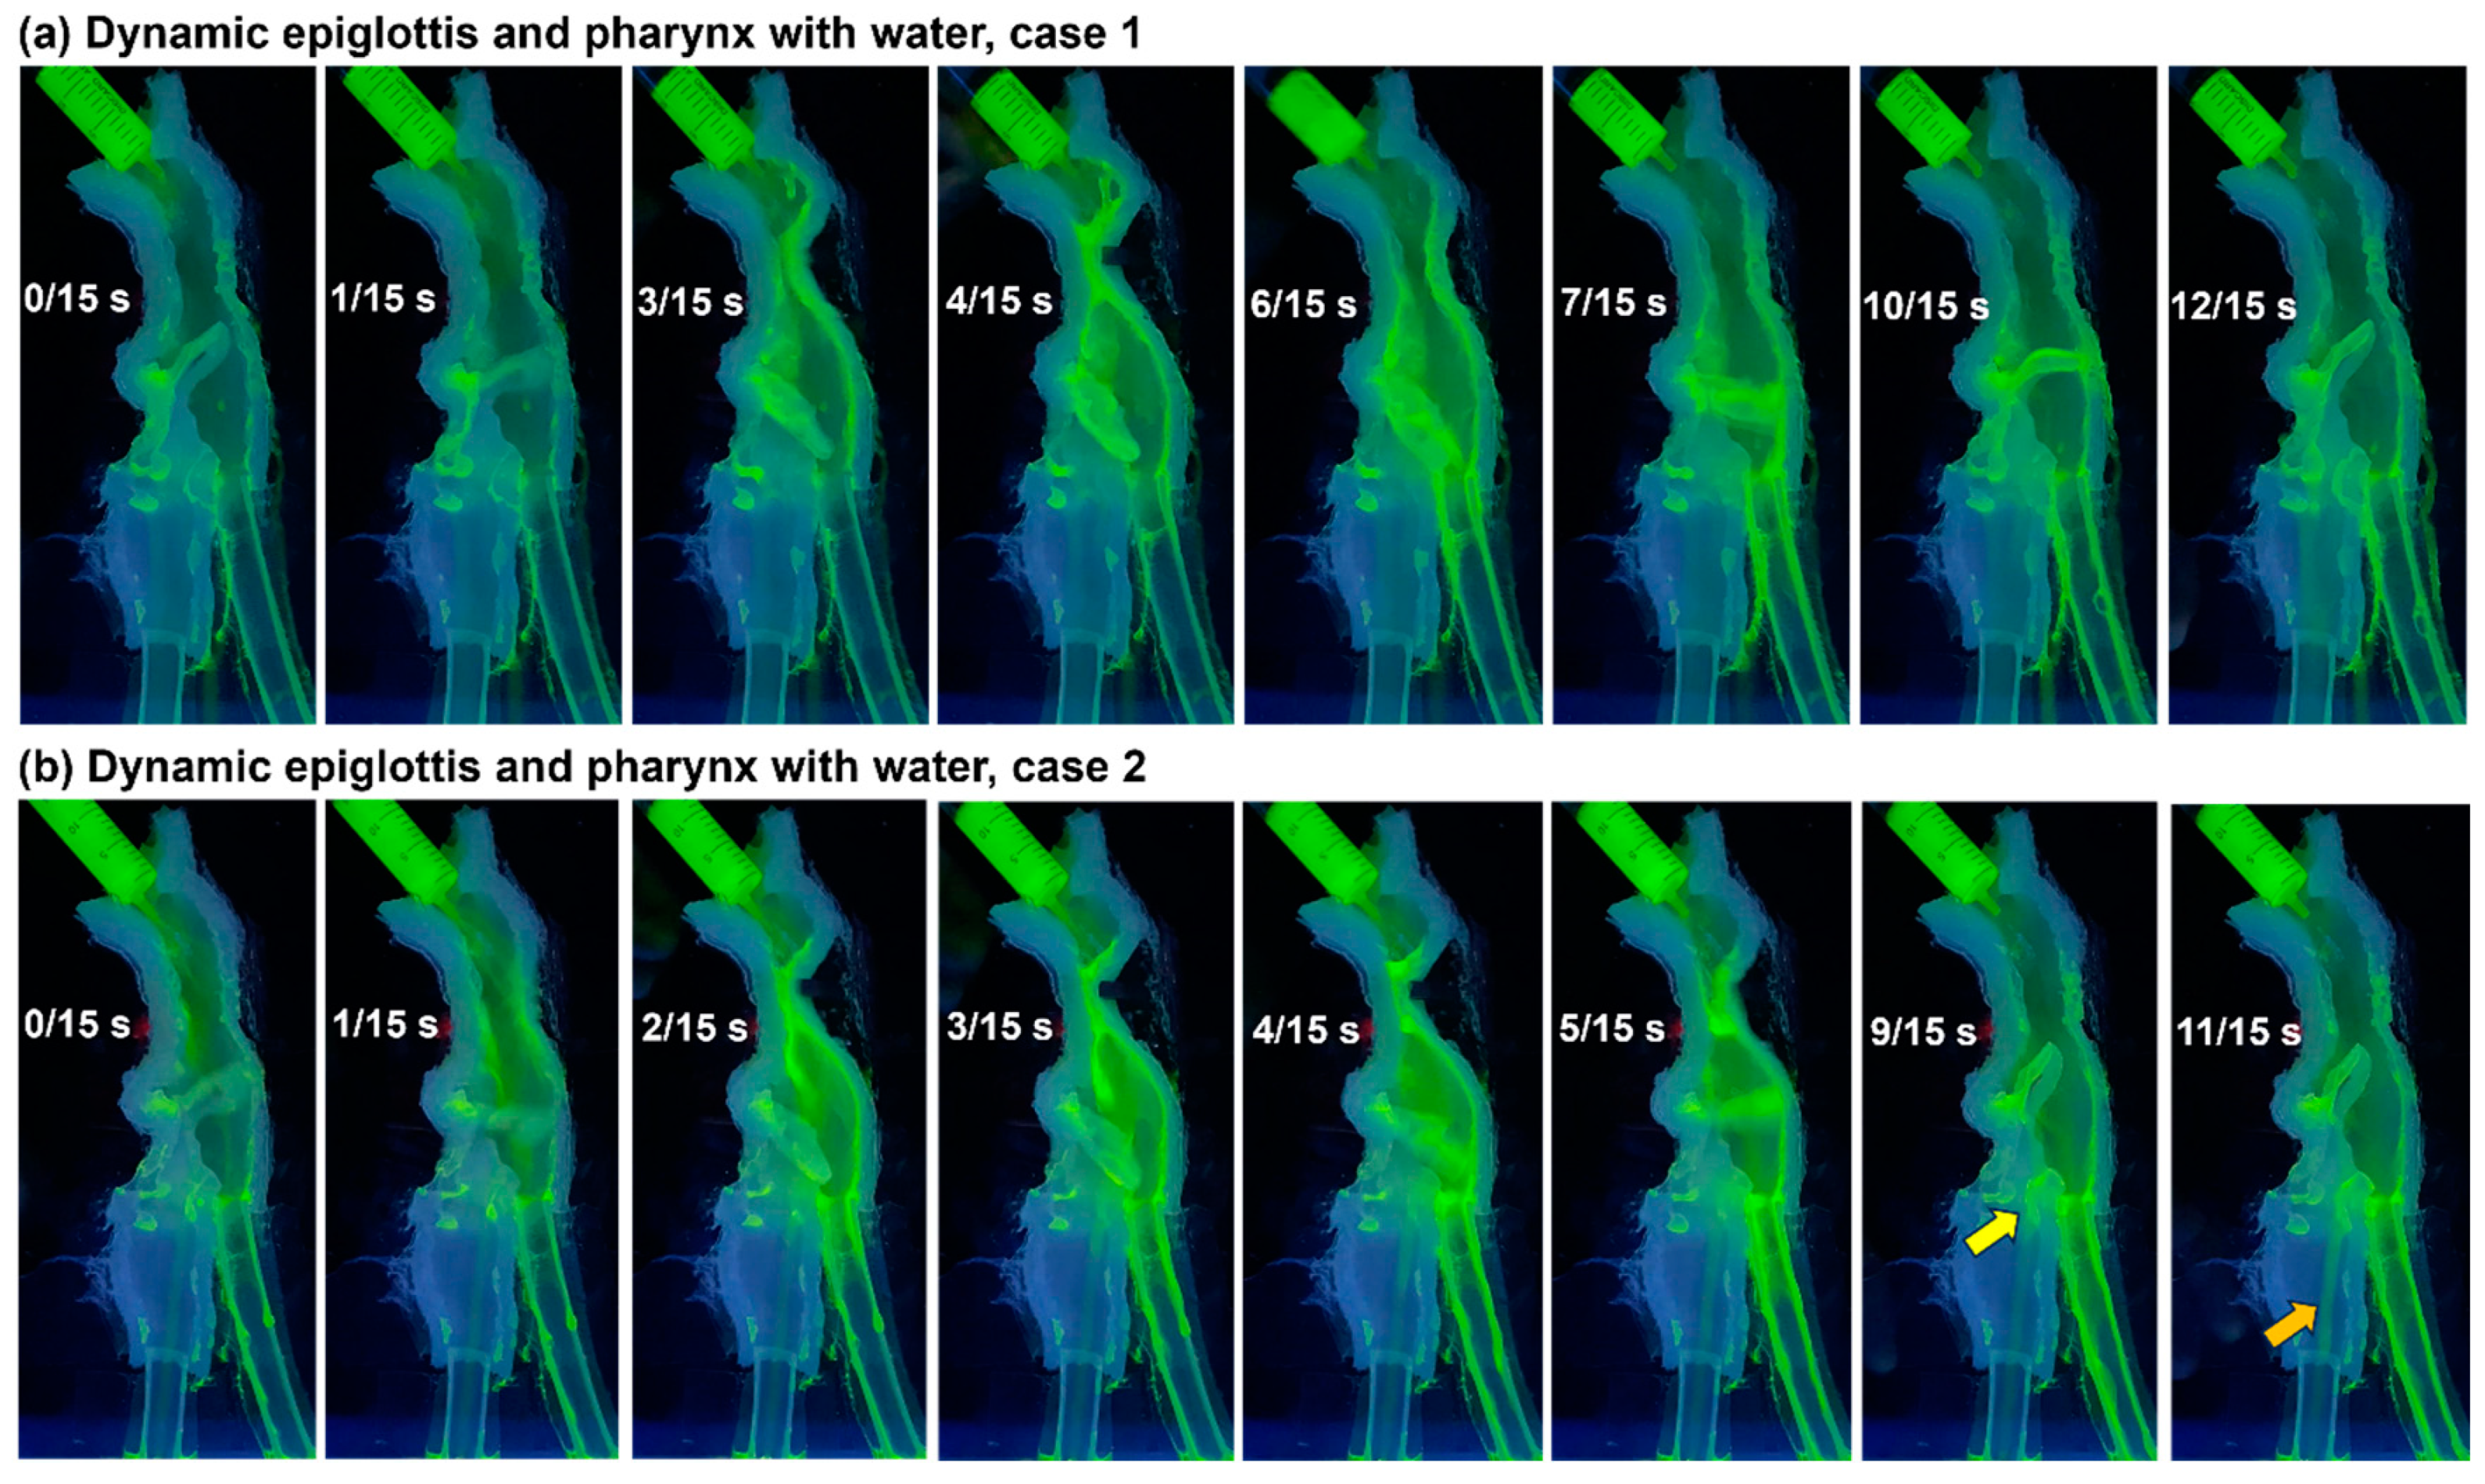
Compared to the MC solution, water exhibited different behaviors within the pharyngeal lumen due to its lower viscosity. Figure 4a shows the water flow dynamics in the pharynx under healthy conditions when liquid dispensing, pharynx contraction, and epiglottis flapping started simultaneously, each with an appropriate duration. After 3/15 s from the onset, the pharyngeal constriction approached the tongue base, and the epiglottis reached the maximum down-tilt position. The peristaltic effect squeezed the liquid downward faster, thus coating both the front, side, and back walls beneath the pharyngeal constriction and above the epiglottis. The relaxation of the pharyngeal constrictor and the back-flapping of the epiglottis starting from 4/15 s elicited very diffuse distributions of water in the study domain (6/15 s). Meanwhile, the water film previously coating the pharyngeal walls slid downward due to gravity; among them, the portion on the front wall fell on the epiglottis, that on the side wall flowed into the pyriform sinus without obstruction, and that on the back wall was either obstructed by the up-flapping epiglottis or entered the pyriform sinus via the epiglottis tip.
Observations indicate that the earlier return of the epiglottis to the resting up-tilt position increased the risk of aspiration via the cuneiform recess. As shown in Figure 4b, the quick contracting/relaxing motion of the pharynx (2/15–5/15 s) spread the water relatively evenly over the back, side, and front walls of the pharyngeal lumen. The epiglottis, as well as the pharynx, returned to the resting position around 9/15 s, and at the same time, flow over the cuneiform recess became apparent (yellow color, 9/15 s). This flow continued to enter the laryngeal vestibule and trachea from 9/15 s to 11/15 s, causing aspiration. A recording of the corresponding water flow dynamics can be viewed in the Supplementary Video S2.

3.3. Liquid Flow Dynamics with Flapping Epiglottis Only

3.3.1. MC Solution of 1% w/v

We subsequently simplified the tests by deactivating pharyngeal contraction and keeping only the epiglottis flapping motion. Figure 5a shows the dynamics of the MC solution; a recording of the bolus dynamics can be viewed in the Supplementary Video S3. Compared to Figure 3, Figure 5a reveals both similarities and disparities, the latter of which can be attributed to the inactivation of pharynx constriction. Again, no liquid bouncing off is observed due to the high viscosity (2/15 s) of the MC solution. The liquid bolus descends along the pharyngeal dorsal wall and separates from the wall halfway through the pharynx (4/15 s). At this instant, the epiglottis has completed its downward travel during its flapping motion, reaching its maximum down-tilt position. The liquid bolus falls on the upper surface of the down-tilt epiglottis and continues to move toward the tip of the epiglottis before entering the esophagus (6/15 s and 8/15 s).
From 4/15 s, the epiglottis begins to flap upward, separating the liquid bolus into two sections (10/15 s). The epiglottis tip touches the dorsal pharyngeal wall, blocking the liquid above and causing the liquid to build up and fill the vallecula at the epiglottis base (14/15 s). The upper epiglottis has a convex shape, leading the liquid above it to flow over the edge at the epiglottis base (brown arrow, 28/15 s). This off-edge liquid then splits into two paths, one flowing inward and entering the laryngeal vestibule, while the other flows along the aryepiglottic fold and enters the laryngeal vestibule via the cuneiform recess, as illustrated by the yellow arrow at 28/15 s. As such, a too-early flapping up of the epiglottis increases the likelihood of aspiration; an up-tilt angle is more likely to elicit aspiration.

3.3.2. Water

In comparison to the 1% MC solution (a slightly thick fluid), the hydrodynamics of the water (a thin fluid) are much quicker (Figure 5b). No apparent bolus formation is observed; rather, the liquid film is very thin and equally coated on all pharyngeal walls, indicating a splash-induced re-distribution of the liquid upon impacting onto the posterior oropharynx. A recording of the corresponding water flow dynamics can be viewed in the Supplementary Video S4.
It is noted in Figure 5b that the water film on the dorsal wall of the pharynx quickly descends and directly enters the esophagus. The film lining the side wall slides into the pyriform sinus, which then diverts inwardly and drains into the esophagus. The film lining the anterior wall (i.e., tongue base) flows down and impinges on the epiglottis’s upper surface. Depending on the epiglottis angle at that instant, the water on the epiglottis either flows backward to the base/vallecula (when titled up, as shown at 1/15 and 2/15 s) or forward to the epiglottis tip (when titled down, at 3/15–8/15 s).
At 2/15 s, when the epiglottis touches the dorsal wall of the pharynx, the liquid stream on the dorsal wall will be interrupted, with a portion falling from the two sides of the epiglottis tip. The continuous down-flapping motion of the epiglottis will increase the off-tip flow rate, as shown at 3/15s and 4/15 s. Specifically, in this case, no fluid enters the laryngeal vestibule, probably because only a small fraction of dispensed fluid travels along the anterior wall, thus precluding surplus liquid from falling onto the upper epiglottis.

3.4. Liquid Flow Dynamics with Stationary Epiglottis at Varying Angles

3.4.1. Up-Tilt 45°, 1% w/v MC

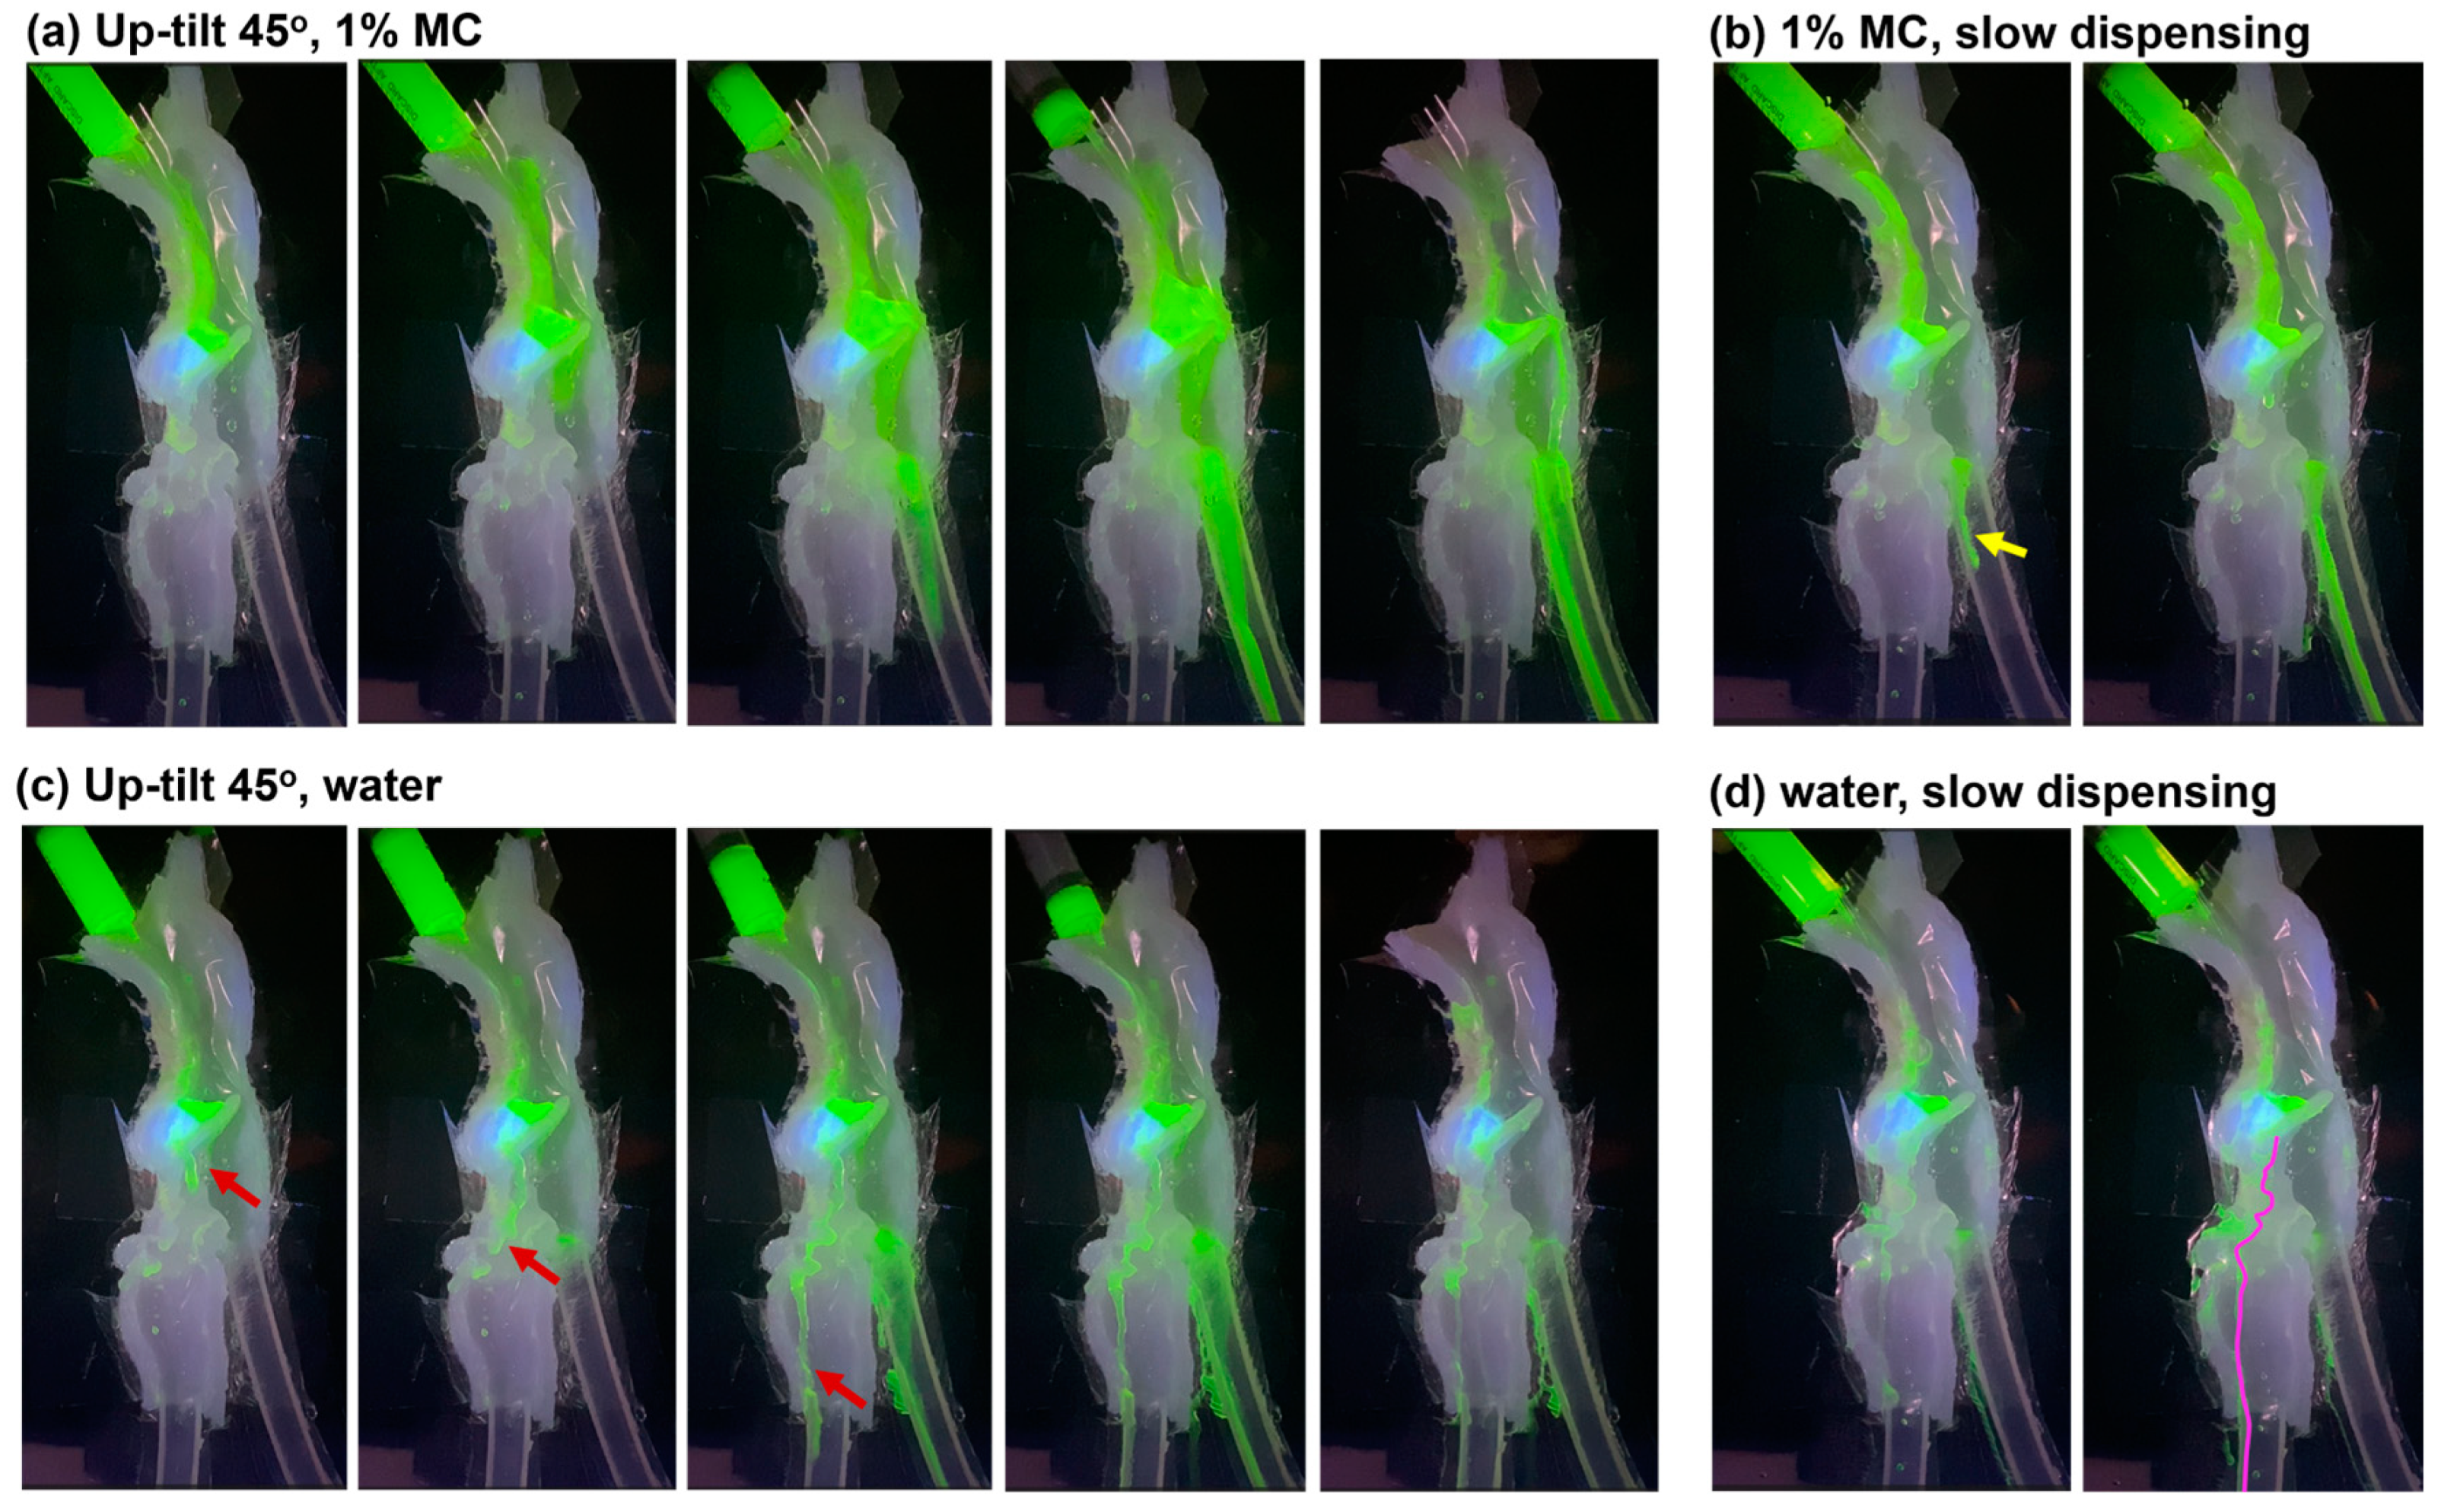
To better understand scenarios with elevated risks, liquid hydrodynamics were further studied with a fixed epiglottis at varying angles (i.e., frozen views). Figure 6a shows the flow dynamics of 1% w/v MC solution when the epiglottis is stationary and tilted upwards at a 45° angle with fast dispensing to the oropharynx. The MC solution first followed the tongue base curvature and accumulated in the vallecula. Without the epiglottis inversion, the liquid level rose quickly to the brim of the epiglottis. Most of the MC solution traveled over the lateral edge of the epiglottis, descending into the pyriform sinus via the lateral channel. This flow is then redirected towards the center before entering the esophagus. A minor portion of the MC solution was seen passing over the tip of the epiglottis, moving along the back wall of the pharynx before directly entering the esophagus. No overflow into the laryngeal vestibule was observed, indicating relatively regular flow dynamics and lower aspiration risks than those with dynamic structures.
Figure 6b shows the flow dynamics when dispensing the MC solution at a slower speed. The liquid level in the vallecula rises more slowly than that in Figure 6a. The flows around the epiglottis are laminar and less complex. No aspiration is noted.

3.4.2. Up-Tilt 45°, Water

Figure 6c,d show the flow dynamics of water when dispensed at a normal and slow speed, respectively. Aspirations are noted in both cases (red arrow in Figure 6c and pink line in Figure 6d), as opposed to no aspiration in the two cases using the MC solution. This indicates that a mildly thick liquid (i.e., 1% w/v MC) will reduce the aspiration risks compared to using a thin liquid like water. The onset of esophagus drain is earlier for water than for the 1% w/v MC.

3.4.3. Horizontal (0°), Water

Considering that water poses higher aspiration risks than the 1% w/v MC solution, only water was considered in subsequent tests with varying epiglottis positions. Figure 7a shows the flow dynamics of water when the epiglottis assumes a horizontal position (0°). To verify the hypothesis that off-edge flows are more likely to cause aspiration, special attention was paid to the transient water flow behaviors around the epiglottis’s edge and the recesses above/below the cuneiform tubercle.
The brown arrows in Figure 7a show the temporospatial translocation of one water drop that enters the laryngeal vestibule via the recess above the cuneiform tubercle. This water drop forms as the fluid falls over the edge of the posterior epiglottis. On the other hand, the red arrows exhibit the sequence of one water drop passing over the middle epiglottis edge and making its way into the laryngeal vestibule via the recess below the cuneiform tubercle. By comparison, the yellow arrows show the water stream passing over the epiglottis’s tip, which flows along the dorsal pharynx wall and enters the esophagus.
It is also noted that not all water drops falling over the middle epiglottis edge cause aspiration. Case 2 in Figure 7a compares the behavior and fate of two adjacent drops flowing over the middle edge (red hollow and yellow hollow arrows). It is clear that the first drop (red hollow arrow) flows along the aryepiglottic fold before entering the laryngeal vestibule via the recess below the cuneiform tubercle. By contrast, the second drop (yellow hollow arrow) clings to the epiglottis edge for a longer time; after detachment, it travels along the lateral pharyngeal wall before entering the esophagus.
Figure 7b shows the water flow dynamics when dispensed at a much slower speed, representing saliva swallowing with an incomplete epiglottis inversion. In the first case, capillary flows over the base of the epiglottis are observed, slowly finding their way into the laryngeal vestibule (pink line), causing unnoticed aspiration. In the second case, a drop forms and detaches from the middle edge of the epiglottis, which follows the aryepiglottic fold and enters the laryngeal vestibule via the recess above the cuneiform tubercle. These frequent observations of capillary flows can be significant to elderly patients or patients who have weaker or uncoordinated swallowing muscles.

3.4.4. Down-Tilt 45°, Water

Figure 7c displays water flow dynamics when the epiglottis assumed a down-tilt angle of 45°. Without the vallecular housing, the liquid moves much faster, leaving a much thinner coating on the wall and leading to an earlier onset of esophagus draining. At the same time, significant aspirations are observed, with three water streams in the front, middle, and back of the trachea, respectively (dashed lines in Figure 7c). A small flow stream was also observed in the dorsal trachea in the second panel of Figure 7c (red arrow). A close examination revealed that this aspired flow was due to overflows via the interarytenoid notch when the water level in the pyriform sinuses rose above the notch.
Considering the slow dispensing in Figure 7c, a water stream is observed in the dorsal trachea, resulting from capillary overflow from the epiglottis base (pink line), reaffirming the elevated aspiration risk of saliva swallowing with incomplete epiglottis inversion.

4. Discussion

4.1. Liquid Flow Patterns with Higher Aspiration Risks

We observed in this study that some factors were more likely to cause aspiration than others, including water more than the 1% w/v MC solution and dynamic structures more than stationary structures. For comparable operating conditions, elevated aspiration risks were persistently noted for water more than the 1% w/v MC solution, confirming the importance of liquid viscosity in swallowing pathophysiology [47]. Water, a thin liquid, has a much lower viscosity (1.0 mPa·s) than the 1% w/v MC solution (245 ± 8 mPa·s), which is considered as a mildly thick liquid (or nectar-thick liquid) but close to moderately thick liquid (or honey-thick liquid) (Figure 2). As a result, distinct flow dynamics were observed between these two liquids as they traveled through the upper respiratory–digestive system (Figure 3, Figure 4, Figure 5, Figure 6 and Figure 7 and Supplementary Videos S1–S4). The water flows descended along the oropharyngeal walls as flow streams or rivulets, while the MC solution flowed as a bolus and exhibited more coherent morphology. The liquid film was much thinner for water than for the 1% w/v MC solution. The descending speeds of the water film were higher than that of the MC solution, leading to an earlier entry into the esophagus.
Differences in flow dynamics were also observed in response to dynamic structures. The contracting–relaxing pharynx and the flapping epiglottis swept across the oropharyngeal lumen along their excursion, interacting with the liquid bolus falling within the lumen and the liquid film lining the wall, as shown in Figure 3, Figure 4 and Figure 5 and Supplementary Videos S1–S4. Due to a much lower viscosity, water responded quicker than the MC solution. By comparison, the MC liquid film on the wall was redistributed by dynamic structures, resulting in a much-dispersed pattern. This required a more prolonged period of time than for the MC liquid film to completely drain, thus increasing the chance of liquid residual in the pharynx, particularly the vallecula, dorsal pharyngeal wall, and pyriform sinus. Note that the presence of residue after swallowing is thought to increase the risk of aspiration during subsequent swallows [48]. Even though it was not the focus of this study, we did observe aspirations showing up after multiple swallows, even though there was no aspiration in the initial swallows.
Flow entry into the laryngeal vestibule was frequently observed in these several locations: epiglottis base, recesses above/below the cuneiform tubercle, and the interarytenoid notch. Aspiration via the first location needed slow liquid dispensing, allowing the capillary flow to move from the vallecula to the underside of the epiglottis (Figure 7). Aspiration via the cuneiform tubular recesses was most observed in this study, with off-edge flows from the first half of the epiglottis, as highlighted in Figure 5a and Figure 7b. Aspiration via the interarytenoid notch happened when the liquid level rose higher than the notch, thus causing overflow into the laryngeal vestibule, forming a trace on the dorsal trachea (Figure 7c).

4.2. Frequent Aspirations with Slow Water Dispensing and Implications

In this study, we observed that a slow dispensing of water into the oropharynx gave rise to more frequent flow entry into the laryngeal vestibule and trachea, as depicted in Figure 6 and Figure 7. This scenario is similar to saliva swallowing with an incomplete epiglottis inversion. The frequent observation of aspiration in this scenario can have significant implications for dysphagia patients, considering that every day, an adult person will swallow 1.0–1.5 L of saliva to maintain the lubrication of respiratory–digestive tissues [12,13]. The stationary epiglottis in Figure 6 and Figure 7 can represent a condition before the onset of swallowing. Bolus entering the airway before the onset of swallowing has been frequently observed in patients with dysphagia [49]. Bolus entry into the pharynx before the act of swallowing can also take place in healthy individuals when drinking liquids [50]. Using videofluoroscopy, Forbes and Humbert investigated the mechanisms of the chin-down posture in alleviating swallowing disorders [51]. Their findings suggested that this method might only benefit patients with specific swallowing impairments, such as pre-swallow entry, while it could have negligible or even adverse effects on patients with other swallowing disorders. Thus, an effective intervention or therapeutic procedure necessitates the knowledge of the etiology behind the symptoms, as well as the mechanisms of how the etiology leads to the symptoms, specifically, the fluid–structure interactions causing aspiration.

4.3. Limitations and Future Studies

A major limitation of the model was the absence of modeling the synchronized motions of the entire set of dynamic structures involved in the process of swallowing (i.e., the rolling back of the tongue, the up and down motion of the larynx, hyoid bone, epiglottis, the contraction/relaxation of the superior, middle, and inferior circular pharyngeal constrictor muscles, etc.). However, our aim in this study was not to replicate the life dynamic conditions, which are too complex to be executable, but to delve deeper into specific factors/structures to identify liquid flow patterns prone to aspiration. In doing so, we circumvented the current holistic method that encapsulates too many factors, making it highly challenging to understand or isolate the specific role of individual swallowing-related structures. Instead, we focused on individual dynamic structures (i.e., pharynx and epiglottis) or fixing their positions at specific instants to facilitate our analysis. Also, the results are mostly observational and qualitative; quantitative studies are needed to characterize aspiration and associated factors more precisely. To quantify post-swallow residue in the vallecula using videofluoroscopic images, Pearson et al. [52] proposed a mathematical model called the Normalized Residue Ratio Scale (NRRS), which outperformed conventional perceptual quantitative methods.
Considering the complex, multi-component motions, mathematical modeling and simulations are necessary to study swallowing mechanisms. Only a few such studies have been reported in the literature, presumably owing to the numerical challenges involved. Meng et al. [53] used computational fluid dynamics (CFD) to simulate the axial and radial motions of the liquid bolus within the pharynx under a force from the tongue base. When the tongue base pushed against the throat, water moved faster than the barium sulphate mixture. A thicker, non-Newtonian fluid moved at a slower speed and entered the esophagus at a smaller amount, which is more consistent with the slower motion and smaller deglutition for 1% methylcellulose (MC) solution than with water, as observed in Figure 5 and Video 4 in this study. Michiwaki et al. [54] simulated bolus flows in a CT-based realistic organ model using a numerical simulator Swallow Vision (Scotland, UK). They reported a flow velocity of 0.2–0.6 m/s for a Newtonian fluid with a viscosity of 2.5 mPa·s and 0.1–0.5 m/s for a non-Newtonian liquid with a viscosity of 300 mPa·s. In this study, we observed a much faster motion of the Newtonian (water, 1 mPa·s) than the non-Newtonian fluid (1% MC solution, 245 mPa·s). The flow velocity was highly transient for both water and the 1% MC solution. The liquid bolus morphology also deformed quickly, making velocity quantification difficult. In average, the bolus velocity was estimated to be 0.45 m/s for water and 0.30 m/s for 1% MC solution, which was consistent with Michiwaki et al. [54]. Nicosia and Robbins [55] used mathematical modeling and simulations to investigate the motions of liquid boluses squeezed by the tongue during the oral phase of swallowing. They observed that the bolus ejection from the oral cavity depended on density when the fluid viscosity was less than 100 mPa·s, while the viscosity effect became more dominant the liquid viscosity was larger than 1000 mPa·s. In this study, the oral swallowing phase was not considered in the physical model; rather, an IDDSI (International Dysphagia Diet Standardization Initiative) test was conducted that classified the emptying speed of the two liquids, with water within a 10 mL syringe drained completely within 10 s, while 70% of MC solution still remained in the syringe, as shown in Figure 2b. Ohta et al. [56] numerically investigated the effects of the bolus viscosity on pharyngeal residue with impaired pharyngeal motions and suggested that a thicker fluid increased pharyngeal residual volume, particular in a forward-leaning posture. This was consistent with our study, where there were more MC residuals than water when the epiglottis took a stationary, 45° up-tilt position (Figure 6). The residual enhancement was particularly more pronounced in the pyriform fossa and vallecula. Note that no structural motion was considered in Ohta et al. [56]. The dynamic fluid–structure interactions could substantially complicate the liquid motions and resultant residual, as shown in Figure 3, Figure 4 and Figure 5 and Videos S1–S4.
In this study, the half-sectional model was selected to best visualize the liquid hydrodynamics in the middle sagittal pharynx. This, however, more often than less, left a clearance between the mid-sagittal section of the epiglottis and the path across the plexiglass, incurring unintended leakage (Figure 1). This resulted in false aspiration, i.e., flows through the laryngeal vestibule and trachea, a phenomenon that would not have occurred otherwise in a complete pharynx model. The presence of this clearance compromised the accuracy in quantifying the aspiration fraction of the swallowed liquid bolus. However, the mid-sagittal visualization of the liquid flow dynamics provides a unique view into the hydrodynamics underlying health vs. pathological swallowing, similar to the barium-based videofluoroscopy, which is the gold standard for dysphagia diagnosis. Compared to videofluoroscopy, this new method does not use radioactive materials, eliminates the blockage of the other half, and can be tested in a controlled, parametric manner. The model was prepared using cast molding with a single layer of silicone rubber, while the actual wall tissue is a multilayered structure and has non-homogeneous physical properties. However, the overall stiffness (i.e., compliant or rigid) of the material is expected to be the primary factor influencing the liquid dynamics, whereas the effect of the wall uniformity (i.e., homogeneous or directional) will be secondary. The hyoepiglottic ligament, which is a fibrous band connecting the hyoid bone and the epiglottis, was neglected in this study but should be included in future studies because its elasticity can influence the kinematics of the epiglottis [57].

5. Conclusions

This study presents an in vitro experimental method to study the liquid flow dynamics during oropharyngeal swallowing. A pharynx–epiglottis model was developed based on micron-resolution CT images that accurately resolved the anatomical details of swallowing-associated structures like the epiglottis, cuneiform tubercle, pyriform sinus, and interarytenoid notch. A compliant half-pharynx cast was prepared to incorporate dynamic structures and visualize the flow dynamics in the mid-sagittal plane. Specific findings from this study are:
  • Water poses a higher aspiration risk than the 1% w/v methylcellulose (MC) solution for all scenarios considered.
  • The dynamic pharynx and epiglottis caused a delayed esophageal entry and vallecular residual for the MC solution.
  • Dispensing liquid too slowly increased the aspiration risk for water, but not for the MC solution.
  • An incomplete inversion of the epiglottis, such as a horizontal or 45° downward tilt, increases the risk of aspirating water.
  • Three frequent aspiration locations were observed, including the epiglottis base for capillary flows, the cuneiform tubercular recesses for off-edge flows, and the interarytenoid notch for flows accumulated in the pyriform fossa.
  • Future studies are needed to verify the observed aspiration mechanisms in models with increasing levels of physiological realism.

Supplementary Materials

The following supporting information can be downloaded at: https://www.mdpi.com/article/10.3390/liquids4020022/s1, Video S1: MC solution hydrodynamics with dynamic pharynx and flapping epiglottis corresponding to Figure 3a; Video S2: Water hydrodynamics with dynamic pharynx and flapping epiglottis corresponding to Figure 4b; Video S3: MC solution hydrodynamics with flapping epiglottis corresponding to Figure 5a; Video S4: Water hydrodynamics with flapping epiglottis corresponding to Figure 5b.

Author Contributions

Conceptualization, X.S., P.D. and J.X.; methodology, A.S., X.S. and J.X.; validation, P.D. and J.X.; formal analysis, A.S., X.S., P.D. and J.X.; investigation, A.S. and J.X.; resources, X.S. and J.X.; data curation, J.X.; writing—original draft preparation, J.X.; writing—review and editing, A.S., X.S. and P.D. All authors have read and agreed to the published version of the manuscript.

Funding

This research received no external funding.

Data Availability Statement

The data are contained within the article.

Acknowledgments

Kian Barari at the UMass Lowell Biomedical Engineering Department is gratefully acknowledged for assistance in processing the recorded videos.

Conflicts of Interest

The authors declare no conflicts of interest.

References

  1. Shaw, S.M.; Martino, R. The normal swallow: Muscular and neurophysiological control. Otolaryngol. Clin. N. Am. 2013, 46, 937–956. [Google Scholar] [CrossRef] [PubMed]
  2. Matsuo, K.; Palmer, J.B. Anatomy and physiology of feeding and swallowing: Normal and abnormal. Phys. Med. Rehabil. Clin. N. Am. 2008, 19, 691–707. [Google Scholar] [CrossRef] [PubMed]
  3. Ding, P.; Tufano, R.P.; German, R.Z. Anatomical anomalies of the laryngeal branches of the vagus nerve in pigs (Sus scrofa). Lab. Anim. 2012, 46, 338–340. [Google Scholar] [CrossRef]
  4. Niederman, M.S.; Cilloniz, C. Aspiration pneumonia. Rev. Esp. Quimioter. 2022, 35 (Suppl. S1), 73–77. [Google Scholar] [CrossRef] [PubMed]
  5. Košutova, P.; Mikolka, P. Aspiration syndromes and associated lung injury: Incidence, pathophysiology and management. Physiol. Res. 2021, 70, S567–S583. [Google Scholar] [CrossRef] [PubMed]
  6. Yoshikawa, T.T.; Mylotte, J.M. Nursing home-acquired pneumonia. Clin. Infect. Dis. 2002, 35, 1205–1211. [Google Scholar]
  7. Gupte, T.; Knack, A.; Cramer, J.D. Mortality from aspiration pneumonia: Incidence, trends, and risk factors. Dysphagia 2022, 37, 1493–1500. [Google Scholar] [CrossRef] [PubMed]
  8. Caplan, Z.U.S. Older Population Grew from 2010 to 2020 at Fastest Rate Since 1880 to 1890. Available online: https://www.census.gov/library/stories/2023/05/2020-census-united-states-older-population-grew.html (accessed on 15 January 2024).
  9. Sasegbon, A.; Hamdy, S. The anatomy and physiology of normal and abnormal swallowing in oropharyngeal dysphagia. Neurogastroenterol. Motil. 2017, 29, e13100. [Google Scholar] [CrossRef] [PubMed]
  10. Skarbinski, K.F.; Glennon, E. Dysphagia: A review. Nurse Pract. 2020, 45, 9–16. [Google Scholar] [CrossRef] [PubMed]
  11. Wilkinson, J.M.; Codipilly, D.C.; Wilfahrt, R.P. Dysphagia: Evaluation and collaborative management. Am. Fam. Physician 2021, 103, 97–106. [Google Scholar]
  12. Iorgulescu, G. Saliva between normal and pathological. Important factors in determining systemic and oral health. J. Med. Life 2009, 2, 303–307. [Google Scholar] [PubMed]
  13. Jensen, S.B.; Vissink, A.; Limesand, K.H.; Reyland, M.E. Salivary Gland Hypofunction and Xerostomia in Head and Neck Radiation Patients. J. Natl. Cancer Inst. Monogr. 2019, 2019, lgz016. [Google Scholar] [CrossRef] [PubMed]
  14. Hossain, M.Z.; Ando, H.; Unno, S.; Kitagawa, J. Targeting chemosensory ion channels in peripheral swallowing-related regions for the management of oropharyngeal dysphagia. Int. J. Mol. Sci. 2020, 21, 6214. [Google Scholar] [CrossRef] [PubMed]
  15. Gandhi, P.; Plowman, E.K.; Steele, C.M. Differences in pharyngeal swallow event timing: Healthy aging, Parkinson disease, and amyotrophic lateral sclerosis. Laryngoscope Investig. Otolaryngol. 2023, 8, 466–477. [Google Scholar] [CrossRef] [PubMed]
  16. Takizawa, C.; Gemmell, E.; Kenworthy, J.; Speyer, R. A systematic review of the prevalence of oropharyngeal dysphagia in stroke, Parkinson’s disease, Alzheimer’s disease, head injury, and pneumonia. Dysphagia 2016, 31, 434–441. [Google Scholar] [CrossRef] [PubMed]
  17. Mayerl, C.J.; Gould, F.D.H.; Adjerid, K.; Edmonds, C.; German, R.Z. The pathway from anatomy and physiology to diagnosis: A developmental perspective on swallowing and dysphagia. Dysphagia 2023, 38, 33–41. [Google Scholar] [CrossRef] [PubMed]
  18. Kuhn, M.A.; Gillespie, M.B.; Ishman, S.L.; Ishii, L.E.; Brody, R.; Cohen, E.; Dhar, S.I.; Hutcheson, K.; Jefferson, G.; Johnson, F.; et al. Expert consensus statement: Management of dysphagia in head and neck cancer patients. Otolaryngol. Head Neck Surg. 2023, 168, 571–592. [Google Scholar] [CrossRef] [PubMed]
  19. Labeit, B.; Michou, E.; Hamdy, S.; Trapl-Grundschober, M.; Suntrup-Krueger, S.; Muhle, P.; Bath, P.M.; Dziewas, R. The assessment of dysphagia after stroke: State of the art and future directions. Lancet Neurol. 2023, 22, 858–870. [Google Scholar] [CrossRef] [PubMed]
  20. Mira, A.; Gonçalves, R.; Rodrigues, I.T. Dysphagia in Alzheimer’s disease: A systematic review. Dement. Neuropsychol. 2022, 16, 261–269. [Google Scholar] [CrossRef]
  21. Umemoto, G.; Furuya, H. Management of dysphagia in patients with parkinson’s disease and related disorders. Intern Med. 2020, 59, 7–14. [Google Scholar] [CrossRef]
  22. Goyal, R.; Mashimo, H. Physiology of oral, pharyngeal, and esophageal motility. GI Motility Online 2006. [Google Scholar] [CrossRef]
  23. Ding, P.; Fung, G.S.; Lin, M.; Holman, S.D.; German, R.Z. The effect of bilateral superior laryngeal nerve lesion on swallowing: A novel method to quantitate aspirated volume and pharyngeal threshold in videofluoroscopy. Dysphagia 2015, 30, 47–56. [Google Scholar] [CrossRef] [PubMed]
  24. Wang, J.; Xi, J.; Han, P.; Wongwiset, N.; Pontius, J.; Dong, H. Computational analysis of a flapping uvula on aerodynamics and pharyngeal wall collapsibility in sleep apnea. J. Biomech. 2019, 94, 88–98. [Google Scholar] [CrossRef]
  25. Xi, J.; Wang, Z.; Talaat, K.; Glide-Hurst, C.; Dong, H. Numerical study of dynamic glottis and tidal breathing on respiratory sounds in a human upper airway model. Sleep Breath. 2018, 22, 463–479. [Google Scholar] [CrossRef] [PubMed]
  26. Si, X.; Talaat, M.; Xi, J. SARS CoV-2 virus-laden droplets coughed from deep lungs: Numerical quantification in a single-path whole respiratory tract geometry. Phys. Fluids 2021, 33, 023306. [Google Scholar]
  27. Mizunuma, H.; Sonomura, M.; Shimokasa, K. Numerical simulation of pharyngeal bolus flow influenced by bolus viscosity and apparent slip. J. Texture Stud. 2020, 51, 742–754. [Google Scholar] [CrossRef] [PubMed]
  28. Xi, J.; Kim, J.; Si, X.; Corley, R.A.; Zhou, Y. Modeling of inertial depositions in scaled models of rat and human nasal airways: Towards in vitro regional dosimetry in small animals. J. Aerosol Sci. 2015, 99, 78–93. [Google Scholar] [CrossRef]
  29. Xi, J.; Talaat, M.; Si, X.A.; Han, P.; Dong, H.; Zheng, S. Alveolar size effects on nanoparticle deposition in rhythmically expanding-contracting terminal alveolar models. Comput. Biol. Med. 2020, 121, 103791. [Google Scholar] [CrossRef]
  30. Kikuchi, T.; Michiwaki, Y.; Azegami, H. Identification of muscle activities involved in hyoid bone movement during swallowing using computer simulation. Comput. Methods Biomech. Biomed. Eng. Imaging Vis. 2023, 11, 1791–1802. [Google Scholar] [CrossRef]
  31. Nakamura, T.; Kita, Y.; Fujimoto, J.; Ayuzawa, K.; Ozawa, H. Hyoid bone movement during swallowing and mechanism of pharyngeal residue in patients with profound intellectual and multiple disabilities. Int. J. Pediatr. Otorhinolaryngol. 2021, 149, 110849. [Google Scholar] [CrossRef]
  32. Hashimoto, T.; Urabe, M.; Chee-Sheng, F.; Murakoshi, A.; Kikuchi, T.; Michiwaki, Y.; Koike, T. Development of a musculoskeletal model of hyolaryngeal elements for understanding pharyngeal swallowing mechanics. Appl. Sci. 2020, 10, 6276. [Google Scholar] [CrossRef]
  33. Li, Q.; Minagi, Y.; Ono, T.; Chen, Y.; Hori, K.; Fujiwara, S.; Maeda, Y. The biomechanical coordination during oropharyngeal swallowing: An evaluation with a non-invasive sensing system. Sci. Rep. 2017, 7, 15165. [Google Scholar] [CrossRef] [PubMed]
  34. Mathieu, V.; de Loubens, C.; Thomas, C.; Panouillé, M.; Magnin, A.; Souchon, I. An experimental model to investigate the biomechanical determinants of pharyngeal mucosa coating during swallowing. J. Biomech. 2018, 72, 144–151. [Google Scholar] [CrossRef] [PubMed]
  35. Stading, M.; Waqas, M.Q.; Holmberg, F.; Wiklund, J.; Kotze, R.; Ekberg, O. A device that models human swallowing. Dysphagia 2019, 34, 615–626. [Google Scholar] [CrossRef]
  36. Fujiso, Y.; Perrin, N.; van der Giessen, J.; Vrana, N.E.; Neveu, F.; Woisard, V. Swall-E: A robotic in-vitro simulation of human swallowing. PLoS ONE 2018, 13, e0208193. [Google Scholar] [CrossRef] [PubMed]
  37. Xi, J.; Wang, Z.; Si, X.A.; Zhou, Y. Nasal dilation effects on olfactory deposition in unilateral and bi-directional deliveries: In vitro tests and numerical modeling. Eur. J. Pharm. Sci. 2018, 118, 113–123. [Google Scholar] [CrossRef] [PubMed]
  38. Printza, A.; Boziki, M.; Triaridis, S.; Kiousi, V.; Arnaoutoglou, M.; Constantinidis, J.; Grigoriadis, N. Tongue strength, dysphagia questionnaire, pharyngeal secretions and FEES findings in dysphagia management in amyotrophic lateral sclerosis. Auris Nasus Larynx 2021, 48, 672–682. [Google Scholar] [CrossRef] [PubMed]
  39. Murphy, E.R.; Thompson, R.; Osman, K.L.; Haxton, C.; Brothers, M.; Lee, L.; Warncke, K.; Smith, C.L.; Keilholz, A.N.; Hamad, A.; et al. A strength endurance exercise paradigm mitigates deficits in hypoglossal-tongue axis function, strength, and structure in a rodent model of hypoglossal motor neuron degeneration. Front. Neurosci. 2022, 16, 869592. [Google Scholar] [CrossRef] [PubMed]
  40. Rutili, V.; Nieri, M.; Franceschi, D.; Pierleoni, F.; Giuntini, V.; Franchi, L. Comparison of rapid versus slow maxillary expansion on patient-reported outcome measures in growing patients: A systematic review and meta-analysis. Prog. Orthod. 2022, 23, 47. [Google Scholar] [CrossRef]
  41. Corley, R.A.; Kabilan, S.; Kuprat, A.P.; Carson, J.P.; Jacob, R.E.; Minard, K.R.; Teeguarden, J.G.; Timchalk, C.; Pipavath, S.; Glenny, R.; et al. Comparative risks of aldehyde constituents in cigarette smoke using transient computational fluid dynamics/physiologically based pharmacokinetic models of the rat and human respiratory tracts. Toxicol. Sci. 2015, 146, 65–88. [Google Scholar] [CrossRef]
  42. Corley, R.A.; Kabilan, S.; Kuprat, A.P.; Carson, J.P.; Minard, K.R.; Jacob, R.E.; Timchalk, C.; Glenny, R.; Pipavath, S.; Cox, T.; et al. Comparative computational modeling of airflows and vapor dosimetry in the respiratory tracts of rat, monkey, and human. Toxicol. Sci. 2012, 128, 500–516. [Google Scholar] [CrossRef]
  43. Wikiwand. Epiglottic Vallecula, From Wikipedia, the Free Encyclopedia. Available online: https://www.wikiwand.com/en/Epiglottic_vallecula (accessed on 15 January 2024).
  44. Materials, A. Silicone Rubber: Room Temperature Vulcanising (RTV) Rubbers. Available online: https://www.azom.com/article.aspx?ArticleID=920 (accessed on 4 January 2024).
  45. Ismael-Mohammed, K.; Bolivar-Prados, M.; Laguna, L.; Clavé, P. Measuring the rheological and textural properties of thick Purees used to manage patients with swallowing disorders. Nutrients 2023, 15, 3767. [Google Scholar] [CrossRef] [PubMed]
  46. Bolivar-Prados, M.; Hayakawa, Y.; Tomsen, N.; Arreola, V.; Nascimento, W.; Riera, S.; Kawakami, S.; Miyaji, K.; Takeda, Y.; Kayashita, J.; et al. Shear-viscosity-dependent effect of a gum-based thickening product on the safety of swallowing in older patients with severe oropharyngeal dysphagia. Nutrients 2023, 15, 3279. [Google Scholar] [CrossRef] [PubMed]
  47. Newman, R.; Vilardell, N.; Clavé, P.; Speyer, R. Effect of Bolus Viscosity on the Safety and Efficacy of Swallowing and the Kinematics of the Swallow Response in Patients with Oropharyngeal Dysphagia: White Paper by the European Society for Swallowing Disorders (ESSD). Dysphagia 2016, 31, 232–249. [Google Scholar] [CrossRef] [PubMed]
  48. Molfenter, S.M.; Steele, C.M. The relationship between residue and aspiration on the subsequent swallow: An application of the normalized residue ratio scale. Dysphagia 2013, 28, 494–500. [Google Scholar] [CrossRef] [PubMed]
  49. Mao, S.; Sabry, A.; Khalifa, Y.; Coyle, J.L.; Sejdic, E. Estimation of laryngeal closure duration during swallowing without invasive X-rays. Future Gener. Comput. Syst. 2021, 115, 610–618. [Google Scholar] [CrossRef] [PubMed]
  50. Gallegos, C.; Turcanu, M.; Assegehegn, G.; Brito-de la Fuente, E. Rheological issues on oropharyngeal dysphagia. Dysphagia 2023, 38, 558–585. [Google Scholar] [CrossRef] [PubMed]
  51. Forbes, J.; Humbert, I. Impact of the chin-down posture on temporal measures of patients with dysphagia: A pilot study. Am. J. Speech Lang. Pathol. 2021, 30, 1049–1060. [Google Scholar] [CrossRef] [PubMed]
  52. Pearson, W.G., Jr.; Molfenter, S.M.; Smith, Z.M.; Steele, C.M. Image-based measurement of post-swallow residue: The normalized residue ratio scale. Dysphagia 2013, 28, 167–177. [Google Scholar] [CrossRef]
  53. Meng, Y.; Rao, M.A.; Datta, A.K. Computer simulation of the pharyngeal bolus transport of Newtonian and non-Newtonian fluids. Food Bioprod. Process. 2005, 83, 297–305. [Google Scholar] [CrossRef]
  54. Michiwaki, Y.; Kamiya, T.; Kikuchi, T.; Toyama, Y.; Takai, M.; Hanyu, K.; Inoue, M.; Yahiro, N.; Koshizuka, S. Realistic computer simulation of bolus flow during swallowing. Food Hydrocoll. 2020, 108, 106040. [Google Scholar] [CrossRef]
  55. Nicosia, M.A.; Robbins, J.A. The fluid mechanics of bolus ejection from the oral cavity. J. Biomech. 2001, 34, 1537–1544. [Google Scholar] [CrossRef] [PubMed]
  56. Ohta, J.; Ishida, S.; Kawase, T.; Katori, Y.; Imai, Y. A computational fluid dynamics simulation of liquid swallowing by impaired pharyngeal motion: Bolus pathway and pharyngeal residue. Neurogastroenterol. Motil. 2019, 317, G784–G792. [Google Scholar] [CrossRef]
  57. Irvine, L.E.; Yang, Z.; Kezirian, E.J.; Nimni, M.E.; Han, B. Hyoepiglottic ligament collagen and elastin fiber composition and changes associated with aging. Laryngoscope 2018, 128, 1245–1248. [Google Scholar] [CrossRef] [PubMed]
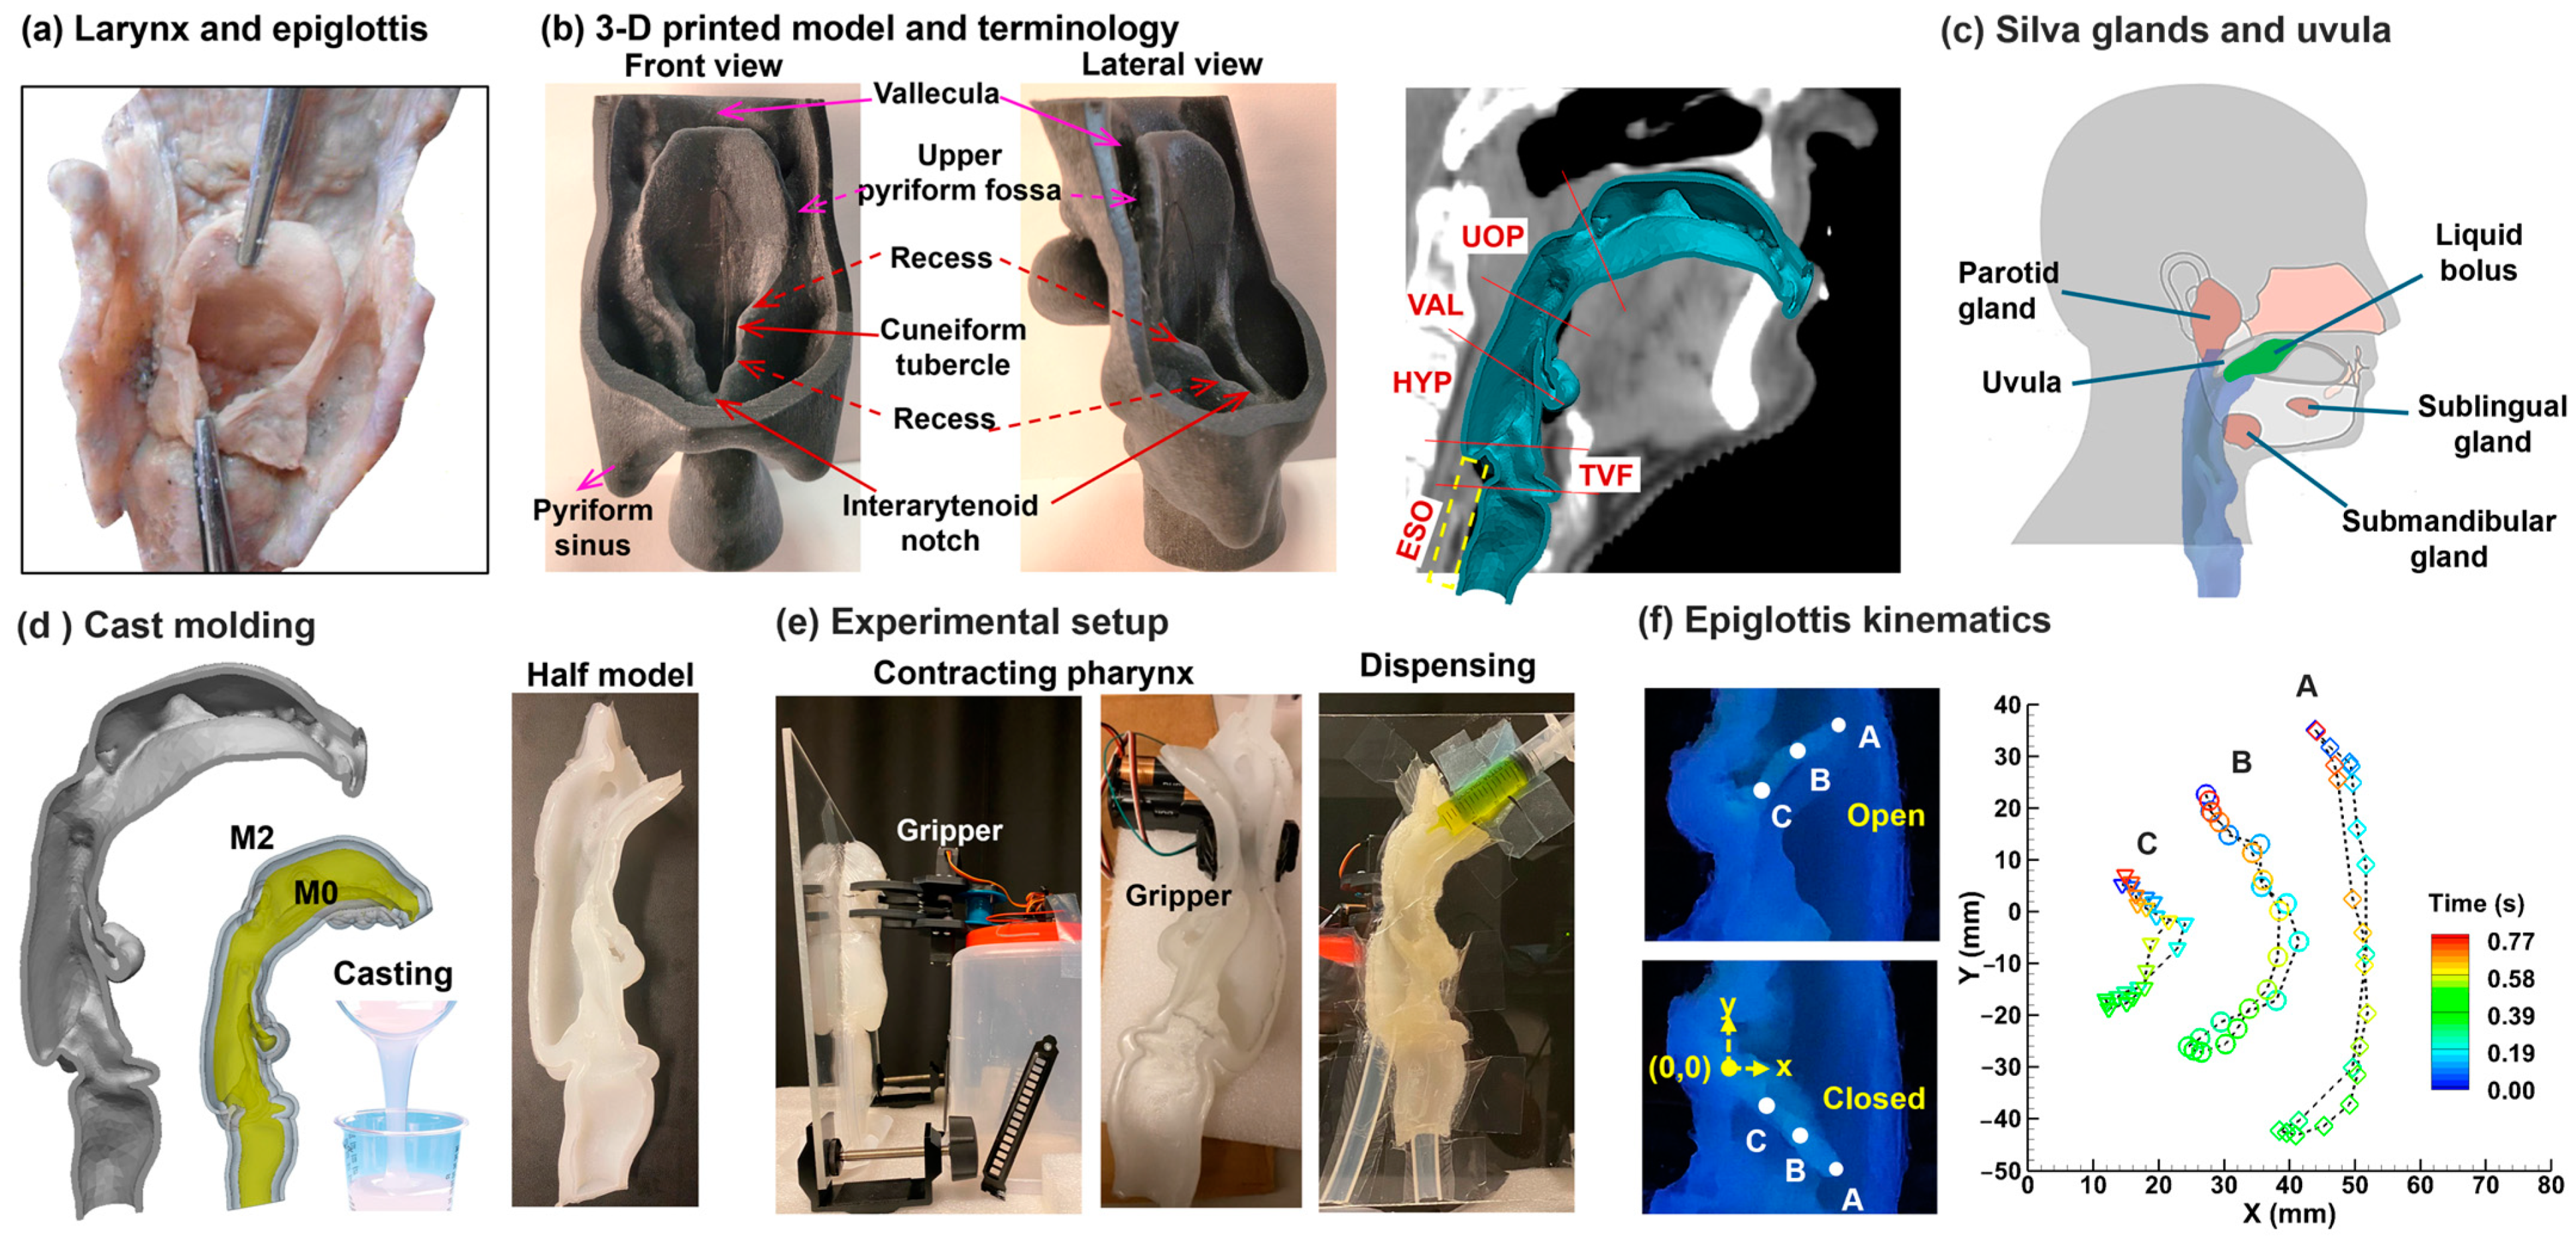
Figure 1. Pharynx–epiglottis model and experimental setup: (a) anatomy of the pharynx and epiglottis adapted from [43], (b) a patient-specific pharynx–epiglottis model with swallow-associated structures: vallecula (VAL), upper pyriform fossa, laryngeal vestibule, cuneiform tubercle, recess below the cuneiform tubercle, interarytenoid notch, and lower pyriform fossa (pyriform sinus), upper oropharynx (UOP), hypopharynx (HYP), esophagus (ESO), and TVF (true vocal fold), (c) salivary glands and uvula, (d) cast molding of the half model using silicone resin, (e) experimental setup with dynamic epiglottis and pharynx, and (f) epiglottis kinematics.
Liquids 04 00022 g001
Figure 2. Measurements of physical properties of various liquids: (a) viscosity, (b) IDDSI (International Dysphagia Diet Standardization Initiative) method, and (c) contact angle.
Liquids 04 00022 g002
Figure 3. Instantaneous hydrodynamics in 1% w/v MC solution with dynamic epiglottis and pharynx: (a) without aspiration and (b) with aspiration. Video S1, related to 3a, is provided in the Supplementary Materials.
Liquids 04 00022 g003
Figure 4. Instantaneous hydrodynamics of water with dynamic epiglottis and pharynx: (a) case 1 and (b) case 2. Video S2, related to 4b, is provided in the Supplementary Materials.
Liquids 04 00022 g004
Figure 5. Instantaneous hydrodynamics with dynamic epiglottis only: (a) 1% w/v MC solution, (b) water, case 1, and (c) water, case 2. Two videos, S3 and S4, are provided in the Supplementary Materials, which are related to 5a and 5b, respectively.
Liquids 04 00022 g005
Figure 6. Liquid hydrodynamics with a stationary, 45° up-tilt epiglottis: (a) 1% w/v MC solution with normal dispensing, (b) 1% w/v MC solution with slow dispensing, (c) water with normal dispensing, and (d) water with slow dispensing.
Liquids 04 00022 g006
Figure 7. Water flow dynamics at varying epiglottis angles and dispensing speeds: (a) horizontal (0°) epiglottis with normal dispensing, (b) horizontal (0°) epiglottis with slow dispensing, and (c) 45° down-tilt epiglottis with normal and slow dispensing.
Liquids 04 00022 g007
Table 1. Test cases with dynamic vs. stationary structures for 1% w/v MC solution and water.
Constricting Pharynx
and Flapping Epiglottis
Flapping
Epiglottis Only
Epiglottis
Up-Tilt 45°
Epiglottis
Epiglottis
Down-Tilt 45°
1% w/v MCFigure 3a *, S1
Figure 3b *
Figure 5a *, S3Figure 6a *
Figure 6b (slow)
NANA
WaterFigure 4a *
Figure 4b *, S2
Figure 5b *, S4Figure 6c *
Figure 6d (slow)
Figure 7a
Figure 7b (slow)
Figure 7c
(Normal and slow)
* Normal dispensing rate if not otherwise stated.
Disclaimer/Publisher’s Note: The statements, opinions and data contained in all publications are solely those of the individual author(s) and contributor(s) and not of MDPI and/or the editor(s). MDPI and/or the editor(s) disclaim responsibility for any injury to people or property resulting from any ideas, methods, instructions or products referred to in the content.