
Comprehensive Analysis of Biomass, Nutrient, and Heavy Metal Contributions of Pelagic Sargassum Species (Phaeophyceae) Inundations in South Florida

 , , ,
, , ,
Abstract
:1. Introduction
2. Materials and Methods
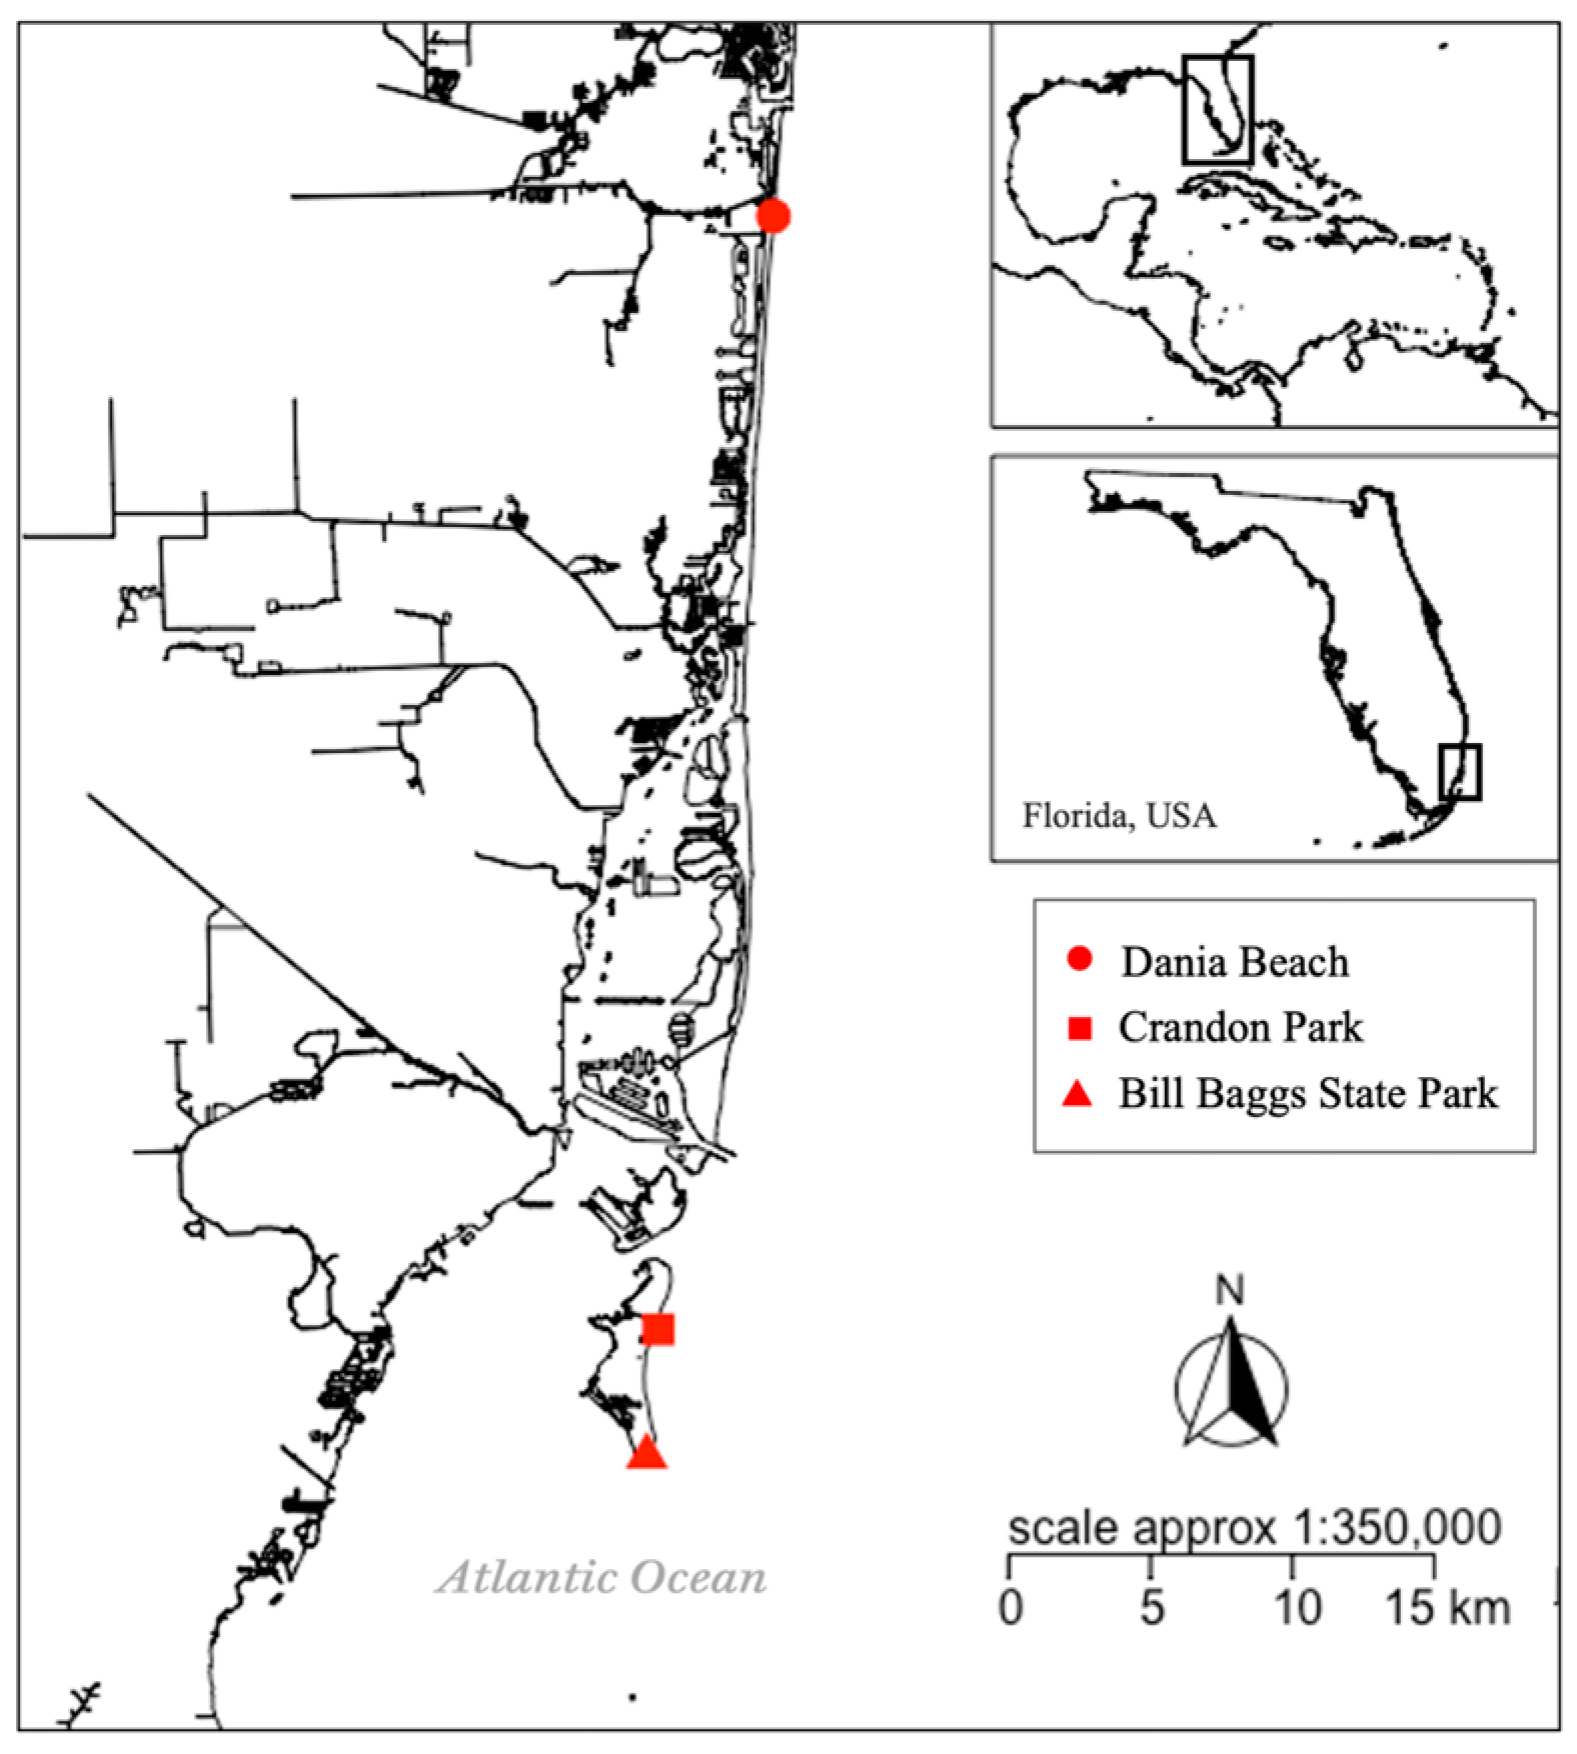
2.1. Study Area
2.2. Biomass
2.3. Volunteer-Contributed Monitoring of Morphotypes
2.4. Nutrient Content
2.5. Organic versus Inorganic Mass Fraction
2.6. Heavy Metals
2.7. Data Analysis
3. Results
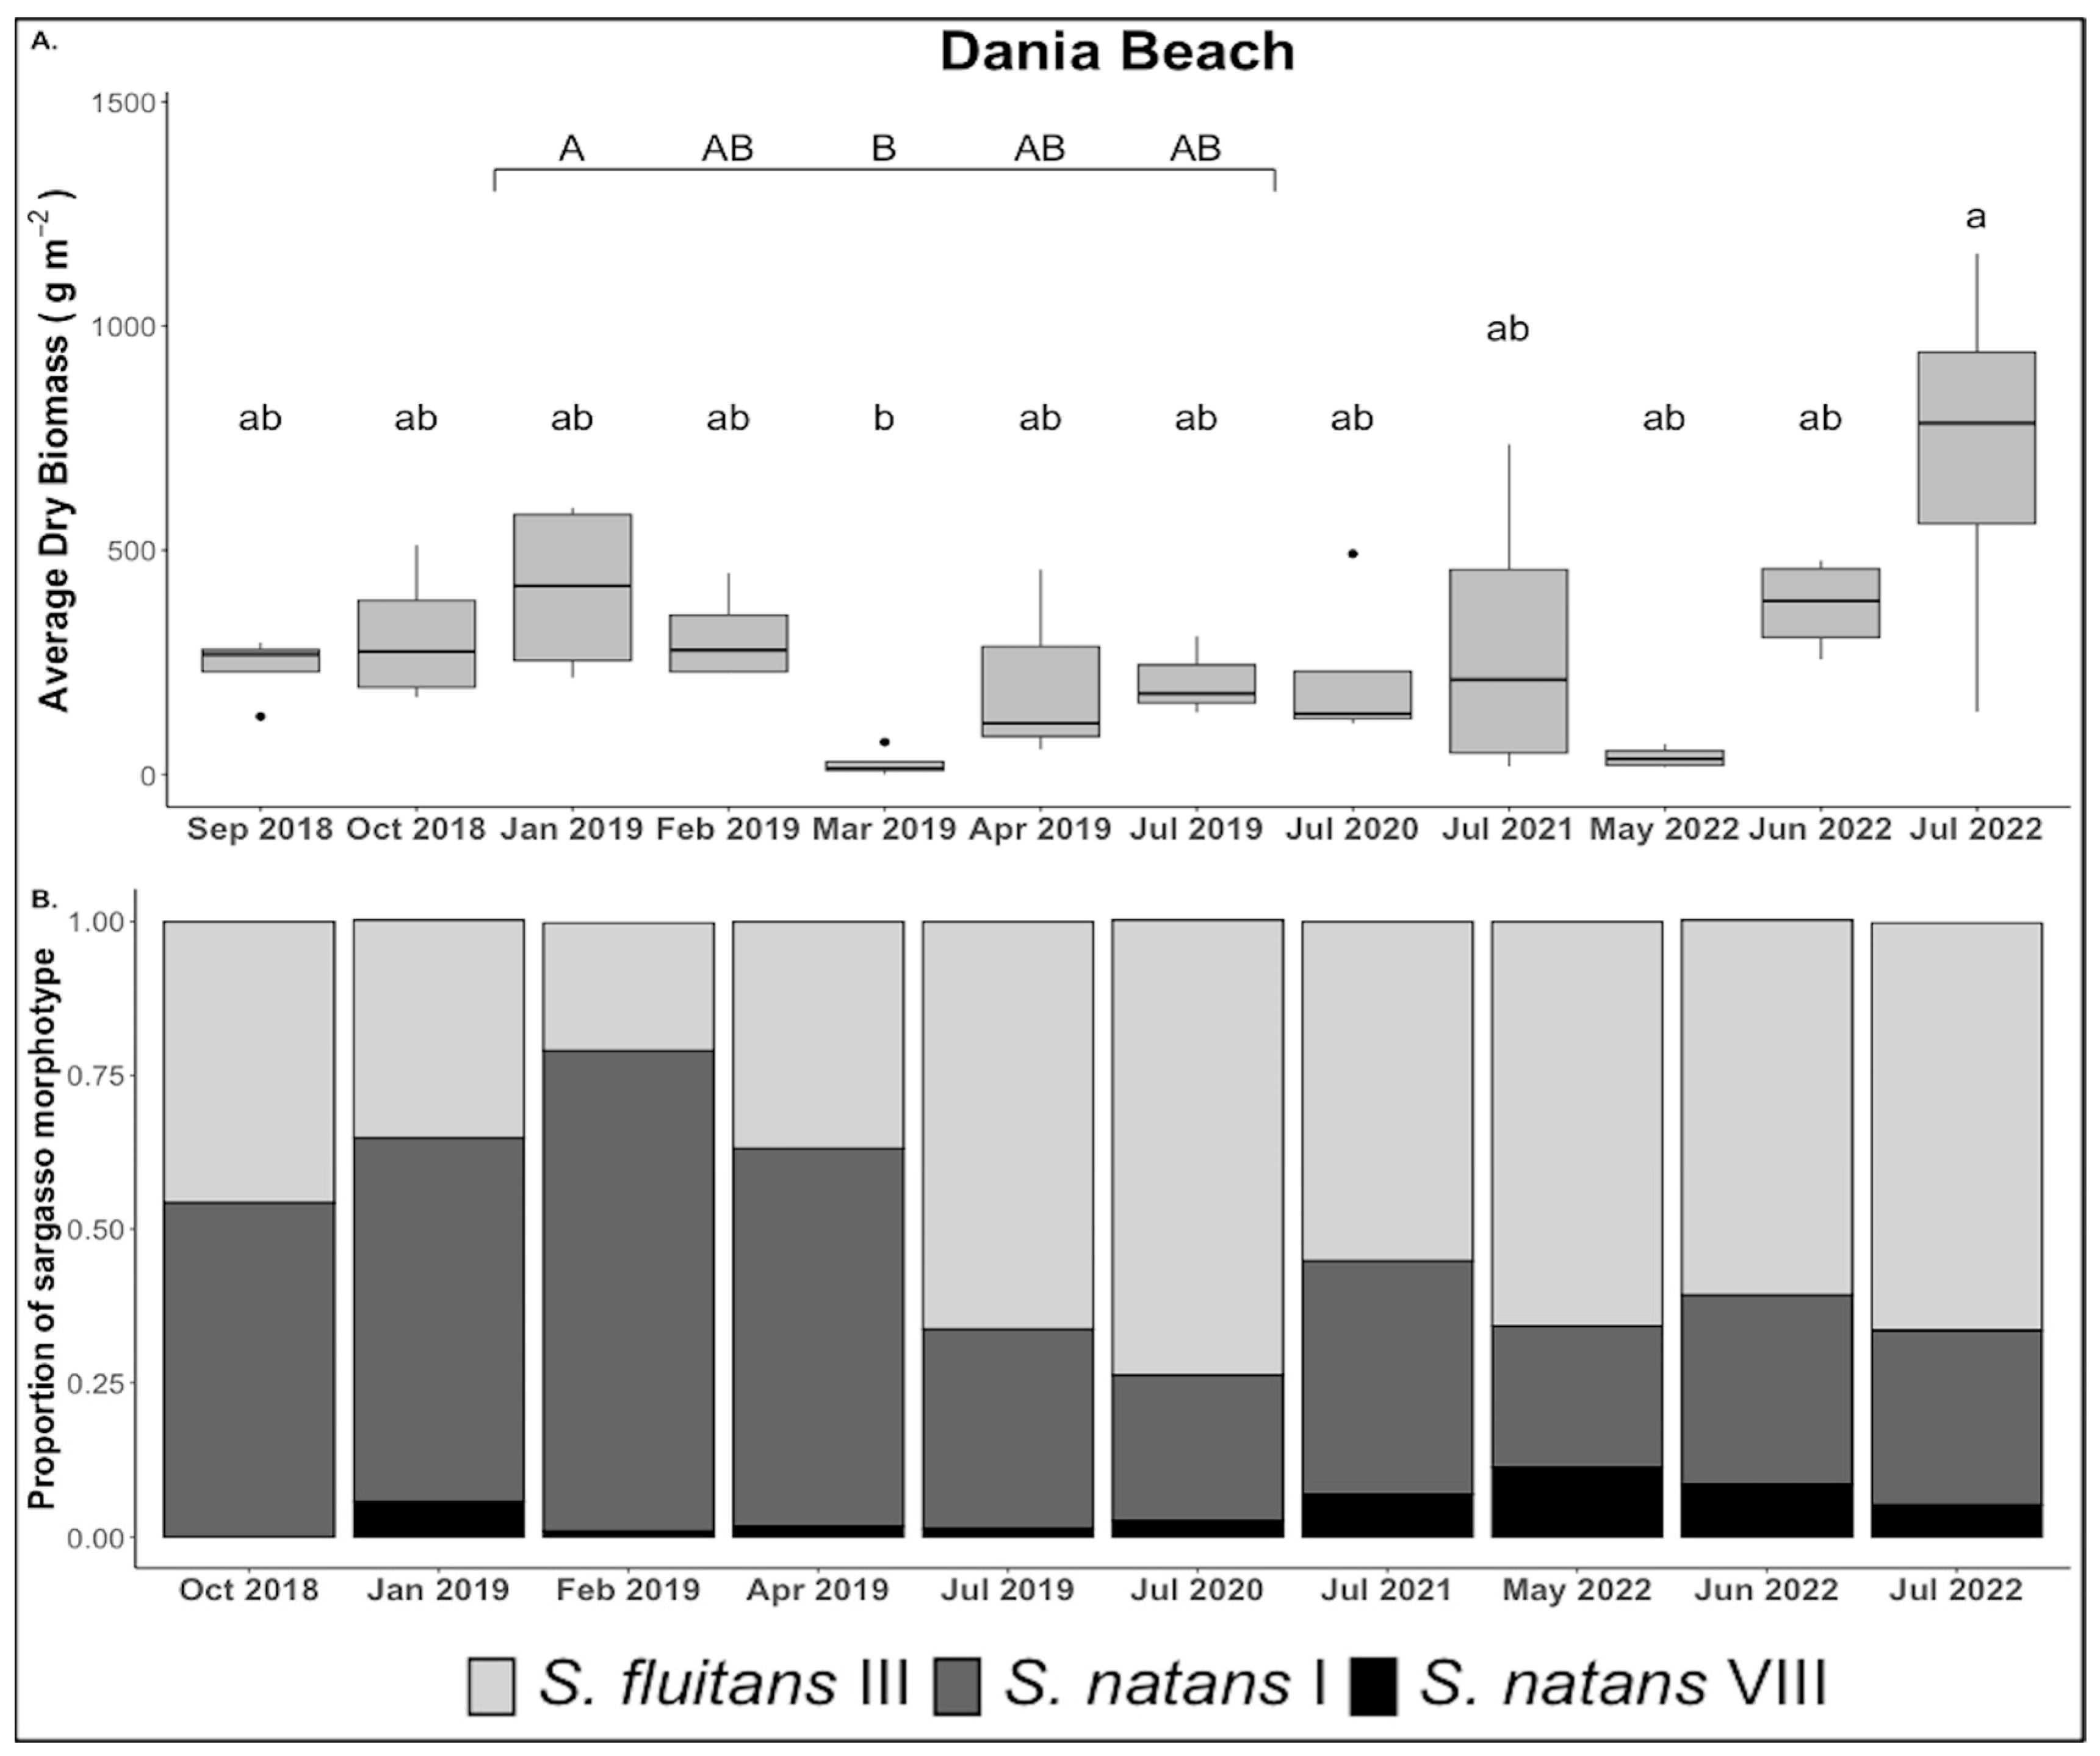
3.1. Biomass
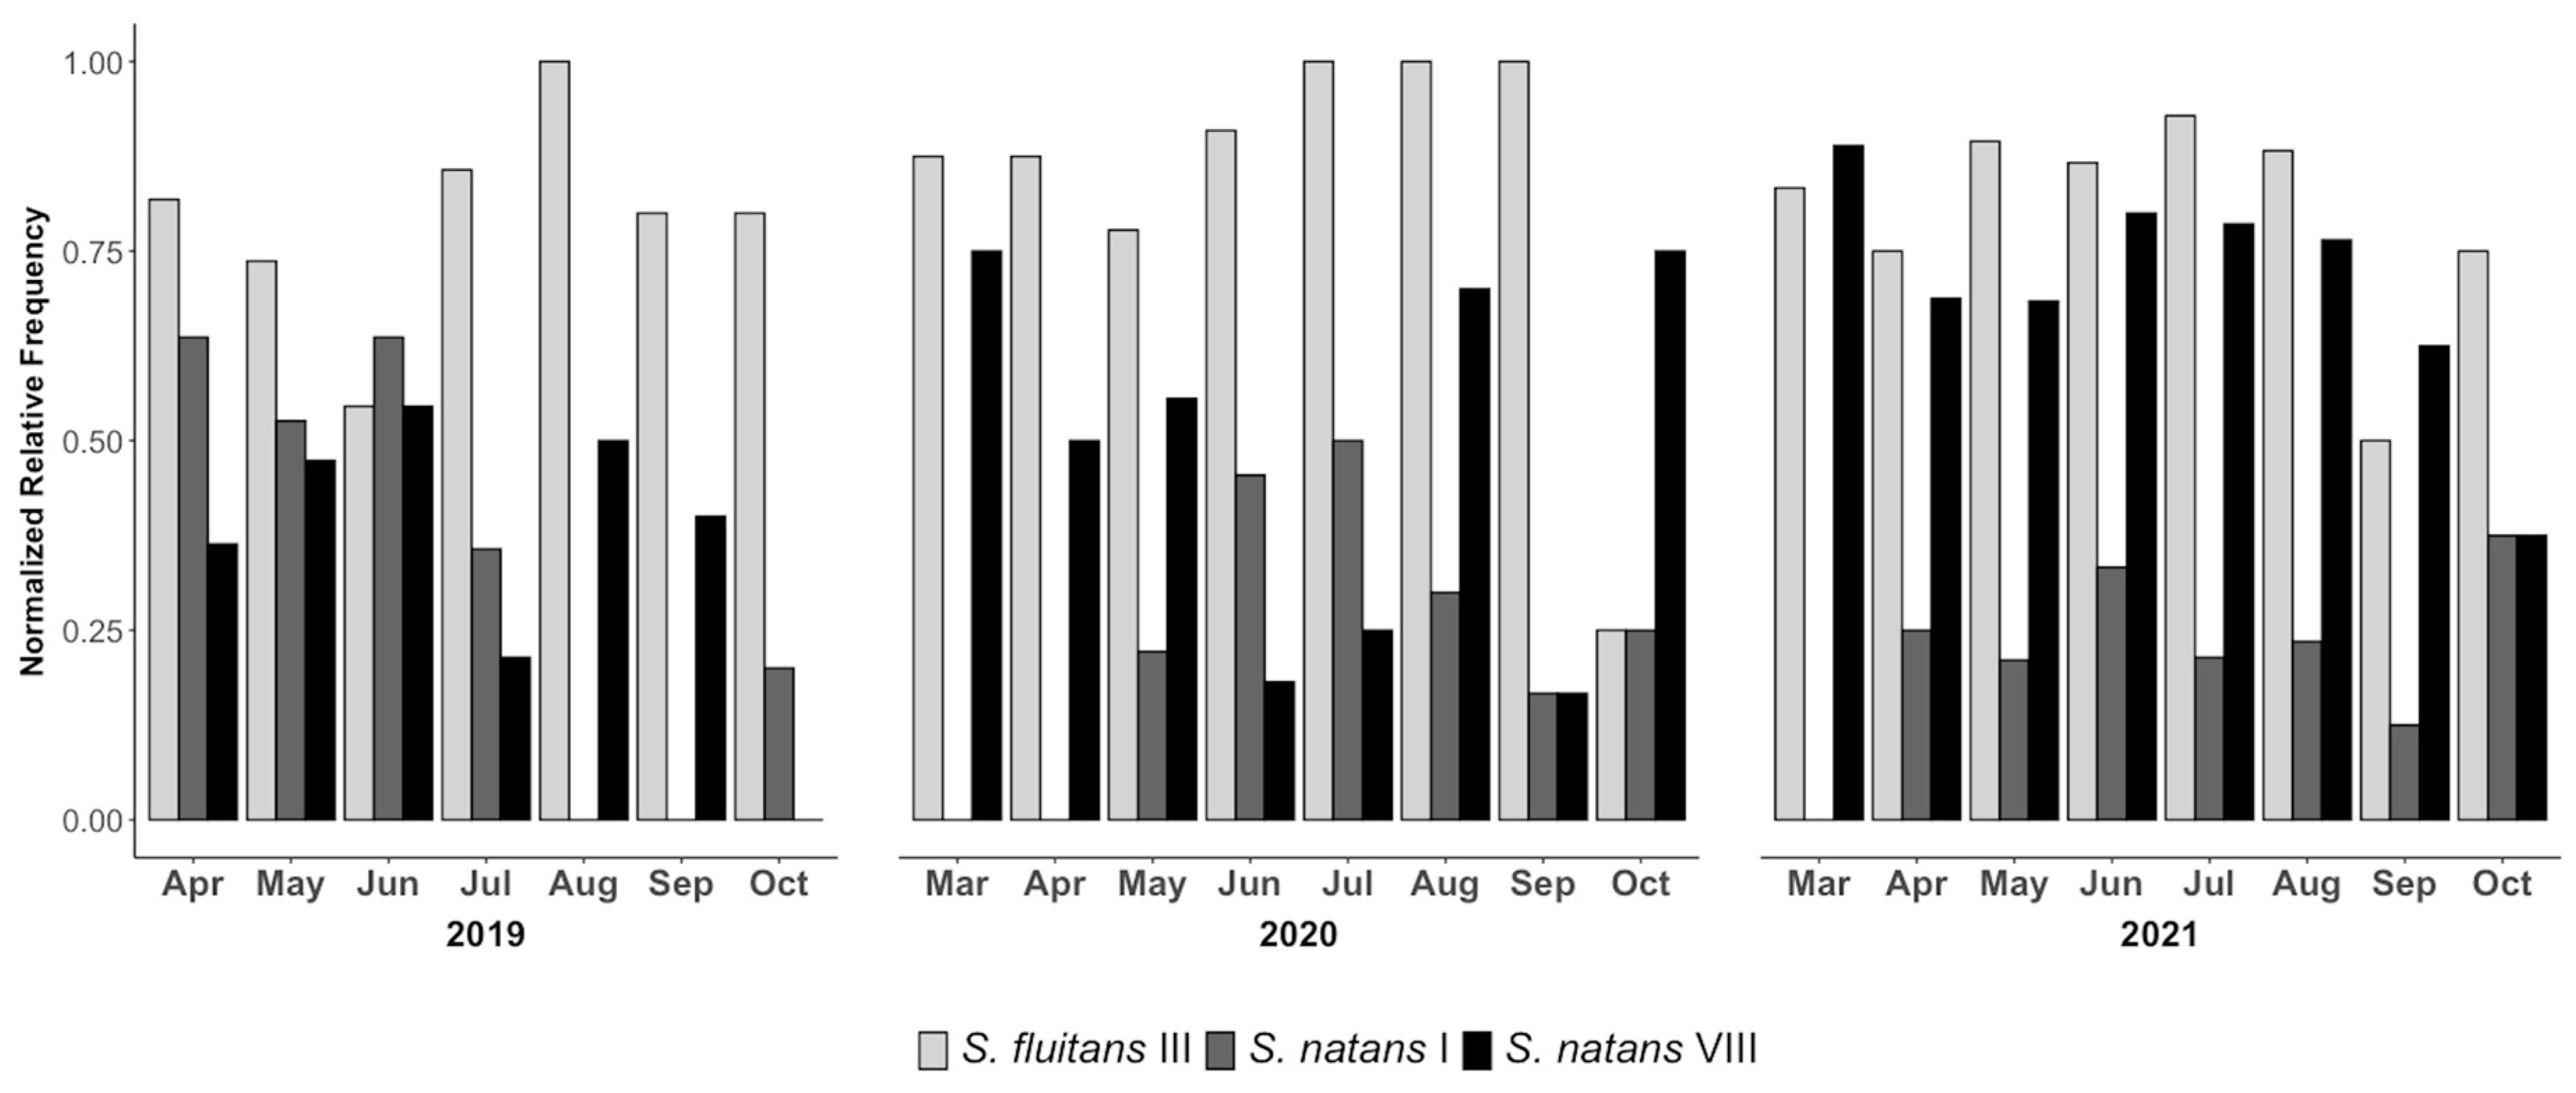
3.2. Volunteer-Contributed Monitoring of Morphotypes
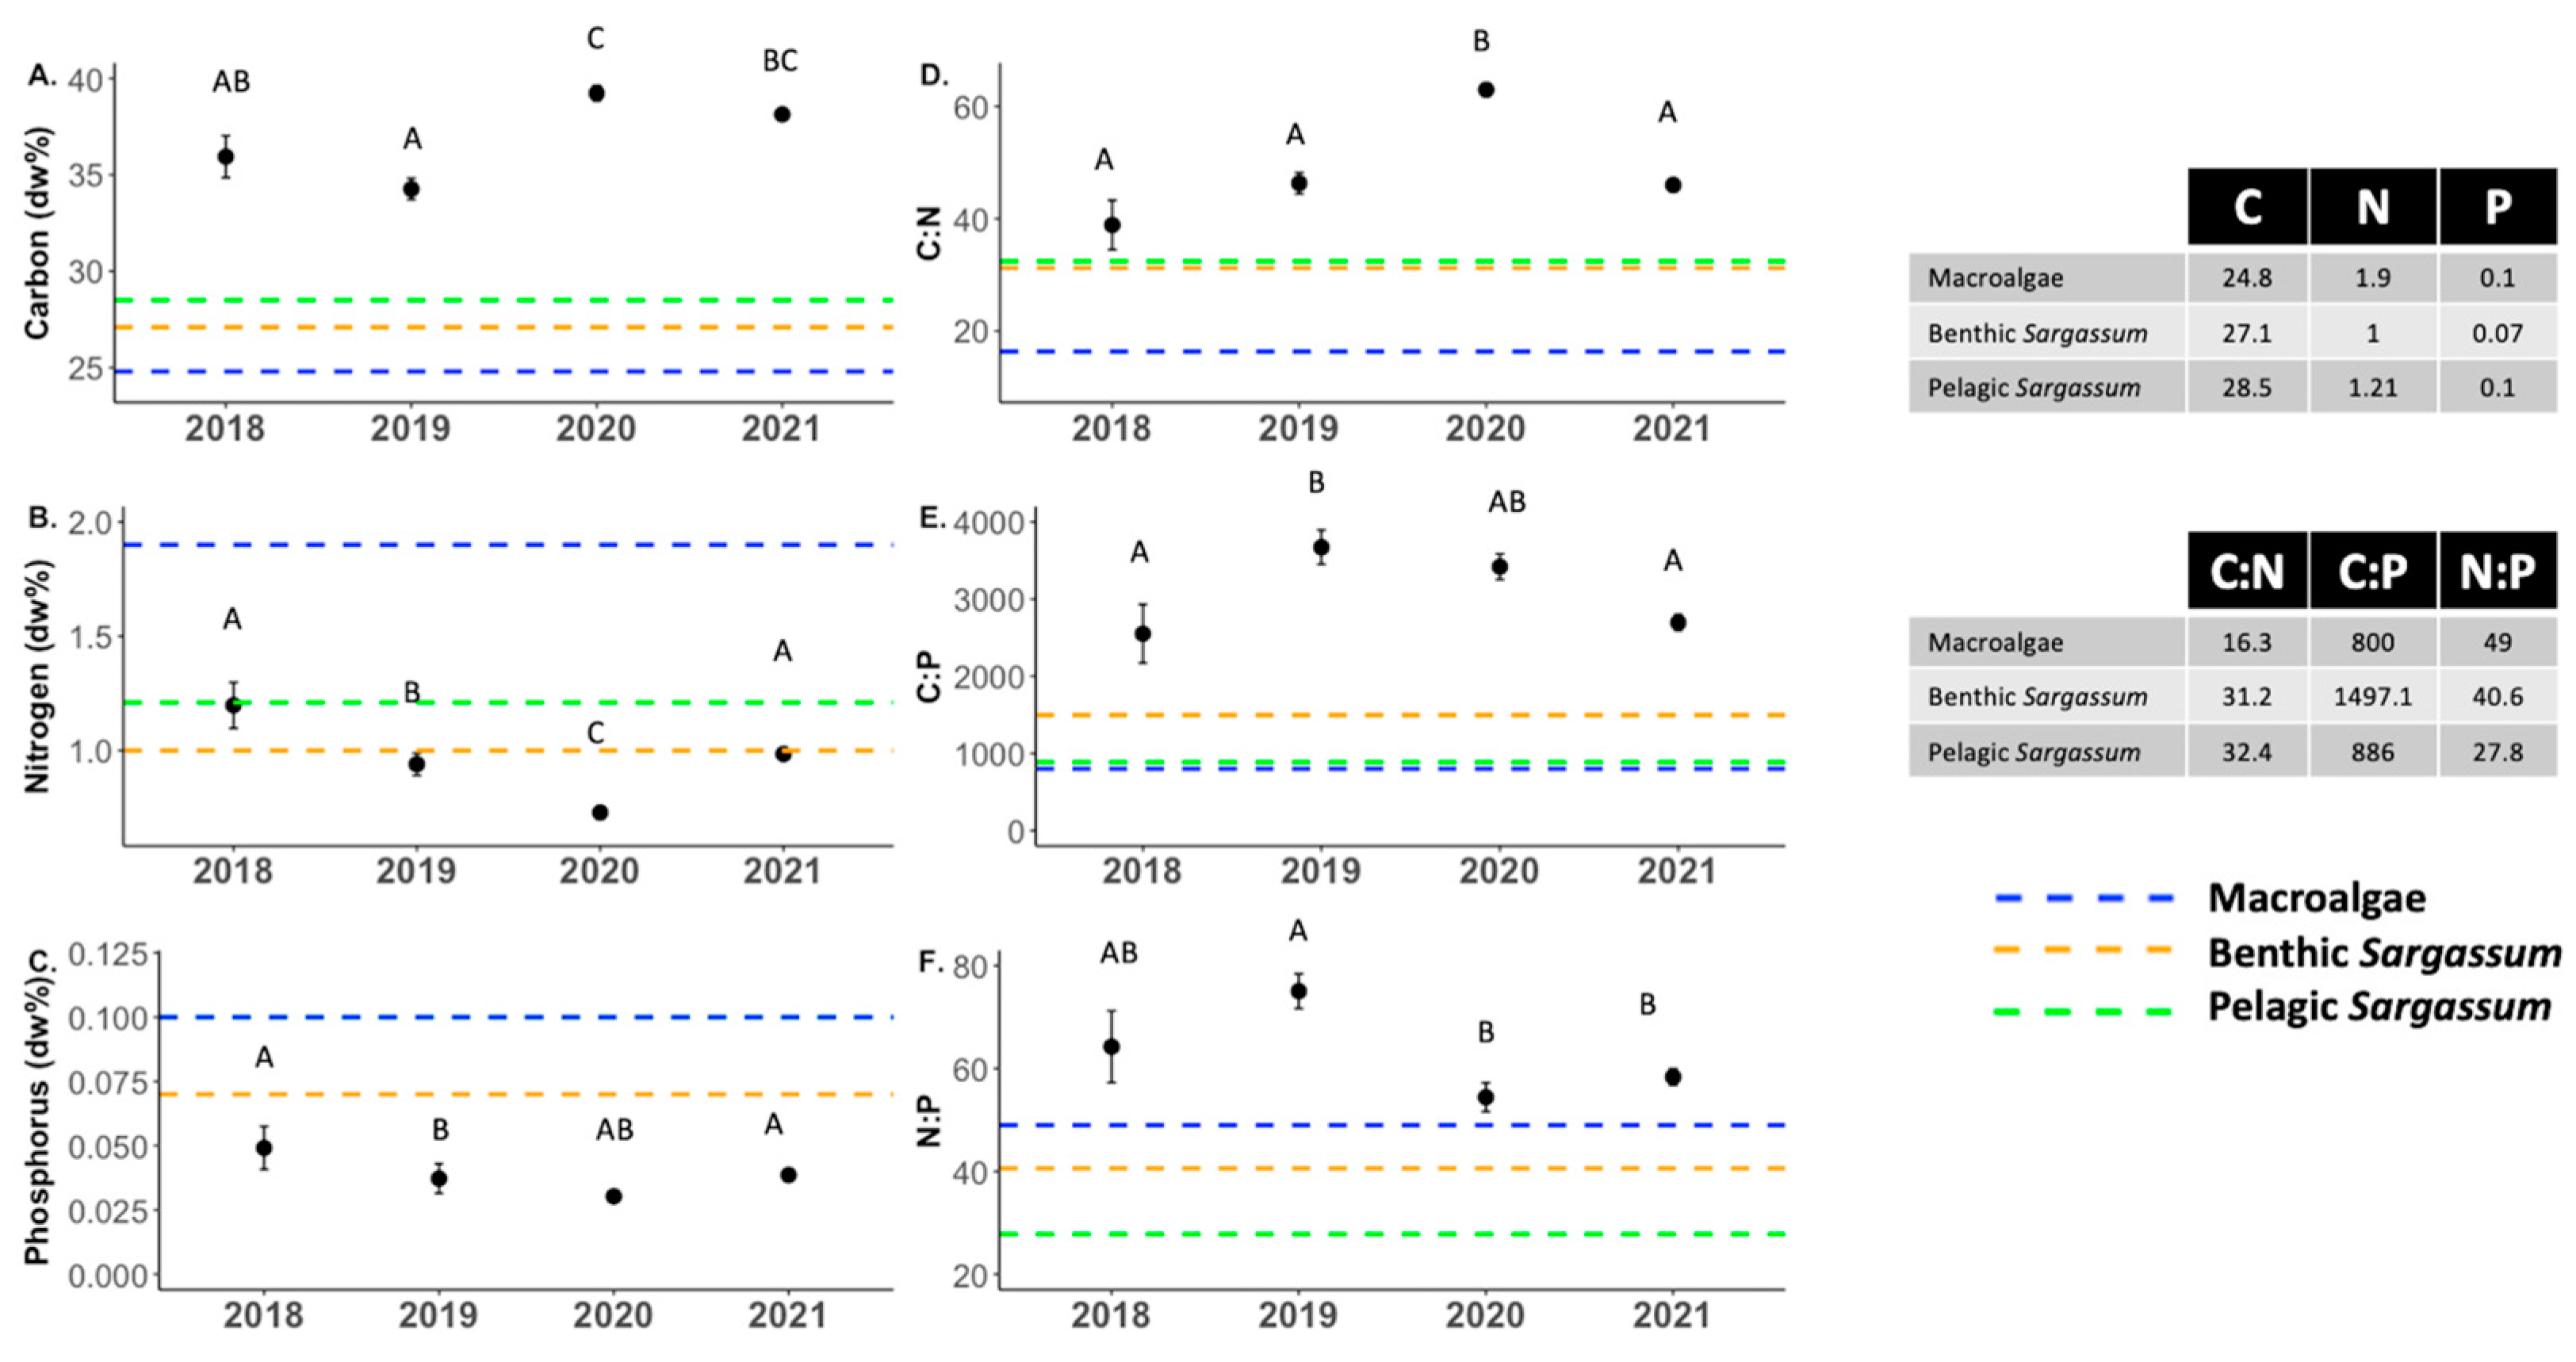
3.3. Nutrient Content
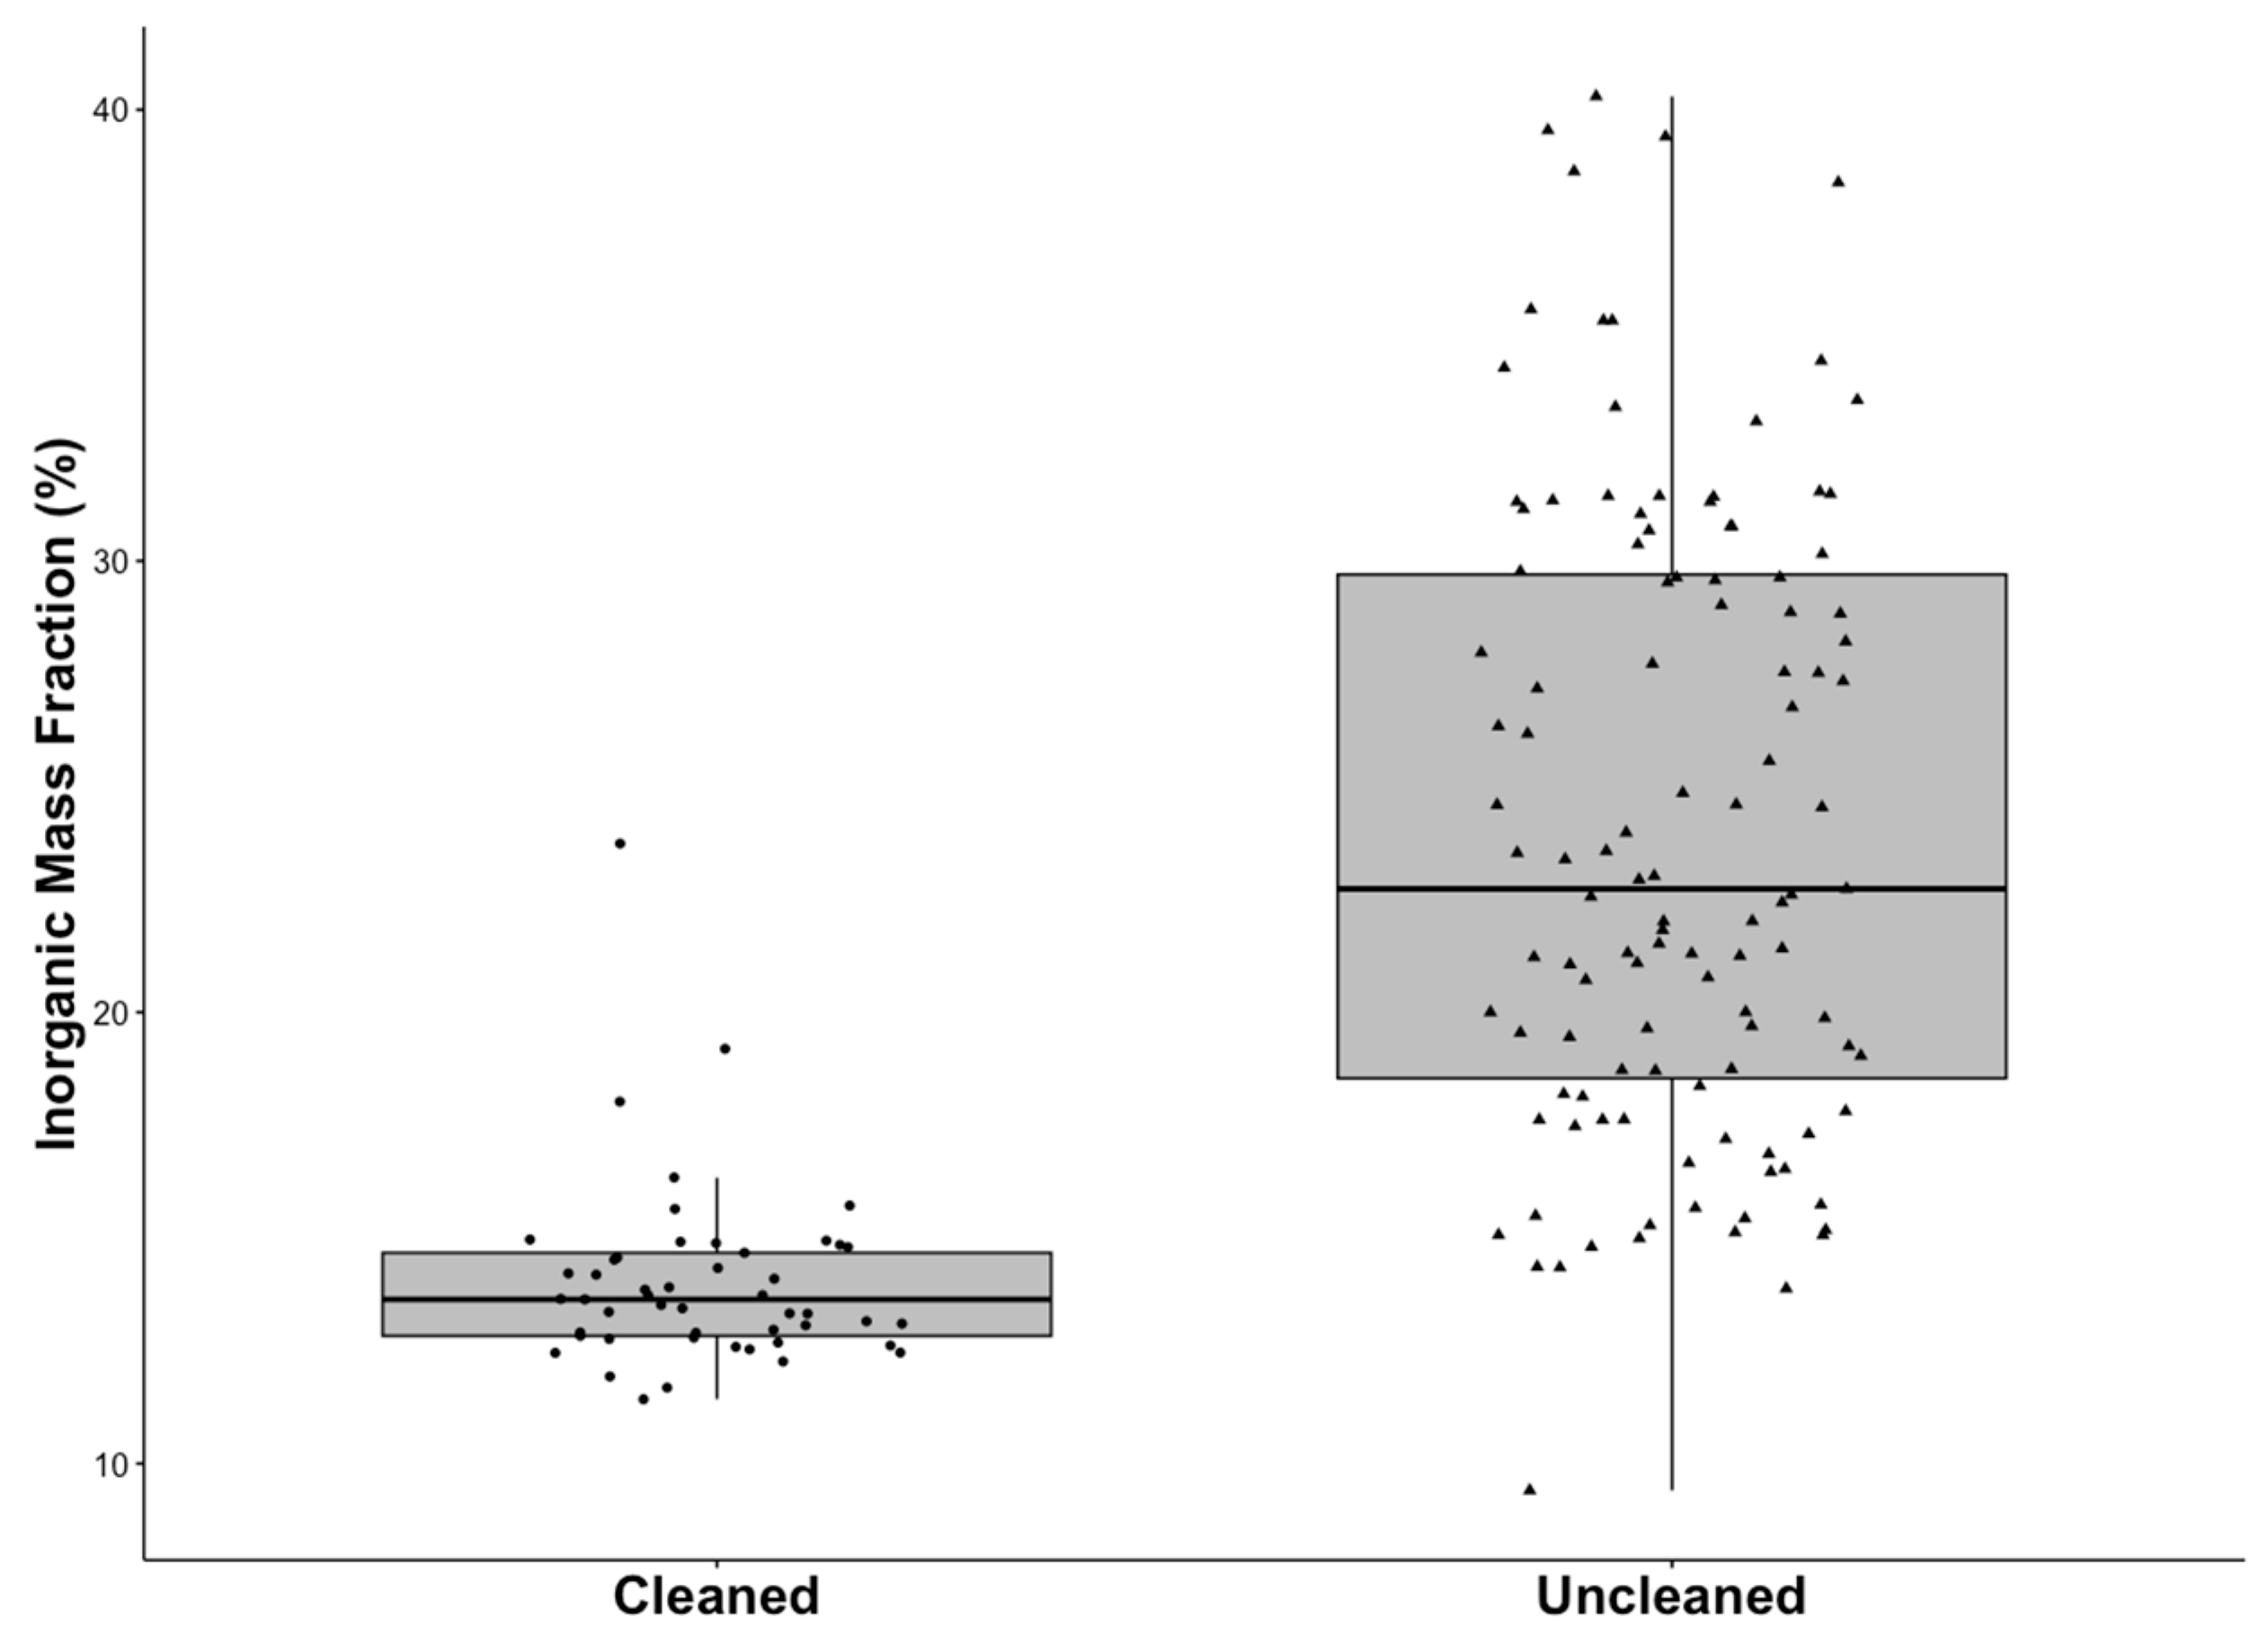
3.4. Organic versus Inorganic Mass Fraction
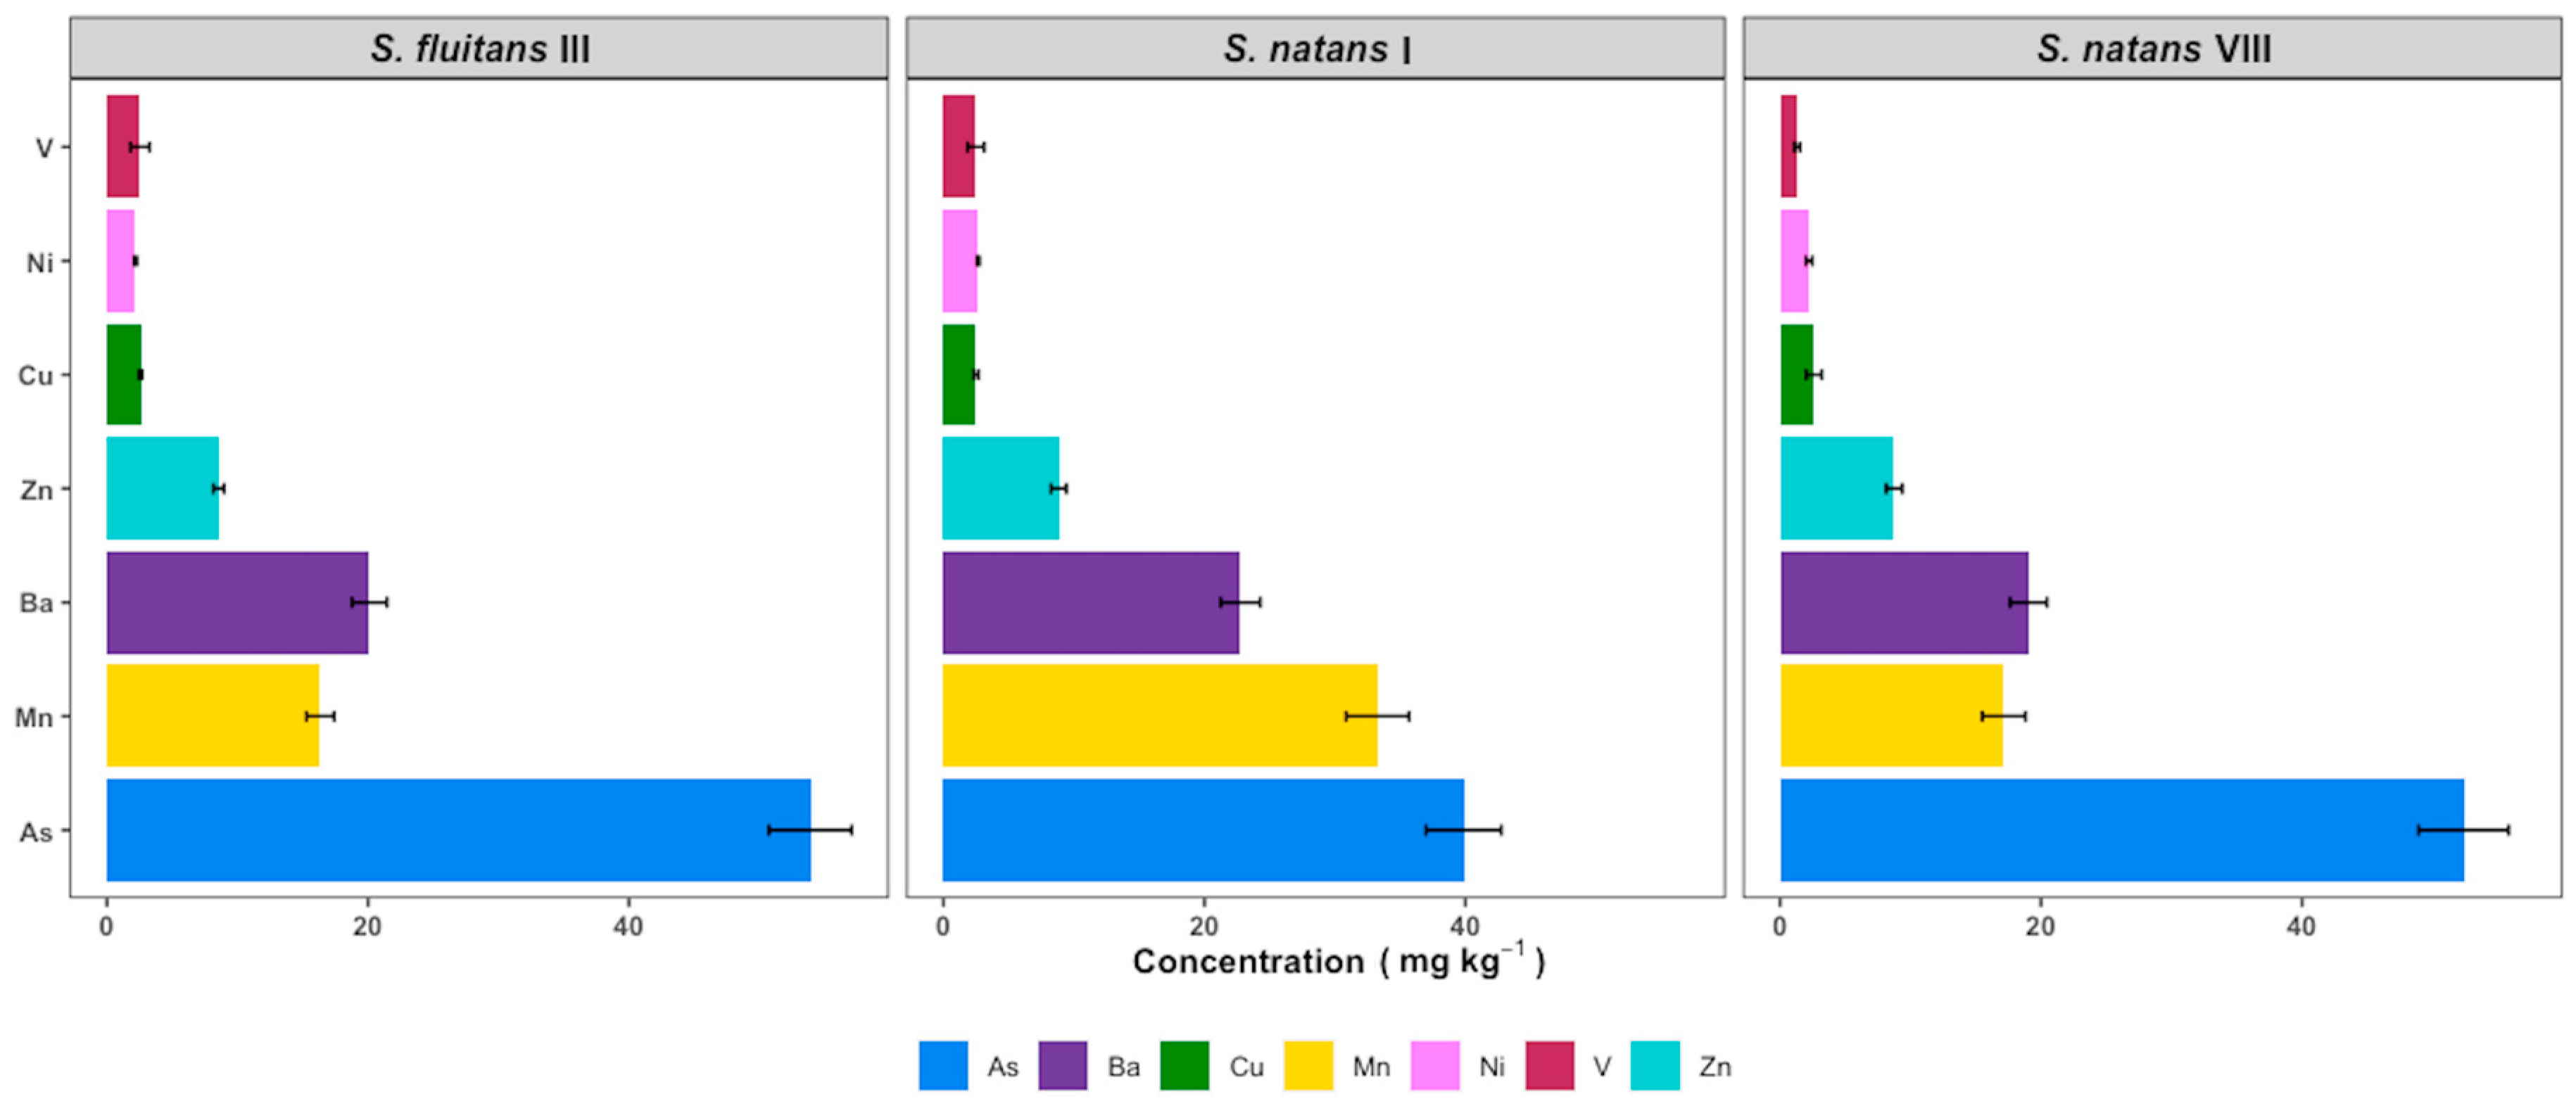
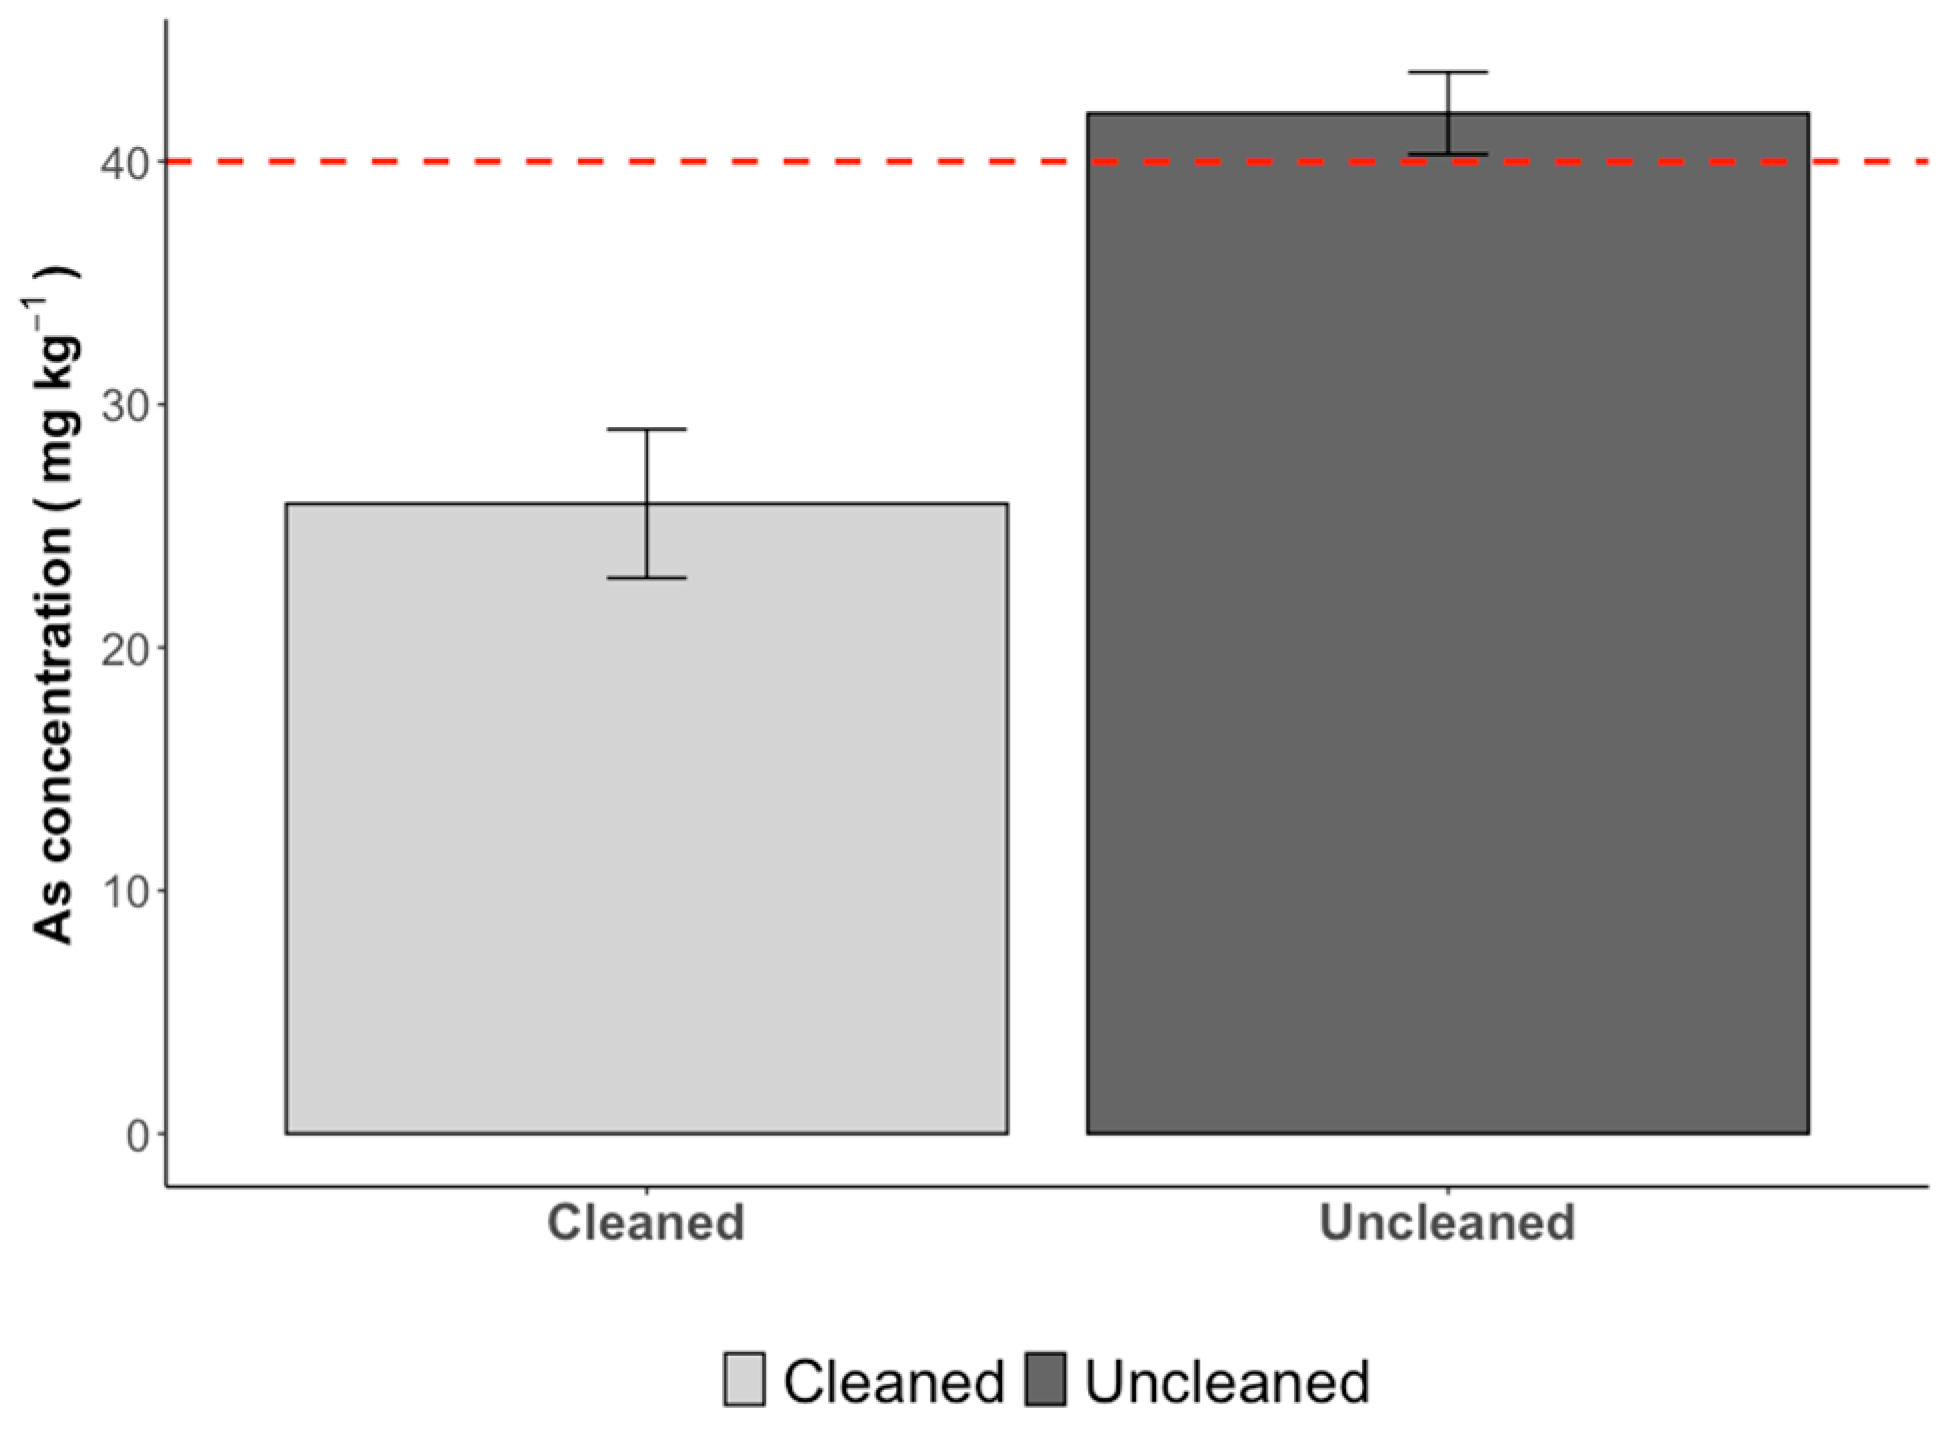
3.5. Heavy Metals
4. Discussion
5. Conclusions
Supplementary Materials
Author Contributions
Funding
Institutional Review Board Statement
Informed Consent Statement
Data Availability Statement
Acknowledgments
Conflicts of Interest
References
- Taxonomy Browser: AlgaeBase. Available online: https://www.algaebase.org/browse/taxonomy/#8389 (accessed on 23 July 2023).
- Zhuang, M.; Liu, J.; Ding, X.; He, J.; Zhao, S.; Wu, L.; Gao, S.; Zhao, C.; Liu, D.; Zhang, J.; et al. Sargassum Blooms in the East China Sea and Yellow Sea: Formation and Management. Mar. Pollut. Bull. 2021, 162, 111845. [Google Scholar] [CrossRef]
- Parr, A. Aide Quantitative Observations on the Pelagic Sargassum Vegetation of the Western North Atlantic. Bull. Bingham Oceanogr. Collect. 1939, 6, 1–94. [Google Scholar]
- Fidai, Y.A.; Dash, J.; Tompkins, E.L.; Tonon, T. A Systematic Review of Floating and Beach Landing Records of Sargassum beyond the Sargasso Sea. Environ. Res. Commun. 2020, 2, 122001. [Google Scholar] [CrossRef]
- Iporac, L.A.R.; James, W.R.; Collado-Vides, L. Characterizing Potential Resource Use of Sargasso-Dominant Sea Wrack by Terrestrial Invertebrate Fauna during Sargasso Influxes in South Florida. Estuar. Coast. Shelf Sci. 2023, 291, 108414. [Google Scholar] [CrossRef]
- Williams, A.; Feagin, R. Sargassum as a Natural Solution to Enhance Dune Plant Growth. Environ. Manag. 2010, 46, 738–747. [Google Scholar] [CrossRef] [PubMed]
- van Tussenbroek, B.I.; Hernández Arana, H.A.; Rodríguez-Martínez, R.E.; Espinoza-Avalos, J.; Canizales-Flores, H.M.; González-Godoy, C.E.; Barba-Santos, M.G.; Vega-Zepeda, A.; Collado-Vides, L. Severe Impacts of Brown Tides Caused by Sargassum spp. on near-Shore Caribbean Seagrass Communities. Mar. Pollut. Bull. 2017, 122, 272–281. [Google Scholar] [CrossRef]
- Olguin-Maciel, E.; Leal-Bautista, R.M.; Alzate-Gaviria, L.; Domínguez-Maldonado, J.; Tapia-Tussell, R. Environmental Impact of Sargassum spp. Landings: An Evaluation of Leachate Released from Natural Decomposition at Mexican Caribbean Coast. Environ. Sci. Pollut. Res. 2022, 29, 91071–91080. [Google Scholar] [CrossRef] [PubMed]
- Rodríguez-Muñoz, R.; Muñiz-Castillo, A.I.; Euán-Avila, J.I.; Hernández-Núñez, H.; Valdés-Lozano, D.S.; Collí-Dulá, R.C.; Arias-González, J.E. Assessing Temporal Dynamics on Pelagic Sargassum Influx and Its Relationship with Water Quality Parameters in the Mexican Caribbean. Reg. Stud. Mar. Sci. 2021, 48, 102005. [Google Scholar] [CrossRef]
- Oviatt, C.A.; Huizenga, K.; Rogers, C.S.; Miller, W.J. What Nutrient Sources Support Anomalous Growth and the Recent Sargassum Mass Stranding on Caribbean Beaches? A Review. Mar. Pollut. Bull. 2019, 145, 517–525. [Google Scholar] [CrossRef]
- Ackah-Baidoo, A. Fishing in Troubled Waters: Oil Production, Seaweed and Community-Level Grievances in the Western Region of Ghana. Commun. Dev. J. 2013, 48, 406–420. [Google Scholar] [CrossRef]
- Resiere, D.; Mehdaoui, H.; Florentin, J.; Gueye, P.; Lebrun, T.; Blateau, A.; Viguier, J.; Valentino, R.; Brouste, Y.; Kallel, H.; et al. Sargassum Seaweed Health Menace in the Caribbean: Clinical Characteristics of a Population Exposed to Hydrogen Sulfide during the 2018 Massive Stranding. Clin. Toxicol. 2021, 59, 215–223. [Google Scholar] [CrossRef] [PubMed]
- Rodríguez-Martínez, R.E.; Roy, P.D.; Torrescano-Valle, N.; Cabanillas-Terán, N.; Carrillo-Domínguez, S.; Collado-Vides, L.; García-Sánchez, M.; van Tussenbroek, B.I. Element Concentrations in Pelagic Sargassum along the Mexican Caribbean Coast in 2018–2019. PeerJ 2020, 8, e8667. [Google Scholar] [CrossRef] [PubMed]
- Baldwin, K.; Oxenford, H.A.; Weekes, J.; Small, M.; Irvine, J.; Desai, A. Sargassum Monitoring Protocol: Monitoring Sargassum Abundance Using Beach Surveys; SargAdapt Good Practice Guide Series; University of the West Indies, Centre for Resource Management and Environmental Studies (UWI-CERMES): Wanstead, Barbados, 2022; Volume 1. [Google Scholar]
- García-Sánchez, M.; Graham, C.; Vera, E.; Escalante-Mancera, E.; Álvarez-Filip, L.; Van Tussenbroek, B.I. Temporal Changes in the Composition and Biomass of Beached Pelagic Sargassum Species in the Mexican Caribbean. Aquat. Bot. 2020, 167, 103275. [Google Scholar] [CrossRef]
- Iporac, L.A.R.; Hatt, D.C.; Bally, N.K.; Castro, A.; Cardet, E.; Mesidor, R.; Olszak, S.; Duran, A.; Burkholder, D.A.; Collado-Vides, L. Community-Based Monitoring Reveals Spatiotemporal Variation of Sargasso Inundation Levels and Morphotype Dominance across the Caribbean and South Florida. Aquat. Bot. 2022, 182, 103546. [Google Scholar] [CrossRef]
- Gower, J.; Young, E.; King, S. Satellite Images Suggest a New Sargassum Source Region in 2011. Remote Sens. Lett. 2013, 4, 764–773. [Google Scholar] [CrossRef]
- Johns, E.M.; Lumpkin, R.; Putman, N.F.; Smith, R.H.; Muller-Karger, F.E.; Rueda-Roa, D.T.; Hu, C.; Wang, M.; Brooks, M.T.; Gramer, L.J.; et al. The Establishment of a Pelagic Sargassum Population in the Tropical Atlantic: Biological Consequences of a Basin-Scale Long Distance Dispersal Event. Prog. Oceanogr. 2020, 182, 102269. [Google Scholar] [CrossRef]
- Trinanes, J.; Putman, N.F.; Goni, G.; Hu, C.; Wang, M. Monitoring Pelagic Sargassum Inundation Potential for Coastal Communities. J. Oper. Oceanogr. 2023, 16, 48–59. [Google Scholar] [CrossRef]
- Putman, N.F.; Beyea, R.T.; Iporac, L.A.R.; Triñanes, J.; Ackerman, E.G.; Olascoaga, M.J.; Appendini, C.M.; Arriaga, J.; Collado-Vides, L.; Lumpkin, R.; et al. Improving Satellite Monitoring of Coastal Inundations of Pelagic Sargassum Algae with Wind and Citizen Science Data. Aquat. Bot. 2023, 188, 103672. [Google Scholar] [CrossRef]
- Lapointe, B.E.; Brewton, R.A.; Herren, L.W.; Wang, M.; Hu, C.; McGillicuddy, D.J.; Lindell, S.; Hernandez, F.J.; Morton, P.L. Nutrient Content and Stoichiometry of Pelagic Sargassum Reflects Increasing Nitrogen Availability in the Atlantic Basin. Nat. Commun. 2021, 12, 3060. [Google Scholar] [CrossRef]
- Alleyne, K.S.T.; Neat, F.; Oxenford, H.A. A Baseline Assessment of the Epiphytic Community Associated with Pelagic Sargassum in the Tropical Atlantic. Aquat. Bot. 2023, 186, 103635. [Google Scholar] [CrossRef]
- Wang, M.; Hu, C.; Barnes, B.B.; Mitchum, G.; Lapointe, B.; Montoya, J.P. The Great Atlantic Sargassum Belt. Science 2019, 365, 83–87. [Google Scholar] [CrossRef] [PubMed]
- Lapointe, B.E.; West, L.E.; Sutton, T.T.; Hu, C. Ryther Revisited: Nutrient Excretions by Fishes Enhance Productivity of Pelagic Sargassum in the Western North Atlantic Ocean. J. Exp. Mar. Biol. Ecol. 2014, 458, 46–56. [Google Scholar] [CrossRef]
- Lapointe, B.E. Phosphorus-Limited Photosynthesis and Growth of Sargassum natans and Sargassum fluitans (Phaeophyceae) in the Western North Atlantic. Deep Sea Res. Part Oceanogr. Res. Pap. 1986, 33, 391–399. [Google Scholar] [CrossRef]
- McGillicuddy, D.J.; Morton, P.L.; Brewton, R.A.; Hu, C.; Kelly, T.B.; Solow, A.R.; Lapointe, B.E. Nutrient and Arsenic Biogeochemistry of Sargassum in the Western Atlantic. Nat. Commun. 2023, 14, 6205. [Google Scholar] [CrossRef] [PubMed]
- Antonio-Martínez, F.; Henaut, Y.; Vega-Zepeda, A.; Cerón-Flores, A.I.; Raigoza-Figueras, R.; Cetz-Navarro, N.P.; Espinoza-Avalos, J. Leachate Effects of Pelagic Sargassum spp. on Larval Swimming Behavior of the Coral Acropora palmata. Sci. Rep. 2020, 10, 3910. [Google Scholar] [CrossRef] [PubMed]
- Sissini, M.N.; de Barros Barreto, M.B.B.; Széchy, M.T.M.; de Lucena, M.B.; Oliveira, M.C.; Gower, J.; Liu, G.; de Oliveira Bastos, E.; Milstein, D.; Gusmão, F.; et al. The Floating Sargassum (Phaeophyceae) of the South Atlantic Ocean—Likely Scenarios. Phycologia 2017, 56, 321–328. [Google Scholar] [CrossRef]
- Addico, G.N.D.; deGraft-Johnson, K.A.A. Preliminary Investigation into the Chemical Composition of the Invasive Brown Seaweed Sargassum along the West Coast of Ghana. Afr. J. Biotechnol. 2016, 15, 2184–2191. [Google Scholar] [CrossRef]
- Dassié, E.P.; Gourves, P.-Y.; Cipolloni, O.; Pascal, P.-Y.; Baudrimont, M. First Assessment of Atlantic Open Ocean Sargassum spp. Metal and Metalloid Concentrations. Environ. Sci. Pollut. Res. 2022, 29, 17606–17616. [Google Scholar] [CrossRef] [PubMed]
- Banerjee, M.; Banerjee, N.; Bhattacharjee, P.; Mondal, D.; Lythgoe, P.R.; Martínez, M.; Pan, J.; Polya, D.A.; Giri, A.K. High Arsenic in Rice Is Associated with Elevated Genotoxic Effects in Humans. Sci. Rep. 2013, 3, 2195. [Google Scholar] [CrossRef]
- Singh, N.; Kumar, D.; Sahu, A.P. Arsenic in the Environment: Effects on Human Health and Possible Prevention. J. Environ. Biol. 2007, 28, 359. [Google Scholar]
- Alleyne, K.S.T.; Neat, F.; Oxenford, H.A. An Analysis of Arsenic Concentrations Associated with Sargassum Influx Events in Barbados. Mar. Pollut. Bull. 2023, 192, 115064. [Google Scholar] [CrossRef] [PubMed]
- Huffard, C.L.; von Thun, S.; Sherman, A.D.; Sealey, K.; Smith, K.L. Pelagic Sargassum Community Change over a 40-Year Period: Temporal and Spatial Variability. Mar. Biol. 2014, 161, 2735–2751. [Google Scholar] [CrossRef] [PubMed]
- Carsey, T.P.; Stamates, S.J.; Featherstone, C.M.; Amornthammarong, N.; Bishop, J.R.; Brown, C.J.; Campbell, A.; Casanova, H.L.; Gidley, M.L.; Kosenko, M.; et al. Broward County Coastal Ocean Water Quality Study, 2010–2012. NOAA Technical Report, OAR, 44 AOML. 2015. Available online: https://repository.library.noaa.gov/view/noaa/11350 (accessed on 1 February 2024).
- Fiorentino, F.A.; Olascoaga, M.J.; Reiners, A. Analysis of Water Quality and Circulation of Four Recreational Miami Beaches through the Use of Lagrangian Coherent Structures. Mar. Pollut. Bull. 2014, 83, 181–189. [Google Scholar] [CrossRef] [PubMed]
- Biber, P.D. Hydrodynamic Transport of Drifting Macroalgae through a Tidal Cut. Estuar. Coast. Shelf Sci. 2007, 74, 565–569. [Google Scholar] [CrossRef]
- Torres-Conde, E.G.; van Tussenbroek, B.I.; Rodríguez-Martínez, R.E.; Martínez-Daranas, B. Temporal Changes in the Composition of Beached Holopelagic Sargassum spp. along the Northwestern Coast of Cuba. Phycology 2023, 3, 405–412. [Google Scholar] [CrossRef]
- Wrinn, C.; Schell, J.M.; Goodwin, D.S.; Siuda, A.N.S. Taxonomic Guide to Pelagic Sargassum in the Caribbean Sea and North Atlantic. In Proceedings of the of 69th GCFI, Grand Cayman, Cayman Islands, 10 November 2016. [Google Scholar]
- Gohil, R.; Sharma, S.; Sachdeva, S.; Gupta, S.; Dhillon, M.S. Epicollect5: A Free, Fully Customizable Mobile-Based Application for Data Collection in Clinical Research. J. Postgrad. Med. Educ. Res. 2021, 54, 248–251. [Google Scholar] [CrossRef]
- Solórzano, L.; Sharp, J.H. Determination of Total Dissolved Phosphorus and Particulate Phosphorus in Natural Waters1. Limnol. Oceanogr. 1980, 25, 754–758. [Google Scholar] [CrossRef]
- Fourqurean, J.; Johnson, B.; Kauffman, J.B.; Kennedy, H.; Lovelock, C.; Alongi, D.M.; Cifuentes, M.; Copertino, M.; Crooks, S.; Duarte, C.; et al. Field Sampling of Soil Carbon Pools in Coastal Ecosystems. In Coastal Blue Carbon: Methods for Assessing Carbon Stocks and Emissions Factors in Mangroves, Tidal Salt Marshes, and Seagrasses Meadows; Center for International Forestry Research (CIFOR): Bogor, Indonesia, 2015; pp. 39–66. [Google Scholar]
- R Core Team. R: A Language and Environment for Statistical Computing; R Core Team: Vienna, Austria, 2023. [Google Scholar]
- Duarte, C.M. Nutrient Concentration of Aquatic Plants: Patterns across Species. Limnol. Oceanogr. 1992, 37, 882–889. [Google Scholar] [CrossRef]
- De Wreede, R.E. Growth in Varying Culture Conditions of Embryos of Three Hawaiian Species of Sargassum (Phaeophyta, Sargassaceae). Phycologia 1978, 17, 23–31. [Google Scholar] [CrossRef]
- Lapointe, B.E.; Thacker, K.; Hanson, C.; Getten, L. Sewage Pollution in Negril, Jamaica: Effects on Nutrition and Ecology of Coral Reef Macroalgae. Chin. J. Oceanol. Limnol. 2011, 29, 775–789. [Google Scholar] [CrossRef]
- Lapointe, B.E.; Littler, M.M.; Littler, D.S. Nutrient Availability to Marine Macroalgae in Siliciclastic versus Carbonate-Rich Coastal Waters. Estuaries 1992, 15, 75. [Google Scholar] [CrossRef]
- European Union. Commission Regulation (EU) 2019/1869 of 7 2019 Amending and Correcting Annex I to Directive 2002/32/EC of the European Parliament and of the Council as Regards Maximum Levels for Certain Undesirable Substances in Animal Feed; European Union: Brussels, Belgium, 2019. [Google Scholar]
- Andrade-Canto, F.; Beron-Vera, F.J.; Goni, G.J.; Karrasch, D.; Olascoaga, M.J.; Trinanes, J. Carriers of Sargassum and Mechanism for Coastal Inundation in the Caribbean Sea. Phys. Fluids 2022, 34, 016602. [Google Scholar] [CrossRef]
- Skliris, N.; Marsh, R.; Appeaning Addo, K.; Oxenford, H. Physical Drivers of Pelagic Sargassum Bloom Interannual Variability in the Central West Atlantic over 2010–2020. Ocean Dyn. 2022, 72, 383–404. [Google Scholar] [CrossRef]
- Machado, C.B.; Maddix, G.-M.; Francis, P.; Thomas, S.-L.; Burton, J.-A.; Langer, S.; Larson, T.R.; Marsh, R.; Webber, M.; Tonon, T. Pelagic Sargassum Events in Jamaica: Provenance, Morphotype Abundance, and Influence of Sample Processing on Biochemical Composition of the Biomass. Sci. Total Environ. 2022, 817, 152761. [Google Scholar] [CrossRef] [PubMed]
- Alleyne, K.S.T.; Johnson, D.; Neat, F.; Oxenford, H.A.; Vallѐs, H. Seasonal Variation in Morphotype Composition of Pelagic Sargassum Influx Events Is Linked to Oceanic Origin. Sci. Rep. 2023, 13, 3753. [Google Scholar] [CrossRef]
- Dibner, S.; Martin, L.; Thibaut, T.; Aurelle, D.; Blanfuné, A.; Whittaker, K.; Cooney, L.; Schell, J.M.; Goodwin, D.S.; Siuda, A.N.S. Consistent Genetic Divergence Observed among Pelagic Sargassum Morphotypes in the Western North Atlantic. Mar. Ecol. 2022, 43, e12691. [Google Scholar] [CrossRef]
- Magaña-Gallegos, E.; García-Sánchez, M.; Graham, C.; Olivos-Ortiz, A.; Siuda, A.N.S.; van Tussenbroek, B.I. Growth Rates of Pelagic Sargassum Species in the Mexican Caribbean. Aquat. Bot. 2023, 185, 103614. [Google Scholar] [CrossRef]
- Changeux, T.; Berline, L.; Podlejski, W.; Guillot, T.; Stiger-Pouvreau, V.; Connan, S.; Thibaut, T. Variability in Growth and Tissue Composition (CNP, Natural Isotopes) of the Three Morphotypes of Holopelagic Sargassum. Aquat. Bot. 2023, 187, 103644. [Google Scholar] [CrossRef]
- Vázquez-Delfín, E.; Freile-Pelegrín, Y.; Salazar-Garibay, A.; Serviere-Zaragoza, E.; Méndez-Rodríguez, L.C.; Robledo, D. Species Composition and Chemical Characterization of Sargassum Influx at Six Different Locations along the Mexican Caribbean Coast. Sci. Total Environ. 2021, 795, 148852. [Google Scholar] [CrossRef]
- Handayani, T.; Zulpikar, F.; Kusnadi, A. The Roles of Macroalgae in Climate Change Mitigation: Opportunities and Challenges for Marine-Based Carbon Donor. IOP Conf. Ser. Earth Environ. Sci. 2022, 1119, 012014. [Google Scholar] [CrossRef]
- Fourest, E.; Volesky, B. Alginate Properties and Heavy Metal Biosorption by Marine Algae. Appl. Biochem. Biotechnol. 1997, 67, 215–226. [Google Scholar] [CrossRef]
- Amador-Castro, F.; García-Cayuela, T.; Alper, H.S.; Rodriguez-Martinez, V.; Carrillo-Nieves, D. Valorization of Pelagic Sargassum Biomass into Sustainable Applications: Current Trends and Challenges. J. Environ. Manag. 2021, 283, 112013. [Google Scholar] [CrossRef] [PubMed]
- López Miranda, J.L.; Celis, L.B.; Estévez, M.; Chávez, V.; van Tussenbroek, B.I.; Uribe-Martínez, A.; Cuevas, E.; Rosillo Pantoja, I.; Masia, L.; Cauich-Kantun, C.; et al. Commercial Potential of Pelagic Sargassum spp. in Mexico. Front. Mar. Sci. 2021, 8, 768470. [Google Scholar] [CrossRef]
- Salter, M.A.; Rodríguez-Martínez, R.E.; Álvarez-Filip, L.; Jordán-Dahlgren, E.; Perry, C.T. Pelagic Sargassum as an Emerging Vector of High Rate Carbonate Sediment Import to Tropical Atlantic Coastlines. Glob. Planet. Chang. 2020, 195, 103332. [Google Scholar] [CrossRef]
- Hatt, D.C.; Collado-Vides, L. A Comparative Analysis of the Organic and Inorganic Carbon Content of Halimeda and Penicillus (Chlorophyta, Bryopsidales) in a Coastal Subtropical Lagoon. Bot. Mar. 2019, 62, 323–326. [Google Scholar] [CrossRef]
- Schubert, N.; Alvarez-Filip, L.; Hofmann, L.C. Systematic Review and Meta-Analysis of Ocean Acidification Effects in Halimeda: Implications for Algal Carbonate Production. Clim. Chang. Ecol. 2023, 4, 100059. [Google Scholar] [CrossRef]
- Paraguay-Delgado, F.; Carreño-Gallardo, C.; Estrada-Guel, I.; Zabala-Arceo, A.; Martinez-Rodriguez, H.A.; Lardizábal-Gutierrez, D. Pelagic Sargassum spp. Capture CO2 and Produce Calcite. Environ. Sci. Pollut. Res. 2020, 27, 25794–25800. [Google Scholar] [CrossRef] [PubMed]
- Milledge, J.J.; Maneein, S.; Arribas López, E.; Bartlett, D. Sargassum Inundations in Turks and Caicos: Methane Potential and Proximate, Ultimate, Lipid, Amino Acid, Metal and Metalloid Analyses. Energies 2020, 13, 1523. [Google Scholar] [CrossRef]
- Tonon, T.; Machado, C.B.; Webber, M.; Webber, D.; Smith, J.; Pilsbury, A.; Cicéron, F.; Herrera-Rodriguez, L.; Jimenez, E.M.; Suarez, J.V.; et al. Biochemical and Elemental Composition of Pelagic Sargassum Biomass Harvested across the Caribbean. Phycology 2022, 2, 204–215. [Google Scholar] [CrossRef]
- Cipolloni, O.-A.; Gigault, J.; Dassié, É.P.; Baudrimont, M.; Gourves, P.-Y.; Amaral-Zettler, L.; Pascal, P.-Y. Metals and Metalloids Concentrations in Three Genotypes of Pelagic Sargassum from the Atlantic Ocean Basin-Scale. Mar. Pollut. Bull. 2022, 178, 113564. [Google Scholar] [CrossRef]
- Ortega-Flores, P.A.; Serviere-Zaragoza, E.; De Anda-Montañez, J.A.; Freile-Pelegrín, Y.; Robledo, D.; Méndez-Rodríguez, L.C. Trace Elements in Pelagic Sargassum Species in the Mexican Caribbean: Identification of Key Variables Affecting Arsenic Accumulation in S. fluitans. Sci. Total Environ. 2022, 806, 150657. [Google Scholar] [CrossRef] [PubMed]
- Davis, D.; Simister, R.; Campbell, S.; Marston, M.; Bose, S.; McQueen-Mason, S.J.; Gomez, L.D.; Gallimore, W.A.; Tonon, T. Biomass Composition of the Golden Tide Pelagic Seaweeds Sargassum fluitans and S. natans (Morphotypes I and VIII) to Inform Valorisation Pathways. Sci. Total Environ. 2021, 762, 143134. [Google Scholar] [CrossRef] [PubMed]
- Gobert, T.; Gautier, A.; Connan, S.; Rouget, M.-L.; Thibaut, T.; Stiger-Pouvreau, V.; Waeles, M. Trace Metal Content from Holopelagic Sargassum spp. Sampled in the Tropical North Atlantic Ocean: Emphasis on Spatial Variation of Arsenic and Phosphorus. Chemosphere 2022, 308, 136186. [Google Scholar] [CrossRef] [PubMed]


| Element | Limit of Detection (LOD) | (a) S. fluitans III | (b) S. natans I | (c) S. natans VIII | p-Value | Multiple Comparison Test |
|---|---|---|---|---|---|---|
| Ag | 0.01 | ND | 0.47 | 0.06 | 0.0243 | b > c |
| (0.5–0.5) | (<LOD–0.1) | |||||
| As | 0.25 | 53.90 | 39.86 | 52.38 | 0.0047 | (a=c) > b |
| (28.8–80.1) | (15.1–59.0) | (34.9–83.4) | ||||
| Ba | 0.30 | 20.11 | 22.75 | 19.04 | 0.177 | |
| (14.7–34.4) | (32.7–42.6) | (9.8–33.6) | ||||
| Be | 0.03 | 0.00 | 0.00 | 0.00 | 0.1990 | |
| (<LOD) | (<LOD) | (<LOD) | ||||
| Cd | 0.00 | 0.43 | 0.50 | 0.34 | <0.001 | (a=b) > c |
| (0.3–0.6) | (0.3–0.8) | (0.3–0.5) | ||||
| Co | 0.01 | 0.60 | 0.66 | 0.41 | <0.001 | (a=b) > c |
| (0.5–0.8) | (0.5–0.9) | (0.3–0.7) | ||||
| Cr | 1.37 | 0.40 | 0.50 | 0.47 | 0.7160 | |
| (0.1–0.9) | (<LOD–1.5) | (<LOD–2.9) | ||||
| Cu | 0.23 | 2.58 | 2.51 | 2.60 | 0.9850 | |
| (<LOD–3.6) | (1.2–4.3) | (1.0–14.4) | ||||
| Hg | 0.07 | 0.00 | 0.01 | 0.00 | 0.644 | |
| (<LOD) | (<LOD) | (<LOD) | ||||
| Mn | 0.14 | 16.36 | 33.28 | 17.16 | <0.001 | b > c > a |
| (9.9–25.3) | (16.2–53.0) | (7.1–30.8) | ||||
| Mo | 0.11 | 0.14 | 0.19 | 0.12 | <0.001 | b > (a = c) |
| (0.1–0.3) | (0.1–0.4) | (0.1–0.2) | ||||
| Ni | 0.09 | 2.17 | 2.65 | 2.23 | 0.0991 | |
| (1.3–3.2) | (1.8–3.6) | (0.8–5.4) | ||||
| Pb | 0.19 | 0.19 | 0.26 | 0.24 | 0.266 | |
| (0.1–0.4) | (0.1–0.5) | (0.1–1.1) | ||||
| Se | 0.09 | 0.74 | 0.83 | 0.55 | <0.001 | (a = b) > c |
| (<LOD–1.2) | (0.5–1.1) | (0.2–0.9) | ||||
| V | 1.08 | 2.54 | 2.47 | 1.33 | 0.2830 | |
| (<LOD–13.6) | (0.7–11.2) | (<LOD–4.5) | ||||
| Zn | 0.63 | 8.56 | 8.83 | 8.75 | 0.9360 | |
| (5.5–12.0) | (4.6–14.8) | (4.2–15.5) |
Disclaimer/Publisher’s Note: The statements, opinions and data contained in all publications are solely those of the individual author(s) and contributor(s) and not of MDPI and/or the editor(s). MDPI and/or the editor(s) disclaim responsibility for any injury to people or property resulting from any ideas, methods, instructions or products referred to in the content. |
© 2024 by the authors. Licensee MDPI, Basel, Switzerland. This article is an open access article distributed under the terms and conditions of the Creative Commons Attribution (CC BY) license (https://creativecommons.org/licenses/by/4.0/).
Share and Cite
Hatt, D.C.; Bally, N.K.; Iporac, L.A.R.; Olszak, S.; Campbell, J.E.; Collado-Vides, L. Comprehensive Analysis of Biomass, Nutrient, and Heavy Metal Contributions of Pelagic Sargassum Species (Phaeophyceae) Inundations in South Florida. Phycology 2024, 4, 235-255. https://doi.org/10.3390/phycology4020013
Hatt DC, Bally NK, Iporac LAR, Olszak S, Campbell JE, Collado-Vides L. Comprehensive Analysis of Biomass, Nutrient, and Heavy Metal Contributions of Pelagic Sargassum Species (Phaeophyceae) Inundations in South Florida. Phycology. 2024; 4(2):235-255. https://doi.org/10.3390/phycology4020013
Chicago/Turabian StyleHatt, Danielle C., Natalie K. Bally, Lowell Andrew R. Iporac, Samantha Olszak, Justin E. Campbell, and Ligia Collado-Vides. 2024. "Comprehensive Analysis of Biomass, Nutrient, and Heavy Metal Contributions of Pelagic Sargassum Species (Phaeophyceae) Inundations in South Florida" Phycology 4, no. 2: 235-255. https://doi.org/10.3390/phycology4020013