
Developing a Sustainable Development Goal 3 (SDG3) Index for Italian Municipalities †

1
Department of Electronics, Information and Bioengineering, Politecnico di Milano, 20133 Milan, Italy
2
IRCCS Istituto Auxologico Italiano, San Luca Hospital, 20149 Milan, Italy
*
Author to whom correspondence should be addressed.
†
Presented at the 2nd International One Health Conference, Barcelona, Spain, 19–20 October 2023.
Med. Sci. Forum 2024, 25(1), 6; https://doi.org/10.3390/msf2024025006
Published: 18 April 2024
(This article belongs to the Proceedings of The 2nd International One Health Conference)
Abstract
:Since the establishment of the SDGs, related progress at a national level has usually been measured using the province as the smallest geographical aggregation. To cope with this gap, we aimed to develop a methodology for SDG3 index calculation for Italian municipalities. Official data for 2018–2022 were collected to cover 11 of 13 SDG3 targets that were mapped to 29 unique indicators: 10 were computed at municipal level, while for the remaining 19 a lower granularity was applied. The SDG3 index, calculated by weighting the targets equally, ranged from 0 to 1, with higher values corresponding to better goal fulfilment. The methodology was applied to the municipalities in the Lombardy region, where the index spanned 0.538 to 0.769. Since SDG indices contribute to the 2030 Agenda goal achievements at country level, more attention should be paid to the geographical details of assessment through policy information and local benchmarking.
1. Introduction
During the 2015 summit in New York, the United Nations (UN) defined the Sustainable Development Goals (SDGs), a set of 17 interlinked goals, described by 169 targets [1]. They need to be achieved by 2030 by synergizing sectors (e.g., finance, agriculture, technology), engaging stakeholders (e.g., local and global policymakers, the private sector, civil society) and reducing income inequality among countries [1].
Since the establishment of the SDGs, with reference to the territory of Italy, there have been several empirical analyses on the advancements of them, including various indices developments [2,3,4,5,6,7]. No standardized methodology has been developed for the index calculation, with most methods applying equal weighting, cross-efficiency and principal component analysis [2,3,4,5,6,7]. A significant discrepancy among these studies has also been observed in terms of the indicators considered, as they tend to cover only a small subset of those officially defined by the UN, which has been repeatedly identified as a limitation. Moreover, these indices have been developed at different geographical levels, i.e., by macro-area, region, province or only for provincial capitals, all of which emphasizes the importance of conducting the analysis at a detailed geographical level to evaluate the local implementation of policies defined at the central level. In addition, since 2018, the Italian National Institute of Statistics (Istat) has been publishing yearly reports on the SDGs’ progress, accounting for all the official goals and reporting scores individually for all the available indicators, implementing diverse geographical aggregations, including national, regional and provincial levels [8]. However, a municipal overview of the SDGs progress is still missing.
In particular, SDG3 (“Ensure healthy lives and promote well-being for all at all ages”) constitutes one of the four foundational goals, whose failure in achievement would have a significant negative impact on human and ecological resources needed for a safe global environment [9]. SDG3 needs to be achieved through 13 targets, addressing major health priorities and emphasizing the role of research and development in the health sector [10]. Furthermore, the COVID-19 pandemic has particularly highlighted its importance [9].
Accordingly, our aim was to develop an index to be applied at municipal level for all the Italian cities based on SDG3, using official open data, to provide an overview of the current spatial coverage of achievement in SDG3 indicators. In this initial study, the proposed methodology is tested on the Lombardy region.
2. Materials and Methods
2.1. Study Area
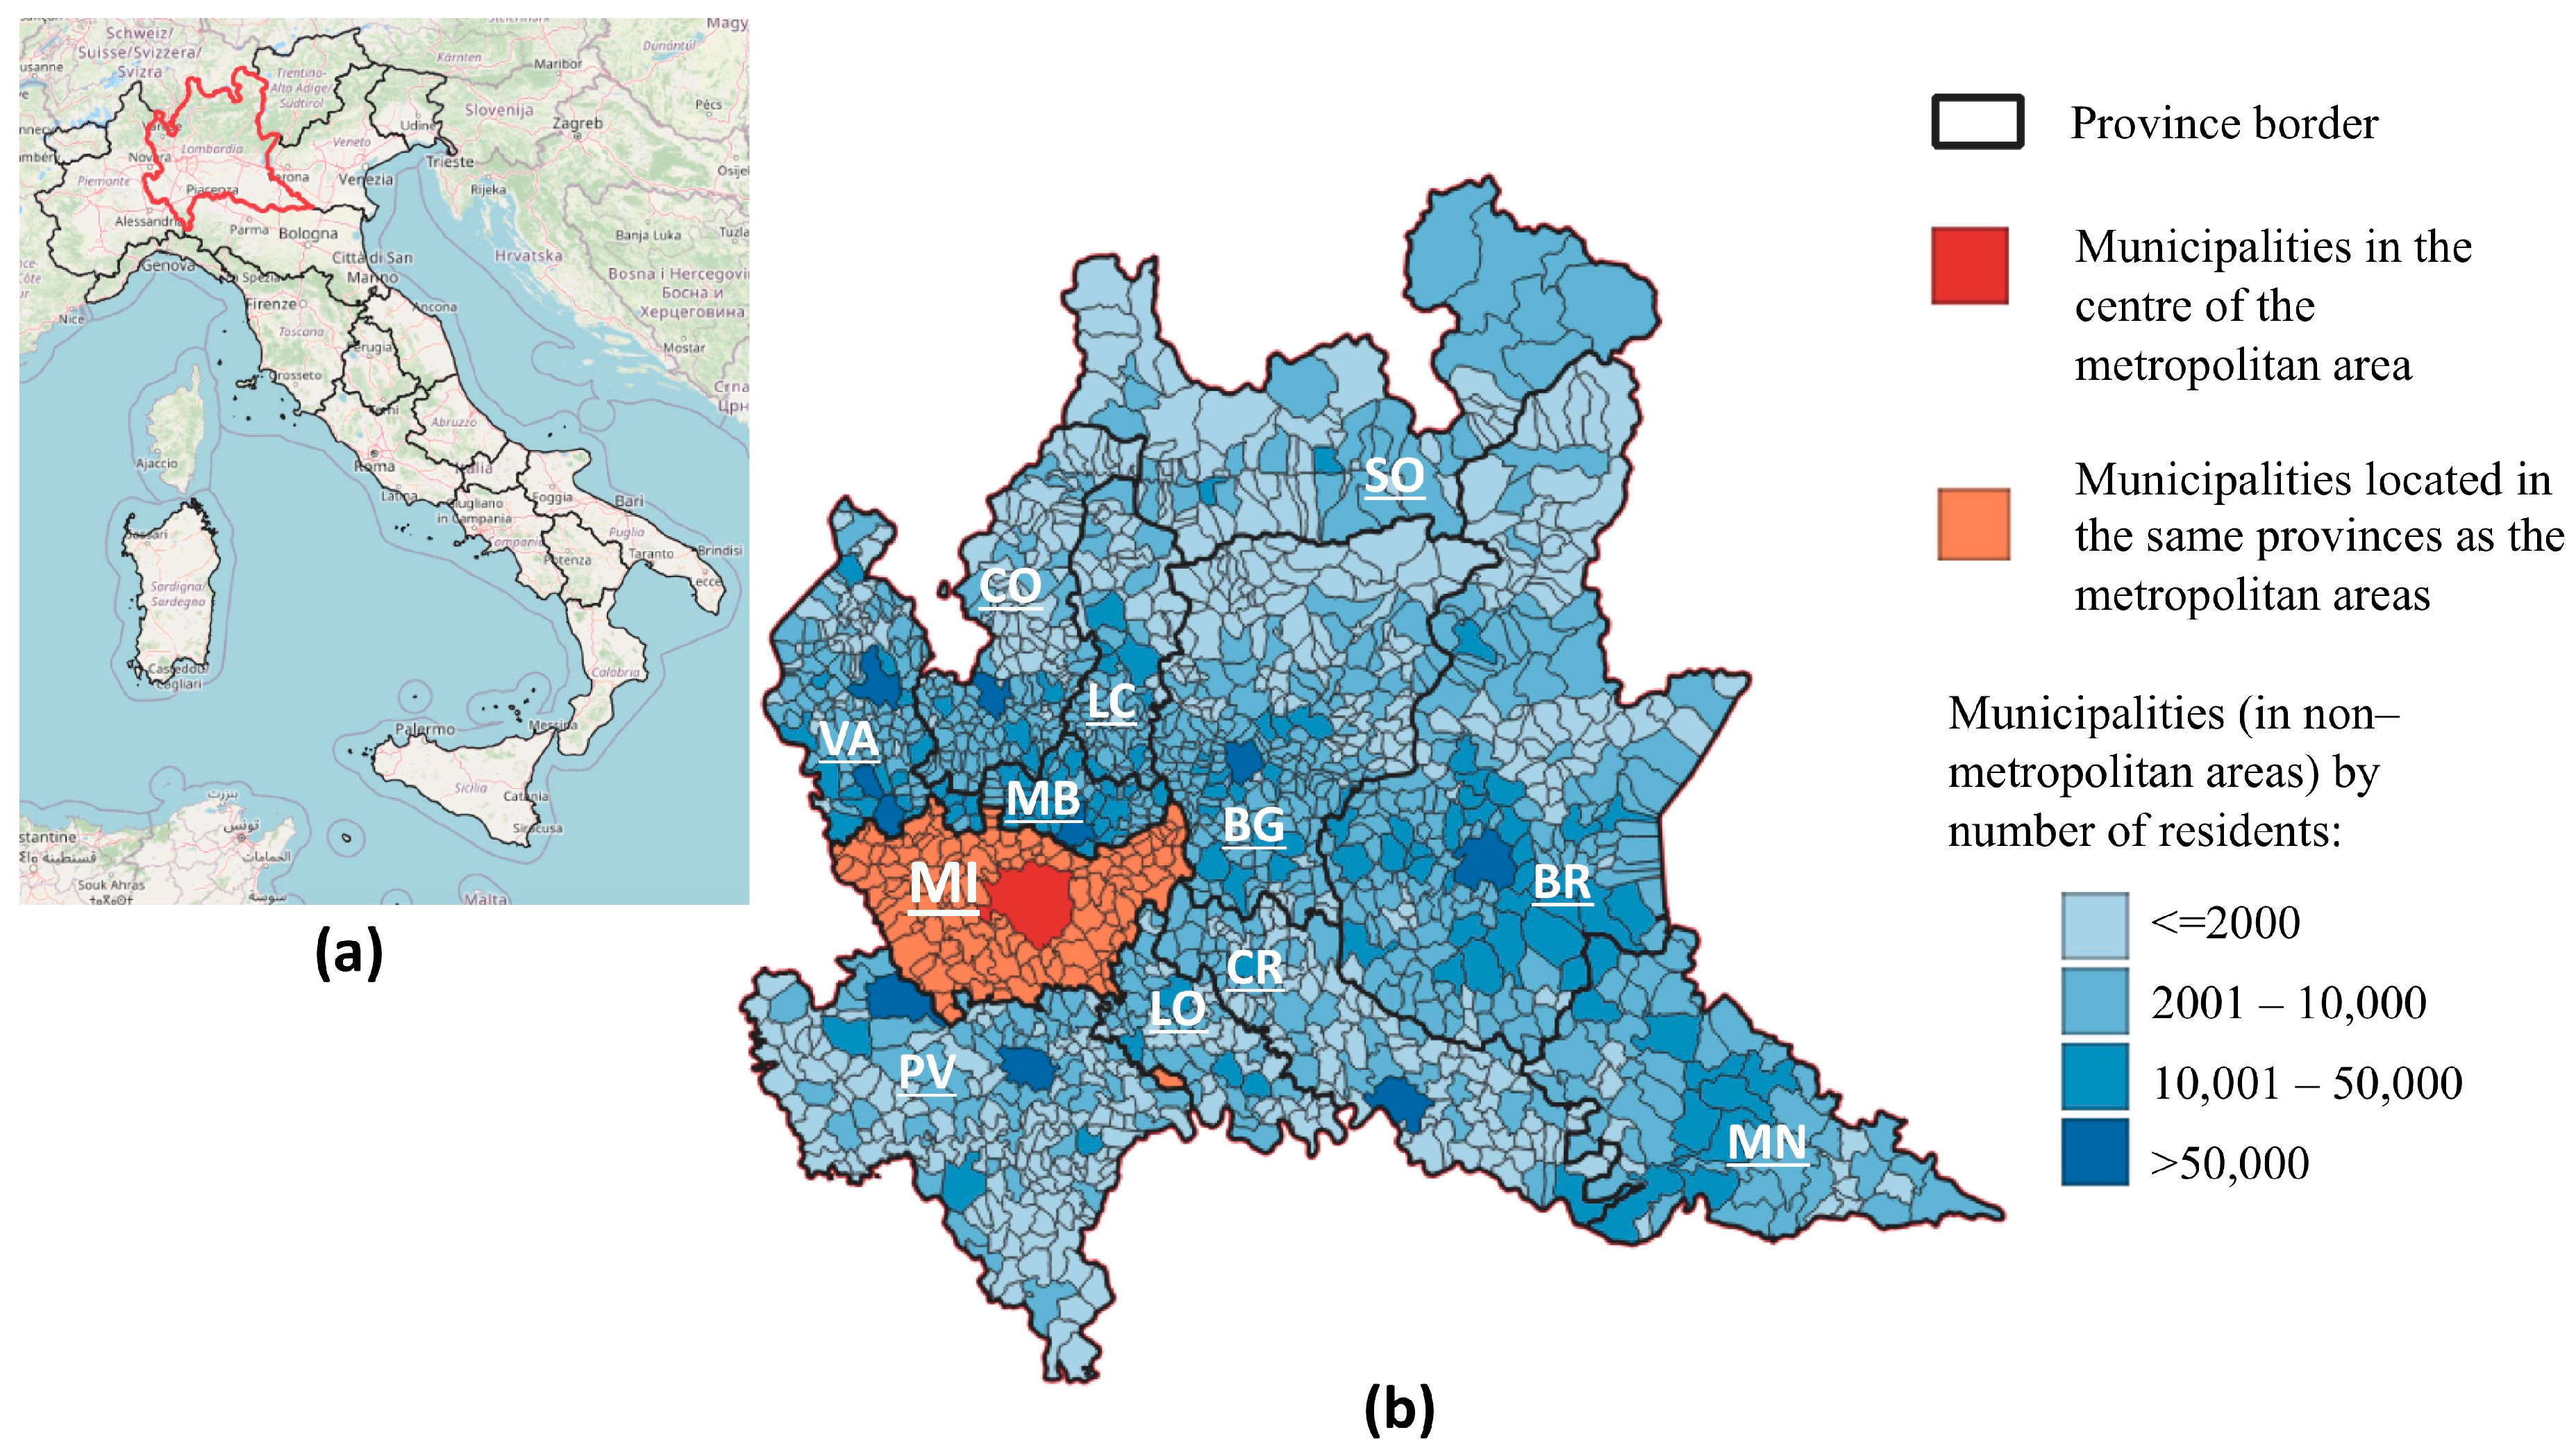
As of 1 January 2023, the Lombardy region, located in the northern part of Italy, is administratively divided into 12 provinces and 1504 municipalities. The median population per municipality in this region is 2827 residents (25th–75th percentile: 1161–6184), giving a total of 9,947,125 residents.
For statistical purposes, Istat defines the following classes of municipalities:
- Municipalities in the centre of the metropolitan area (i.e., 12 municipalities in the whole of Italy, of which Milan is in the Lombardy region);
- Municipalities located in the same provinces as the above-mentioned metropolitan areas (a total of 132 municipalities in Lombardy, i.e., 8.8% of all regions’ municipalities);
- Municipalities (in non-metropolitan areas) with up to 2000 residents (596, i.e., 39.6%);
- Municipalities (in non-metropolitan areas) with 2001–10,000 residents (644, i.e., 42.8%);
- Municipalities (in non-metropolitan areas) with 10,001–50,000 residents (121, i.e., 8.0%);
- Municipalities (in non-metropolitan areas) with more than 50,000 residents (10, i.e., 0.7%).
The map of the study area is shown in Figure 1.
2.2. SDG3 Data
The UN officially defined 13 targets of SDG3 [11]: 3.1, Maternal mortality, 3.2, Neonatal and child mortality, 3.3, Infectious diseases, 3.4, Noncommunicable diseases, 3.5, Substance abuse, 3.6, Road traffic, 3.7, Sexual and reproductive health, 3.8, Universal health coverage, 3.9, Environmental health, 3.a, Tobacco control, 3.b, Medicines and vaccines, 3.c, Health financing and workforce, and 3.d, Emergency preparedness. These are described by a total of 28 indicators (henceforth referred to as “official indicators”). To develop the index for Italy, open data published by Istat, the Ministry of Health and the Italian National Institute of Health (i.e., Istituto Superiore di Sanità—ISS), henceforth referred to as “Italian indicators”, were used and mapped to official indicators.
Four cases occurred in which more than one Italian indicator was assigned to one official indicator; this happened because the official indicator was specified with finer details (by age group—3.7.2; by disease—3.4.1), or was too generic (3.8.1 and 3.c.1). Moreover, for six official indicators (3.3.1, 3.5.2, 3.7.2, 3.8.2, 3.a.1, 3.b.2), a proxy was used due to a lack of specific data. In the rest of the cases, Italian indicators were identical to the official ones.
Apart from tuberculosis incidence, the latest available update for which is dated 2008, open data were available from 2018 to 2022. The most detailed geographical partition of the data was municipal, followed by provincial, regional, aggregation of dimension-based municipalities, and whole geographic area.
2.3. SDG3 Index Computation
As the final index is expected to be at municipal level, when data were available at a less detailed spatial level (i.e., provincial, regional, geographical area), all municipalities belonging to a given geographical partition were assigned the same value. When data were only available for the region (or whole geographical area), but separately reported for the different classes of municipalities (as defined by the Istat and described in Section 2.1), each municipality was assigned a baseline value according to its class, which was then multiplied by a coefficient inferred from the less detailed geographical level (i.e., regional or geographical area), calculated as follows:
where a is the less detailed geographical partition (i.e., regional or geographical area) and b is the more detailed geographical partition (i.e., class of municipality).
For example, the Lombardy region has the following number of municipalities belonging to each of the six classes: 1, 132, 596, 644, 121, and 10. Assuming an indicator measuring 0.973 for the whole region, and baseline values of 0.971, 0.978, 0.98, 0.973, 0.974, and 0.973 for each of the classes, respectively, the regional coefficient for Lombardy (on that indicator) is equal to
Accordingly, each of the 1504 municipalities in Lombardy was assigned a baseline value corresponding to its class, which was then multiplied by 0.9947.
As over time there have been changes in the administrative division of Italy, the index was calculated for the municipalities existing on 1 January 2023. Where two or more municipalities were merged into one, the absolute values of the indicators of all the municipalities forming the new one were summed.
Once the values of all the Italian indicators had been obtained for each municipality, data were normalised to reach values between 0 and 1. The values of all the indicators were subsequently ranked to represent a qualitative score in terms of health-related outcomes, i.e., with 0 representing values related to poor health outcomes, and 1 being the best values.
If multiple Italian indicators contributed together into the computation of one official indicator, they were averaged to compute the unique output, e.g., the official indicator 3.4.1. Mortality rate attributed to cardiovascular disease, cancer, diabetes or chronic respiratory disease is composed of four Italian indicators corresponding to particular causes of death. For example, the city of Milan had the following values associated with each cause, 0.861, 0.850, 0.966, and 0.947, and consequently the value of the official 3.4.1 indicator can be calculated according to the following formula:
The score of each target was then calculated as the average of the official indicators’ scores included in it. For example, the score of the target 3.4. Noncommunicable diseases, composed of two official indicators, scoring 0.906 and 0.984 in Milan, is calculated as follows:
To compute the final SDG3 index, as no specific guidelines for weighting are provided by the UN, the output value was defined as the average of all available targets. As a result, the final index is a dimensionless quantity which ranges between 0 and 1, with the higher value corresponding to the better fulfilment of the SDG3.
To analyse the characteristics of the final index for the Lombardy region, data were summarised using descriptive statistics, i.e., mean, population-weighted mean, minimum, 25th percentile, median, 75th percentile, maximum. The legend in the map was created using the equal interval method (a total of 5 classes was set).
3. Results
It was possible to obtain data for Italy relevant to 11 of the 13 SDG3 targets (no data available for 3.1 Maternal mortality and 3.d Emergency preparedness). These 11 targets can be described through 17 official indicators, built combining 29 Italian indicators. For six targets (i.e., 3.2, 3.4, 3.6, 3.8, 3.a and 3.c) all their official indicators were computed from the available data sources, while for the other targets the share of computable indicators is reported in Figure 2.
The values of the final index, i.e., the average of all available targets’ scores, calculated for the Lombardy region, ranged from 0.538 to 0.769. The lowest value was reached by Camerata Cornello in the province of Bergamo, with a population of 558, and the highest by Torlino Vimercati in the province of Cremona, with a population of 480. The median value of the index was 0.653, with the 25th and 75th percentiles being equal to 0.629 and 0.683, respectively. The population-weighted mean of the index in Lombardy was equal to 0.663.
When considering classes of municipalities (as described in Section 2.1), the highest median was achieved by the municipality in the centre of the metropolitan area (0.764), followed by municipalities in the province of the centre of the metropolitan areas (0.694), municipalities with up to 2000 residents (0.670), municipalities with between 10,001 and 50,000 inhabitants (0.635), and municipalities with between 2001 and 10,000 inhabitants (0.632), while the lowest score was achieved by municipalities with a population of more than 50,000 (0.602).
The computed final index for municipalities in the Lombardy region is plotted in Figure 3.
At the level of single provinces, the median SDG3 index was the highest for the province of Cremona (index equal to 0.720), while the lowest was achieved by the province of Monza and Brianza (0.608). The median SDG3 results achieved by municipalities in each province are summarized in Table 1.
4. Discussion
In this study, an index based on SDG3—Ensure healthy lives and promote well-being for all at all ages—was proposed, using open data at municipal, provincial, regional, population-based municipality class and geographic area levels, mapping 29 Italian indicators to 11 SDG3 targets. The scores were calculated separately for each of the 11 available targets (with the multiple indicators included eventually averaged), and their average generated the final index. This approach was then applied to the Lombardy region, located in the north of Italy. The index reveals that a considerable number of the indicators were not covered by official Italian data with a detailed geographical granularity, and that there are disparities in SDG3 fulfilment among Italian municipalities, even within the same region and province.
Three of the previously developed Italian indices provided details of the score at a provincial level [2,6,7]. The results for each province of the Lombardy region varied considerably among studies, with a possible explanation being the implementation of different sets of indicators to compute the final index. This highlights the problem that the achievement of specific health-related targets in Italy is not always synergistic. Moreover, it also hinders the comparison of the results of previous studies with those presented in this study. However, it is worth noting that, accounting for all previously defined Italian indices [2,3,4,5,6,7], our framework uses the largest number of indicators covering the official SDG3 targets, which, together with the application of the municipal level, potentially provides the most comprehensive view of SDG3 achievement.
Upon adopting the SDGs, researchers identified issues with indicator relevance [12,13], stating that out of the 169 targets which outline the 17 SDGs, 91 required further specification [14]. Coherently, different limitations were encountered when creating the SDG3 index for Italy, including the following.
Definition issues: It was unclear for two targets (3.8 Universal health coverage and 3.c Health financing and workforce) what information should be taken into account, and hence the indicators were selected mostly based on the availability of relevant data sources. However, this can be partly explained considering that the SDGs were created for all UN member states, which are currently at different stages of development, without specifically identifying which health services would need to be considered essential worldwide. The rest of the SDG3 targets are instead sufficiently well described by the official indicators, and they cover both the supply of health services (e.g., beds in hospitalization facilities or pharmacies) and the expected demand for them (e.g., by monitoring smoking prevalence or the spread of infectious diseases).
Spatial representativeness and information robustness: When gathering data for specific indicators, especially regarding mortality in developed countries, information is accessible through compulsory hospital record registration or administrative procedures, which also facilitate the collection of data at a municipal level. However, the process is more complex for other indicators. For instance, considering 3.9.1 (Mortality rate attributed to household and ambient air pollution), such a cause of death is not standardised in the International Classification of Diseases. In addition, it should be noted that self-reported data present a range of challenges, notably with regard to their accuracy. While classifying oneself as a ‘smoker’ or ‘non-smoker’ can be simple, evaluating whether ‘healthcare expenses represent a significant portion of overall expenditures’ is more complex, as household expenses are not typically precisely catalogued by their members, introducing a measurement bias; also, no definition of ‘significant portion’ is given. Another important issue is that reporting certain SDGs indicators at the municipal level, such as hospital bed capacity, may not be practical. To address this problem, a possible solution is to implement a gravity model, designed to estimate the flow of goods or services between two or multiple locations, to assess the accessibility of the service based on physical distance [15,16,17], or to use data provided directly at a lower granularity, which is the solution implemented in this study.
Fluidity of the goals: The UN draws attention directly towards this issue, with each goal being linked to the others, considering both synergies and trade-offs amongst them, a topic that is furtherly discussed in the literature [18,19,20,21,22,23]. The SDG3 shows positive interactions with the vast majority of goals worldwide, in particular with SDG1, No poverty, SDG5, Gender equality, SDG6, Clean water and sanitation, and SDG10, Reduced inequalities [18,23]. On the other hand, in Italy, SDG3 shows a major trade-off with SDG8 (Decent work and economic growth), a relationship that was also found, among others, in the United States, Spain and Sweden [18]. While some trade-offs have been previously reported among different SDGs, no similar issues have been identified within single goals.
Quantitative measurement: Out of the 13 officially defined targets of SDG3, a precise quantitative objective is formulated for only two of them, 3.1 (By 2030, reduce the global maternal mortality ratio to less than 70 per 100,000 live births) and 3.2 (By 2030, end preventable deaths of newborns and children under 5 years of age, with all countries aiming to reduce neonatal mortality and under-5 mortality to, at least, as low as 12 per 1000 live births and 25 per 1000 live births, respectively), thus providing a quantitative reference measure. For the remaining goals, instead, targets are described as aiming to “reduce”, “increase”, “strengthen” or “guarantee access to” the indicators concerned, without setting numerical outcomes. This same issue has been identified with reference to other objectives as well [24,25,26], which, again, can be partly explained by the global perspective of the SDGs. Under such circumstances, rather than an index measuring indicators at a specific point in time, periodic changes in scores could be considered, an approach that, however, is at present hindered for municipal data available for Italian indicators by their temporal heterogeneity. Since 2018, Istat has released yearly reports on all SDGs (yet not at the level of municipalities), which enables periodic monitoring of the progress towards them in Italy. Nonetheless, there is a need to locally benchmark the targets [27,28,29], allowing the assessment of how far individual cities are from achieving concrete results, instead of a simple city-specific comparison of progress over time.
5. Conclusions
In conclusion, the 2030 Agenda’s promise of “Leave no one behind” necessitates increased attention towards a national analysis of SDG performance at a detailed geographical level. The results presented in this study, together with previous research findings, show an important variability of scores across cities and provinces in the Lombardy region. Further work should include the calculation of the SDG3 index for the municipalities of the other Italian regions and a deeper statistical analysis of the results. The availability of the SDG3 indicators and the overview of target achievement at local level, through local benchmarking and policy information, could significantly contribute to the global achievement of the defined targets. This can be achieved by applying the standardized, easily scalable methodology proposed in this study.
Author Contributions
Conceptualization, J.N., L.G. and E.G.C.; methodology, J.N.; software, J.N.; validation, J.N., L.G. and E.G.C.; formal analysis, J.N.; investigation, J.N., L.G. and E.G.C.; resources, J.N.; data curation, J.N.; writing—original draft preparation, J.N.; writing—review and editing, L.G. and E.G.C.; visualization, J.N., L.G. and E.G.C.; supervision, E.G.C.; project administration, E.G.C.; funding acquisition, E.G.C. All authors have read and agreed to the published version of the manuscript.
Funding
J.N. was supported by a Ph.D. Fellowship from “PON Research and Innovation 2014–2020 Action IV.5”. L.G. was supported by the Italian project “Anthem”, funded by the National Plan for NRRP Complementary Investments (PNC, established with the decree-law 6 May 2021, n. 59, converted by law n. 101 of 2021) in the call for the funding of research initiatives for technologies and innovative trajectories in the health and care sectors (Directorial Decree n. 931 of 06-06- 2022)—project n. PNC0000003—AdvaNced Technologies for Human-centrEd Medicine (project acronym: ANTHEM).
Institutional Review Board Statement
Not applicable.
Informed Consent Statement
Not applicable.
Data Availability Statement
Publicly available datasets were analysed in this study. These data can be found here: http://dati.istat.it/ (accessed on 17 April 2024), https://www.dati.salute.gov.it/dati/homeDataset.jsp (accessed on 17 April 2024), https://www.salute.gov.it/portale/documentazione/p6_2_8.jsp?lingua=italiano (accessed on 17 April 2024), https://www.iss.it/ (accessed on 17 April 2024).
Conflicts of Interest
The authors declare no conflicts of interest.
References
- Stafford-Smith, M.; Griggs, D.; Gaffney, O.; Ullah, F.; Reyers, B.; Kanie, N.; Stigson, B.; Shrivastava, P.; Leach, M.; O’Connell, D. Integration: The key to implementing the Sustainable Development Goals. Sustain. Sci. 2017, 12, 911–919. [Google Scholar] [CrossRef] [PubMed]
- D’Adamo, I.; Gastaldi, M.; Ioppolo, G.; Morone, P. An analysis of Sustainable Development Goals in Italian cities: Performance measurements and policy implications. Land Use Policy 2022, 120, 106278. [Google Scholar] [CrossRef]
- D’Adamo, I.; Gastaldi, M.; Imbriani, C.; Morone, P. Assessing regional performance for the Sustainable Development Goals in Italy. Sci. Rep. 2021, 11, 24117. [Google Scholar] [CrossRef] [PubMed]
- Dello Strologo, A.; D’Andrassi, E.; Paoloni, N.; Mattei, G. Italy versus other European countries: Sustainable Development Goals, policies and future hypothetical results. Sustainability 2021, 13, 3417. [Google Scholar] [CrossRef]
- Puertas, R.; Marti, L. Regional analysis of the sustainable development of two Mediterranean countries: Spain and Italy. Sustain. Dev. 2023, 31, 797–811. [Google Scholar] [CrossRef]
- Cavalli, L.; Farnia, L.; Lizzi, G.; Romani, I.G.; Alibegovic, M.; Vergalli, S. The SDSN Italia SDGs City Index Two Years Later: Update Report; FEEM Report No. 08-2020. 2020. Available online: https://www.ssrn.com/abstract=3733706 (accessed on 17 April 2024).
- Farnia, L.; Cavalli, L.; Lizzi, G.; Vergalli, S. Methodological insights to measure the Agenda 2030 at urban level in Italy. Sustainability 2019, 11, 4598. [Google Scholar] [CrossRef]
- Italian National Institute of Statistics. Il Rapporto SDGs. Available online: https://www.istat.it/it/benessere-e-sostenibilit%C3%A0/obiettivi-di-sviluppo-sostenibile/il-rapporto-sdgs (accessed on 1 August 2023).
- Fenner, R.; Cernev, T. The implications of the Covid-19 pandemic for delivering the Sustainable Development Goals. Futures 2021, 128, 102726. [Google Scholar] [CrossRef] [PubMed]
- World Health Organization. Sustainable Development Goals. Available online: https://www.who.int/europe/about-us/our-work/sustainable-development-goals (accessed on 6 October 2023).
- United Nations. Goal 3 Ensure Healthy Lives and Promote Well-Being for All at All Age. Available online: https://sdgs.un.org/goals/goal3 (accessed on 6 October 2023).
- Hák, T.; Janoušková, S.; Moldan, B. Sustainable Development Goals: A need for relevant indicators. Ecol. Indic. 2016, 60, 565–573. [Google Scholar] [CrossRef]
- Rickels, W.; Dovern, J.; Hoffmann, J.; Quaas, M.F.; Schmidt, J.O.; Visbeck, M. Indicators for monitoring sustainable development goals: An application to oceanic development in the European Union. Earth’s Future 2016, 4, 252–267. [Google Scholar] [CrossRef]
- Lu, Y.; Nakicenovic, N.; Visbeck, M.; Stevance, A.S. Policy: Five priorities for the UN sustainable development goals. Nature 2015, 520, 432–433. [Google Scholar] [CrossRef]
- Shi, Y.; Yang, J.; Keith, M.; Song, K.; Li, Y.; Guan, C. Spatial accessibility patterns to public hospitals in shanghai: An improved gravity model. Prof. Geogr. 2022, 74, 265–289. [Google Scholar] [CrossRef]
- Ge, E.; Su, M.; Zhao, R.; Huang, Z.; Shan, Y.; Wei, X. Geographical disparities in access to hospital care in Ontario, Canada: A spatial coverage modelling approach. BMJ Open 2021, 11, e041474. [Google Scholar] [CrossRef] [PubMed]
- Delgado, E.J.; Cabezas, X.; Martin-Barreiro, C.; Leiva, V.; Rojas, F. An equity-based optimization model to solve the location problem for healthcare centers applied to hospital beds and COVID-19 vaccination. Mathematics 2022, 10, 1825. [Google Scholar] [CrossRef]
- Pradhan, P.; Costa, L.; Rybski, D.; Lucht, W.; Kropp, J.P. A systematic study of sustainable development goal (SDG) interactions. Earth’s Future 2017, 5, 1169–1179. [Google Scholar] [CrossRef]
- Griggs, D.J.; Nilsson, M.; Stevance, A.; McCollum, D. A Guide to SDG Interactions: From Science to Implementation; International Council for Science: Paris, France, 2017. [Google Scholar]
- Bennich, T.; Weitz, N.; Carlsen, H. Deciphering the scientific literature on SDG interactions: A review and reading guide. Sci. Total Environ. 2020, 728, 138405. [Google Scholar] [CrossRef] [PubMed]
- Wu, X.; Fu, B.; Wang, S.; Song, S.; Li, Y.; Xu, Z.; Wei, Y.; Liu, J. Decoupling of SDGs followed by re-coupling as sustainable development progresses. Nat. Sustain. 2022, 5, 452–459. [Google Scholar] [CrossRef]
- Alcamo, J.; Thompson, J.; Alexander, A.; Antoniades, A.; Delabre, I.; Dolley, J.; Marshall, F.; Menton, M.; Middleton, J.; Scharlemann, J.P. Analysing interactions among the sustainable development goals: Findings and emerging issues from local and global studies. Sustain. Sci. 2020, 15, 1561–1572. [Google Scholar] [CrossRef] [PubMed]
- Scharlemann, J.P.; Brock, R.C.; Balfour, N.; Brown, C.; Burgess, N.D.; Guth, M.K.; Ingram, D.J.; Lane, R.; Martin, J.G.C.; Wicander, S.; et al. Towards understanding interactions between Sustainable Development Goals: The role of environment–human linkages. Sustain. Sci. 2020, 15, 1573–1584. [Google Scholar] [CrossRef]
- Kubiszewski, I.; Mulder, K.; Jarvis, D.; Costanza, R. Toward better measurement of sustainable development and wellbeing: A small number of SDG indicators reliably predict life satisfaction. Sustain. Dev. 2022, 30, 139–148. [Google Scholar] [CrossRef]
- Biermann, F.; Kanie, N.; Kim, R.E. Global governance by goal-setting: The novel approach of the UN Sustainable Development Goals. Curr. Opin. Environ. Sustain. 2017, 26, 26–31. [Google Scholar] [CrossRef]
- Mustajoki, J.; Borchardt, S.; Büttner, L.; Köhler, B.; Lepenies, R.; Lyytimäki, J.; Mille, R.; Pedersen, A.B.; Reis, S.; Richard, D. Ambitiousness of Sustainable Development Goal (SDG) targets: Classification and implications for policy making. Discov. Sustain. 2022, 3, 36. [Google Scholar] [CrossRef]
- Swain, R.B.; Ranganathan, S. Modeling interlinkages between sustainable development goals using network analysis. World Dev. 2021, 138, 105136. [Google Scholar] [CrossRef]
- Giles-Corti, B.; Lowe, M.; Arundel, J. Achieving the SDGs: Evaluating indicators to be used to benchmark and monitor progress towards creating healthy and sustainable cities. Health Policy 2020, 124, 581–590. [Google Scholar] [CrossRef] [PubMed]
- Thomas, R.; Hsu, A.; Weinfurter, A. Sustainable and inclusive–Evaluating urban sustainability indicators’ suitability for measuring progress towards SDG-11. Environ. Plan. B Urban Anal. City Sci. 2021, 48, 2346–2362. [Google Scholar] [CrossRef]
Figure 1.
(a) Location of Lombardy on the map of Italy. (b) The borders of the Lombardy region and its provinces and cities. MI—province of Milan, MB—province of Monza and Brianza, VA—province of Varese, CO—province of Como, LC—province of Lecco, SO—province of Sondrio, BG—province of Bergamo, BR—province of Brescia, MN—province of Mantua, CR—province of Cremona, LO—province of Lodi, PV—province of Pavia.

Figure 2.
Availability of SDG3 targets and indicators for Italy.

Figure 3.
Final SDG3 index for the Lombardy region.


Table 1.
Median of the final SDG3 index for each province of the Lombardy region.
| Province | Median SDG3 Index | 25th–75th Percentile |
|---|---|---|
| Cremona | 0.720 | 0.704–0.731 |
| Milan | 0.694 | 0.688–0.698 |
| Pavia | 0.679 | 0.660–0.690 |
| Lecco | 0.666 | 0.657–0.685 |
| Sondrio | 0.660 | 0.644–0.672 |
| Como | 0.657 | 0.646–0.674 |
| Lodi | 0.640 | 0.631–0.660 |
| Brescia | 0.638 | 0.625–0.654 |
| Mantua | 0.633 | 0.625–0.649 |
| Bergamo | 0.630 | 0.620–0.651 |
| Varese | 0.622 | 0.612–0.640 |
| Monza and Brianza | 0.608 | 0.600–0.614 |
Disclaimer/Publisher’s Note: The statements, opinions and data contained in all publications are solely those of the individual author(s) and contributor(s) and not of MDPI and/or the editor(s). MDPI and/or the editor(s) disclaim responsibility for any injury to people or property resulting from any ideas, methods, instructions or products referred to in the content. |
© 2024 by the authors. Licensee MDPI, Basel, Switzerland. This article is an open access article distributed under the terms and conditions of the Creative Commons Attribution (CC BY) license (https://creativecommons.org/licenses/by/4.0/).
Share and Cite
MDPI and ACS Style
Nawaro, J.; Gianquintieri, L.; Caiani, E.G. Developing a Sustainable Development Goal 3 (SDG3) Index for Italian Municipalities. Med. Sci. Forum 2024, 25, 6. https://doi.org/10.3390/msf2024025006
AMA Style
Nawaro J, Gianquintieri L, Caiani EG. Developing a Sustainable Development Goal 3 (SDG3) Index for Italian Municipalities. Medical Sciences Forum. 2024; 25(1):6. https://doi.org/10.3390/msf2024025006
Chicago/Turabian StyleNawaro, Julia, Lorenzo Gianquintieri, and Enrico G. Caiani. 2024. "Developing a Sustainable Development Goal 3 (SDG3) Index for Italian Municipalities" Medical Sciences Forum 25, no. 1: 6. https://doi.org/10.3390/msf2024025006