
Fungal Methane Production Controlled by Oxygen Levels and Temperature
by
 , , ,
, , ,
Moritz Schroll
1,*,
Katharina Lenhart
2,3,
Thomas Bender
1,
Piet Hötten
1,
Alexander Rudolph
1,
Sven Sörensen
1 and
Frank Keppler
1,4,* 1
Institute of Earth Sciences, Heidelberg University, Im Neuenheimer Feld 236, 69120 Heidelberg, Germany
2
Bingen University of Applied Sciences, Berlinstraße 109, 55411 Bingen, Germany
3
Centre for Organismal Studies (COS), Im Neuenheimer Feld 230, 69120 Heidelberg, Germany
4
Heidelberg Center for the Environment (HCE), Im Neuenheimer Feld 229, 69120 Heidelberg, Germany
*
Authors to whom correspondence should be addressed.
Methane 2024, 3(2), 257-275; https://doi.org/10.3390/methane3020015
Submission received: 31 January 2024
/
Revised: 18 March 2024
/
Accepted: 7 April 2024
/
Published: 19 April 2024
Abstract
:Saprotrophic fungi, key players in global carbon cycling, have been identified as methane (CH4) sources not yet accounted for in the global CH4 budget. This study, for the first time, explores the influence of oxygen (O2) and temperature on CH4 production by two fungi, Laetiporus sulphureus and Pleurotus sapidus. To explore the relationship between these parameters and fungal CH4 formation, we examined CH4 formation under varying O2 levels (0 to 98%) and temperatures (17, 27, and 40 °C) during fungal growth on pine wood, beech wood, and grass under sterile conditions. Our findings show that fungal CH4 formation strongly depends on O2 levels. Methane formation was highest when O2 levels exceeded 5%, whilst no CH4 formation was observed after complete O2 consumption. Reintroducing O2 immediately resumed fungal CH4 production. Methane formation normalized to O2 consumption (CH4_norm) showed a different pattern. L. sulphureus showed higher CH4_norm rates with higher O2 levels, whereas P. sapidus showed elevated rates between 0 and 5%. Temperature also significantly influenced CH4 and CH4_norm rates, with the highest production at 27 °C, and comparatively lower rates at 17 and 40 °C. These findings demonstrate the importance of O2 levels and temperature in fungal CH4 emissions, which are essential for refining CH4 source predictions.
1. Introduction
Methane (CH4) is a potent climate gas, with a greenhouse gas (GHG) potential approximately 100 times greater than carbon dioxide (CO2) over a 10-year period [1]. A significant portion of global CH4 emissions originates from biotic sources, exceeding contributions from abiotic sources like fossil fuel and biomass burning as well as geogenic processes [2,3].
Contrary to the earlier assumption that biotic CH4 production occurs exclusively under anaerobic conditions by methanogenic archaea in certain environments, such as wetlands, landfills, and rice paddies, and in the digestion system of termites and ruminants, recent research has revealed that biotic CH4 can also be produced in the presence of oxygen (O2). The first evidence of aerobic CH4 formation by plants was presented by Keppler et al. [4], and subsequent research expanded this finding to a range of eukaryotic CH4 and prokaryotic sources, including mosses and lichens [5], marine algae [6,7], terrestrial and marine cyanobacteria [8], plant cell cultures [9,10], non-methanogenic archaea [10], animals [11,12], human cell cultures, and humans [10,13,14,15,16], as well as fungi [10,17,18].
For some years, the mechanisms behind CH4 formation in these organisms remained elusive. However, a recent breakthrough came with the discovery by Ernst et al. [10] of a universal non-enzymatic CH4 formation mechanism potentially occurring in all organisms that produce reactive oxygen species (ROS). This mechanism, based on Fenton chemistry, involves the reaction of ROS with free iron (II) ions and methylated precursor compounds within cells, encompassing all three domains of life.
Despite these advancements, little is known about the detailed mechanism and the physical and chemical factors that drive CH4 formation in many newly discovered sources and organisms. This is especially true for (saprotrophic) fungi that play an essential role in decomposing organic matter, such as wood lignocellulose, thus playing a crucial role in global carbon recycling [19]. The challenge lies in determining fungal biomass and correlating it with CH4 emissions. This is further complicated by the species and medium dependency of these emissions (e.g., [18]), as well as the potential for yet unknown CH4 formation pathways, which complicates our understanding of the global impact of fungal CH4 emissions.
Before the studies by Lenhart et al. [17] and Schroll et al. [18], which found that saprotrophic fungi directly produce CH4 under aerobic conditions without the presence of methanogenic archaea, it was assumed that fungi initiated the decomposition process by breaking down macromolecules, like those in wood, thereby providing the precursor compounds for CH4 production through methanogenic archaea in anoxic microsites (e.g., [20,21,22,23]). Another CH4-producing pathway involving facultative anaerobic fungi and a halomethane-dependent pathway was identified by Huang et al. [24], where CH4 formation correlated with the formation of chloromethane (CH3Cl), as previously reported by McNally et al. [25]. These authors further highlighted that the function of the enzymes involved in the halomethane-dependent CH4 formation pathway is independent of O2 and thus might also be involved in the observed fungal CH4 production by Lenhart et al. [17] and Schroll et al. [18].
A common consensus is that fungal CH4 emissions are strongly dependent on the fungal species and the wood substrates [17,18,26,27,28]. However, the influence of key parameters like O2 availability and temperature on fungal CH4 formation has not been investigated, even though these factors strongly influence the physiological activity and growth of fungi. Studies have shown that the activity and growth of xylotrophic fungi depend on prevailing O2 mixing ratios [29,30,31]. For instance, xylothrophic fungi, which include the two investigated fungi in this study, can consume all available O2 in their woody habitat and still grow under anoxic conditions [31]. On the other hand, studies have indicated that below a concentration of 0.2% O2, fungal growth is completely inhibited [29,30], while the decay of wood debris by saprotrophic fungi decreased with decreasing O2 and increasing CO2 mixing ratios and vice versa [29,32]. This suggests that prevailing O2 concentrations significantly influence fungal activity and metabolism, potentially controlling fungal CH4 emissions.
Temperature is another critical driver of fungal metabolism. Numerous studies have investigated the relationship between wood decay and temperature [27,28,33,34,35], finding that increased temperatures usually lead to higher CH4 emissions due to wood decay. This observation is likely linked to the role of saprotrophic fungi as significant producers of extracellular enzymes needed for wood decomposition, which is predicted to increase due to higher temperatures [33]. Fungal growth even quadrupled with a 10 °C increase in temperature across a tropical elevation gradient [34], indicating a substantial impact of temperature on the amount of prevailing fungal biomass and, consequently, on CH4 emissions from xylotrophic fungi.
In our study, we investigated the effects of different O2 levels and temperatures on fungal CH4 production by two saprotrophic fungi, Pleurotus sapidus and Laetiporus sulphureus. Both fungal species were grown on various substrates, including beech wood, pine wood, and grass, and incubated under sterile conditions. Oxygen consumption rates were measured under different temperatures and patterns of CH4 production, and CH4 production normalized to O2 consumption (CH4_norm) was examined.
2. Results
In order to evaluate the dependency of fungal CH4 formation on prevailing O2 concentrations starting at ambient levels (20.9% O2, see Section 2.1) and at elevated levels (starting at >90% O2, see Section 2.2) as well as different temperature (17 to 40 °C, Section 2.3), two different saprotrophic fungal species were incubated with different growth media (beech, pine, grass). For methodological details, we refer to Section 4, Materials and Methods. Please note that CH4 formation and O2 consumption rates were based on a per flask basis and not related to fungal dried biomass because it was not possible to determine it after each measurement step. Thus, in all conducted incubation experiments, CH4 production rates were normalized to the O2 consumption rates (CH4_norm) to directly link fungal CH4 production to its metabolic activity (inferred from O2 consumption; Table 1). In addition, changes in CO2 concentrations in the flask were also measured and their formation rates were estimated, and these are also indicators of the metabolic activity of the fungi. As the focus of the manuscript is on the role of O2, the accompanying CO2 data are shown in the Supplement (Text S1 and Figures S1–S3). Please also note that all presented CH4 formations and CH4_norm rates were corrected by subtracting the observed CH4 rates in the medium controls.
2.1. Dependance of Fungal CH4 Production on Ambient O2 Concentrations
All incubation experiments in which the two fungal species P. sapidus or L. sulphureus were grown on different substrates at various O2 levels showed measurable CH4 formation rates compared with the respective substrate control (Table 1). Formation rates of CH4 for controls were smaller compared with fungal incubations, accounting for 0.30 ± 0.05, 0.91 ± 0.09, and 3.26 ± 0.53 nmol h−1 for pine wood incubated at 17 °C, 27 °C, and 40 °C, respectively, as well as 0.01 ± 0.001 and 0.31 ± 0.01 nmol h−1 for grass incubated at 17 °C and 40 °C, respectively. Calculated CH4 formation and O2 consumption rates for experiments with the two fungal species were in the range of 0 to 5.34 ± 0.64 nmol h−1 and 0.06 ± 0.01 to −0.88 ± 0.06 mmol h−1, respectively.
No measurable CH4 formation was observed when O2 levels were below ~0.5%. As soon as O2 was reintroduced, following an O2-induced dilution of CH4 levels in the vials, this led to an immediate increase in CH4 formation, indicating a rapid response to the availability of O2 for fungal metabolism. This is exemplarily shown in Figure 1 (arrows indicate the addition of O2) for L. sulphureus (Figure 1A) and P. sapidus (Figure 1B) grown on beech wood.
For both fungi, the amount of CH4 gradually increased within the flasks when O2 was present. Notably, CH4 formation rates substantially decreased in both fungi when O2 mixing ratios fell, eventually ceasing completely, indicating no further CH4 formation. However, upon reintroduction of O2 to the flasks (Figure 1, as indicated by arrows, e.g., at an incubation time of 370 h for L. sulphureus grown on beech wood), the amount of O2 initially increased (from 0.05 ± 0.03 to 16.8 ± 0.7 mmol) while that of CH4 decreased (from 240.0 ± 7.8 to 190.3 ± 7 nmol) a result of the dilution effect from the supplemented gas volume. Subsequently, CH4 formation resumed immediately leading to a consequent increase in CH4 (~60 nmol). This pattern was repeatedly observed during the incubation of the two fungi grown on beech wood (Figure 1). It is important to note that during the incubation of P. sapidus grown on beech wood (Figure 1B), the CH4 yield in the flask gradually decreased with successive O2 additions from 167 nmol at the start of the incubation to 94.7 ± 6.0 nmol at the end of the incubation. This reduction was attributed to the dilution effect of the O2 additions, which surpassed the fungal CH4 formation rate. Nonetheless, a distinct increase in CH4 was noted following each O2 addition. Controls containing pine wood and grass (excluding beech due to unavailability, although Lenhart et al. [17] showed that beech controls show negligible CO2 emissions) exhibited much lower but still measurable CH4 as well as CO2 emission rates regardless of prevailing O2 levels (Figures S1–S3). A more detailed description and a discussion of these data can be found in the Supplement (Text S1).

Table 1.
Overview of incubation experiments: fungal species, growth medium, and various temperatures (17 to 40 °C). The term “O2 range” refers to the categories of different O2 levels that prevailed within the incubation flasks during incubations. “N” represents the number of observations used to determine the rates of CH4 formation, O2 consumption, and the CH4 formation to O2 consumption ratio (CH4_norm). These rates are presented as the arithmetic mean accompanied by the standard deviation. Please note that all rates are on a per flask basis because it was not possible to determine the dry weight of fungal biomass after each measurement step.
| Fungi | Medium | Temperature [°C] | O2 Range [%] | N | CH4 Formation Rate [nmol h−1] | O2 Consumption Rate [mmol h−1] | CH4_norm [10−6] |
|---|---|---|---|---|---|---|---|
| P. sapidus | beech | 27 | 0 | 8 | 0.00 ± 0.06 | 0 ± 0 | - |
| 5 to 26 | 38 | 0.48 ± 0.31 | −0.57 ± 0.17 | 0.95 ± 0.76 | |||
| beech | 27 | 14 to 94 | 4 | 0.61 ± 0.10 | −0.88 ± 0.06 | 0.70 ± 0.12 | |
| pine | 17 | 0 | 3 | 0.04 ± 0.07 | 0 ± 0 | - | |
| 0 to 5 | 3 | 0.78 ± 0.43 | −0.18 ± 0.04 | 4.18 ± 1.26 | |||
| 5 to 20.9 | 6 | 0.42 ± 0.40 | −0.18 ± 0.07 | 2.08 ± 1.23 | |||
| pine | 27 | 0 | 4 | 0.40 ± 0.05 | 0 ± 0 | - | |
| 0 to 5 | 3 | 1.15 ± 0.05 | −0.23 ± 0.002 | 4.94 ± 0.25 | |||
| 5 to 20.9 | 4 | 2.12 ± 0.58 | −0.53 ± 0.10 | 3.97 ± 0.38 | |||
| grass | 17 | 0 | 2 | 0.05 ± 0.03 | 0 ± 0 | - | |
| 0 to 5 | 2 | 0.02 ± 0.01 | −0.12 ± 0.03 | 0.19 ± 0.05 | |||
| 5 to 20.9 | 6 | 0.14 ± 0.13 | −0.16 ± 0.05 | 0.86 ± 0.62 | |||
| grass | 40 | 0 | 3 | 0.26 ± 0.09 | 0 ± 0 | - | |
| 0 to 5 | 2 | 1.60 ± 0.05 | −0.14 ± 0.01 | 11.6 ± 0.17 | |||
| 5 to 20.9 | 7 | 1.41 ± 1.11 | −0.43 ± 0.25 | 3.41 ± 1.73 | |||
| L. sulphureus | beech | 27 | 0 | 4 | −0.02 ± 0.01 | 0 ± 0 | - |
| 0 to 5 | 3 | 0.00 ± 0.03 | −0.04 ± 0.002 | −0.02 ± 0.70 | |||
| 5 to 30.6 | 12 | 0.63 ± 0.40 | −0.16 ± 0.07 | 3.76 ± 1.28 | |||
| beech | 27 | 16 to 97.5 | 4 | 0.09 ± 0.02 | 0.06 ± 0.005 | 1.56 ± 0.25 | |
| pine | 17 | 11.1 to 20.9 | 3 | 0.15 ± 0.11 | −0.03 ± 0.01 | 5.78 ± 5.20 | |
| pine | 27 | 0 | 3 | −0.06 ± 0.05 | 0 ± 0 | - | |
| 0 to 5 | 1 | 2.16 | −0.21 | 10.4 | |||
| 5 to 20.9 | 3 | 5.34 ± 0.64 | −0.39 ± 0.03 | 13.69 ± 0.97 | |||
| pine | 40 | 0 | 3 | −0.86 ± 0.03 | 0 ± 0 | - | |
| 5 to 25.8 | 5 | 1.01 ± 0.55 | −0.29 ± 0.05 | 4.87 ± 1.49 | |||
| Controls | pine | 17 | 5 to 20.9 | 3 | 0.30 ± 0.05 | −0.01 ± 0.001 | 35.68 ± 4.8 |
| pine | 27 | 5 to 20.9 | 3 | 0.91 ± 0.09 | - | - | |
| pine | 40 | 0 | 3 | 1.37 ± 0.1 | 0 ± 0 | - | |
| 5 to 20.9 | 3 | 3.26 ± 0.53 | −0.02 ± 0.004 | - | |||
| grass | 17 | 5 to 20.9 | 3 | 0.01 ± 0.005 | 0 ± 0 | - | |
| grass | 40 | 5 to 20.9 | 3 | 0.31 ± 0.01 | 0 ± 0 | - |
Beyond the dependency of fungal CH4 formation on the presence of O2, we further found that the prevailing mixing ratios of O2 in the incubation flasks influenced the CH4 formation rates by P. sapidus and L. sulphureus. This is shown in Figure 2, where CH4 formation as well as CH4_norm rates and O2 consumption rates (as negative values) are illustrated. While in all experiments, O2 consumption rates were generally higher when higher O2 mixing ratios prevailed (Table 1), this observation was more obvious for CH4 production and CH4_norm rates.
Generally, we observed differences between CH4 production rates and CH4_norm rates of P. sapidus and L. sulphureus. While CH4 production rates were similar when both fungi were grown on beech wood, L. sulphureus showed higher rates when grown on pine wood (p = 0.005). Similarly, we found that CH4_norm rates were generally higher for L. sulphureus compared with P. sapidus (p < 0.001 for beech wood and p = 0.003 for pine wood; Figure 2). For P. sapidus (except for when grown on grass at 17 °C), higher CH4_norm rates were observed when O2 levels ranged between 0 and 5% compared with higher levels between 5% and ambient (pine wood, p = 0.057; grass at 17 °C, p = 0.063; grass at 40 °C, p < 0.001; Table 1). For L. sulphureus, we observed an opposite trend, where higher CH4_norm rates prevailed in a range between 5 and 21% for beech wood (p = 0.002) and pine wood at 27 °C (Figure 2, Table 1).
In all incubations, CO2 mixing ratios demonstrated an opposite trend to O2 levels, serving as a clear indicator of the fungi’s metabolic activities. Please note that CO2 measurements were conducted less frequently than those for CH4 and O2 due to logistical reasons. During some experiments where O2 was added, CO2 concentrations exceeded ~21%, a level expected when all O2 was consumed and converted to CO2 (Supplement Text S1 and Figures S1–S3).
2.2. Fungal CH4 Production Starting at Elevated O2 Mixing Ratios of Near 100%
In another approach investigating the O2 dependency of fungal CH4 formation, both L. sulphureus and P. sapidus were grown on beech wood at a temperature of 27 °C and exposed to a starting O2 mixing ratio of approximately 95% by flushing the flasks with pure O2 (Figure 3). At the beginning of the experiment, the amount of CH4 in the incubation flasks was 27.3 ± 5.2 nmol for L. sulphureus and 16.9 ± 1.1 nmol for P. sapidus (reflecting prevailing CH4 mixing ratios of around 0.2 and 0.4 ppmv in the flasks, respectively). These values increased to 161.3 ± 23.7 nmol (2.2 ± 0.3 ppmv) and 61.6 ± 7.1 nmol (0.8 ± 0.1 ppmv) over 1055 h and 70 h, respectively, whilst O2 levels decreased to 16.6 ± 5.3% and 13.9 ± 3.5%. This corresponds to a CH4 formation rate of 0.6 ± 0.1 nmol h−1 for P. sapidus and a lower rate of 0.09 ± 0.02 nmol h−1 for L. sulphureus (p = 0.002). Interestingly, the O2 consumption rate varied substantially between the two fungal species. P. sapidus had a much higher rate accounting for −0.88 ± 0.06 mmol h−1, in contrast to L. sulphureus, which reached a considerably lower O2 consumption rate of −0.06 ± 0.001 mmol h−1 (p < 0.001). This disparity in O2 consumption directly influenced the CH4_norm rates, which were substantially higher for L. sulphureus compared with P. sapidus, accounting for 1.56 ± 0.25 (×10−6) and 0.70 ± 0.12 (×10−6), respectively (p = 0.02).
When comparing these CH4_norm rates to the experiments starting at ambient O2 levels of 21%, we found that CH4_norm rates were in a similar range for P. sapidus (0.95 ± 0.76 (×10−6)) and lower compared to L. sulphureus with 3.76 ± 1.28 (×10−6).
2.3. Temperature Dependency of Fungal CH4 Formation, O2 Consumption, and CH4_norm Rates
P. sapidus and L. sulphureus, grown on pine wood and grass (only P. sapidus), were chosen to investigate whether CH4 formation and O2 consumption, as well as CH4_norm rates, differed based on different incubation temperatures of 17 °C, 27 °C, and 40 °C. Similarly to what is described in Section 2.1 and Section 2.2, the above-mentioned rates of CH4 formation, O2 consumption, and CH4_norm showed a clear influence of prevailing O2 mixing ratios. This influence, along with that of different temperatures, is additionally presented in this section.
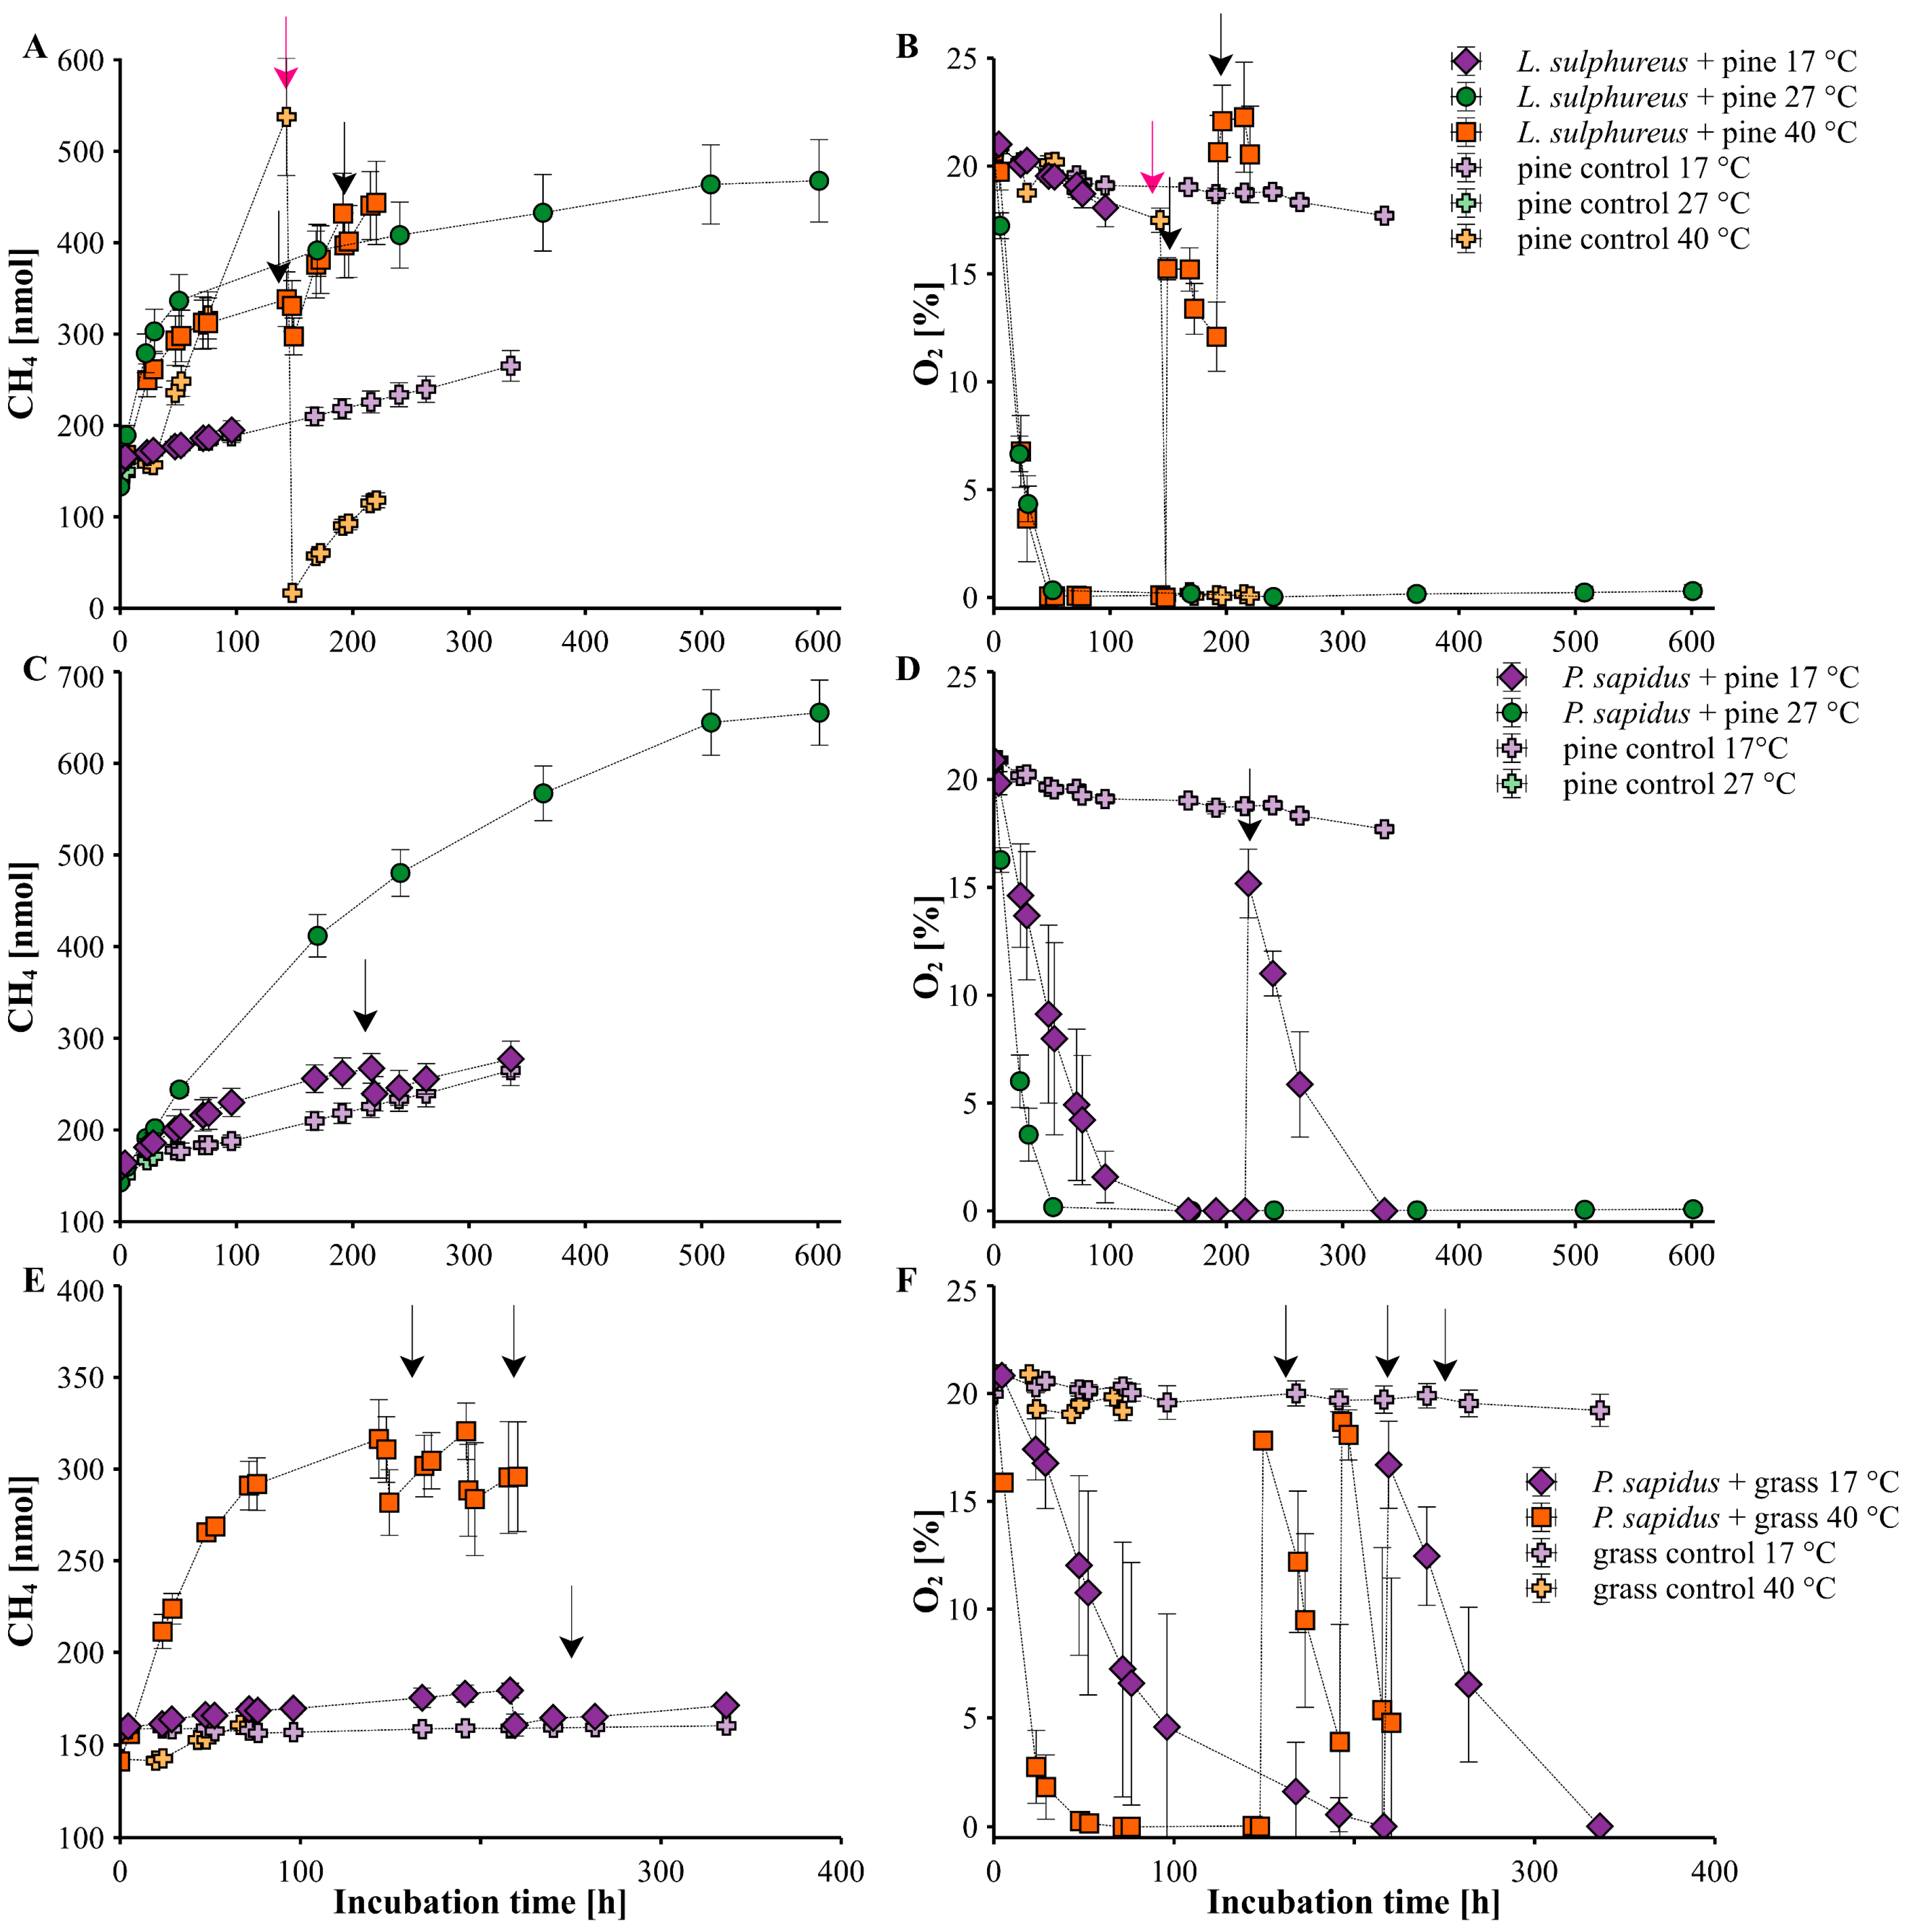
Figure 4A,B show the trend of the amount of CH4 and O2 levels of the incubation experiments of L. sulphureus grown on pine wood at three different temperatures (17, 27, 40 °C), while Figure 4C,F show the course of these parameters of P. sapidus grown on pine wood (17 °C and 40 °C) and grass (17 °C and 27 °C), respectively, along with the corresponding controls for pine wood and grass. Please note that for P. sapidus grown on pine wood and grass, only two temperature steps were available due to logistical reasons. All three incubation experiments clearly showed that CH4 production rates were highest at a temperature of 27 °C (p = 0.02 for L. sulphureus and p = 0.001 for P. sapidus grown on grass) or at 40 °C for P. sapidus grown on pine wood compared with the rates at a temperature of 17 °C (p = 0.002; Figure 5, Table 1). Similar observations were made for O2 consumption rates, which were highest at a temperature of 27 °C compared with the other temperature steps. Moreover, calculated CH4_norm rates at each O2 level (see Table 1 and Figure 5) echoed this pattern. However, we observed a more complex distribution of CH4_norm rates depending on the fungal species when we considered the different O2 levels within each incubation experiment (L. sulphureus grown on pine and beech wood and P. sapidus grown on grass, pine, and beech wood; Figure 2, Figure 4 and Figure 5). For incubations with L. sulphureus grown on pine wood at 27 °C, CH4_norm rates were higher for O2 mixing ratios between 5 and 21% (13.7 ± 0.97 (×10−6)) compared with rates below 5% O2 (10.4 (×10−6)). However, for P. sapidus grown on pine wood, CH4_norm rates were higher when O2 mixing ratios were <5% compared with O2 levels between 5 °C and 21 °C, with rates accounting for 4.18 ± 1.26 (×10−6) vs. 2.08 ± 1.23 (×10−6) and 4.94 ± 0.25 (×10−6) vs. 3.97 ± 0.38 (×10−6) for 17 °C and 27 °C, respectively. The same observation was made for P. sapidus grown on grass at a temperature of 40 °C, with values of 11.6 ± 0.17 (×10−6) vs. 3.41 ± 1.73 (×10−6) for O2 mixing ratios below 5% and above 5%, respectively. Contrastingly, at a temperature of 17 °C, P. sapidus grown on grass exhibited higher CH4_norm rates when O2 levels ranged between 5 and 21% (0.86 ± 0.62 (×10−6)) as opposed to O2 mixing ratios below 5% (0.19 ± 0.05 (×10−6)). Pine wood and grass controls showed a comparatively small increase in CH4 levels over time depending on the temperature, with CH4 formation rates ranging from 0.30 ± 0.05 to 3.36 ± 0.53 nmol h−1 for pine wood and 0.01 ± 0.001 to 0.31 ± 0.01 nmol h−1 for grass (Table 1, Text S2, and Figure S4).
3. Discussion
3.1. Dependence of Fungal CH4 Formation on O2 Levels
Despite existing studies on the growth, wood decay, and eco-physiological adaptations of xylotrophic fungi, the impacts of O2 levels on CH4 production rates and CH4_norm rates have not been explored to date [36]. Our results clearly demonstrate that fungal metabolism due to the availability of O2 is a crucial factor driving fungal CH4 production. When O2 was completely consumed by the fungi (meaning below ~0.5%, as indicated by the sensitivity of the deployed O2 sensors), CH4 formation ceased in our experiments (Figure 1 and Figure 4). This finding contradicts earlier beliefs that linked CH4 formation in wood debris to anoxic microsites and the activity of methanogenic archaea (Figure 1 and Figure 4) [20,21,22,23,37]. If methanogenic archaea would have been responsible for the observed CH4 formation in our experiments, we would have expected a strong increase in CH4 levels once O2 was depleted as anaerobic conditions are a prerequisite for methanogenic CH4 formation. Instead, we observed the opposite, as no CH4 was produced by the fungi once O2 was depleted. This finding clearly indicates that fungal CH4 formation is dependent on the occurrence of O2. However, our fungal incubations were performed under sterile conditions and excluding the activity of bacteria and archaea (see Lenhart et al. [17]). Our observation is further in line with previous findings of Schroll et al. [18] that showed that δ13C-CH4 values of fungal CH4 covers a wide range from −42 to −70 ‰, which is not exclusively indicative of methanogenic CH4 but overlaps with many other CH4 sources, such as thermogenic degradation of organic matter and other eukaryotes, such as algae and cyanobacteria [8,38].
Intriguingly, upon reintroduction of O2 to the incubation flasks, inducing aerobic metabolism, O2 consumption, and CO2 production, fungal CH4 formation promptly resumed (e.g., Figure 1B). Thus, our study distinctly establishes for the first time that aerobic CH4 formation by the investigated fungal species, P. sapidus and L. sulphureus, and likely saprotrophic fungi in general, occurs exclusively for metabolically active cells in the presence of O2. This observation is in agreement with previous results by Ernst et al. [10] showing that bacteria, such as Bacillus subtilis, produce CH4 when they are active and O2 is present. Conversely, CH4 production by this organism halts when either the cells are in a dormant state or O2 is absent. Thus, the pattern of CH4 formation, dependent on O2 levels and the metabolic activity of B. subtilis, appears to be a clear analogy to the two fungal species investigated in this study. Therefore, it seems likely that fungal CH4 was produced via a mechanism similar to that described by Ernst et al. [10] via the generation of methyl radicals by oxidative demethylation of a methylated nitrogen, sulfur, or oxygen compound in the presence of ROS and iron (II) (Figure 6).
Further exploring this dependency, we discovered that the level of O2 present in the incubation flasks significantly influenced CH4 formation by P. sapidus and L. sulphureus. In all experiments, O2 consumption rates were generally higher when higher O2 mixing ratios were present. This observation aligns with prior studies indicating that O2 levels below 0.2% strongly inhibit fungal growth [29] and O2 levels below 10% diminish wood decay activities of saprotrophic fungi [32]. Contrarily, Mukhin and Diyarova [31] found that xylotrophic basidiomycetes could completely consume O2 in their environment and withstand high CO2 levels, even up to 100%. These fungi are, therefore, facultative anaerobes that produce CO2 in O2-deprived environments. Our observations support this, as we noticed a significant increase in CO2 levels, even when O2 was entirely consumed in the incubations containing medium and fungi (Figures S1–S3). It is noteworthy, however, that CO2 mixing ratios rose more rapidly when O2 was available to the fungi.
Our study further found that O2 consumption, CH4 production, and CH4_norm rates differed substantially between the two fungal species, P. sapidus and L. sulphureus. The differences were most prominent in the O2 consumption rates, where P. sapidus exhibited much higher rates compared with L. sulphureus under similar incubation conditions. This could be due to differences in biomass, however, this parameter could not be determined within the scope of this study. Another reason could be differences in their metabolic activity, as they are different types of white rot and brown rot fungi, respectively. And, finally, the growth substrates might have impacted the observed rates. Several studies have found that fungal CH4 production, also in relation to CO2 emissions as an indicator of metabolic activity, is dependent on the growth substrate and substrate quality [17,18,27]. In our experiments, the most likely explanation for the observed differences is the different enzyme sets of L. sulphureus, as a brown rot fungus, and P. sapidus, as a white rot fungus.
Generally, there were notable differences in CH4 production rates and CH4_norm rates between these two fungal species. In line with previous studies by Lenhart et al. [17] and Schroll et al. [18], CH4 production rates were typically up to 2.5 times higher in incubations containing L. sulphureus (grown on pine) compared with those with P. sapidus grown on pine (Table 1) and similar in magnitude when both fungi were grown on beech wood. Please note that for experiments where the fungi were grown on beech wood, no wood controls could be obtained. Nevertheless, previous studies by Lenhart et al. [17] clearly showed that incubation studies with sterilized beech wood controls, analogous to this study, did not increase CH4 levels. Moreover, this observation was further validated by incubation studies in this study (see Figure 1), where no CH4 increase was observed when O2 was completely consumed, thus indicating that neither the fungal species nor the beech wood released CH4 during this experiment. However, we now demonstrate for the first time that CH4_norm rates normalized to O2 consumption also exhibited a similar trend, with L. sulphureus showing up to 2.5 times higher values than P. sapidus (Figure 2 and Figure 5).
Moreover, we observed distinct differences between P. sapidus and L. sulphureus concerning CH4_norm rates under varying O2 levels. For P. sapidus, CH4_norm rates were often higher when O2 levels ranged from 0 to 5%, compared with higher levels between 5% and ambient mixing ratios (Figure 5B,C; P. sapidus grown on pine and grass). Conversely, for L. sulphureus, higher CH4_norm rates were observed in a range between 5 and 20%. The underlying reason for this disparity remains unclear, but a potential explanation might lie in the differences in their metabolic pathways. P. sapidus, a white rot fungus, predominantly uses oxidative enzymes to decompose wood compounds, such as lignin, cellulose, and hemicellulose. In contrast, L. sulphureus, a brown rot fungus, relies on non-enzymatic oxidative systems to primarily depolymerize cellulose and, to a lesser extent, lignin, by generating ROS. Brown rot fungi deploy a mechanism dependent on Fenton-type reactions with ROS for wood decomposition [39,40,41]. However, the specific O2 requirements for both mechanisms are not well-understood. While the O2 requirement for brown rot fungi is relatively known due to the direct production of ROS, it is more complex for white rot fungi, where O2 is utilized as a substrate for the enzymes associated with wood decay [40,42,43]. This aspect requires further evaluation and could be linked to the observed differences in CH4 production and CH4_norm rates between P. sapidus and L. sulphureus.
In general, the growth and wood decay of these fungi at different O2 levels indicate that metabolic activity is closely connected to fungal CH4 formation, given that no CH4 is produced by either fungus when O2 was absent. While the exact mechanism of CH4 formation by these fungi remains elusive, initial evidence from Lenhart et al. [17], which identified methionine as a precursor of fungal CH4, suggests that the universal CH4 formation mechanism proposed by Ernst et al. [10] involving Fenton chemistry with methylated compounds and ROS likely represents a significant contributor to the observed formation of CH4 (Figure 6, upper part). Nonetheless, the potential involvement of other mechanisms, such as the halomethane-dependent pathway reported by Huang et al. [24], represents another possibility (Figure 6, lower part). This study proposes a halomethane-mediated CH4 formation mechanism in fungi, where CH4 formation starts with a methanogenic substrate and progresses through its conversion via methylated substrates and biomass. This process leads to the formation of methylated compounds, which are then ultimately converted to halomethane and methyl radicals through multiple enzymatic steps. Although demonstrated under anaerobic conditions, the activity of the relevant enzymes for this mechanism also persists under aerobic conditions, presenting another possible CH4 formation mechanism that warrants future investigation, particularly under aerobic conditions.
3.2. Influence of Temperature on Fungal CH4 Formation Dynamics
To date, there is a noticeable gap in in the understanding of the influence of the temperature on fungal CH4 formation. Previous studies have primarily focused on the growth or decomposition rates of wood via basidiomycetes, which are also critical factors for fungal CH4 emissions. Previous studies have consistently shown that both fungal growth [34] and wood decomposition rates [27,28,33] increase with rising temperature. However, it should be noted that the fungal biomass and changes during incubation experiments could not be determined during this study, and thus CH4 formation rates per unit biomass of fungi could not be calculated. Instead, we used consumption of O2 and CO2 production rates in relation to CH4 formation as an indicator for fungal metabolic activity (see Supplement Text S1 and Figures S1–S3). We observed that the highest CH4 formation and CH4_norm rates occurred at 27 °C for both of the studied fungi. This peak in activity was likely attributed to the temperature being close to the optimal metabolism [44,45]. At temperatures both lower (17 °C) and higher (40 °C) than 27 °C, a decrease in the CH4_norm rates was noted, suggesting a decline in metabolic activity, as further indicated by lower O2 consumption and CO2 production rates.
It is important to acknowledge that higher fungal biomass resulting from elevated growth rates most likely leads to increased CH4 formation. This is due to CH4 being produced by the fungus itself, as reported by Ernst et al. [10]. This study found that two fungal species produced CH4 and that elevated levels of ROS, which can increase in organisms as a stress response, even amplified the observed CH4 formation. This aligns with findings from Lenhart et al. [17] and Schroll et al. [18], which showed fungal CH4 formation independent of the presence of methanogenic archaea. Therefore, it appears that CH4 formation may be a function of not only the fungal biomass and experienced stress (ROS) levels but also the metabolic activity of the fungal species.
At 17 °C, P. sapidus grown on grass exhibited smaller CH4 production rates compared with when it was grown on pine wood, despite similar O2 consumption rates across different O2 regimes. Consequently, CH4_norm rates were much higher for P. sapidus grown on pine wood. This indicates a substrate-specific component regulating CH4 formation rates, supporting previous studies that highlighted the strong effect of fungal substrate on CH4 formation and decomposition rates [18,27]. Additionally, CH4 production rates for P. sapidus grown on grass and pine wood increased at elevated temperatures of 40 °C and 27 °C, respectively, likely due to higher metabolic activity, as indicated by increased O2 consumption rates, particularly when O2 mixing ratios exceeded 5%. This observation could also be influenced by increased stress levels, especially for P. sapidus grown on grass at 40 °C, in a similar way as the previously discussed higher CH4 formation in fungi due to increased ROS [10].
A similar pattern was noted for L. sulphureus grown on pine wood at 17 °C, 27 °C, and 40 °C. The highest CH4 production rates were found at 27 °C, which is presumably closest to the optimal fungal growth temperature, whereas the lowest CH4 formation rates at 17 °C coincided with the lowest O2 consumption rates, indicating reduced metabolic activity at this temperature compared to 27 °C and 40 °C. However, contrastingly, CH4_norm rates were in a similar range for both 17 °C and 40 °C, suggesting that while metabolic activity (inferred from O2 consumption) was higher at 40 °C, the ratio of CH4 formation to O2 consumption (CH4_norm) remained in the same range of around 3.5 (10−6). Mukhortova et al. [28] also observed that CH4 and CO2 levels clearly increased with temperature, ranging from 5 °C to 25 °C, during the decomposition of woody debris in a northern boreal forest, indicating an aerobic mechanism for CH4 formation as reported by [10,17,18], which opposes the notion of an exclusive anaerobic origin of CH4 through methanogenic archaea in anoxic microsites of these woody debris.
At various temperatures, we found that without O2, no or substantially less CH4 was emitted during our incubation experiments. Notably, CH4 formation observed in the controls was also temperature-dependent, suggesting an additional abiotic mechanism, as previously suggested by Lenhart et al. and Schroll et al. [17,18]. For the results of the control experiments and explanations of abiotic CH4 formation, we refer to the Supplement Text S2 and Figure S4. Regarding the lack of knowledge about abiotic formation of CH4 and CO2 from the studied substrates, substantially more research is required to fully comprehend this phenomenon.
4. Materials and Methods
4.1. Selected Fungi
In this study, we selected P. sapidus (Pleurotaceae, DSMZ 8266) and L. sulphureus (Polyporacaeae, DSMZ 1014) due to their documented CH4 emission properties, as reported in previous studies by Lenhart et al. and Schroll et al. [17,18]. These organisms were specifically chosen not only for their CH4 emission capabilities but also for their distinct ecological and physiological traits. P. sapidus, a white rot fungus, and L. sulphureus, a brown rot fungus, are both notable for their ease of cultivation and management in laboratory settings, making them ideal species for our experimental analysis.
4.2. Incubation Experiments
We investigated the O2 and temperature dependency of fungal CH4 emissions, focusing on the two fungal species P. sapidus and L. sulphureus. P. sapidus was cultivated on a variety of media, including beech, pine, and a grass mixture, whereas L. sulphureus was grown on beech wood and pine wood. The cultivation process involved using autoclaved wood chips from these trees and the grass mixture, sterilized at 121 °C and 2 bar pressure for 20 min (Figure 7).
These sterilized media (~350 g) were then placed into 2.7 L glass flasks (Weck, Bonn, Germany) and inoculated with pure fungal submerged cultures (50 mL), maintaining sterile conditions as described by Lenhart et al. [17]. In parallel, controls of the medium were prepared in a similar way, except for the inoculation with fungal cultures. To facilitate gas exchange, each flask was sealed with a rubber band and a glass lid, which incorporated a hole plugged with a cotton stopper. Before the beginning of the incubation period, the flasks were aerated under sterile conditions to establish the initial atmospheric ratios of CH4, O2, and CO2. Subsequently, the cotton stoppers were replaced with sterile silicone stoppers (Saint-Gobain Performance Plastics, Courbevoie, France) to limit uncontrolled gas exchange while allowing for precise gas sampling.
In order to investigate the temperature dependency of fungal CH4 emissions, the fungi were placed in a climate chamber set at three different temperatures: 17 °C, 27 °C, and 40 °C. The duration of incubation varied, extending up to ~1100 h (ca. 46 days).
Gas samplings were performed as follows. First, the pressure within the glass flasks was measured using an EX- portable pressure-measuring instrument (GHM Messtechnik GmbH, Regenstauf, Germany) with a precision of ±1%. Then, a plastic syringe (Plastikpak, NJ, USA) was used to extract 10 mL of gas for CH4 measurements and 6 mL for CO2. Measurement of CH4 and CO2 mixing ratios was performed according to the procedures detailed in Section 4.3, with atmospheric air replacing the extracted gas. Alongside gas sampling, we continuously monitored O2 concentrations within the flasks using calibrated O2 spots (Section 4.3).
Furthermore, to maintain specific O2 mixing ratios and to test the hypothesis of the O2 dependency of fungal CH4 emissions, especially in cases where O2 was depleted or fell below certain concentrations, we regulated the O2 levels in the flasks by adding pure O2 until the desired concentration (usually to atmospheric O2 levels), which was immediately controlled using the calibrated O2 spots. For the pine wood control incubated at 40 °C, CH4 formation was, in addition to ambient O2 mixing ratios, investigated without the presence of O2 by exchanging the whole headspace volume with pure helium.
4.3. Measurement of CH4, CO2, and O2 Concentrations
Mixing ratios of CH4 in this study were measured using a gas chromatograph coupled with a flame ionization detector (GC-FID; Shimadzu 14b, Kyoto, Japan). To facilitate this, sample gas was injected into the GC-FID through a six-port valve (Valco Instruments, Houston, TX, USA), which was linked to a chemical trap filled with Drierite®. This setup was crucial for drying the gas before entering the analytical system via a sample loop with a volume of 2 mL that was employed using a 20 mL plastic syringe (Plastipak BD, Franklin Lakes, NJ, USA). The GC itself was equipped with a stainless-steel column (3.175 mm in inner diameter) packed with a 60–80-mesh molecular sieve 5A (Supelco, St. Louis, MO, USA), effectively separating CH4 from other gas components in the samples. The oven temperature was maintained constantly at 125 °C. To quantify CH4 within the samples, daily measurements (ranging from 3 to 4) of two reference standards with CH4 mixing ratios of 2.192 and 9.655 ppmv were conducted.
For measuring CO2 mixing ratios, a GC coupled with a barrier discharge ionization detector (BID; Shimadzu, Kyoto, Japan) was employed. Here, 50 µL of sample gas was injected into the GC-BID via an autosampler AOC-20-i (Shimadzu, Kyoto, Japan) using a split injection method (5:1). This GC was equipped with a ShinCarbon ST packed column (80/100 mesh; length: 2 m; diameter: 0.53 mm; Shimadzu, Kyoto, Japan). The quantification of CO2 was achieved by measuring various reference standards (400 ppm, 0.5%, 10%, and 40% by volume each conducted in triplicate). As part of quality control, one reference standard was measured after every 6 to 9 single measurements.
Oxygen concentrations were determined using non-invasive optical sensors (O2 spots; PSt3 sensor type) and a Fibox 4 portable measuring instrument (both from PreSens Precision Sensing GmbH, Regensburg, Germany). These O2 spots were installed in the glass flasks before the start of the incubation experiments and calibrated using a two-point calibration with ambient air (20.9% O2) and helium (0% O2). The precision of the O2 spots is 0.4% at 20.9% O2 and 0.05% at 0.2% O2.
4.4. Calculations and Statistical Methods
In this study, all CH4 emission rates were carefully normalized against the respective O2 consumption rates to ensure the investigation of CH4 formation based on the fungal metabolism. The CH4 formation rates, based on O2 levels, were categorized into three distinct groups: 0% O2, 0–5% O2, as well as >5 to 21% O2 (for experiments with fungi grown on pine wood and grass) and >5 to 98% (for experiments with fungi grown on beech wood). This categorization was pivotal, as it was observed that below an O2 mixing ratio of 5%, there was a noticeable reduction in CH4 production.
To systematically categorize the normalized CH4 rates within these defined O2 levels for each flask, sections corresponding to the respective O2 mixing ratios were manually defined. Within these sections, CH4 emission and O2 consumption rates were calculated using linear regression analysis for all incubation experiments. Importantly, respective CH4 formation rates of the controls were subtracted from the calculated rates in the control of the respective substrate.
For each incubation experiment, arithmetic means and standard deviations were calculated to discern differences between the treatments. Furthermore, t-tests were conducted to provide statistical backing for the observations made. However, it is important to note that this study adhered to the recommendations of the American Statistical Association. Consequently, p-values and other statistical parameters were not solely relied upon as the criteria for drawing conclusions [46]. Thus, the term “statistically significant” was consciously avoided in the interpretation of the results.
5. Conclusions
This study, to our knowledge, is the first to investigate how different O2 mixing ratios and temperatures control CH4 emissions in two saprotrophic fungi, L. sulphureus and P. sapidus. We observed that CH4 formation rates are highly dependent on the prevailing O2 mixing ratios. Notably, in all of our incubation experiments, we observed that fungal CH4 formation rates diminished when O2 mixing ratios fell below approximately 0.5%. Conversely, CH4 formation increased immediately after O2 was reintroduced or when O2 levels remained above this threshold, unambiguously highlighting the role of aerobic metabolism for fungal CH4 formation. Furthermore, we found that CH4_norm rates varied based on the fungal species and their substrates, including beech wood, pine wood, and grass. These findings suggest that the investigated fungal species, and possibly also further fungal species, produce CH4, and that aerobic metabolism controlled by O2 levels is a critical factor in this process. This further challenges the previous assumption that in the fungal realm, CH4 is only formed under anoxic conditions and that saprotrophic fungi simply provide methanogenic archaea with precursor compounds via the decomposition of woody components. Additionally, our study shows that temperature has a substantial effect on fungal CH4 formation. We observed lower CH4 formation and CH4_norm rates at temperatures of 17 °C and 40 °C, while the highest rates of CH4 formation occurred at 27 °C, indicating that this temperature is closer to the optimum metabolic activity for the investigated fungi.
Thus, our research clearly demonstrates that both the availability of O2 and temperature are key in controlling fungal CH4 emissions. From an environmental perspective, temperature increases due to climate change could significantly increase fungal CH4 emissions through enhanced fungal growth and biomass. Therefore, understanding CH4 formation and its controlling factors, especially temperature and O2 levels, is crucial for assessing the role of fungal CH4 emissions regarding global CH4 fluxes. Additionally, exploring these fungal CH4 dynamics in various environments, such as forests, soils, and aquatic systems, ref. [47] under both aerobic and anaerobic conditions is necessary to better understand their impact on carbon and greenhouse gas dynamics.
Supplementary Materials
The following supporting information can be downloaded at: https://www.mdpi.com/article/10.3390/methane3020015/s1, Text S1: Oxygen and temperature dependency of CO2 mixing ratios during fungal incubations; Figure S1: Changes in CH₄ amounts (A,D) as well as O₂ (B,E) and CO2 levels (C,F), respectively, in the flasks during incubation of P. sapidus grown on pine wood at 17 and 27 °C. Black arrows indicate the points of O₂ addition to the individual flasks containing fungi. Data points represent the arithmetic mean and standard deviation of replicate experiments (n = 3 to 4). Figure S2: Changes in CH₄ amounts (A,D) as well as O₂ (B,E) and CO2 levels (C,F), respectively, in the flasks during incubation of P. sapidus grown on grass at 17 and 40 °C. Black arrows indicate the points of O₂ addition to the individual flasks containing fungi. Data points represent the arithmetic mean and standard deviation of replicate experiments (n = 3 to 4); Figure S3: Changes in CH₄ amounts (A,D,G) as well as O₂ (B,E,H) and CO2 levels (C,F,I), respectively, in the flasks during incubation of L. sulphureus grown on pine wood at 17, 27, and 40 °C. Black arrows indicate the points of O₂ addition to the individual flasks containing fungi, while pink arrows indicate O2 removal by flushing of the incubation flask with helium. Data points represent the arithmetic mean and standard deviation of replicate experiments (n = 3 to 4); Text S2: Changes in CH4, O2, and CO2 levels during incubation of pine wood and grass controls; Figure S4: Changes in CH₄ amounts as well as O₂ and CO2 levels in the flasks during control incubation of pine wood at 17, 27, and 40 °C and grass at 17 and 40 °C. The pink arrow indicates O2 removal by flushing of the incubation flask with helium. Data points represent the arithmetic mean and standard deviation of replicate experiments (n = 3 to 4). Refs. [48,49,50,51,52,53,54,55,56] have been cited in the Supplementary Material.
Author Contributions
M.S.: conceptualization, methodology, formal analysis, investigation, writing—original draft, writing—review and editing, visualization. K.L.: conceptualization, methodology, resources, writing—review and editing, supervision, funding acquisition. T.B.: formal analysis, investigation. P.H.: formal analysis, investigation. A.R.: formal analysis, investigation. S.S.: formal analysis, investigation. F.K.: conceptualization, methodology, resources, writing—review and editing, supervision, project administration, funding acquisition. All authors have read and agreed to the published version of the manuscript.
Funding
Financial support received by the Deutsche Forschungsgemeinschaft/German Research Foundation (DFG grant nos. KE 884/8-2, KE 884/16-2 and LE3381/1-1).
Institutional Review Board Statement
Not applicable.
Informed Consent Statement
Not applicable.
Data Availability Statement
The raw data supporting the conclusions of this article will be made available by the authors upon request.
Acknowledgments
We thank Holger Zorn for providing the fungal species as well as Elena Benkert for support with the cultivation of the fungi. We are grateful to the Biogeochemistry group of the Institute of Earth Sciences at Heidelberg University for their technical support in this study.
Conflicts of Interest
The authors declare no conflicts of interest.
References
- Arias, P.A.; Bellouin, N.; Coppola, E.; Jones, R.G.; Krinner, G.; Marotzke, J.; Naik, V.; Palmer, M.D.; Plattner, G.K.; Rogelj, J.; et al. Intergovernmental Panel on Climate Change (IPCC). Technical summary. In Climate Change 2021: The Physical Science Basis. Contribution of Working Group I to the Sixth Assessment Report of the Intergovernmental Panel on Climate Change; Cambridge University Press: Cambridge, UK, 2023. [Google Scholar] [CrossRef]
- Kirschke, S.; Bousquet, P.; Ciais, P.; Saunois, M.; Canadell, J.G.; Dlugokencky, E.J.; Bergamaschi, P.; Bergmann, D.; Blake, D.R.; Bruhwiler, L.; et al. Three Decades of Global Methane Sources and Sinks. Nat. Geosci. 2013, 6, 813–823. [Google Scholar] [CrossRef]
- Saunois, M.; Stavert, A.R.; Poulter, B.; Bousquet, P.; Canadell, J.G.; Jackson, R.B.; Raymond, P.A.; Dlugokencky, E.J.; Houweling, S.; Patra, P.K.; et al. The Global Methane Budget 2000–2017. Earth Syst. Sci. Data 2020, 12, 1561–1623. [Google Scholar] [CrossRef]
- Keppler, F.; Hamilton, J.T.G.; Braß, M.; Röckmann, T. Methane Emissions from Terrestrial Plants under Aerobic Conditions. Nature 2006, 439, 187–191. [Google Scholar] [CrossRef]
- Lenhart, K.; Weber, B.; Elbert, W.; Steinkamp, J.; Clough, T.; Crutzen, P.; Pöschl, U.; Keppler, F. Nitrous Oxide and Methane Emissions from Cryptogamic Covers. Glob. Chang. Biol. 2015, 21, 3889–3900. [Google Scholar] [CrossRef]
- Lenhart, K.; Klintzsch, T.; Langer, G.; Nehrke, G.; Bunge, M.; Schnell, S.; Keppler, F. Evidence for Methane Production by the Marine Algae Emiliania Huxley. Biogeosciences 2016, 13, 3163–3174. [Google Scholar] [CrossRef]
- Klintzsch, T.; Langer, G.; Nehrke, G.; Wieland, A.; Lenhart, K.; Keppler, F. Methane Production by Three Widespread Marine Phytoplankton Species: Release Rates, Precursor Compounds, and Potential Relevance for the Environment. Biogeosciences 2019, 16, 4129–4144. [Google Scholar] [CrossRef]
- Bižić, M.; Klintzsch, T.; Ionescu, D.; Hindiyeh, M.Y.; Günthel, M.; Muro-Pastor, A.M.; Eckert, W.; Urich, T.; Keppler, F.; Grossart, H.-P. Aquatic and Terrestrial Cyanobacteria Produce Methane. Sci. Adv. 2020, 6, eaax5343. [Google Scholar] [CrossRef] [PubMed]
- Wishkerman, A.; Greiner, S.; Ghyczy, M.; Boros, M.; Rausch, T.; Lenhart, K.; Keppler, F. Enhanced Formation of Methane in Plant Cell Cultures by Inhibition of Cytochrome c Oxidase. Plant. Cell Environ. 2011, 34, 457–464. [Google Scholar] [CrossRef] [PubMed]
- Ernst, L.; Steinfeld, B.; Barayeu, U.; Klintzsch, T.; Kurth, M.; Grimm, D.; Dick, T.P.; Rebelein, J.G.; Bischofs, I.B.; Keppler, F. Methane Formation Driven by Reactive Oxygen Species across All Living Organisms. Nature 2022, 603, 482–487. [Google Scholar] [CrossRef]
- Boros, M.; Keppler, F. Methane Production and Bioactivity-A Link to Oxido-Reductive Stress. Front. Physiol. 2019, 10, 1244. [Google Scholar] [CrossRef]
- Ghyczy, M.; Torday, C.; Kaszaki, J.; Szabó, A.; Czóbel, M.; Boros, M. Hypoxia-Induced Generation of Methane in Mitochondria and Eukaryotic Cells—An Alternative Approach to Methanogenesis. Cell. Physiol. Biochem. 2008, 21, 251–258. [Google Scholar] [CrossRef] [PubMed]
- Keppler, F.; Boros, M.; Polag, D. Radical-Driven Methane Formation in Humans Evidenced by Exogenous Isotope-Labeled DMSO and Methionine. Antioxidants 2023, 12, 1381. [Google Scholar] [CrossRef] [PubMed]
- Polag, D.; Keppler, F. Effect of Immune Responses on Breath Methane Dynamics. J. Breath Res. 2023, 17, 046005. [Google Scholar] [CrossRef] [PubMed]
- Polag, D.; Keppler, F. Global Methane Emissions from the Human Body: Past, Present and Future. Atmos. Environ. 2019, 214, 116823. [Google Scholar] [CrossRef]
- Keppler, F.; Schiller, A.; Ehehalt, R.; Greule, M.; Hartmann, J.; Polag, D. Stable Isotope and High Precision Concentration Measurements Confirm That All Humans Produce and Exhale Methane. J. Breath Res. 2016, 10, 016003. [Google Scholar] [CrossRef] [PubMed]
- Lenhart, K.; Bunge, M.; Ratering, S.; Neu, T.R.; Schüttmann, I.; Greule, M.; Kammann, C.; Schnell, S.; Müller, C.; Zorn, H.; et al. Evidence for Methane Production by Saprotrophic Fungi. Nat. Commun. 2012, 3, 1046. [Google Scholar] [CrossRef]
- Schroll, M.; Keppler, F.; Greule, M.; Eckhardt, C.; Zorn, H.; Lenhart, K. The Stable Carbon Isotope Signature of Methane Produced by Saprotrophic Fungi. Biogeosciences 2020, 17, 3891–3901. [Google Scholar] [CrossRef]
- Swift, M.; Heal, O.; Anderson, J. Decomposition in Terrestrial Ecosystems; University of California Press: Berkley, CA, USA, 1979; Volume 5. [Google Scholar]
- Mukhin, V.A.; Voronin, P.Y. Methanogenic Activity of Woody Debris. Russ. J. Ecol. 2009, 40, 149–153. [Google Scholar] [CrossRef]
- Mukhin, V.A.; Voronin, P.Y. Methane Emission during Wood Fungal Decomposition. Dokl. Biol. Sci. 2007, 413, 159–160. [Google Scholar] [CrossRef]
- Feng, H.; Guo, J.; Ma, X.; Han, M.; Kneeshaw, D.; Sun, H.; Malghani, S.; Chen, H.; Wang, W. Methane Emissions May Be Driven by Hydrogenotrophic Methanogens Inhabiting the Stem Tissues of Poplar. New Phytol. 2022, 233, 182–193. [Google Scholar] [CrossRef]
- Hietala, A.; Dörsch, P.; Kvaalen, H.; Solheim, H. Carbon Dioxide and Methane Formation in Norway Spruce Stems Infected by White-Rot Fungi. Forests 2015, 6, 3304–3325. [Google Scholar] [CrossRef]
- Huang, X.; Liu, X.; Xue, Y.; Pan, B.; Xiao, L.; Wang, S.; Lever, M.A.; Hinrichs, K.-U.; Inagaki, F.; Liu, C. Methane Production by Facultative Anaerobic Wood-Rot Fungi via a New Halomethane-Dependent Pathway. Microbiol. Spectr. 2022, 10, e01700-22. [Google Scholar] [CrossRef] [PubMed]
- McNally, K.J.; Harper, D.B. Methylation of Phenol by Chloromethane in the Fungus Phellinus Pomaceus. J. Gen. Microbiol. 1991, 137, 1029–1032. [Google Scholar] [CrossRef]
- Kipping, L.; Gossner, M.M.; Koschorreck, M.; Muszynski, S.; Maurer, F.; Weisser, W.W.; Jehmlich, N.; Noll, M. Emission of CO2 and CH4 From 13 Deadwood Tree Species Is Linked to Tree Species Identity and Management Intensity in Forest and Grassland Habitats. Glob. Biogeochem. Cycles 2022, 36, e2021GB007143. [Google Scholar] [CrossRef]
- Venugopal, P.; Junninen, K.; Linnakoski, R.; Edman, M.; Kouki, J. Climate and Wood Quality Have Decayer-Specific Effects on Fungal Wood Decomposition. For. Ecol. Manag. 2016, 360, 341–351. [Google Scholar] [CrossRef]
- Mukhortova, L.; Pashenova, N.; Meteleva, M.; Krivobokov, L.; Guggenberger, G. Temperature Sensitivity of CO2 and CH4 Fluxes from Coarse Woody Debris in Northern Boreal Forests. Forests 2021, 12, 624. [Google Scholar] [CrossRef]
- Scheffer, T.C. O2 Requirements for Growth and Survival of Wood-Decaying and Sapwood-Staining Fungi. Can. J. Bot. 1986, 64, 1957–1963. [Google Scholar] [CrossRef]
- Tavzes, C.; Pohleven, F.; Koestler, R.J. Effect of Anoxic Conditions on Wood-Decay Fungi Treated with Argon or Nitrogen. Int. Biodeterior. 2001, 47, 225–231. [Google Scholar] [CrossRef]
- Mukhin, V.A.; Diyarova, D.K. Eco-Physiological Adaptations of the Xylotrophic Basidiomycetes Fungi to CO2 and O2 Mode in the Woody Habitat. JoF 2022, 8, 1296. [Google Scholar] [CrossRef]
- Highley, T.L.; Bar-Lev, S.S.; Kirk, T.K.; Larsen, M.J. Influence of O2 and CO2 on Wood Decay by Heartrot and Saprot Fungi. Phytopathology 1982, 73, 630–633. [Google Scholar] [CrossRef]
- A’Bear, A.D.; Jones, T.H.; Kandeler, E.; Boddy, L. Interactive Effects of Temperature and Soil Moisture on Fungal-Mediated Wood Decomposition and Extracellular Enzyme Activity. Soil Biol. Biochem. 2014, 70, 151–158. [Google Scholar] [CrossRef]
- Meier, C.L.; Rapp, J.; Bowers, R.M.; Silman, M.; Fierer, N. Fungal Growth on a Common Wood Substrate across a Tropical Elevation Gradient: Temperature Sensitivity, Community Composition, and Potential for above-Ground Decomposition. Soil Biol. Biochem. 2010, 42, 1083–1090. [Google Scholar] [CrossRef]
- Harmon, M.E.; Fasth, B.G.; Yatskov, M.; Kastendick, D.; Rock, J.; Woodall, C.W. Release of Coarse Woody Detritus-Related Carbon: A Synthesis across Forest Biomes. Carbon Balance Manag. 2020, 15, 1. [Google Scholar] [CrossRef]
- Liu, L.-Y.; Xie, G.-J.; Ding, J.; Liu, B.-F.; Xing, D.-F.; Ren, N.-Q.; Wang, Q. Microbial Methane Emissions from the Non-Methanogenesis Processes: A Critical Review. Sci. Total Environ. 2022, 806, 151362. [Google Scholar] [CrossRef]
- Epron, D.; Mochidome, T.; Tanabe, T.; Dannoura, M.; Sakabe, A. Variability in Stem Methane Emissions and Wood Methane Production of Different Tree Species in a Cold Temperate Mountain Forest. Ecosystems 2023, 26, 784–799. [Google Scholar] [CrossRef]
- Klintzsch, T.; Geisinger, H.; Wieland, A.; Langer, G.; Nehrke, G.; Bizic, M.; Greule, M.; Lenhart, K.; Borsch, C.; Schroll, M.; et al. Stable Carbon Isotope Signature of Methane Released From Phytoplankton. Geophys. Res. Lett. 2023, 50, e2023GL103317. [Google Scholar] [CrossRef]
- Grinhut, T.; Hadar, Y.; Chen, Y. Degradation and Transformation of Humic Substances by Saprotrophic Fungi: Processes and Mechanisms. Fungal Biol. Rev. 2007, 21, 179–189. [Google Scholar] [CrossRef]
- Valášková, V.; Baldrian, P. Degradation of Cellulose and Hemicelluloses by the Brown Rot Fungus Piptoporus Betulinus—Production of Extracellular Enzymes and Characterization of the Major Cellulases. Microbiology 2006, 152, 3613–3622. [Google Scholar] [CrossRef]
- Hammel, K.E.; Kapich, A.N.; Jensen, K.A.; Ryan, Z.C. Reactive Oxygen Species as Agents of Wood Decay by Fungi. Enzym. Microb. Technol. 2002, 30, 445–453. [Google Scholar] [CrossRef]
- Zhu, Y.; Plaza, N.; Kojima, Y.; Yoshida, M.; Zhang, J.; Jellison, J.; Pingali, S.V.; O’Neill, H.; Goodell, B. Nanostructural Analysis of Enzymatic and Non-Enzymatic Brown Rot Fungal Deconstruction of the Lignocellulose Cell Wall. Front. Microbiol. 2020, 11, 1389. [Google Scholar] [CrossRef]
- Beltrán-Flores, E.; Tayar, S.; Blánquez, P.; Sarrà, M. Effect of Dissolved Oxygen on the Degradation Activity and Consumption Capacity of White-Rot Fungi. J. Water Process. Eng. 2023, 55, 104105. [Google Scholar] [CrossRef]
- Sardar, H.; Ali, M.A.; Ayyub, C.M.; Ahmad, R. Effects of Different Culture Media, Temperature and pH Levels on the Growth of Wild and Exotic Pleurotus Species. Pak. J. Phytopathol. 2015, 27, 139–145. [Google Scholar]
- Luangharn, T.; Karunarathna, S.C.; Hyde, K.D.; Chukeatirote, E. Optimal Conditions of Mycelia Growth of Laetiporus Sulphureus Sensu Lato. Mycology 2014, 5, 221–227. [Google Scholar] [CrossRef]
- Wasserstein, R.L.; Schirm, A.L.; Lazar, N.A. Moving to a World Beyond “p < 0.05”. Am. Stat. 2019, 73, 1–19. [Google Scholar] [CrossRef]
- Grossart, H.-P.; Van Den Wyngaert, S.; Kagami, M.; Wurzbacher, C.; Cunliffe, M.; Rojas-Jimenez, K. Fungi in Aquatic Ecosystems. Nat. Rev. Microbiol. 2019, 17, 339–354. [Google Scholar] [CrossRef]
- McLeod, A.R.; Fry, S.C.; Loake, G.J.; Messenger, D.J.; Reay, D.S.; Smith, K.A.; Yun, B. Ultraviolet Radiation Drives Methane Emissions from Terrestrial Plant Pectins. New Phytol. 2008, 180, 124–132. [Google Scholar] [CrossRef]
- Vigano, I.; Weelden, H.V.; Holzinger, R.; Keppler, F.; Röckmann, T. Effect of UV Radiation and Temperature on the Emission of Methane from Plant Biomass and Structural Components. Biogeosciences 2008, 5, 937–947. [Google Scholar] [CrossRef]
- Ernst, L.; Barayeu, U.; Hädeler, J.; Dick, T.P.; Klatt, J.M.; Keppler, F.; Rebelein, J.G. Methane Formation Driven by Light and Heat Prior to the Origin of Life and Beyond. Nat. Commun. 2023, 14, 4364. [Google Scholar] [CrossRef]
- Keppler, F.; Hamilton, J.T.G.; McRoberts, W.C.; Vigano, I.; Braß, M.; Röckmann, T. Methoxyl Groups of Plant Pectin as a Precursor of Atmospheric Methane: Evidence from Deuterium Labelling Studies. New Phytol. 2008, 178, 808–814. [Google Scholar] [CrossRef] [PubMed]
- Althoff, F.; Jugold, A.; Keppler, F. Methane Formation by Oxidation of Ascorbic Acid Using Iron Minerals and Hydrogen Peroxide. Chemosphere 2010, 80, 286–292. [Google Scholar] [CrossRef] [PubMed]
- Comba, P.; Kerscher, M.; Krause, T.; Schöler, H.F. Iron-Catalysed Oxidation and Halogenation of Organic Matter in Nature. Environ. Chem. 2015, 12, 381. [Google Scholar] [CrossRef]
- Benzing, K.; Comba, P.; Martin, B.; Pokrandt, B.; Keppler, F. Nonheme Iron-Oxo-Catalyzed Methane Formation from Methyl Thioethers: Scope, Mechanism, and Relevance for Natural Systems. Chem. A Eur. J. 2017, 23, 10465–10472. [Google Scholar] [CrossRef]
- Althoff, F.; Benzing, K.; Comba, P.; McRoberts, C.; Boyd, D.R.; Greiner, S.; Keppler, F. Abiotic Methanogenesis from Organosulphur Compounds under Ambient Conditions. Nat. Commun. 2014, 5, 4205. [Google Scholar] [CrossRef]
- Hädeler, J.; Velmurugan, G.; Lauer, R.; Radhamani, R.; Keppler, F.; Comba, P. Natural Abiotic Iron-Oxido-Mediated Formation of C1 and C2 Compounds from Environmentally Important Methyl-Substituted Substrates. J. Am. Chem. Soc. 2023, 145, 24590–24602. [Google Scholar] [CrossRef]
Figure 1.
Amount of CH₄ and the mixing ratio of O₂ in the incubation flasks of (A) L. sulphureus and (B) P. sapidus grown on beech wood. Arrows indicate the points of O₂ addition to the individual flasks during incubation. Data points represent the arithmetic mean and standard deviation (n = 4).
Figure 1.
Amount of CH₄ and the mixing ratio of O₂ in the incubation flasks of (A) L. sulphureus and (B) P. sapidus grown on beech wood. Arrows indicate the points of O₂ addition to the individual flasks during incubation. Data points represent the arithmetic mean and standard deviation (n = 4).

Figure 2.
CH₄ production and O₂ consumption, along with CH₄_norm rates at different O₂ levels of L. sulphureus (left panel) and P. sapidus (right panel) grown on beech wood. The bars represent the arithmetic mean and standard deviation of observations during replicate experiments (n = 4, N = 3 to 12, see Table 1).

Figure 3.
Amount of CH₄ and the mixing ratio of O₂ in the incubation flasks of (A) L. sulphureus and (B) P. sapidus grown on beech wood at 27 °C with incubation starting at 98% and 95% O₂, respectively. Data points represent the arithmetic mean and standard deviation of replicate experiments (n = 4).

Figure 4.
Changes in CH₄ amounts and O₂ levels in the flasks during incubation of (A,B) L. sulphureus grown on pine wood at 17, 27, and 40 °C, (C,D) P. sapidus grown on pine wood at 17 and 27 °C, and (E,F) P. sapidus grown on grass at 17 and 40 °C. Black arrows indicate the points of O₂ addition to the individual flasks containing fungi, while pink arrows indicate O2 removal by flushing of the incubation flask with helium. Data points represent the arithmetic mean and standard deviation of replicate experiments (n = 3 to 4).

Figure 5.
CH₄ production and O₂ consumption, along with CH₄_norm rates at varying O₂ levels (0 to 21%) and temperatures (17, 27, 40 °C), of (A) L. sulphureus grown on pine wood and (B) P. sapidus grown on pine wood and (C) grass. Bars represent the arithmetic mean and standard deviation of observations during replicate experiments (n = 3 to 4, N = 2 to 6, see Table 1).

Figure 6.
Overview of potential mechanisms for fungal CH4 formation, adapted after Ernst et al. [10] (upper part) and Huang et al. [24] (lower part). The upper part illustrates the mechanisms proposed for CH4 formation driven by reactive oxygen species (ROS) in living systems, which involves the production of methyl radicals via Fenton chemistry from methylated compounds. The lower part depicts the mechanism proposed for halomethane-mediated CH4 formation. This process begins with a methanogenic substrate and progresses through its conversion to methylated compounds via multiple enzymatic steps (blue boxes, MCT = methyl chloride transferase, DH = dehalogenase), leading to the generation of halomethanes (X− = Cl−, I−, Br−) and, ultimately, methyl radicals.

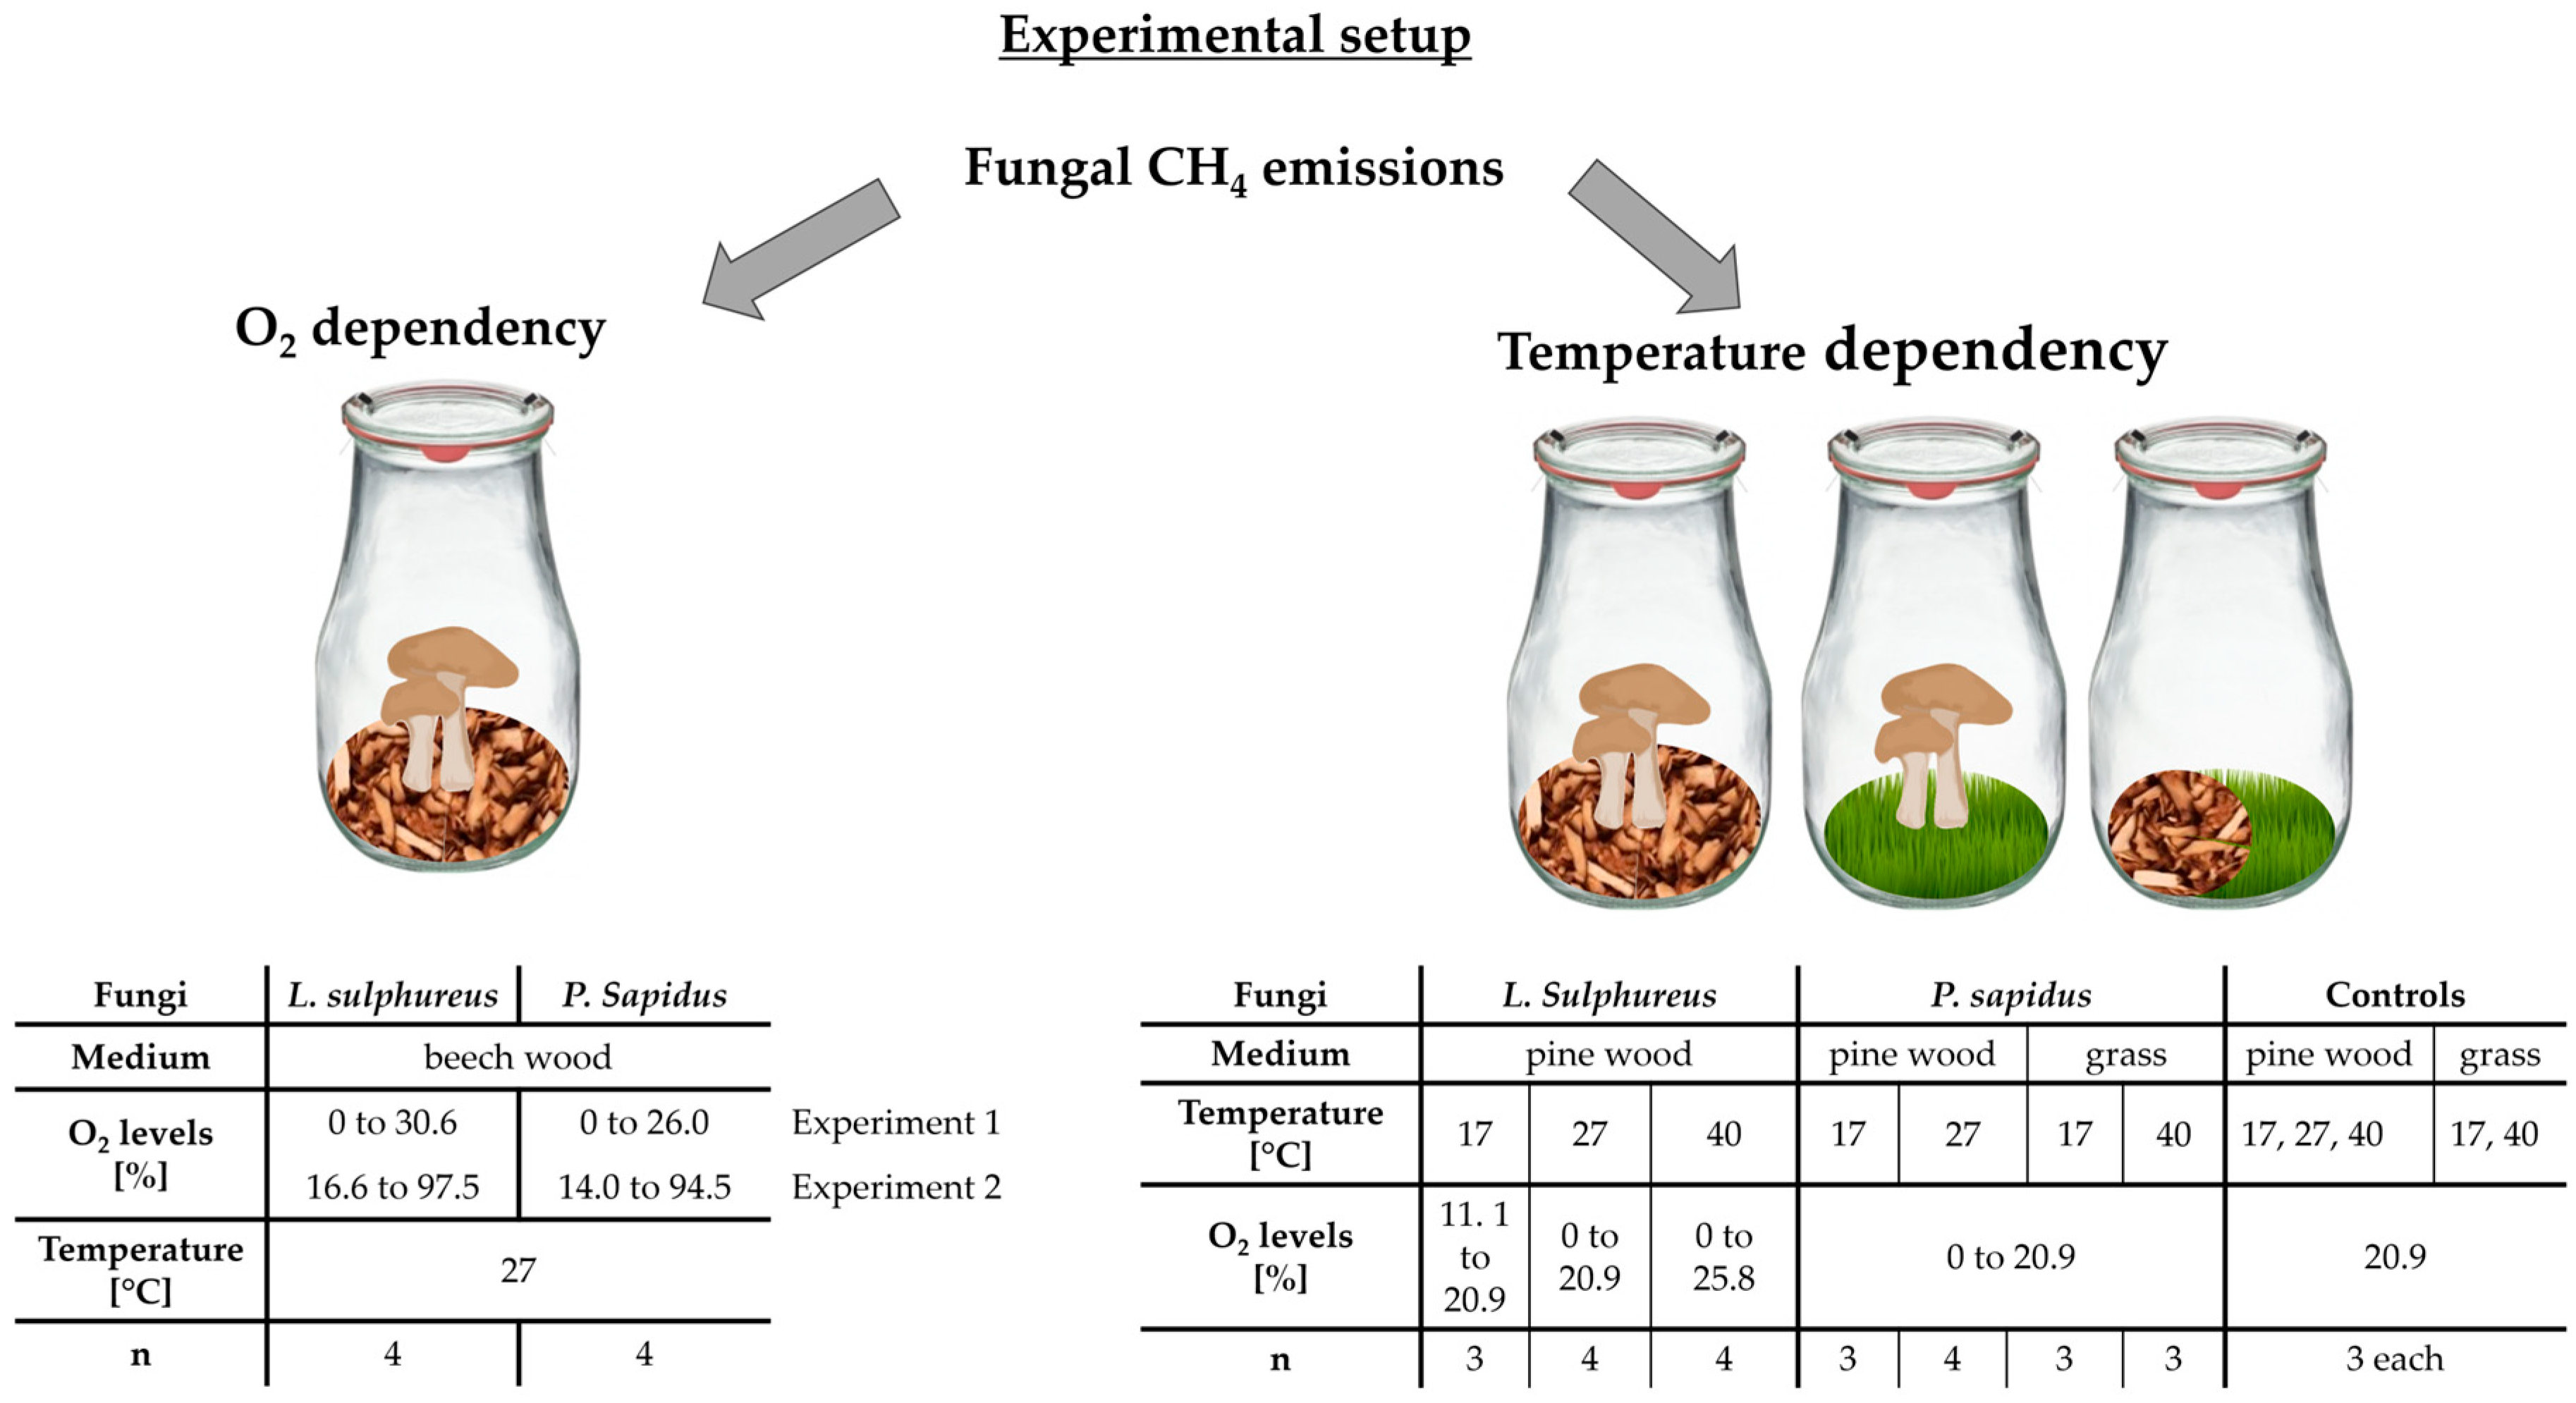
Figure 7.
Experimental setup for investigating the O2 and temperature dependency of fungal CH4 formation. Fungal CH4 formation was examined through concentration measurements in incubation flasks containing fungi L. sulphureus or P. sapidus grown on beech wood, pine wood, or grass under varying O2 levels (left column) and incubation temperatures of 17 °C, 27 °C, or 40 °C (right column). “n” represents the number of replicate experiments.

Disclaimer/Publisher’s Note: The statements, opinions and data contained in all publications are solely those of the individual author(s) and contributor(s) and not of MDPI and/or the editor(s). MDPI and/or the editor(s) disclaim responsibility for any injury to people or property resulting from any ideas, methods, instructions or products referred to in the content. |
© 2024 by the authors. Licensee MDPI, Basel, Switzerland. This article is an open access article distributed under the terms and conditions of the Creative Commons Attribution (CC BY) license (https://creativecommons.org/licenses/by/4.0/).
Share and Cite
MDPI and ACS Style
Schroll, M.; Lenhart, K.; Bender, T.; Hötten, P.; Rudolph, A.; Sörensen, S.; Keppler, F. Fungal Methane Production Controlled by Oxygen Levels and Temperature. Methane 2024, 3, 257-275. https://doi.org/10.3390/methane3020015
AMA Style
Schroll M, Lenhart K, Bender T, Hötten P, Rudolph A, Sörensen S, Keppler F. Fungal Methane Production Controlled by Oxygen Levels and Temperature. Methane. 2024; 3(2):257-275. https://doi.org/10.3390/methane3020015
Chicago/Turabian StyleSchroll, Moritz, Katharina Lenhart, Thomas Bender, Piet Hötten, Alexander Rudolph, Sven Sörensen, and Frank Keppler. 2024. "Fungal Methane Production Controlled by Oxygen Levels and Temperature" Methane 3, no. 2: 257-275. https://doi.org/10.3390/methane3020015