
Trade-Related Government Expenditure and Developing Countries’ Participation in Global Value Chains


World Trade Organization, Rue de Lausanne 154, CH-1211 Geneva, Switzerland
Commodities 2024, 3(1), 1-18; https://doi.org/10.3390/commodities3010001
Submission received: 19 October 2023
/
Revised: 6 December 2023
/
Accepted: 12 December 2023
/
Published: 20 December 2023
(This article belongs to the Special Issue Uncertainty, Economic Risk and Commodities Markets)
Abstract
:The effect of trade-related government expenditure on backward and forward participation in global value chains (GVCs) is at the heart of the present analysis. The latter builds on an unbalanced panel dataset of 74 developing countries over the annual period from 2005 to 2018. It has used several estimators, the primary one being the Quantile via Moments approach. The outcomes suggest that trade-related government expenditure exerts no significant effect on countries’ forward participation in GVCs. At the same time, countries located in the 20th to 90th quantiles experience a positive and significant effect of trade-related government expenditure on backward participation in GVCs, with the magnitude of this positive effect being larger for countries in the upper quantiles than for countries in the lower quantiles. The least integrated countries into the backward participation in GVCs (i.e., those in the 10th quantile) experience no significant effect of trade-related government expenditure on backward participation in GVCs. Interestingly, expenditure in favour of developing economic infrastructure, and expenditure for enhancing productive capacities reinforce each other in positively affecting backward GVC participation by countries located in the upper quantiles (i.e., the 50th to 90th quantiles). However, the interaction between these two types of trade-related government expenditure does not influence countries’ forward participation in GVCs. These findings shed light on the importance of trade-related expenditure for enhancing developing countries’ participation in backward GVCs.
Keywords:
trade-related government expenditure; participation in global value chains; developing countriesJEL Classification:
F14; F15; H541. Introduction
Does trade-related government expenditure affect the participation of developing countries in global value chains (GVCs)? This topic is at the heart of the present analysis.
We define trade-related government expenditure as the government expenditure that covers a variety of economic areas, including agriculture, fishing, forestry, and hunting; mining, manufacturing, and construction; transport; communication; and fuel and energy. These areas are directly related to trade (e.g., [1]). According to [2] (p. 3), a global value chain (GVC) consists of a series of stages involved in producing a product or service that is sold to consumers, with each stage adding value, and with at least two stages being produced in different countries. A firm participates in a GVC if it produces at least one stage in a GVC. Participation in GVCs can be captured either through a backward participation or a forward participation. The backward participation in GVCs indicates a country’s engagement in GVCs as a “seller”, and captures the foreign value-added that is embodied in gross exports. The forward participation in GVCs reflects a country’s participation in GVCs as a “buyer”, and captures the domestic value added (used as intermediate input) in other countries’ value-added exports.
While there are many studies on the determinants of participation in GVCs (e.g., [3,4,5,6,7,8,9,10,11]), we are not aware of a study that has explored the effect of government expenditure on the participation in GVCs. The present study aims to fill this void in the literature by investigating whether trade-related government expenditure affects developing countries’ participation in GVCs. The analysis is carried out at the aggregate level—that is, by using a country-year analytical framework, and not a sectoral nor firm level analytical framework.
The benefits of participation in GVCs by developing countries have been well emphasized in the literature (e.g., Ignatenko et al., 2019; World Bank, 2020). For example, GVC participation positively affects labour productivity in low-income countries (e.g., [12]); fosters economic upgrading, including through greater developing countries productivity growth in the formal manufacturing sector (e.g., [13,14]); promotes social upgrading (e.g., [15]); contributes to lower within-country income inequality (e.g., [16,17]); promotes economic growth (e.g., [9,18]); reduces poverty (e.g., [18,19,20]); and can be beneficial for the acceptability, developability, and sustainability of the energy system (e.g., [21]).
Backward GVC participation (the use of imported inputs to produce goods for exports) is likely to be more relevant for the economies of developing countries that tend to export primary commodities as well as labour-intensive products. This is because for these countries, forward GVC participation entails the export of raw commodities and intermediate inputs to foreign countries that will process them (e.g., [22]). Along the same lines, ref. [23] have found empirically that backward GVC participation exerts a greater (and more robust) positive effect on domestic productivity than forward GVC participation.
Our first and main hypothesis is that trade-related government expenditure would help reduce trade costs, and consequently contribute to enhancing countries’ overall participation in GVCs, including their backward participation in GVCs. We also postulate a second hypothesis that both trade-related government expenditure for building economic infrastructure and trade-related government expenditure for enhancing productive capacities could interact in positively affecting countries’ participation in GVCs, in particular their backward GVC participation.
The empirical analysis covers 74 developing countries over the period from 2005 to 2018, and uses the Method of Moments Quantile Regression (MMQR) with fixed effects approach (also referred to as “Quantile via Moments”) developed by Machado and Santos Silva (2019). It provides support for our two hypotheses. We obtain that trade-related government expenditure fosters backward participation in GVCs, but exerts no significant effect on forward participation in GVCs. In particular, while trade-related government expenditure exerts no significant effect on countries that have the lowest level of backward participation in GVCs, its effect is positive and significant on backward GVC participation, and the magnitude of this effect increases as we move to countries with the highest degrees of backward participation in GVCs. On another note, we find that the interaction between trade-related government expenditure for economic infrastructure and trade-related government expenditure for productive capacities does affect significantly forward participation in GVCs. However, these two types of trade-related government expenditure reinforce each other in positively affecting the backward GVC participation by countries located in the upper quantiles (i.e., from the 50th to the 90th quantiles) of the distribution of the indicator of countries’ backward participation in GVCs.
The remaining part of the paper is structured around six sections. Section 2 provides a theoretical discussion on the effect of trade-related government expenditure on countries’ participation in GVCs. Section 3 lays down the model used to empirically test our theoretical hypotheses. Section 4 briefly presents an analysis of data concerning our main variables of interest. Section 5 presents the econometric approach used in the analysis, and Section 6 interprets the empirical outcomes. Section 7 concludes.
2. Theoretical Discussion of the Effect of Trade-Related Government Expenditure on GVC Participation
Trade-related government expenditure on infrastructure (including on areas such as transport; communication; and fuel and energy) is likely to contribute to reducing trade costs (Trade costs are defined in a broader sense by [23] (p. 691) as “including all costs incurred in getting a good to a final user other than the marginal cost of producing the good itself: transportation costs (both freight costs and time costs), policy barriers (tariffs and nontariff barriers), information costs, contract enforcement costs, costs associated with the use of different currencies, legal and regulatory costs, and local distribution costs (wholesale and retail).”), and hence fostering GVC participation, in particular through greater engagement in backward GVCs. This is because, on the one hand, the build-up of infrastructure is critical for trade costs reduction, and for the expansion of traditional trade, particularly in developing countries (see for example, [24,25,26,27,28,29,30,31,32,33]). On the other hand, and more importantly, an increasing body of the literature (see for example, [34], who has discussed the importance of transport cost and transport infrastructure for participation in GVCs trade. See also the survey by [35] on the matter) has emphasized how trade costs inhibit firms’ engagement in GVCs. For example, [36] (p. 97) has argued that the accumulation of trade costs in GVCs generates the so-called “cascading effect” across many production stages, since intermediate goods are imported and then re-exported farther downstream, going through different processing nodes before reaching the final consumer. Trade costs undermine the development of complex GVCs, especially when the accumulation and magnification effects of cascading trade costs ex ceed a certain threshold (e.g., [3,37]). Ref. [36] has estimated that trade frictions raise the production cost in a single stage of the value chain by 18 per cent on average. Building on the review of the consequences of trade costs for competitiveness at industry, national and global levels, [35] have concluded that reducing trade costs would significantly benefit countries that are not well integrated into international trade. According to [38], trade costs adversely affect both the volume of trade flows within GVCs and the spatial organization of GVCs.
On the other hand, government expenditure that covers sectors such as agriculture, fishing, forestry, and hunting; as well as mining, manufacturing, and construction, could also affect countries’ participation in GVCs. This type of expenditure is also referred to, in the present study, as “trade-related government expenditure for strengthening productive capacities” (e.g., [39,40]). It would strengthen firms’ productive capacities, reduce product costs and enhance their competitiveness in the value chains. Therefore, this type of government expenditure could foster countries’ participation in GVCs, and notably their backward participation in GVCs.
Both trade-related government expenditure for building infrastructure and government spending for enhancing productive capacities are interrelated and likely to reinforce each other in affecting countries’ GVC participation. Therefore, it might not be wise to separately consider the effect of each of these two types of trade-related government expenditure on countries’ participation in GVCs. For example, reducing trade costs by developing infrastructure might not significantly encourage countries’ backward participation in GVCs if firms located in those countries lacked the requisite productive capacity to use foreign inputs to produce goods that would be exported to their trading partners (i.e., through greater backward participation in GVCs). Likewise, the prevalence of poor infrastructure would not facilitate firms’ integration into GVCs, including through backward engagement in GVCs, even though firms’ productive capacities were enhanced.
Against this background, we posit two hypotheses.
Hypothesis 1 (H1).
Greater trade-related government expenditure can foster countries’ participation in GVCs, including their backward participation in GVCs.
Hypothesis 2 (H2).
Trade-related government expenditure for infrastructure and trade-related government infrastructure for productive capacities could reinforce each other in enhancing countries’ participation in GVCs, and notably their backward GVC participation. In other words, increasing both trade-related government expenditure for infrastructure and trade-related government infrastructure for productive capacities could induce greater participation in GVCs, including in backward participation in GVCs.
The empirical analysis will test these two hypotheses.
3. Model Specification
There is now an extensive literature on the country-level determinants of participation in GVCs (e.g., [4,5,6,8,10]). We build on this literature and use as control variables the real per capita income (denoted “GDPC”), the human capital level (denoted “HUM”), the real exchange rate (denoted “REER”), foreign direct investment (FDI) inflows (denoted “FDI”), financial development (denoted “FD”), the institutional and governance quality (denoted “INST”), the dependence on natural resources (denoted “RENT”), and the population size. The theoretical effects (we refer readers to the discussion provided by authors such as [6,10] on the theoretical effects of each of the control variables used in the analysis) of each of these control variables have been largely discussed in [6,10].
Therefore, we postulate the following baseline model specification (1):
The subscripts i and t stand respectively for a country and a year in the panel dataset used in the analysis. This panel dataset is unbalanced and includes 74 developing countries over the annual period from 2005 to 2018. The dependent variable “GVC” is the indicator of participation in GVCs. It can be either the backward participation in GVCs (denoted “BGVC”) or the forward participation in GVCs (denoted “FGVC”). The indicator “BGVC” represents the share of the value added of foreign (imported) goods (used as intermediate inputs to produce output for exports) in gross exports. The formula used to calculate the indicator “BGVC” is: , where “DVX” is the foreign value-added that is embodied in gross exports and “GE” is the indicator of gross exports. An increase in the values of this index reflects greater backward participation in GVCs.
The indicator “FGVC” (the forward participation in GVCs) is calculated as the share (in gross exports) of the exports of intermediate goods that are used by another country as inputs for the production of goods exported to third countries. The formula used to calculate the indicator “FGVC” is: , where “FVA” is the domestic value added that is used in the export of third countries. “GE” is the indicator of gross exports. An increase in the values of this index reflects greater backward participation in GVCs. The variables “DVX”, “FVA” and “GE” are collected from the UNCTAD-Eora Global Value Chain Database (it is available online at: https://worldmrio.com/unctadgvc/).
As “BGVC” and “FGVC” are proportion variables (i.e., variables whose values range between 0 and 1—as they are not expressed in percentage), the estimation of model (1) using these dependent variables would yield predictions of these variables outside the unit interval, including nonsensical predictions for extreme values of the regressors [41]. Ref. [41] has proposed to handle the bounded nature of the dependent variable by transforming the indicator using the ‘logit’ function, and then use the linear regression (including the appropriate estimator) to estimate the model with the transformed dependent variable. We apply the method proposed by [41] to transform the variables “BGVC” and “FGVC” as follows: BGVC1 = Logit(BGVC) and FGVC1 = Logit(FGVC).
The variable “EXPECO” is the share (in percentage) of total trade-related government expenditure in GDP. It is collected from the database of the International Monetary Fund, and is labelled “expenditure on economic affairs” in the International Monetary Fund (IMF) Database. This category of expenditure includes government expenditure on agriculture, fishing, forestry, and hunting; expenditure on mining, manufacturing, and construction; expenditure on transport; expenditure on communication; expenditure on fuel and energy; and other trade-related expenditure (i.e., other economic affairs-related expenditure). For the purpose of the analysis, we also consider the two main components of the total trade-related government expenditure (in percentage of GDP), with a view to testing Hypothesis 2. These are government expenditure for economic infrastructure denoted “INFRA” (that covers the categories of transport, communication as well as fuel and energy), and government expenditure for productive capacities denoted “PROD” (that covers the categories of agriculture, fishing, forestry, and hunting; as well as mining, manufacturing, and construction).
to are parameters to be estimated. are year dummies that represent global shocks simultaneously affecting all countries’ participation in GVCs. are countries’ time invariant specific effects, and is a well-behaving error term.
The definition and source of all control variables used in the analysis are provided in Appendix A. Appendix B shows the descriptive statistics of the variables, and Appendix C reports the list of countries used in the analysis.
4. Data Analysis
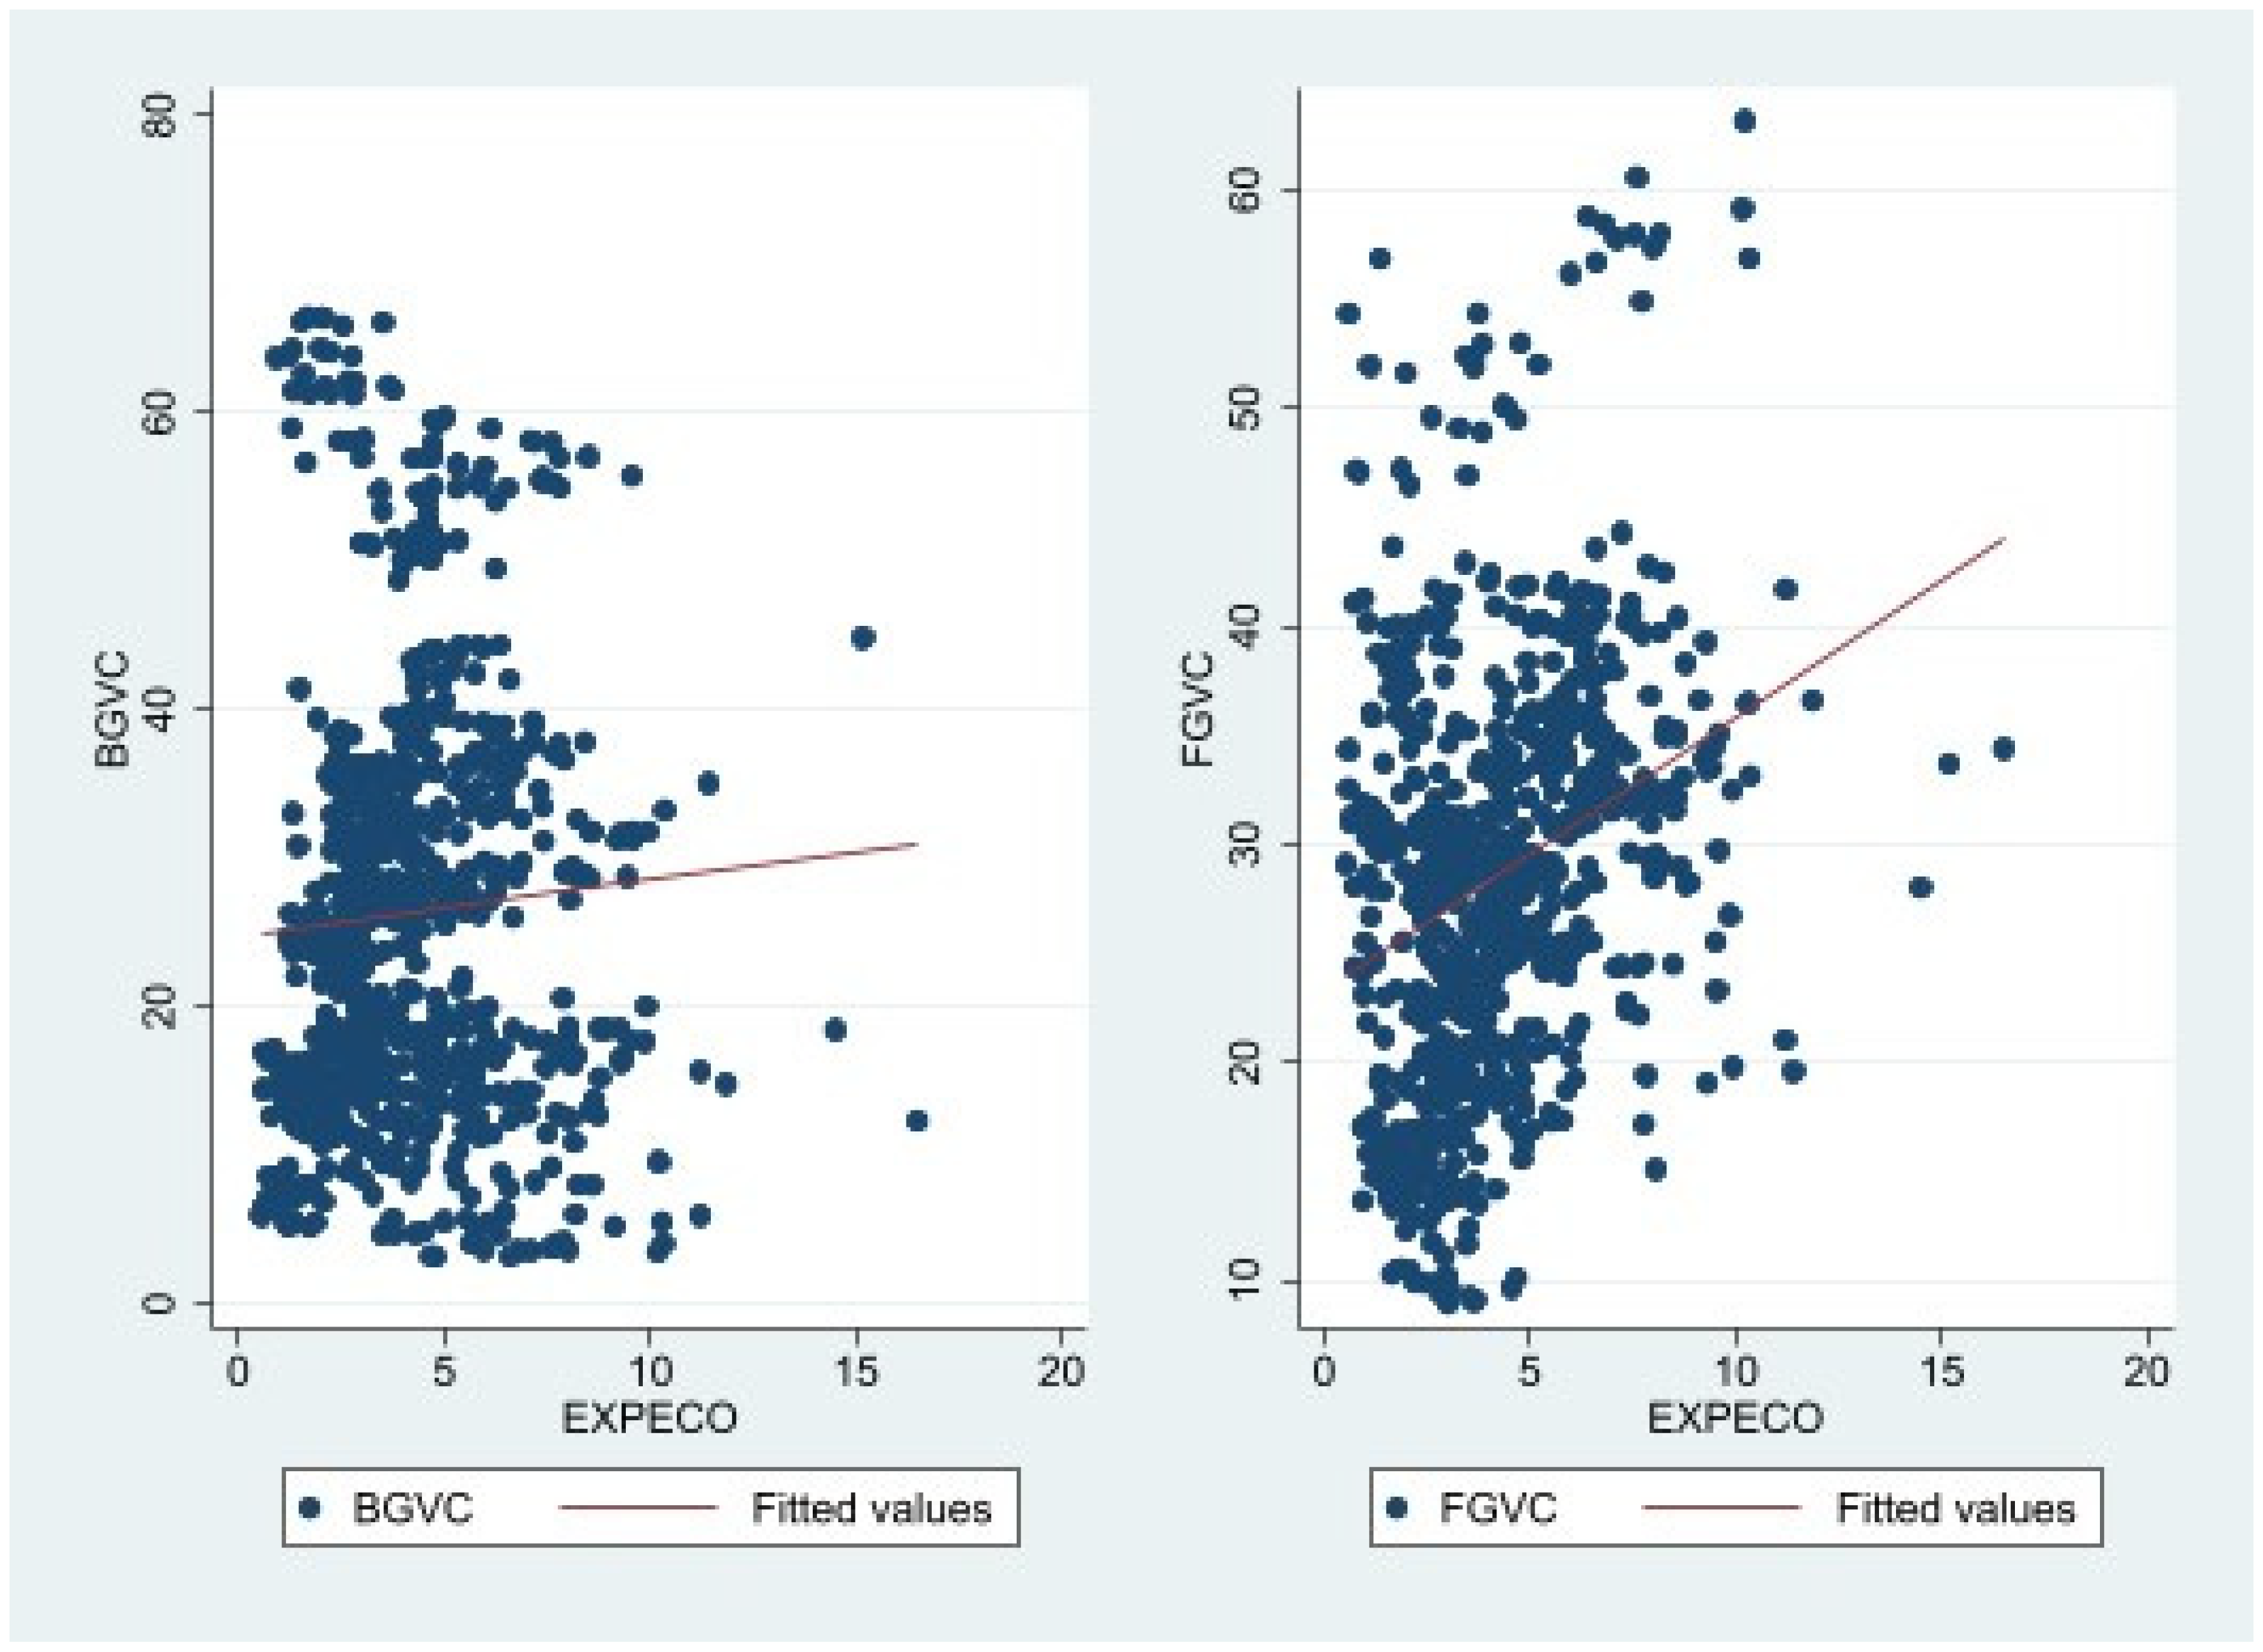
To have a first insight into the relationship between GVC indicators, that is, between backward GVC participation/forward GVC participation and total trade-related expenditure, we present in Figure 1a,b (on average over the full sample) respectively the developments of the indicators of backward GVC participation and trade-related expenditure, and the developments of the indicators of forward GVC participation and trade-related expenditure. We also provide in Figure 2 the correlation patterns between these three variables.
Figure 1a shows that the indicator of backward GVC participation strongly fluctuated over the full period, and especially tended to decline towards the end of the period. It moved from 23.7% in 2005 to 23.14% in 2018, after reaching its peak of 25.6% in 2011. Figure 1b shows that the indicator of forward GVC participation increased significantly (at the beginning of the period) from 28.2% in 2005 to 30.6% in 2008, and then declined to 28.6% in 2009. It then rebounded to 29.65% in 2010, and subsequently exhibited a downward trend from 2010 to 2018, reaching 27.86% in 2018.
In the meantime, we note from Figure 1a,b that, on average over the full sample, trade-related government expenditure did not fluctuate substantially, at least compared to the two indicators of GVCs. It moved from 3.91% in 2005 to 4.33% in 2018.
Figure 2 indicates a positive correlation between backward GVC participation and trade-related government expenditure (see the left-hand side graph), and a positive correlation between forward GVC participation and trade-related government expenditure (see the right-hand side graph).
5. Econometric Approach
At the outset, we perform the Cluster-robust Hausman test of [42] that helps choose between a fixed-effects model and a random effects model. The outcomes of the test suggest that for the specification of model (1) with the dependent variable “BGVC1”, the Chi-square statistic is 19.02 and the associated p-value equal to 0.0250. For the specification of model (1) with the dependent variable “FGVC1”, the Chi-square statistic is 3.93 and the associated p-value amounts to 0.92. Based on these results, we can conclude that for the specification of model (1) with the dependent variable “BGVC1”, the fixed-effects estimator would be appropriate, while for the specification of model (1) with the dependent variable “FGVC1”, either the fixed effects or the random effects estimator could be appropriate.
Against this backdrop, we first use the within fixed effects estimator (denoted FEDK) to estimate model (1), including with “BGVC1” and “FGVC1” as dependent variables. Here, the within-fixed effects estimator is utilized along with the [43] technique to correct the standards errors for the presence of the heteroscedasticity, serial correlation and contemporaneous cross-sectional dependence in the residuals. Next, we use the random-effects Mundlak approach (henceforth referred to as “RE-Mundlak” approach) (see [44,45]) to estimate model (1), including with “BGVC1” and “FGVC1” as dependent variables. This is a hybrid estimator that allows taking into account differences within and between-countries. It entails introducing, in the random effects specification, both the time-invariant variables and the demeaned coefficients from the fixed-effects model. The set of time-averaged regressors allows controlling for time-invariant unobserved heterogeneity (between-country effects) in the regressions. As a result, the parameters to reflect the within-effects estimates, as the between-effects estimates in the regressions are captured through the introduction of the averages of regressors across years and per country in the regressions. The outcomes of the estimation of model (1), with “BGVC1” and “FGVC1” as dependent variables and using the FEDK and RE-Mundlak estimators, are reported in Table 1.
The main weakness of using the estimators FEDK and RE-Mundlak is that they do not help address the endogeneity problem that could plague model (1). This endogeneity problem arises mainly from the reverse causality from the dependent variable to all our regressors, except for the population size. In particular, while trade-related government expenditure could affect countries’ participation in GVCs, one could not rule out the possibility that countries that experienced low degrees of participation in GVC (forward or backward GVC participation) could increase their trade-related expenditure with a view not only to reducing trade costs, but also to enhancing their firms’ productive capacities. This highlights the reverse causality from the GVC indicator to the indicator of trade-related government expenditure. The same reasoning applies to other regressors.
Another weakness associated with the use of the above-mentioned two estimators is that they provide ‘average’ effects of explanatory variables, including our main indicator (i.e., the trade-related government expenditure), over the full sample. This may, in fact, hide different effects of trade-related government expenditure on the indicators of GVC participation across different quantiles of the distribution of each of the indicators of participation in GVCs.
To address these weaknesses, we make use of the Method of Moments Quantile Regression (MMQR) with fixed effects approach (also referred to as “Quantile via Moments”) developed by [46]. Like other standard quantile regression approaches (e.g., [47,48]), the MMQR estimator helps address problems such as the heteroscedasticity and outliers problems. However, this estimator departs from the standard quantile regression estimators on several fronts. For example, countries’ time-invariant fixed effects are treated as location (intercept) shifters by standard quantile regression approaches, while in the MMQR-based regressions they vary across different quantiles of the conditional distribution of the dependent variable. More importantly, by relying on the method of moments, the MMQR approach helps tackle the endogeneity problems (in particular, the reverse causality issue of regressors) that can plague a model.
The MMQR approach is utilized here to examine how trade-related government expenditure affects participation in GVCs across the distribution of the indicators of GVCs’ participation. The empirical analysis is carried out over five quantiles, that are Q10th (i.e., the 10th quantile), Q25th, Q50th, Q75th and Q90th (i.e., the 90th quantile). Table 2; Table 3 present the outcomes arising from the estimation of model (1) by using the MMQR approach, where the dependent variable is respectively “BGVC1” and “FGVC1”. These outcomes help test Hypothesis 1.
To test Hypothesis 2, we estimate a specification of model (1) where the variable “EXPECO” has been replaced with its two major components, which are “INFRA” and “PROD”, and their interaction. The summary of the outcomes arising from the estimation of this model by using the MMQR approach are displayed in Table 4.
6. Interpretation of Empirical Results
At the outset, we would like to note that in the rest of the analysis, we use the expression “trade expenditure” to refer to “total trade-related government expenditure”. Likewise, we use the expressions “backward GVC” and “forward GVC” to respectively refer to “backward participation in GVCs” and “forward participation in GVCs”. It is also worth recalling here that developing countries benefit more (in terms of domestic productivity) from backward GVC than from forward GVCs.
Outcomes presented in columns [1] and [2] of Table 1 (those respectively based on the FEDK and RE-Mundlak estimators) suggest that trade expenditure is positively and significantly (at the 1% level) associated with backward GVC. Interestingly the coefficients of the variable “EXPECO” in these two columns are quite similar, thereby suggesting that the outcomes obtained are almost the same regardless of whether we use the FEDK or the RE-Mundlak estimator.
Outcomes in columns [3] and [4] of Table 1 (those respectively based on the FEDK and RE-Mundlak estimators) indicate that there is no significant effect (at the 10% level) of trade expenditure on forward GVC (the coefficients of the variable “EXPECO” are not significant at the 10% level in the two columns of the Table).
Results related to control variables in Table 1 indicate that the real per capita income is negatively and significantly associated with backward GVC (see column [2]), thereby suggesting that less developed countries tend to experience greater backward participation in GVCs than relatively advanced developing countries. Meanwhile an improvement in the real per capita income exerts no significant effect on forward GVC. Human capital exerts no significant effect on backward GVC, but reduces forward GVC. The depreciation of the real exchange rate and higher FDI inflows foster backward GVC, but reduce forward GVC. Financial development positively but only loosely affects backward GVC (the coefficient of “FD” is only significant at the 10% level in column [2], but not significant in column [1]). In the meantime, financial development encourages forward GVC. Institutional and governance quality appears to exert no significant effect on forward GVC. However, for backward GVC, its effect remains uncertain as it is negative and significant at the 5% level (see column [1]) but not at the 10% level in column [2] (result based on RE-Mundlak estimator). On another note, higher natural resource rents promote both backward and forward GVC, but they exert a larger positive effect on forward GVC than on backward GVC. Finally, the population size tends to negatively affect backward GVC, but positively forward GVC.
Based on these findings, we may be tempted to conclude that, on average, trade expenditure enhances backward GVC in developing countries, while it exerts no significant effect on forward GVC in these countries. However, as noted above, these outcomes may hide differentiated effects of trade expenditure across various quantiles of the distribution of GVC indicators. In addition, these outcomes may be biased due to the endogeneity concern explained above. Outcomes reported in Table 2; Table 3 are obtained when using the MMQR estimator that helps address these concerns.
We note from Table 2 that the location parameter related to the variable “EXPECO” (see column [1]) and the scale parameter associated with the same variable (see column [2]) are both positive, but the former is significant at the 1% level, while the latter is significant at the 10% level. These results lead us to deduce that the effect of trade expenditure on backward GVC is always positive, and increases (i.e., its scale increases) as we move from lower quantiles to upper quantiles. However, this effect is not always statistically significant. It is not significant for countries situated in the lowest quantile, i.e., countries that have the lowest level of backward GVC. For the other quantiles, the effect of trade expenditure on backward GVC is positive and significant to at least the 5% level, and is greater when the quantile is higher. In other words, countries with a higher degree of backward GVC experience a larger positive effect of trade expenditure on backward GVC than countries with a relatively lower backward GVC participation. The magnitude of this positive effect ranges from 0.006 for countries situated in the 20th quantile to 0.011 for countries situated in the 90th quantile. These estimates are lower than the ones in columns [1] and [2] of Table 1, and support hypothesis 1. They indicate that trade expenditure fosters backward participation in GVCs by countries in all quantiles, with backward GVCs appearing as the least integrated ones; however, the more upper the quantile, the larger the positive effect. Building on our theoretical discussion, we can infer from these findings that by reducing trade costs, trade-related government expenditure promotes the participation in GVCs by countries in all countries but the lowest one—that is, those that have the lowest level of backward GVC participation. These countries are likely to be poorer countries. The absence of effect of trade expenditure on GVC participation by countries in the lowest quantiles (potentially poorer countries) may be explained by the low level of such an expenditure, given the huge resource constraints of these countries.
Concerning outcomes of control variables in Table 2, we obtain that the real per capita income always exerts a negative and significant effect on backward GVC, with the magnitude of this effect decreasing as we move from lower to higher quantiles. The depreciation of the real exchange rate promotes backward GVCs, and its positive effect is larger in upper quantiles than in lower quantiles. Higher FDI inflows encourage backward GVC, including to a larger extent in lower quantiles than in upper quantiles, except for countries located in the 90th quantile (FDI inflows exert no significant effect on backward GVC here). The effect of the population size on backward GVC is negative and always significant across all quantiles of the distribution of the backward GVC indicator, with this negative effect becoming larger as we move from the lowest quantiles to the highest quantile. Incidentally, financial development, institutional and governance quality, and dependence on natural resource rents exert no significant (at the 10% level) effect on backward GVC.
Estimates reported in all columns of Table 3 show that there is no significant effect of trade expenditure on forward GVC. These outcomes align with those in columns [3] and [4] of Table 1. Concerning control variables, we note that, at the 5% level, real per capita income, financial development, institutional and governance quality, and population size do not affect significantly trade expenditure in developing countries. Likewise, at the 5% level, human development affects significantly (but negatively) forward GVC by countries located in the highest quantile (i.e., the 90th quantile) of the distribution of the indicator of forward GVC. Both the depreciation of the real exchange rate and higher FDI inflows reduce forward GVC across countries in all quantiles, and the magnitude of this negative effect increases as we move from the lower to the upper quantiles. Finally, higher natural resource rents encourage countries’ engagement in forward GVCs—that is, the export of raw commodities to other countries that will process them for export.
Turning to outcomes reported in Table 4, we find from the lower part of this Table that the coefficients of the interaction variable “INFRA*PROD” are not significant across all quantiles (when the dependent variable is “FGVC1”). At the same time, the coefficients of the same interaction variable in the upper part of the Table are significant (at least at the 10% level) only for countries located in the 50th to 90th quantiles (when the dependent variable is “BGVC1”). Incidentally, across all columns of the Table, the coefficients of the variables “INFRA” and “PROD” are not significant at the 10% level. Based on these outcomes, we conclude that trade-related government expenditure for economic infrastructure and trade-related government expenditure for productive capacities reinforce each other in affecting positively and significantly backward GVC in countries situated in the 50th to 90th quantiles, with these effects being larger when the quantile is higher. The lack of a significant interaction between these two types of expenditure on backward GVC participation in countries located in the 10th to 50th quantiles may be attributed to the fact that trade-related government expenditure to build economic infrastructure had not been instrumental in sufficiently reducing trade costs to allow for trade-related expenditure for productive capacity building to encourage backward GVC participation by firms. Likewise, this outcome may be explained by the fact that the spending on economic infrastructure has not sufficiently reduced trade costs so as to ensure a positive return in terms of improved backward GVC participation for firms that have improved their productive capacities thanks to the money spent by the government on productive capacities.
The interaction between these two types of government expenditure does not influence backward GVC by countries located in the 10th to 50th quantiles, nor does it affect forward GVC by countries located in all quantiles of the distribution of the indicator of forward GVC. It is important to note that results concerning control variables in Table 4 are similar to those reported in Table 2 and Table 3. They have not been reported in Table 4 to save space, and can be obtained upon request.
7. Conclusions
This paper has examined, for the first time, the effect of trade-related government expenditure on backward and forward participation in GVCs. Our main hypothesis is that trade-related government expenditure will help reduce trade costs, and hence enhance countries’ participation in GVCs, and their backward participation in GVCs in particular. The analysis has been carried out using an unbalanced panel dataset of 74 developing countries over the annual period from 2005 to 2018. It has used several estimators, and primarily the Quantile via Moments approach developed by Machado and Santos Silva (2019). The findings provide support for our hypothesis, and indicate that trade-related government expenditure exerts a positive and significant effect on backward participation in GVCs by countries in the 20th to 90th quantile of the distribution of the indicator of backward participation in GVCs. For these countries, the magnitude of this positive effect is larger when the degree of backward participation in GVCs is greater. However, trade-related government expenditure does not significantly affect backward participation in GVCs by least integrated countries in backward GVC participation (i.e., countries located in the lowest quantile—10th quantile).
The analysis has also suggested that trade-related government expenditure exerts no significant effect on developing countries’ forward participation in GVCs. On another note, trade-related government expenditure for enhancing economic infrastructure and trade-related government expenditure for productive capacities—which are the two main components of total trade-related government expenditure—reinforce each other in positively affecting backward participation in GVCs by countries situated in the 50th to 90th quantiles. For countries located in the 10th to 40th quantiles of the distribution of backward participation in GVCs, the interaction of these two types of trade-related government expenditure exerts no significant impact on backward participation in GVCs. Moreover, we find no significant effect of the interaction between these two types of trade-related government expenditure on forward participation in GVCs by countries located in all quantiles of the distribution of the indicator of forward participation in GVCs.
These findings shed light on the importance of trade-related government expenditure, and show that an increase in trade-related government expenditure would be instrumental in fostering developing countries’ backward GVC participation. Developing countries are currently confronted with multiple crises, and are contemplating the policy package that could help them strengthen the resilience of their economies to shocks. The increase of trade-related government expenditure could be instrumental in achieving this objective through its effect on backward participation in GVCs, that would allow participating countries to upgrade their export products and enhance the resilience of their economies to shocks.
Funding
This research received no external funding.
Institutional Review Board Statement
Not applicable.
Informed Consent Statement
Not applicable.
Data Availability Statement
The data used in this analysis is available online in the public databases, could be obtained upon request.
Acknowledgments
This article represents the personal opinions of individual staff members and is not meant to represent the position or opinions of the WTO or its Members, nor the official position of any WTO staff members. The author thanks the anonymous Reviewers for their comments on the earlier version of the article. The author also expresses his sincere gratitude to Ms Octavia Roxana Cadia for her extremely helpful copy-editing. Any errors or omissions are the fault of the author.
Conflicts of Interest
I hereby confirm that there is no actual or potential conflict of interest including any financial, personal or other relationships with other people or organizations within three years of beginning the submitted work that could inappropriately influence, or be perceived to influence, the work.
Appendix A. Definition and Source of Variables
| Variables | Definition | Source |
| BGVC and BGVC1 | “BGVC” is the first indicator of the participation in the global value chains. It is the backward participation in global value chains (Backward GVC). It reflects a country’s engagement in GVCs as “seller”, and captures the foreign value-added that is embodied in gross exports. In other words, it represents the share of the value added of foreign (imported) goods (that are used as intermediate inputs to produce output for exports) in gross exports. The formula used to calculate the indicator “BGVC” is: , where “DVX” is the foreign value-added that is embodied in gross exports. “GE” is the indicator of gross exports.An increase in the values of this index reflects greater backward participation in GVCs. “BGVC1” is the transformed indicator of “BGVC” that is obtained by applying the method proposed by Baum (2008). The transformation is as follows: BGVC1 = Logit(BGVC). | Author’s calculation based on data from the UNCTAD-Eora Global Value Chain Database. It is available online at: https://worldmrio.com/unctadgvc/ (accesed on: 23 December 2022) |
| FGVC and FGVC1 | “FGVC” is the second indicator of the participation in the global value chains. It is the forward participation in global value chains (Forward GVC). It reflects a country’s participation in GVCs as “buyer”, and captures the domestic value added (used as intermediate input) in other countries’ value-added exports. It is calculated as the share (in gross exports) of the exports of intermediate goods that are used by another country as inputs for the production of goods exported to third countries. The formula used to calculate the indicator “FGVC” is: , where “FVA” is the domestic value added that is used in the export of third countries. “GE” is the indicator of gross exports. An increase in the values of this index reflects greater backward participation in GVCs. “FGVC1” is the transformed indicator of “FGVC”, which is obtained by applying the method proposed by Baum (2008). The transformation is as follows: FGVC1 = Logit(FGVC). | Author’s calculation based on data from the UNCTAD-Eora Global Value Chain Database. It is available online at: https://worldmrio.com/unctadgvc/ (accesed on: 23 December 2022) |
| EXPECO | Total Government Expenditure for the trade sector (% GDP). This is labelled “Expenditure on economic affairs” in the International Monetary Fund (IMF) Database. This category of expenditure includes:
| Author’s computation based on data sourced from IMF Database for Expenditure by functions of Government Expenditure. See data online at: http://data.imf.org/regular.aspx?key=61037799 (accesed on: 23 December 2022) |
| INFRA | Government expenditure related to Infrastructure (% GDP). This category of expenditure includes:
| Author’s computation based on data sourced from IMF Database for Expenditure by functions of Government Expenditure. See data online at: http://data.imf.org/regular.aspx?key=61037799 (accesed on: 23 December 2022) |
| PROD | Government expenditure related to Productive Capacity (% GDP). This category of expenditure includes:
| Author’s computation based on data sourced from IMF Database for Expenditure by functions of Government Expenditure. See data online at: http://data.imf.org/regular.aspx?key=61037799 (accesed on: 23 December 2022) |
| GDPC | Per capita Gross Domestic Product (constant 2015 US$). | WDI |
| HUM | This indicator of human capital. It represents the ‘number of years of schooling and returns to education’). | Data on extracted from the Penn World Tables PWT 9.1 (see [49]). (accesed on: 23 December 2022) |
| REER | This the index measuring the Real Effective Exchange Rate. The REER index is computed using a nominal effective exchange rate based on 65 trading partners. An increase in the index indicates an appreciation of the real effective exchange rate, i.e., an appreciation of the home currency against the basket of currencies of trading partners. | Bruegel Datasets (see [50,51]). The datatset could be found online at: http://bruegel.org/publications/datasets/real-effective-exchange-rates-for-178-countries-a-new-database/ (accesed on: 23 December 2022) |
| FDI | The variable represents the net inflows of Foreign direct investment (in percentage of GDP). | WDI |
| FD | This is the indicator of financial development. It is the share of domestic credit to the private sector in GDP. Missing values have been replaced by the values of the share of the domestic credit offered by banks to the private sector in GDP. To ease the interpretation of results, we have re-scaled this variable (i.e., by dividing it by 100). | Author’s calculation based on data from WDI (accesed on: 23 December 2022) |
| POP | Total Population | WDI (accesed on: 23 December 2022) |
| RENT | Total natural resource rents (% GDP). | WDI (accesed on: 23 December 2022) |
| INST | This is the variable capturing the institutional quality. It has been computed by extracting the first principal component (based on factor analysis) of the following six indicators of governance. These indicators are respectively: political stability and absence of violence/terrorism; regulatory quality; rule of law; government effectiveness; voice and accountability, and corruption. Higher values of the index “INST” are associated with better governance and institutional quality, while lower values reflect worse governance and institutional quality. | Data on the components of “INST” variables has been extracted from World Bank Governance Indicators developed by [52] and updated recently. See online at: https://info.worldbank.org/governance/wgi/ (accesed on: 23 December 2022) |
Appendix B. Descriptive Statistics of Variables Used in the Analysis over the Full Sample
| Variable | Observations | Mean | Standard Deviation | Minimum | Maximum |
| BGVC | 741 | 0.261 | 0.146 | 0.032 | 0.665 |
| FGVC | 741 | 0.286 | 0.096 | 0.089 | 0.632 |
| BGVC1 | 741 | −1.193 | 0.839 | −3.406 | 0.684 |
| FGVC1 | 741 | −0.967 | 0.495 | −2.320 | 0.539 |
| EXPECO | 741 | 4.218 | 2.266 | 0.542 | 16.505 |
| PROD | 673 | 0.910 | 0.754 | 0.011 | 8.403 |
| INFRA | 663 | 2.327 | 1.643 | −0.097 | 10.233 |
| GDPC | 741 | 10,689.430 | 12,012.670 | 297.792 | 68,253.070 |
| HUM | 741 | 2.636 | 0.618 | 1.181 | 4.154 |
| REER | 741 | 106.554 | 14.021 | 64.880 | 186.216 |
| FDI | 741 | 9.230 | 32.446 | −40.087 | 449.081 |
| FD | 741 | 56.181 | 40.233 | 3.589 | 254.552 |
| INST | 741 | 0.122 | 1.742 | −3.246 | 4.137 |
| RENT | 741 | 6.257 | 10.099 | 0.000 | 58.920 |
| POP | 741 | 82,000,000 | 249,000,000 | 269,477 | 1,400,000,000 |
Appendix C. List of Countries Used in the Analysis
| Full Sample | |||
| Albania | Cyprus | Kyrgyz Republic | Qatar |
| Algeria | Czechia | Latvia | Romania |
| Angola | Dominican Republic | Liberia | Russian Federation |
| Argentina | Egypt, Arab Rep. | Lithuania | Singapore |
| Armenia | El Salvador | Madagascar | Slovak Republic |
| Bahrain | Estonia | Malaysia | Slovenia |
| Bangladesh | Fiji | Maldives | South Africa |
| Barbados | Guatemala | Malta | Sri Lanka |
| Bolivia | Hong Kong SAR, China | Mauritius | Tanzania |
| Botswana | Hungary | Mongolia | Thailand |
| Brazil | India | Mozambique | Tunisia |
| Bulgaria | Indonesia | Namibia | Turkiye |
| Burundi | Iran, Islamic Rep. | Nepal | Uganda |
| Central African Republic | Israel | Nicaragua | Ukraine |
| Chile | Jamaica | Nigeria | United Arab Emirates |
| China | Jordan | Pakistan | Uruguay |
| Costa Rica | Kazakhstan | Panama | Zambia |
| Cote d’Ivoire | Kenya | Philippines | |
| Croatia | Kuwait | Poland | |
References
- OECD. Aid for Trade: Making it Effective, The Development Dimension; OECD Publishing: Paris, France, 2006. [Google Scholar] [CrossRef]
- Antràs, P. Conceptual Aspects of Global Value Chains; NBER Working Paper 26539; National Bureau of Economic Research: Cambridge, MA, USA, 2019. [Google Scholar]
- Antràs, P.; De Gortari, A. On the Geography of Global Value Chains. Econometrica 2020, 88, 1553–1598. [Google Scholar] [CrossRef]
- Banerjee, B.; Zeman, J. Determinants of global value chain participation: Cross-country analysis. Indian Econ. Rev. 2022, 57, 59–95. [Google Scholar] [CrossRef]
- Bontadini, F. Trade specialization and performance in global value chains. Ind. Corp. Chang. 2021, 30, 1557–1590. [Google Scholar] [CrossRef]
- Fernandes, A.M.; Kee, H.L.; Winkler, D. Determinants of Global Value Chain Participation: Cross-Country Evidence. World Bank Econ. Rev. 2022, 36, 329–360. [Google Scholar] [CrossRef]
- Gopalan, S.; Reddy, K.; Sasidharan, S. Does digitalization spur global value chain participation? Firm-level evidence from emerging markets. Inf. Econ. Policy 2022, 59, 100972. [Google Scholar] [CrossRef]
- Hammoudeh, S.; Tiwari, A.K.; Abakah, E.J.A.; Adeabah, D. Global value chains in sub-Saharan Africa: The roles of business regulations, policies and institutions. Emerg. Mark. Rev. 2023, 57, 101072. [Google Scholar] [CrossRef]
- Ignatenko, A.; Raei, F.; Mircheva, B. Global Value Chains: What Are the Benefits and Why Do Countries Participate? IMF Working Paper No. 19/18; International Monetary Fund: Washington, DC, USA, 2019. [Google Scholar]
- Kowalski, P.; Gonzalez, J.; Ragoussis, A.; Ugarte, C. Participation of Developing Countries in Global Value Chains: Implications for Trade and Trade-Related Policies; OECD Trade Policy Papers, No. 179; OECD Publishing: Paris, France, 2015. [Google Scholar]
- World Bank. World Development Report 2020: Trading for Development in the Age of Global Value Chains; World Bank: Washington, DC, USA, 2020. [Google Scholar] [CrossRef]
- Pahl, S.; Timmer, M.P.; Gouma, R.; Woltjer, P.J. Jobs and Productivity Growth in Global Value Chains: New Evidence for Twenty-five Low- and Middle-Income Countries. World Bank Econ. Rev. 2022, 36, 670–686. [Google Scholar] [CrossRef]
- Banga, K. Global value chains and product sophistication in developing countries; The case of Indian manufacturing. J. Int. Trade Econ. Dev. 2023, 32, 509–536. [Google Scholar] [CrossRef]
- Pahl, S.; Timmer, M.P. Do Global Value Chains Enhance Economic Upgrading? A Long View. J. Dev. Stud. 2020, 56, 1683–1705. [Google Scholar] [CrossRef]
- Smichowski, B.C.; Durand, C.; Knauss, S. Participation in global value chains and varieties of development patterns. Camb. J. Econ. 2021, 45, 271–294. [Google Scholar] [CrossRef]
- Carpa, N.; Martínez-Zarzoso, I. The impact of global value chain participation on income inequality. Int. Econ. 2022, 169, 269–290. [Google Scholar] [CrossRef]
- Duarte, R.; Espinosa-Gracia, A.; Jiménez, S.; Sánchez-Chóliz, J. New insights on the relationship between the involvement of countries in global value chains, and intra- and inter-country inequalities. Struct. Chang. Econ. Dyn. 2022, 63, 320–329. [Google Scholar] [CrossRef]
- Ebeke, C. Surges in participation in global value chains: Drivers and macroeconomic impacts in sub-Saharan Africa. The World Econ. 2023, 46, 3282–3300. [Google Scholar] [CrossRef]
- Van den Broeck, G.; Swinnen, J.; Maertens, M. Global value chains, large-scale farming, and poverty: Long-term effects in Senegal. Food Policy 2017, 66, 97–107. [Google Scholar] [CrossRef]
- Vos, R.; Catteno, A. Poverty reduction through the development of inclusive food value chains. J. Integr. Agric. 2021, 20, 964–978. [Google Scholar] [CrossRef]
- Ha, L.T.; Thanh, T.T. Global value chains and energy security: Evidence from global sample. Energy Strategy Rev. 2022, 42, 100870. [Google Scholar] [CrossRef]
- Veeramani, C.; Dhir, G. Do developing countries gain by participating in global value chains? Evidence from India. Rev. World Econ. 2022, 158, 1011–1042. [Google Scholar] [CrossRef]
- Constantinescu, C.; Aaditya, M.; Michele, R. Does vertical specialization increase productivity. World Econ. 2019, 42, 2385–2402. [Google Scholar] [CrossRef]
- Anderson, J.E.; Van Wincoop, E. Trade Costs. J. Econ. Lit. 2004, 42, 691–751. [Google Scholar] [CrossRef]
- Anderson, J.E.; Van Wincoop, E. Gravity with gravitas: A solution to the border puzzle. Am. Econ. Rev. 2003, 93, 170–192. [Google Scholar] [CrossRef]
- Bougheas, S.; Demetriades, P.O.; Morgenroth, E.L.W. Infrastructure, Transport Costs and Trade. J. Int. Econ. 1999, 47, 169–189. [Google Scholar] [CrossRef]
- Donaubauer, J.; Glas, A.; Meyer, B.; Nunnenkamp, P. Disentangling the impact of infrastructure on trade using a new index of infrastructure. Rev. World Econ. 2018, 154, 745–784. [Google Scholar] [CrossRef]
- Hoekman, B.; Nicita, A. Trade policy, trade costs, and developing country trade. World Dev. 2011, 39, 2069–2079. [Google Scholar] [CrossRef]
- Limao, N.; Venables, A.J. Infrastructure, geographical disadvantage, transport costs, and trade. World Bank Econ. Rev. 2001, 15, 451–479. [Google Scholar] [CrossRef]
- Papalia, R.B.; Bertarelli, S. Trade Costs in Bilateral Trade Flows: Heterogeneity and Zeroes in Structural Gravity Models. World Econ. 2015, 38, 1744–1762. [Google Scholar] [CrossRef]
- Vijil, M.; Wagner, L. Does Aid for Trade Enhance Export Performance? Investigating on the Infrastructure Channel. World Econ. 2012, 35, 838–868. [Google Scholar] [CrossRef]
- Wilson, J.S.; Mann, C.L.; Otsuki, T. Trade facilitation and economic development: A new approach to quantifying the impact. World Bank Econ. Rev. 2003, 17, 367–389. [Google Scholar] [CrossRef]
- Wilson, J.S.; Mann, C.L.; Otsuki, T. Assessing the benefits of trade facilitation: A global perspective. World Econ. 2005, 28, 841–871. [Google Scholar] [CrossRef]
- Togan, S. ‘Transportation Costs, Trade, and Global Value Chains’, The Liberalization of Transportation Services in the EU and Turkey (Oxford, 2016; online edn, Oxford Academic, 18 August 2016). Available online: https://www.researchgate.net/publication/306299083_Transportation_Costs_Trade_and_Global_Value_Chains (accessed on 17 December 2023).
- Diakantoni, A.; Escaith, H.; Roberts, M.; Verbeet, T. Accumulating Trade Costs and Competitiveness in Global Value Chains; WTO Working Paper ERSD-2017-02; World Trade Organization: Geneva, Switzerland, 2017. [Google Scholar]
- Escaith, H. Accumulated trade costs and their impact on domestic and international value chains. In Chapter 4—‘Global Value Chain Development Report 2017’; World Bank: Washington, DC, USA; Institute of Developing Economies: Chiba, Japan; Organisation for Economic Co-operation and Development: Paris, France; Research Center of Global Value Chains: Durham, NC, USA; World Trade Organization: Geneva, Switzerland, 2017. [Google Scholar]
- Yi, K.M. Can Multistage Production Explain the Home Bias in Trade? Am. Econ. Rev. 2010, 100, 364–393. [Google Scholar] [CrossRef]
- Jakubik, A.; Stolzenburg, V. Footloose Global Value Chains: How Trade Costs Make a Difference. Rev. Ind. Organ. 2020, 57, 245–261. [Google Scholar] [CrossRef]
- Gnangnon, S.K. Trade-related Government Expenditure and Aid for Trade in Recipient-Countries. Econ. Issues 2019, 24, 1–20. [Google Scholar] [CrossRef]
- Gnangnon, S.K. Aid for trade unpredictability and trade-related government expenditure in recipient-countries. Q. Rev. Econ. Financ. 2021, 79, 107–125. [Google Scholar] [CrossRef]
- Baum, C.F. Stata tip 63: Modeling proportions. Stata J. 2008, 8, 299–303. [Google Scholar] [CrossRef]
- Kaiser, B. RHAUSMAN: Stata Module to Perform Robust Hausman Specification Test; Statistical software components S457909; Boston College Department of Economics: Chestnut Hill, MA, USA, 2015. [Google Scholar]
- Driscoll, J.C.; Kraay, A.C. Consistent Covariance Matrix Estimation with Spatially Dependent Panel Data. Rev. Econ. Stat. 1998, 80, 549–560. [Google Scholar] [CrossRef]
- Mundlak, Y. On the pooling of time series and cross section data. Econometrica 1978, 46, 69–85. [Google Scholar] [CrossRef]
- Wooldridge, J.M. Econometric Analysis of Cross Section and Panel Data; MIT Press: Cambridge, MA, USA, 2010. [Google Scholar]
- Machado, J.A.F.; Santos Silva, J.M.C. Quantiles via moments. J. Econ. 2019, 213, 145–173. [Google Scholar] [CrossRef]
- Canay, I.A. A Simple Approach to Quantile Regression for Panel Data. Econ. J. 2011, 14, 368–386. [Google Scholar] [CrossRef]
- Koenker, R. Quantile regression for longitudinal data. J. Multivar. Anal. 2004, 91, 74–89. [Google Scholar] [CrossRef]
- Feenstra, R.C.; Inklaar, R.; Timmer, M.P. The Next Generation of the Penn World Table. Am. Econ. Rev. 2015, 105, 3150–3182. [Google Scholar] [CrossRef]
- Darvas, Z. Real Effective Exchange Rates for 178 Countries: A New Database. Working Paper 2012/06; Bruegel, Belgium. 2012. Available online: https://www.bruegel.org/working-paper/real-effective-exchange-rates-178-countries-new-database (accessed on 10 December 2023).
- Darvas, Z. Compositional Effects on Productivity, Labour Cost and Export Adjustment. Policy Contribution 2012/11; Bruegel, Belgium. 2012. Available online: https://www.bruegel.org/policy-brief/compositional-effects-productivity-labour-cost-and-export-adjustments (accessed on 10 December 2023).
- Kaufmann, D.; Kraay, A.; Mastruzzi, M. The Worldwide Governance Indicators Methodology and Analytical Issues; World Bank Policy Research N° 5430 (WPS5430); The World Bank: Washington, DC, USA, 2010. [Google Scholar]
Figure 1.
(a): Backward participation in GVCs and the share of Trade-related government expenditure in GDP. Source: Author. Note: The variables “BGVC” and “FGVC” are expressed in percentage here for the sake of the graphical analysis. The variable “EXPECO” is also expressed in percentage. (b): Forward participation in GVCs and the share of Trade-related government expenditure in GDP. Source: Author. Note: The variables “BGVC” and “FGVC” are expressed in percentage here for the sake of the graphical analysis. The variable “EXPECO” is also expressed in percentage.
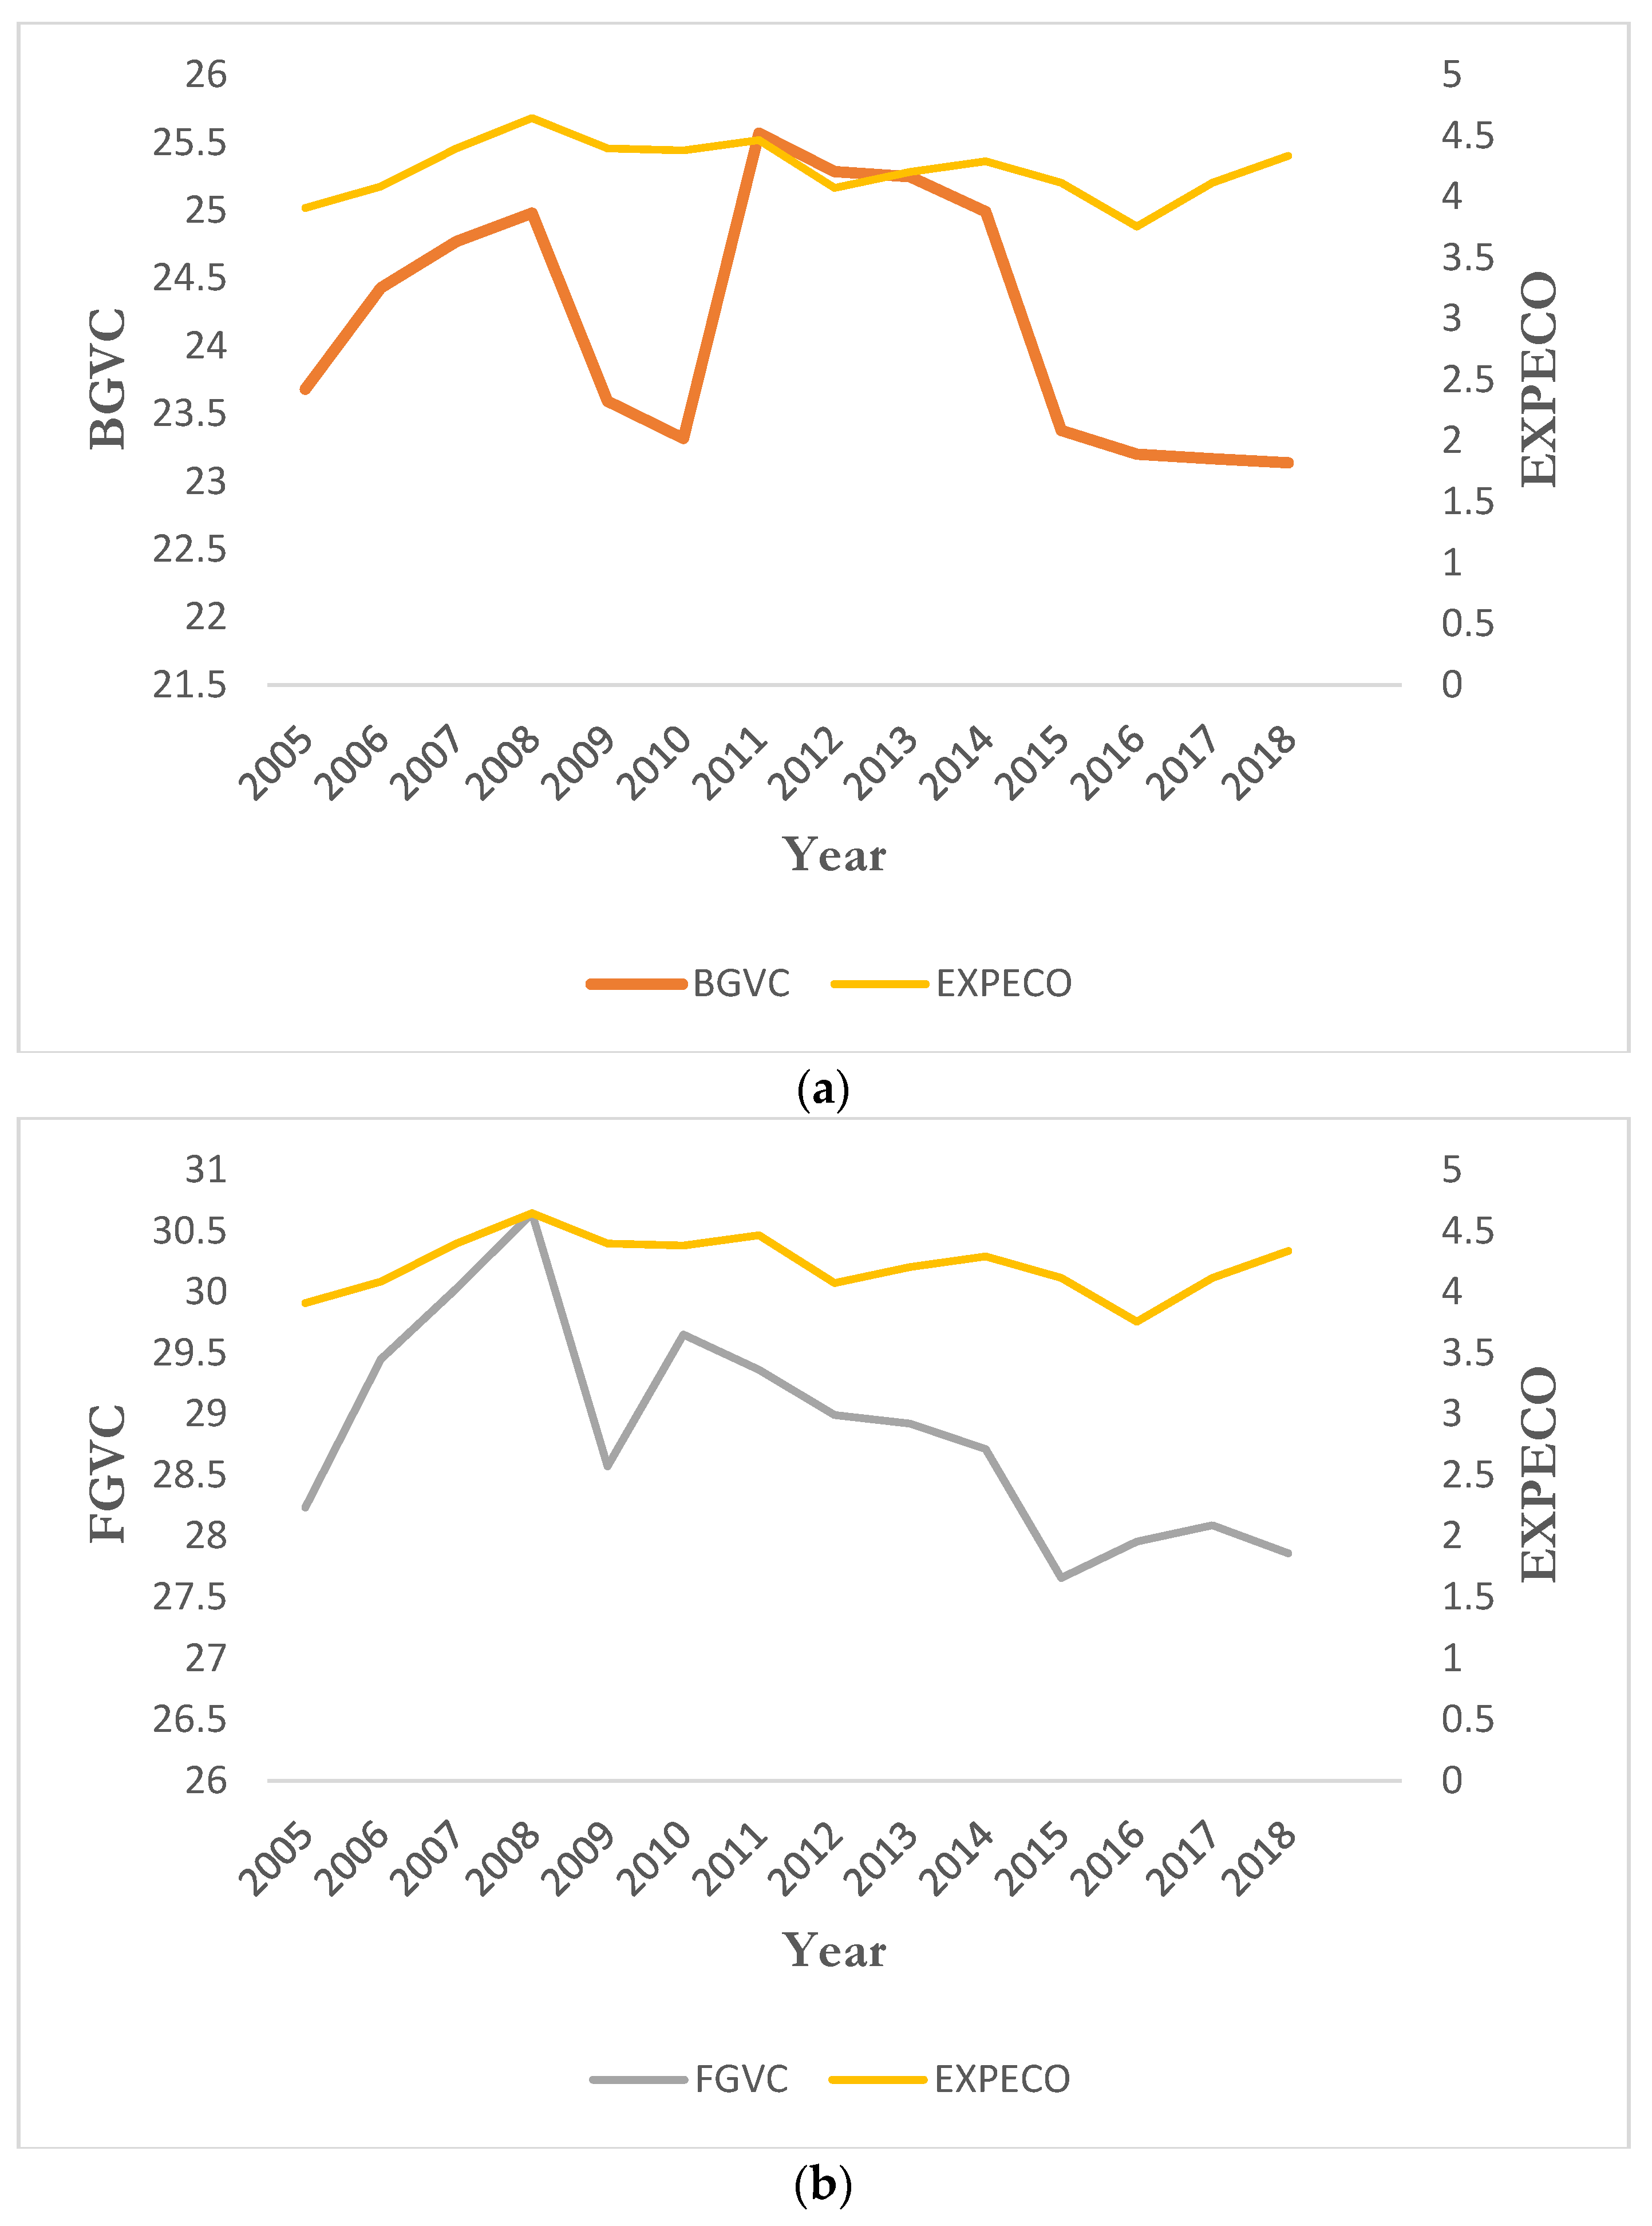
Figure 2.
Correlation pattern between backward and forward participation in GVCs and the share of Trade-related government expenditure in GDP. Source: Author.
Figure 2.
Correlation pattern between backward and forward participation in GVCs and the share of Trade-related government expenditure in GDP. Source: Author.

Table 1.
Effect of the share of trade-related government expenditure in GDP on backward and forward participation in GVCs in developing countries. Estimators: FEDK and RE Mundlak.
Table 1.
Effect of the share of trade-related government expenditure in GDP on backward and forward participation in GVCs in developing countries. Estimators: FEDK and RE Mundlak.
| FEDK | RE Mundlak | FEDK | RE Mundlak | |
|---|---|---|---|---|
| Variables | BGVC1 | FGVC1 | BGVC1 | FGVC1 |
| (1) | (2) | (3) | (4) | |
| EXPECO | 0.0108 *** | 0.00958 *** | −0.000144 | −0.000671 |
| (0.00294) | (0.00276) | (0.00160) | (0.00253) | |
| Log(GDPC) | −0.0860 | −0.105 *** | −0.0447 | −0.0490 |
| (0.0873) | (0.0381) | (0.0395) | (0.0342) | |
| HUM | 0.0150 | −0.0315 | −0.172 *** | −0.194 *** |
| (0.0217) | (0.0411) | (0.0284) | (0.0373) | |
| Log(REER) | −0.187 *** | −0.233 *** | 0.291 *** | 0.270 *** |
| (0.0590) | (0.0411) | (0.0425) | (0.0376) | |
| FDI | 0.000198 *** | 0.000190 | −0.000377 *** | −0.000378 *** |
| (5.53 × 10⁻⁵) | (0.000145) | (8.25 × 10⁻⁵) | (0.000133) | |
| FD | 0.000639 | 0.000648 * | 0.000801 *** | 0.000800 ** |
| (0.000503) | (0.000353) | (0.000164) | (0.000323) | |
| INST | −0.0213 ** | −0.00990 | −0.00533 | −0.000841 |
| (0.0103) | (0.0146) | (0.0173) | (0.0133) | |
| RENT | 0.00304 ** | 0.00427 *** | 0.00706 *** | 0.00760 *** |
| (0.00140) | (0.00122) | (0.00120) | (0.00112) | |
| Log(POP) | −0.365 *** | −0.142 *** | −0.0349 | 0.0619 ** |
| (0.0785) | (0.0342) | (0.0655) | (0.0285) | |
| Constant | 6.281 *** | −1.045 | −0.992 | 0.881 |
| (1.859) | (3.160) | (1.442) | (2.569) | |
| Observations—Countries | 741—74 | 741—74 | 741—74 | 741—74 |
| Within R2 | 0.2304 | 0.2164 | 0.1585 | 0.1551 |
| Between R2 | 0.6851 | 0.5483 | ||
| Overall R2 | 0.7442 | 0.5834 |
Note: * p-value < 0.1; ** p-value < 0.05; *** p-value < 0.01. Robust standard errors are in parenthesis.
Table 2.
Effect of the share of trade-related government expenditure in GDP on backward participation in GVCs in developing countries. Estimator: Method of Moments Quantile Regression (MMQR).
Table 2.
Effect of the share of trade-related government expenditure in GDP on backward participation in GVCs in developing countries. Estimator: Method of Moments Quantile Regression (MMQR).
| Dependent Variable: BGVC1 | |||||||
|---|---|---|---|---|---|---|---|
| Variables | Location a | Scale b | Q10th | Q25th | Q50th | Q75th | Q90th |
| (1) | (2) | (3) | (4) | (5) | (6) | (7) | |
| EXPECO | 0.00790 *** | 0.00212 * | 0.00477 | 0.00601 ** | 0.00786 *** | 0.00988 *** | 0.0112 *** |
| (0.00236) | (0.00119) | (0.00323) | (0.00279) | (0.00237) | (0.00240) | (0.00265) | |
| Log(GDPC) | −0.158 *** | 0.0317 | −0.205 *** | −0.187 *** | −0.159 *** | −0.129 *** | −0.109 ** |
| (0.0424) | (0.0230) | (0.0601) | (0.0507) | (0.0426) | (0.0435) | (0.0489) | |
| HUM | 0.0342 | 0.0174 | 0.00858 | 0.0187 | 0.0339 | 0.0504 | 0.0609 |
| (0.0324) | (0.0165) | (0.0357) | (0.0321) | (0.0323) | (0.0391) | (0.0458) | |
| Log(REER) | −0.316 *** | −0.000982 | −0.314 *** | −0.315 *** | −0.316 *** | −0.317 *** | −0.317 *** |
| (0.0422) | (0.0217) | (0.0490) | (0.0437) | (0.0421) | (0.0495) | (0.0576) | |
| FDI | 0.000243 *** | −6.46 × 10⁻⁵ | 0.000338 *** | 0.000300 *** | 0.000244 *** | 0.000182 * | 0.000143 |
| (9.17 × 10⁻⁵) | (4.83 × 10⁻⁵) | (0.000122) | (0.000105) | (9.19 × 10⁻⁵) | (9.81 × 10⁻⁵) | (0.000112) | |
| FD | 4.39 × 10⁻⁵ | 5.84 × 10⁻⁵ | −4.21 × 10⁻⁵ | −8.15 × 10⁻⁶ | 4.30 × 10⁻⁵ | 9.87 × 10⁻⁵ | 0.000134 |
| (0.000283) | (0.000135) | (0.000357) | (0.000315) | (0.000283) | (0.000302) | (0.000339) | |
| INST | −0.00734 | −0.00548 | 0.000735 | −0.00245 | −0.00725 | −0.0125 | −0.0158 |
| (0.0130) | (0.00706) | (0.0187) | (0.0159) | (0.0130) | (0.0129) | (0.0145) | |
| RENT | −0.00158 | −0.000196 | −0.00129 | −0.00140 | −0.00157 | −0.00176 | −0.00188 |
| (0.00107) | (0.000508) | (0.00110) | (0.00103) | (0.00107) | (0.00130) | (0.00151) | |
| Log(POP) | −0.483 *** | −0.0273 | −0.443 *** | −0.459 *** | −0.483 *** | −0.509 *** | −0.526 *** |
| (0.0634) | (0.0289) | (0.0771) | (0.0689) | (0.0634) | (0.0684) | (0.0768) | |
| Constant | 9.480 *** | 0.175 | 9.222 *** | 9.324 *** | 9.477 *** | 9.644 *** | 9.749 *** |
| (1.164) | (0.543) | (1.464) | (1.297) | (1.164) | (1.231) | (1.377) | |
| Observations | 741 | 741 | 741 | 741 | 741 | 741 | 741 |
Note: * p-value < 0.1; ** p-value < 0.05; *** p-value < 0.01. Robust standard errors are in parenthesis. (a) indicates the location parameters, and (b) refers to the scale parameters.
Table 3.
Effect of the share of trade-related government expenditure in GDP on forward participation in GVCs in developing countries. Estimator: Method of Moments Quantile Regression (MMQR).
Table 3.
Effect of the share of trade-related government expenditure in GDP on forward participation in GVCs in developing countries. Estimator: Method of Moments Quantile Regression (MMQR).
| Dependent Variable: FGVC1 | |||||||
|---|---|---|---|---|---|---|---|
| Variables | Location a | Scale b | Q10th | Q25th | Q50th | Q75th | Q90th |
| (1) | (2) | (3) | (4) | (5) | (6) | (7) | |
| EXPECO | −0.00328 | 0.00134 | −0.00562 | −0.00451 | −0.00327 | −0.00195 | −0.00102 |
| (0.00256) | (0.00157) | (0.00379) | (0.00296) | (0.00256) | (0.00298) | (0.00366) | |
| Log(GDPC) | 0.0822 | 0.0105 | 0.0639 | 0.0726 | 0.0823 | 0.0926 * | 0.1000 * |
| (0.0679) | (0.0358) | (0.118) | (0.0924) | (0.0679) | (0.0531) | (0.0555) | |
| HUM | −0.0345 | −0.0255 | 0.0101 | −0.0110 | −0.0346 | −0.0597 * | −0.0776 ** |
| (0.0340) | (0.0188) | (0.0541) | (0.0425) | (0.0339) | (0.0335) | (0.0389) | |
| Log(REER) | 0.225 *** | 0.0194 | 0.191 *** | 0.207 *** | 0.225 *** | 0.245 *** | 0.258 *** |
| (0.0416) | (0.0226) | (0.0550) | (0.0449) | (0.0416) | (0.0489) | (0.0585) | |
| FDI | −0.000367 *** | −9.65 × 10⁻⁵ ** | −0.000199 | −0.000279 *** | −0.000368 *** | −0.000463 *** | −0.000530 *** |
| (8.00 × 10⁻⁵) | (4.63 × 10⁻⁵) | (0.000121) | (9.49 × 10⁻⁵) | (8.02 × 10⁻⁵) | (8.84 × 10⁻⁵) | (0.000105) | |
| FD | 0.000545 * | −3.18 × 10⁻⁵ | 0.000601 * | 0.000574 * | 0.000545 * | 0.000514 | 0.000491 |
| (0.000282) | (0.000154) | (0.000360) | (0.000296) | (0.000282) | (0.000340) | (0.000411) | |
| INST | −0.0167 | 0.00228 | −0.0207 | −0.0188 | −0.0167 | −0.0144 | −0.0129 |
| (0.0195) | (0.0108) | (0.0353) | (0.0273) | (0.0194) | (0.0144) | (0.0149) | |
| RENT | 0.00379 *** | 4.99 × 10⁻⁵ | 0.00370 *** | 0.00375 *** | 0.00379 *** | 0.00384 *** | 0.00388 *** |
| (0.00100) | (0.000534) | (0.00125) | (0.00104) | (0.00100) | (0.00121) | (0.00146) | |
| Log(POP) | 0.0563 | −0.0234 | 0.0972 | 0.0778 | 0.0562 | 0.0332 | 0.0169 |
| (0.0736) | (0.0346) | (0.100) | (0.0831) | (0.0736) | (0.0781) | (0.0891) | |
| Constant | −3.600 ** | 0.312 | −4.145 * | −3.886 ** | −3.598 ** | −3.291 ** | −3.073 * |
| (1.504) | (0.729) | (2.204) | (1.792) | (1.502) | (1.499) | (1.687) | |
| Observations | 741 | 741 | 741 | 741 | 741 | 741 | 741 |
Note: * p-value < 0.1; ** p-value < 0.05; *** p-value < 0.01. Robust standard errors are in parenthesis. (a) indicates the location parameters, and (b) refers to the scale parameters.
Table 4.
Effect of the interaction between trade-related government expenditure for infrastructure, and trade-related government infrastructure for productive capacities on backward and forward participation in GVCs in developing countries. Estimator: Method of Moments Quantile Regression (MMQR).
Table 4.
Effect of the interaction between trade-related government expenditure for infrastructure, and trade-related government infrastructure for productive capacities on backward and forward participation in GVCs in developing countries. Estimator: Method of Moments Quantile Regression (MMQR).
| Variables | Location a | Scale b | Q10th | Q25th | Q50th | Q75th | Q90th |
| (1) | (2) | (3) | (4) | (5) | (6) | (7) | |
| Effect of the components of the share of trade-related government expenditure on backward participation | |||||||
| Dependent variable: BGVC1 | |||||||
| INFRA*PROD | 0.00684 ** | 0.00228 * | 0.00352 | 0.00483 | 0.00684 ** | 0.00898 *** | 0.0105 *** |
| (0.00322) | (0.00126) | (0.00387) | (0.00353) | (0.00323) | (0.00331) | (0.00363) | |
| INFRA | 0.00558 | 0.00189 | 0.00283 | 0.00391 | 0.00558 | 0.00736 | 0.00862 |
| (0.00571) | (0.00255) | (0.00669) | (0.00607) | (0.00572) | (0.00628) | (0.00714) | |
| PROD | 0.00143 | 0.00256 | −0.00230 | −0.000831 | 0.00143 | 0.00384 | 0.00554 |
| (0.00738) | (0.00406) | (0.00999) | (0.00857) | (0.00738) | (0.00791) | (0.00925) | |
| Observations | 652 | 652 | 652 | 652 | 652 | 652 | 652 |
| Effect of the components of the share of trade-related government expenditure on forward participation | |||||||
| Dependent variable: FGVC1 | |||||||
| INFRA*PROD | 0.00139 | 0.00243 | −0.00276 | −0.000865 | 0.00154 | 0.00377 | 0.00540 |
| (0.00327) | (0.00169) | (0.00502) | (0.00407) | (0.00324) | (0.00314) | (0.00353) | |
| INFRA | −0.00555 | 1.10 × 10⁻⁵ | −0.00557 | −0.00556 | −0.00555 | −0.00554 | −0.00553 |
| (0.00879) | (0.00478) | (0.0161) | (0.0126) | (0.00854) | (0.00578) | (0.00536) | |
| PROD | −0.00489 | −0.00576 | 0.00493 | 0.000445 | −0.00526 | −0.0105 | −0.0144 * |
| (0.00690) | (0.00440) | (0.0114) | (0.00887) | (0.00686) | (0.00718) | (0.00864) | |
| Observations | 631 | 631 | 631 | 631 | 631 | 631 | 631 |
Note: * p-value < 0.1; ** p-value < 0.05; *** p-value < 0.01. Robust standard errors are in parenthesis. (a) indicates the location parameters, and (b) refers to the scale parameters.
Disclaimer/Publisher’s Note: The statements, opinions and data contained in all publications are solely those of the individual author(s) and contributor(s) and not of MDPI and/or the editor(s). MDPI and/or the editor(s) disclaim responsibility for any injury to people or property resulting from any ideas, methods, instructions or products referred to in the content. |
© 2023 by the author. Licensee MDPI, Basel, Switzerland. This article is an open access article distributed under the terms and conditions of the Creative Commons Attribution (CC BY) license (https://creativecommons.org/licenses/by/4.0/).
Share and Cite
MDPI and ACS Style
Gnangnon, S.K. Trade-Related Government Expenditure and Developing Countries’ Participation in Global Value Chains. Commodities 2024, 3, 1-18. https://doi.org/10.3390/commodities3010001
AMA Style
Gnangnon SK. Trade-Related Government Expenditure and Developing Countries’ Participation in Global Value Chains. Commodities. 2024; 3(1):1-18. https://doi.org/10.3390/commodities3010001
Chicago/Turabian StyleGnangnon, Sèna Kimm. 2024. "Trade-Related Government Expenditure and Developing Countries’ Participation in Global Value Chains" Commodities 3, no. 1: 1-18. https://doi.org/10.3390/commodities3010001