
Topical Advisory Panel applications are now closed. Please contact the Editorial Office with any queries.
Journal Description
Atmosphere
Atmosphere
is an international, peer-reviewed, open access journal of scientific studies related to the atmosphere, published monthly online by MDPI. The Italian Aerosol Society (IAS) and Working Group of Air Quality in European Citizen Science Association (ECSA) are affiliated with Atmosphere and their members receive a discount on the article processing charges.
- Open Access— free for readers, with article processing charges (APC) paid by authors or their institutions.
- High Visibility: indexed within Scopus, SCIE (Web of Science), Ei Compendex, GEOBASE, GeoRef, Inspec, CAPlus / SciFinder, Astrophysics Data System, and other databases.
- Journal Rank: CiteScore - Q2 (Environmental Science (miscellaneous))
- Rapid Publication: manuscripts are peer-reviewed and a first decision is provided to authors approximately 20.4 days after submission; acceptance to publication is undertaken in 2.6 days (median values for papers published in this journal in the first half of 2026).
- Recognition of Reviewers: reviewers who provide timely, thorough peer-review reports receive vouchers entitling them to a discount on the APC of their next publication in any MDPI journal, in appreciation of the work done.
- Testimonials: See what our editors and authors say about Atmosphere.
- Companion journals for Atmosphere include: Meteorology and Aerobiology.
- Journal Cluster of Geospatial and Earth Sciences: Remote Sensing, Atmosphere, Geosciences, Climate, Quaternary, Earth, Geographies, Geomatics, Meteorology and Fossil Studies.
Impact Factor:
2.6 (2025);
5-Year Impact Factor:
2.8 (2025)
Latest Articles
Open-Loop Generative AI Nowcasting of Dense Marine Fog Visibility from the FATIMA Grand-Banks Campaign Measurements Using Multiple Lookback Windows
Atmosphere 2026, 17(8), 749; https://doi.org/10.3390/atmos17080749 (registering DOI) - 31 Jul 2026
Abstract
Reduced visibility due to fog poses significant safety and operational risks in marine environments, emphasizing the need for accurate short-term nowcasting. Typical machine learning forecasting models fail to capture temporal meteorological dependencies that influence fog dynamics, due to the reliance on data assimilated
[...] Read more.
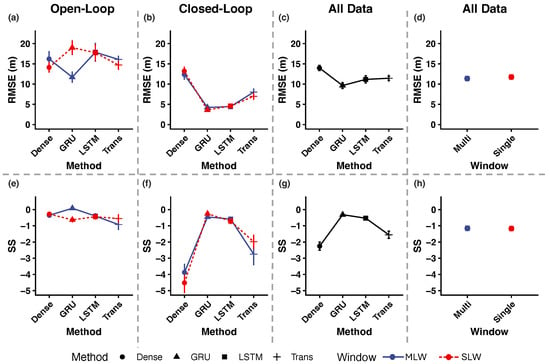
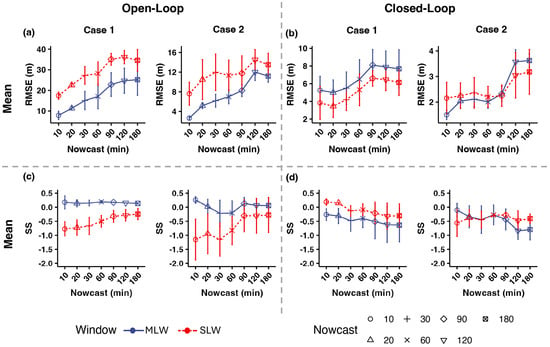
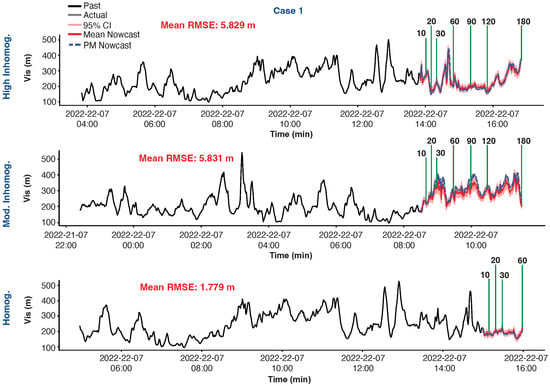
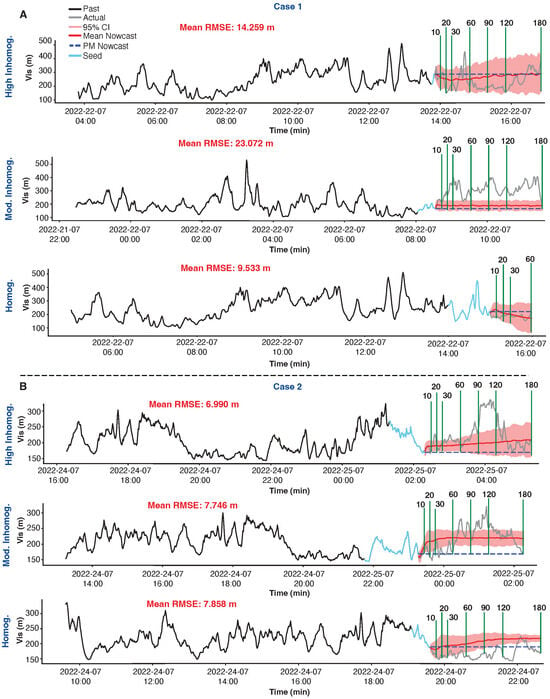
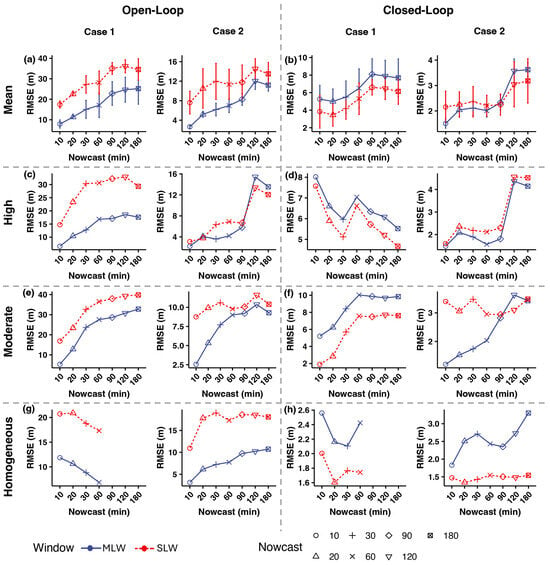
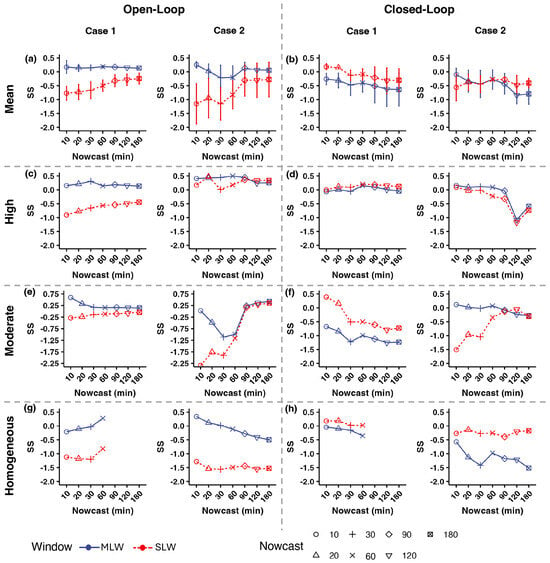
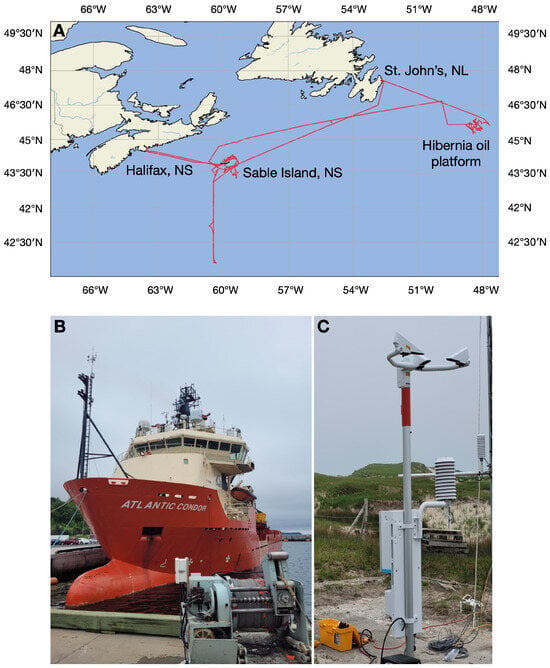
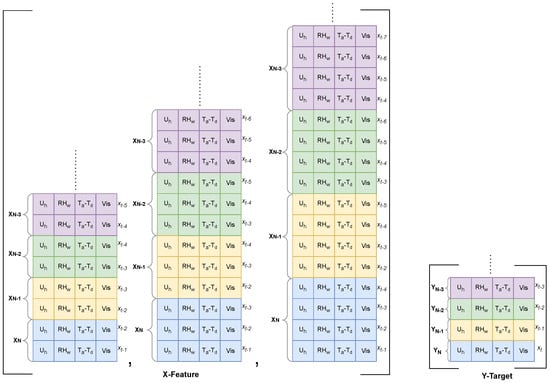
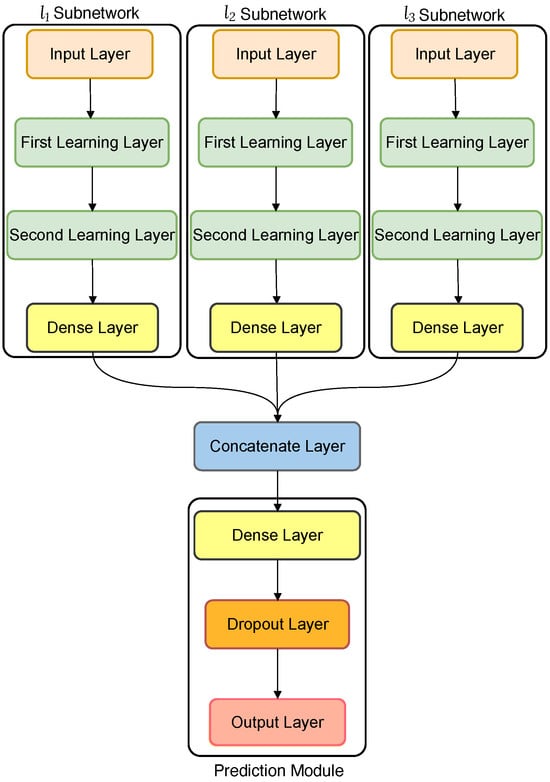
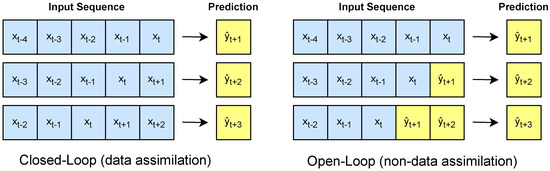
Reduced visibility due to fog poses significant safety and operational risks in marine environments, emphasizing the need for accurate short-term nowcasting. Typical machine learning forecasting models fail to capture temporal meteorological dependencies that influence fog dynamics, due to the reliance on data assimilated measurements for closed-loop time series prediction. This work introduces a novel multiple lookback window (MLW) architecture that utilizes the recurrent neural network model of Gated Recurrent Units (GRU) to nowcast dense fog visibility (Vis < 400 m) time series. This architecture facilitates learning the short- and long-term dependencies in meteorological data for non-data assimilation (open-loop) time series prediction. Prediction intervals were obtained using Bayesian approximation at confidence interval. Vis time series nowcasts were obtained using autoregressive generation at increasing lead times, without relying on the assimilation of future observations and were evaluated across various fog Vis conditions characterized by its coefficient of variation. Marine fog Vis conditions and measurements were collected using instrumentation mounted on the Research Vessel Atlantic Condor from the FATIMA (Fog and turbulence interactions in the marine atmosphere) campaign in July 2022 in the Grand Banks and Sable Island areas of the North Atlantic region of Canada. The MLW-architecture with the GRU model outperformed the naïve persistence model nowcast for open-loop nowcasting dense fog Vis, with a mean RMSE of ( error at 400 m) and Skill Score of . The best nowcasting occurred at the 10 and 20 min lead times, where the mean Skill Score across both lead times was and the RMSE was m ( error at 400 m) and in high variability conditions with a mean SS of and RMSE of ( error at 400 m). Thus, the proposed model is robust and practical for dense fog Vis nowcasting.
Full article
(This article belongs to the Section Atmospheric Techniques, Instruments, and Modeling)
►
Show Figures
Open AccessArticle
Is an Artificial Neural Network Able to Reproduce Atmospheric Turbulent Fluxes of a Large Eddy Simulation?
by
Benjamin Körner, Volker Wulfmeyer and Marcus Breil
Atmosphere 2026, 17(8), 748; https://doi.org/10.3390/atmos17080748 (registering DOI) - 31 Jul 2026
Abstract
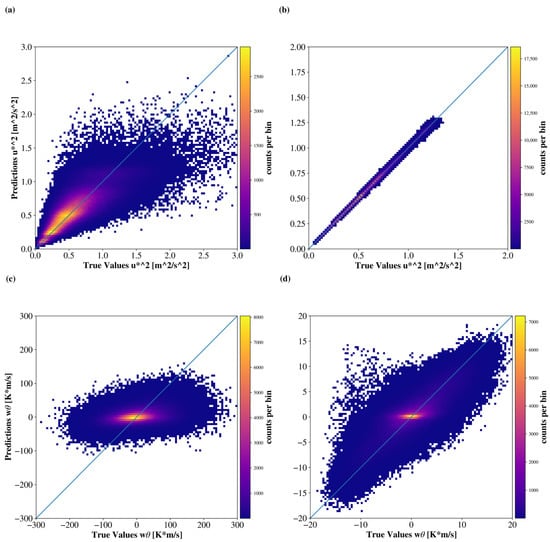
This study explores the potential of Artificial Neural Networks (ANNs) for the calculation of momentum and sensible heat fluxes. The ANN is applied on idealized Large Eddy Simulation (LES) data. The LES test cases used to train the ANN correspond to convective conditions
[...] Read more.
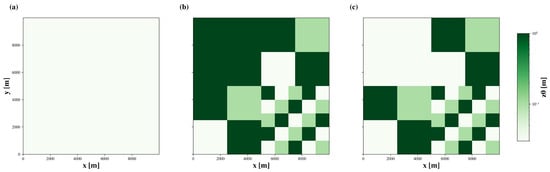
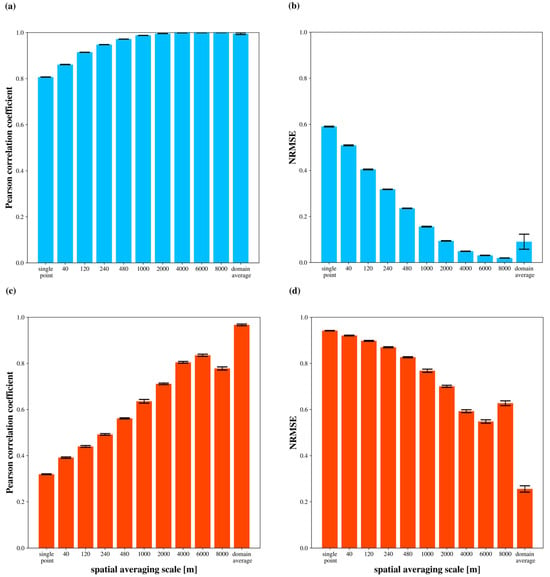
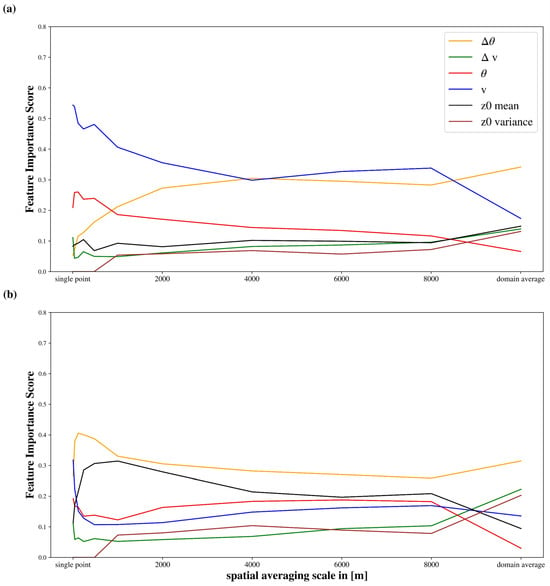
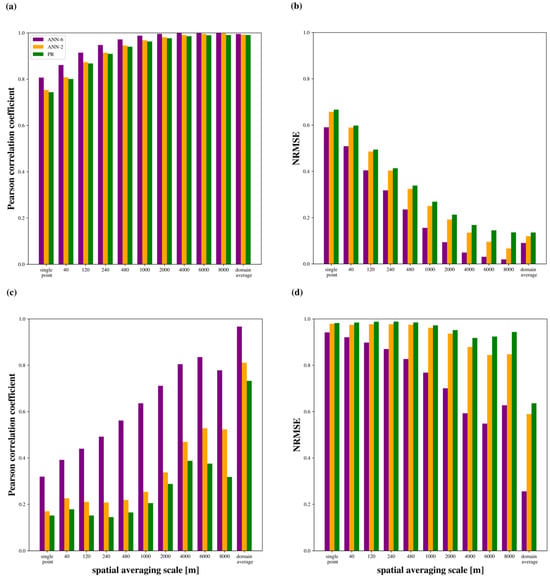
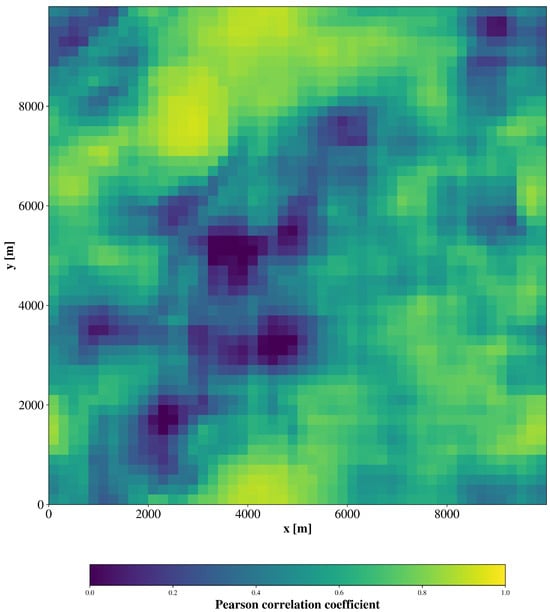
This study explores the potential of Artificial Neural Networks (ANNs) for the calculation of momentum and sensible heat fluxes. The ANN is applied on idealized Large Eddy Simulation (LES) data. The LES test cases used to train the ANN correspond to convective conditions with partially low wind speeds and heterogeneous surfaces. To enable the ANN to learn the systematics of such conditions, the input variables for the ANN include the variables that are used in Monin Obukhov Similarity Theory (MOST) and an additional variable that accounts for the heterogeneity of the land surface. Simulation data is averaged over 30 min and different spatial scales. Our findings show that the modeling skill is generally higher for momentum flux than for sensible heat flux. Also, the performance increases with larger spatial-averaging scales. The ANN calculates momentum flux with a correlation of 0.81 and a normalized RMSE of 0.59 for a single grid point. On a spatial-averaging scale of 4000 m, the correlation changes to almost 1.00 and the normalized RMSE to 0.05. The importance of each input variable for model performance is determined with a feature importance weighting. Their relative importance depends strongly on the spatial-averaging scale. The importance of the variable that represents the influence of surface heterogeneity is low at smaller spatial-averaging scales, but increases at larger averaging scales. However, its contribution to the modeling skill is small. Reducing the number of input variables to two results in a substantial loss of performance. Although our results demonstrate the potential of this approach to improve the calculation of momentum and sensible heat fluxes, it is also clear that there are simplifications and limitations in the present setup that need to be overcome to assess general applicability. These include the height of analysis (40 m instead of 10 m or less), the exclusion of all latent heat processes, the exclusion of stable conditions, the data coverage of the required parameter space, and the usage of only surface roughness length to define surface heterogeneity.
Full article
(This article belongs to the Section Biosphere/Hydrosphere/Land–Atmosphere Interactions)
►▼
Show Figures

Figure 1
Open AccessReview
Interplay Between Meteorology and Seasonality in Urban Air Pollution Across Selected Cities in East, South, and Southeast Asia: A Comparative Review
by
Shimul Roy, Yun Fat Lam, Rezuana Afrin, Nowara Tamanna Meghla, Md. Mahbubul Hoque and Mehnaz Abbasi Badhan
Atmosphere 2026, 17(8), 747; https://doi.org/10.3390/atmos17080747 (registering DOI) - 30 Jul 2026
Abstract
Air pollution is a growing environmental issue in rapidly urbanizing Asian cities, where meteorological conditions and seasonal variability strongly influence pollutant concentrations. This review synthesizes published evidence on the interactions between meteorology, seasonality, and urban air pollution across selected cities in East Asia,
[...] Read more.
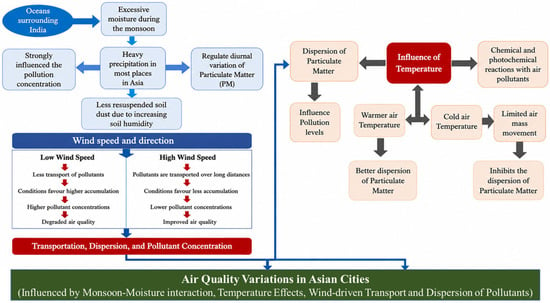
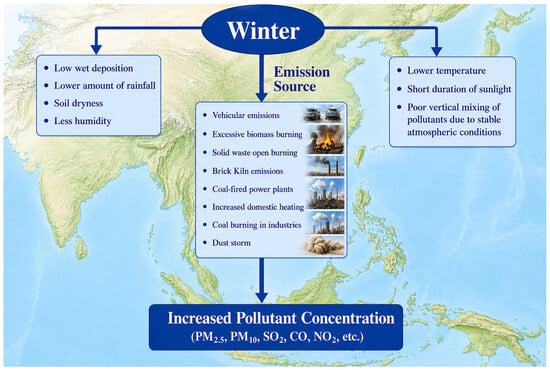
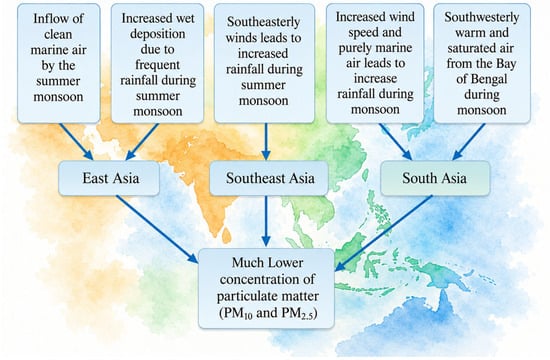
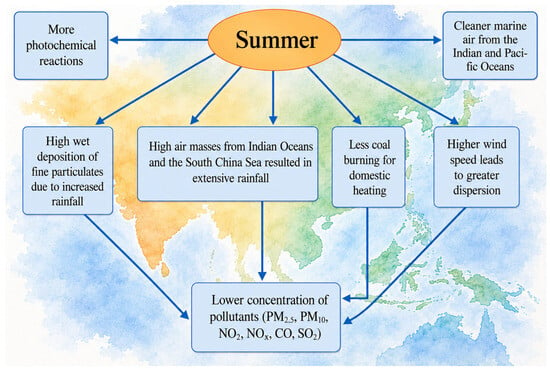
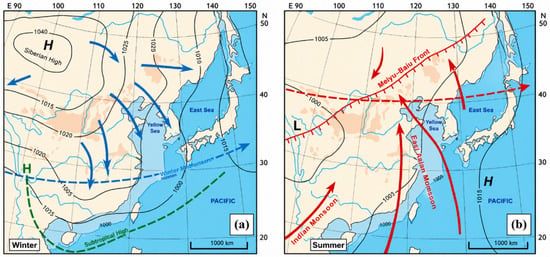
Air pollution is a growing environmental issue in rapidly urbanizing Asian cities, where meteorological conditions and seasonal variability strongly influence pollutant concentrations. This review synthesizes published evidence on the interactions between meteorology, seasonality, and urban air pollution across selected cities in East Asia, South Asia, and Southeast Asia. The literature was collected from major scientific databases and organized according to meteorological drivers, seasonal characteristics, and dominant emission sources. Particular emphasis was placed on particulate matter (PM2.5 and PM10), SO2, NO2, NOx, CO, and O3. The reviewed studies indicate that wind speed and direction, precipitation, temperature, atmospheric stability, and monsoon circulation strongly influence pollutant transport, dispersion, and removal. Pollutant concentrations generally reach their highest in winter due to stagnant conditions and higher human emissions. In contrast, the summer and monsoon seasons tend to have lower PM levels due to better atmospheric mixing and wet deposition. Regional differences in dominant sources were also observed, including coal combustion and heating in East Asia, traffic and biomass burning in South Asia, and biomass burning and transboundary transport in Southeast Asia. These findings highlight the importance of seasonally adaptive and region-specific air quality management strategies in Asian cities.
Full article
(This article belongs to the Special Issue Effects of Natural and Anthropogenic Factors on Climate and Environment (3rd Edition))
►▼
Show Figures

Figure 1

Open AccessArticle
Unified Regulatory Framework for NPP-Based Ecosystem Carbon Absorption Capacity and Its Application in China
by
Wei Zhao, Weihua Gu, Fenghua Bai, Ying Xiao, Hao Wang and Fangyuan Liang
Atmosphere 2026, 17(8), 746; https://doi.org/10.3390/atmos17080746 - 30 Jul 2026
Abstract
Terrestrial ecosystem carbon absorption capacity has become an important component of China’s strategy to enhance nature-based climate mitigation. However, existing studies on China’s terrestrial ecosystem carbon dynamics are still insufficient to support source-oriented control and unified supervision by national-level government departments, particularly in
[...] Read more.
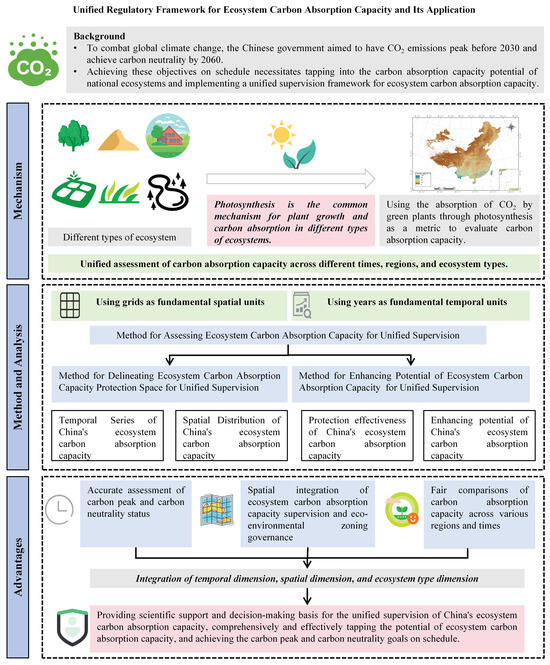
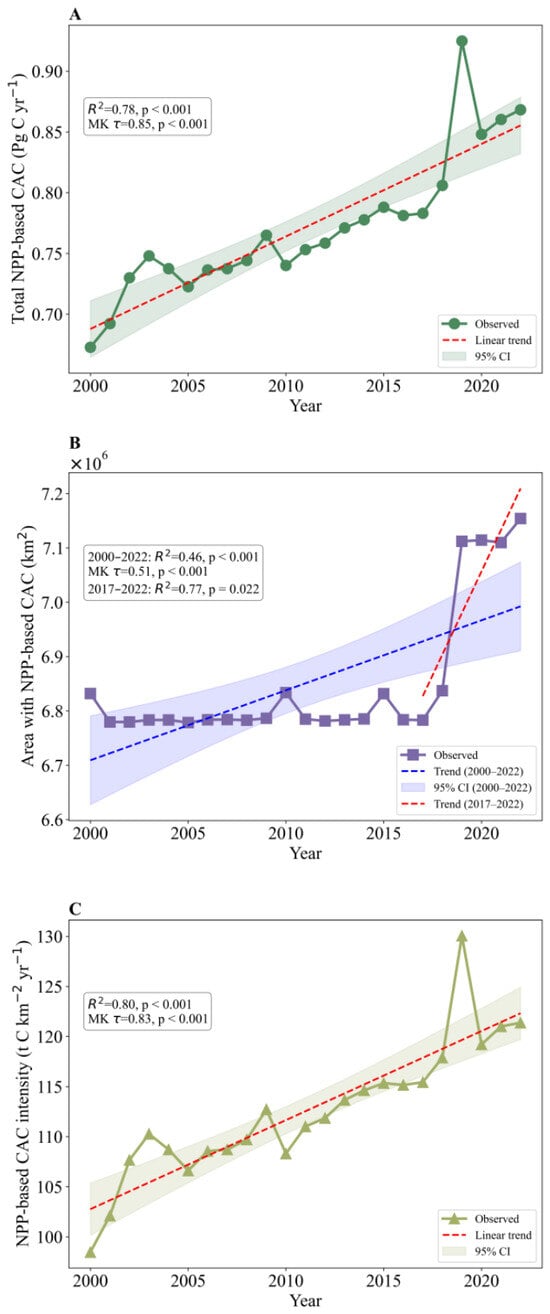
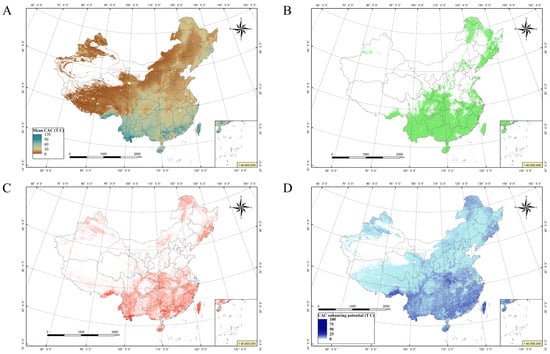
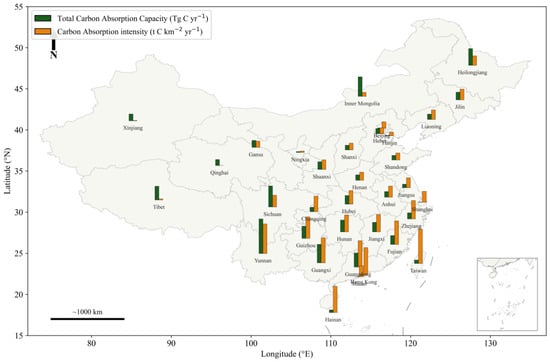
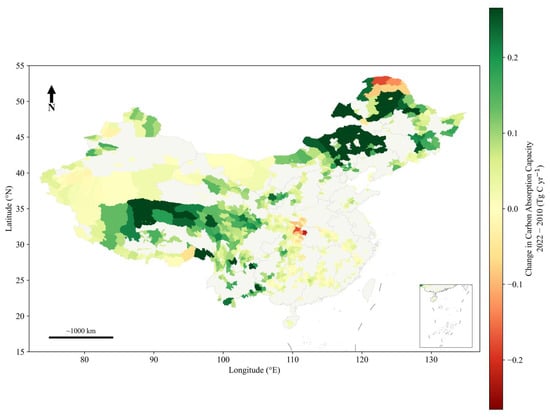
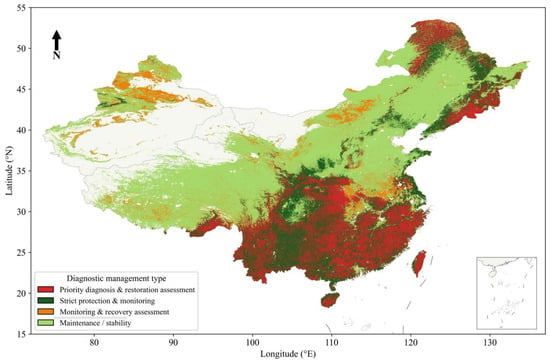
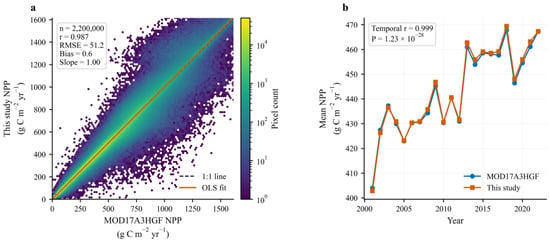
Terrestrial ecosystem carbon absorption capacity has become an important component of China’s strategy to enhance nature-based climate mitigation. However, existing studies on China’s terrestrial ecosystem carbon dynamics are still insufficient to support source-oriented control and unified supervision by national-level government departments, particularly in terms of temporal consistency, spatial completeness, and cross-ecosystem comparability. Here, we present a systematic assessment framework for NPP-based ecosystem carbon absorption capacity (NPP-based CAC) designed to support unified ecological and environmental supervision. In this study, NPP-based CAC is defined as the annual vegetation production-based carbon fixation capacity derived from net primary productivity. It represents carbon retained by vegetation after plant autotrophic respiration has been accounted for in the NPP estimation, and it should not be interpreted as gross ecosystem carbon uptake, NEP, NBP, net land–atmosphere carbon exchange, or a carbon sink for carbon neutrality accounting. The framework adopts year as the temporal unit and a 500 m × 500 m grid as the spatial unit, and integrates four core components: temporal series analysis, spatial distribution mapping, protection effectiveness evaluation, and enhancement potential estimation. Applying this framework to China from 2000 to 2022, we found that national NPP-based CAC increased from 0.673 Pg C yr−1 in 2000 to 0.868 Pg C yr−1 in 2022, with carbon absorption intensity rising from 98.47 to 121.37 t C km−2 yr−1. High-value areas covered 3,009,571 km2, accounting for 40.90% of the national area with NPP-based CAC, whereas areas showing degradation signals covered 2,075,286 km2, accounting for 29.01%. The national historical reference gap, termed enhancement potential in this framework, was estimated at 152.63 Tg C yr−1, equivalent to 17.6% of the 2022 national total; this value represents the difference between current NPP-based CAC and grid-level historical maxima, rather than a directly attainable restoration target. Because no formal attribution analysis was conducted, the observed temporal and spatial patterns are interpreted as diagnostic changes in NPP-based CAC rather than as direct evidence of policy effects or ecosystem degradation. This framework enables integrated assessment across temporal, spatial, and ecosystem-type dimensions and provides an operational diagnostic basis for national-level ecological supervision, spatial prioritization, and follow-up attribution or field verification.
Full article
(This article belongs to the Section Climatology)
►▼
Show Figures

Figure 1
Open AccessArticle
Comparing Parameter Estimation Methods for Daily Maximum PM10 Data in the Presence of Anomalously Large Observations
by
Demet Aydin
Atmosphere 2026, 17(8), 745; https://doi.org/10.3390/atmos17080745 - 30 Jul 2026
Abstract
Real-world datasets may contain unusually large observations whose origin cannot always be clearly identified. When such observations are present, selecting an appropriate estimation method becomes particularly important because they may substantially influence distribution fitting and parameter estimation. In this study, daily maximum PM
[...] Read more.
Real-world datasets may contain unusually large observations whose origin cannot always be clearly identified. When such observations are present, selecting an appropriate estimation method becomes particularly important because they may substantially influence distribution fitting and parameter estimation. In this study, daily maximum PM10 data recorded at the Erfelek Station in Sinop (Türkiye) during 2025 were analyzed, and several probability distributions were fitted. The lognormal (LN) distribution provided the best overall fit according to the goodness-of-fit criteria. To evaluate the sensitivity of estimation methods to unusually large observations, contamination scenarios were considered, and the performances of Weighted Least Absolute Deviation-1 (WLAD-1), Weighted Least Absolute Deviation-2 (WLAD-2), Least Absolute Deviation (LAD), Least Squares (LS), Least Median of Squares (LMS), and Maximum Likelihood (ML) were compared. The results indicate that WLAD-2 and LMS are the most robust estimators, remaining unaffected by outliers across all contamination levels. WLAD-1, LAD, and LS are also only negligibly affected, whereas the ML estimator becomes increasingly sensitive as the contamination level increases. Contamination also affects exceedance probabilities and return periods, with substantially greater changes observed for the ML estimator than for the remaining estimators.
Full article
(This article belongs to the Special Issue Urban Air Quality and Particulate Matter: From Source Apportionment to Human Exposure)
Open AccessArticle
Trends in Wind Waves and Wind Speed in the Eurasian Arctic Seas
by
Elizaveta Kruglova and Stanislav Myslenkov
Atmosphere 2026, 17(8), 744; https://doi.org/10.3390/atmos17080744 - 30 Jul 2026
Abstract
Despite numerous studies on Arctic wave climate changes associated with sea ice retreat, the spatiotemporal relationship between wind variability and significant wave heights in the Eurasian Arctic remains insufficiently understood. This study analyzes wave and wind variability in the Eurasian Arctic seas for
[...] Read more.
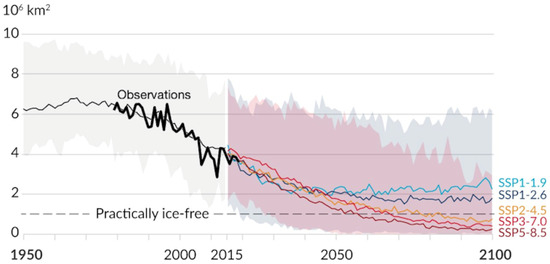
Despite numerous studies on Arctic wave climate changes associated with sea ice retreat, the spatiotemporal relationship between wind variability and significant wave heights in the Eurasian Arctic remains insufficiently understood. This study analyzes wave and wind variability in the Eurasian Arctic seas for 1979–2025 using the spectral wave model WAVEWATCH III. The quality of the modeling was verified against satellite altimetry and buoy data; the average correlation coefficient exceeded 0.9, and the RMSE was 0.368 m. An analysis of 3-hourly significant wave height (Hs) and wind speed data revealed positive trends in mean annual Hs across the Arctic, with the strongest statistically significant increases in the Barents and Kara Seas. Extreme wave conditions (95th percentile) showed the largest growth in the Kara, East Siberian, and Chukchi Seas. During ice-free periods, significant trends were weaker and more localized, although positive trends persisted near the Northern Sea Route. Mean wind speed trends were generally positive but mostly statistically insignificant. The results provide a spatially consistent characterization of long-term changes in wind and wave climate under evolving sea-ice conditions and may be used to inform assessments of navigation conditions and associated risks along the Northern Sea Route.
Full article
(This article belongs to the Special Issue Wind and Wave Climate Variability and Its Impacts on Coastal and Marine Environments)
Open AccessArticle
Intensification of Heat Extremes and Spatial Variability of Rainfall in Mainland Portugal (1980–2025): Insights from ETCCDI Indices Based on ERA5-Land Data
by
Carla Larissa Fonseca da Silva, Maria Manuela Portela, Luis Angel Espinosa and José Pedro Matos
Atmosphere 2026, 17(8), 743; https://doi.org/10.3390/atmos17080743 - 30 Jul 2026
Abstract
This study analyzes trends in 18 temperature- and precipitation-related indices recommended by the Expert Team on Climate Change Detection and Indices (ETCCDI) across mainland Portugal over the most recent 46-year complete period (1980–2025), using ERA5-Land reanalysis data. Prior to the computation of the
[...] Read more.
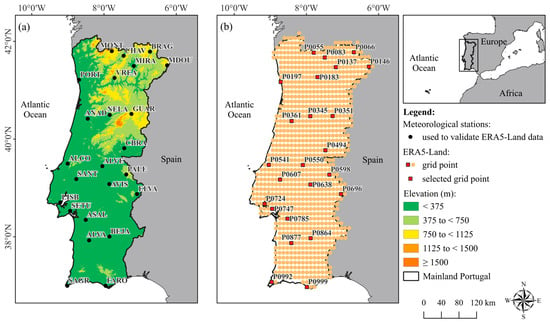
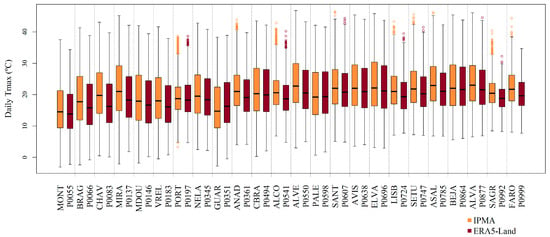
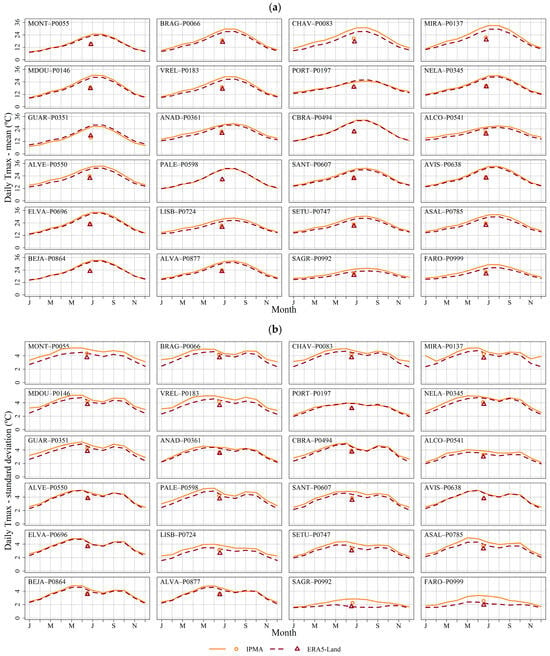
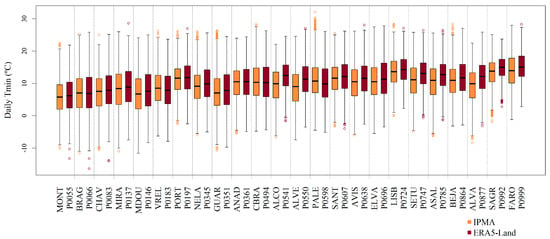
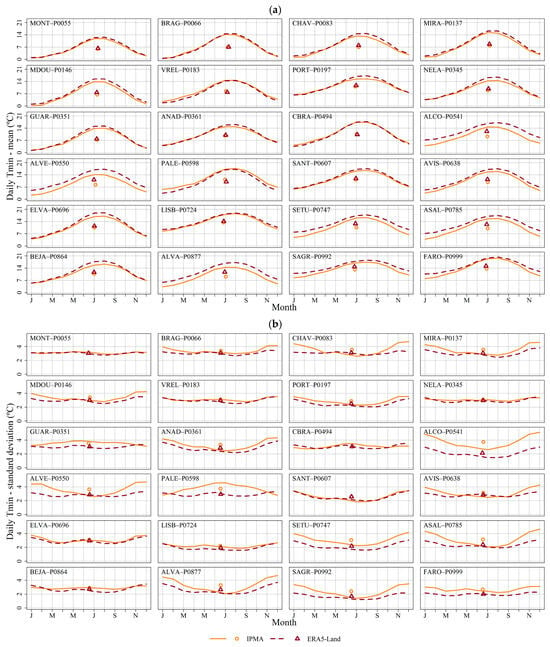
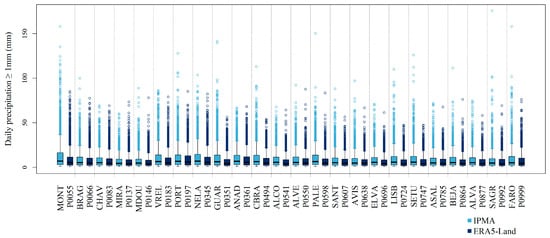
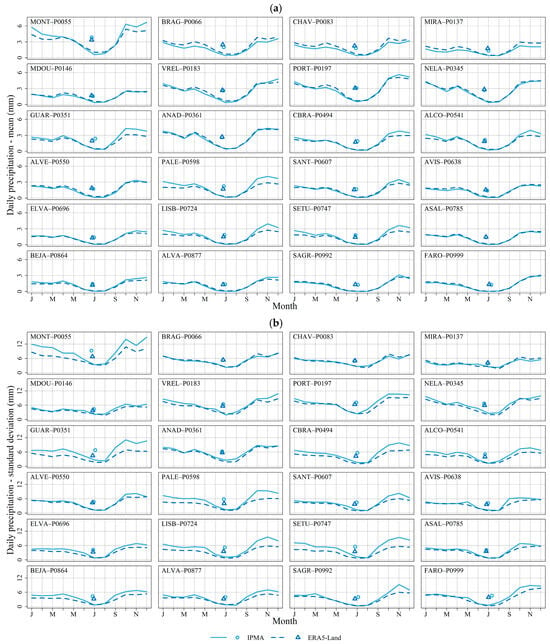
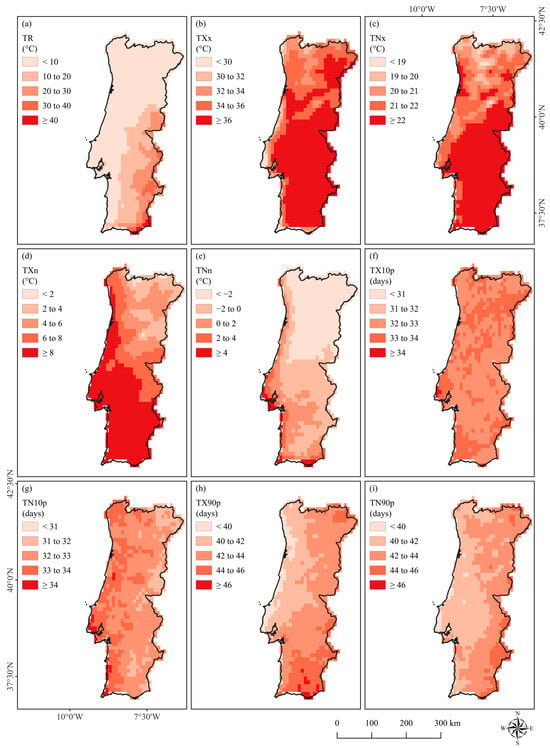
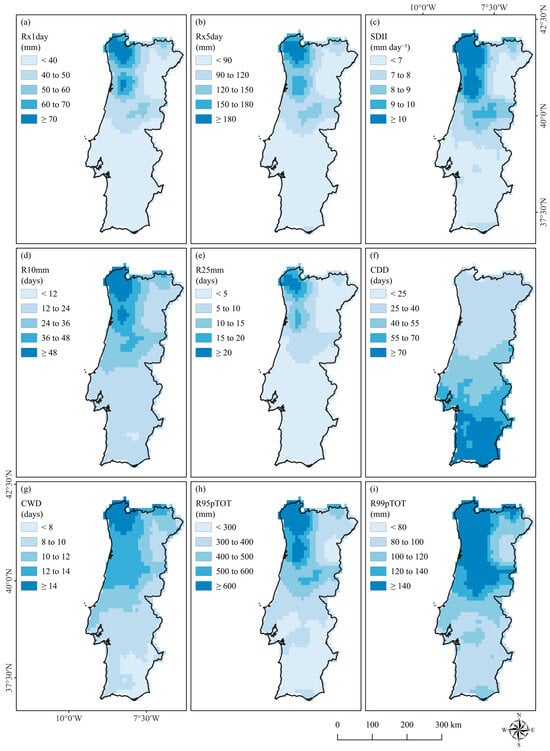
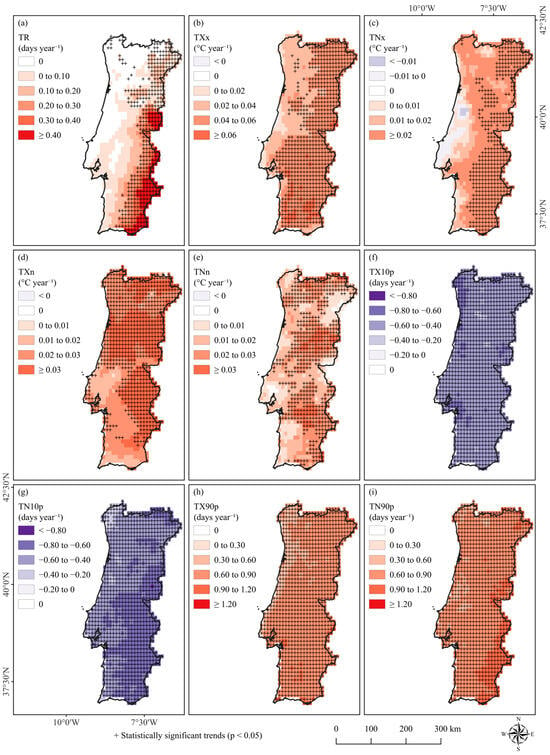
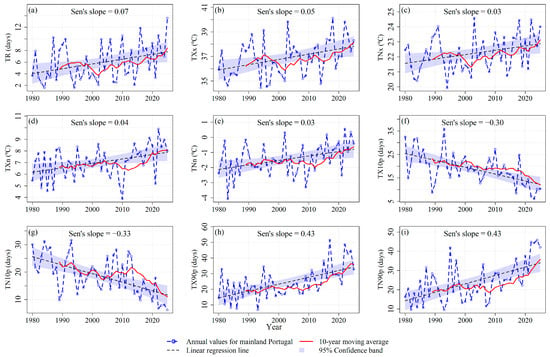
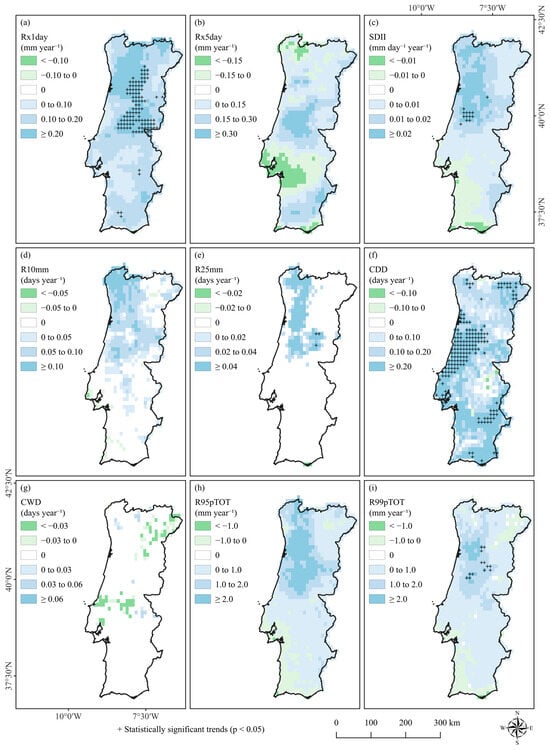
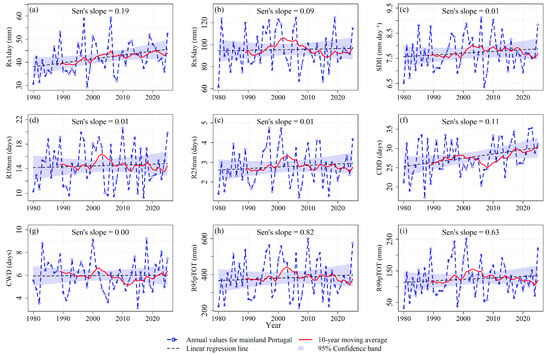
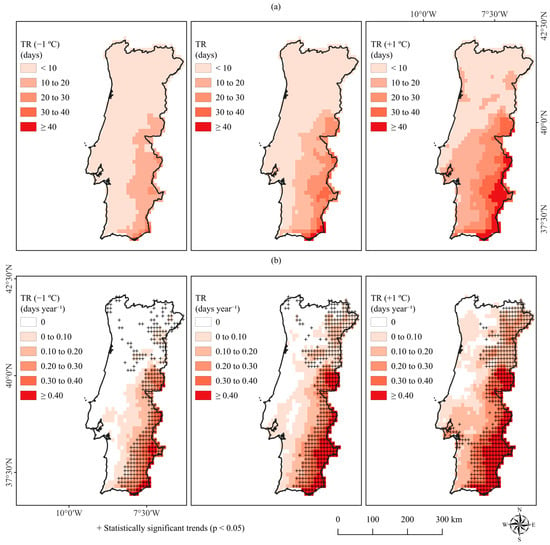
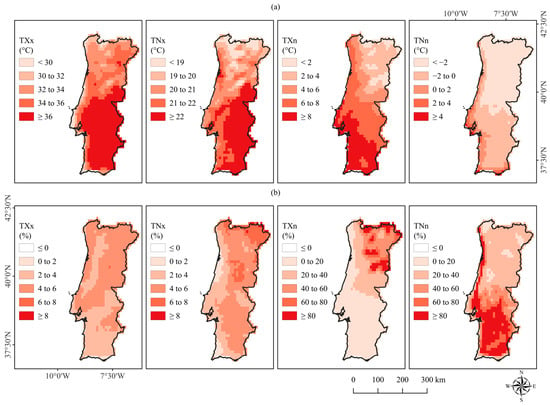
This study analyzes trends in 18 temperature- and precipitation-related indices recommended by the Expert Team on Climate Change Detection and Indices (ETCCDI) across mainland Portugal over the most recent 46-year complete period (1980–2025), using ERA5-Land reanalysis data. Prior to the computation of the indices, daily ERA5-Land extreme temperature and precipitation data were validated against ground-based observations, showing good agreement and confirming the suitability of the reanalysis dataset for assessing climate extremes at the national scale. The results reveal a consistent and statistically significant warming signal across the study area, with the strongest increases observed in southern and inland regions. The frequency of extreme heat events has intensified markedly since the early 2000s. In contrast, precipitation-related indices display high spatial variability and trends with limited statistical significance, reflecting both genuine climatic heterogeneity and the inherent challenges of reproducing rainfall extremes in complex terrain using reanalysis data. The combined interpretation highlights an emerging climatic asymmetry—robust and spatially coherent warming versus localized and uncertain precipitation trends—underscoring distinct regional vulnerabilities. The findings provide actionable insights for climate services, supporting the design of region-specific adaptation strategies in Portugal, especially the need to address increasing heat stress in southern regions and the growing exposure to short-duration heavy rainfall in northern areas.
Full article
(This article belongs to the Section Climatology)
►▼
Show Figures

Figure 1

Open AccessArticle
Air Quality Monitoring in Secondary School Classes in Warsaw—Measurements and Correlation
by
Daniel Dębkowski, Katarzyna Gładyszewska-Fiedoruk, Marcin Krukowski, Adam Kozioł and Tomasz Teleszewski
Atmosphere 2026, 17(8), 742; https://doi.org/10.3390/atmos17080742 - 30 Jul 2026
Abstract
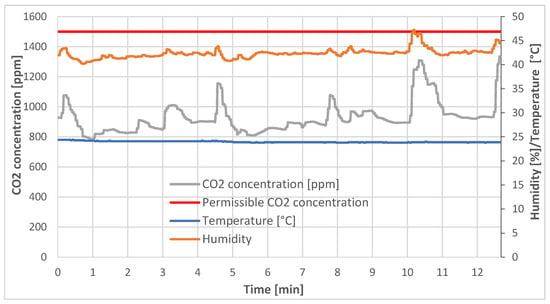
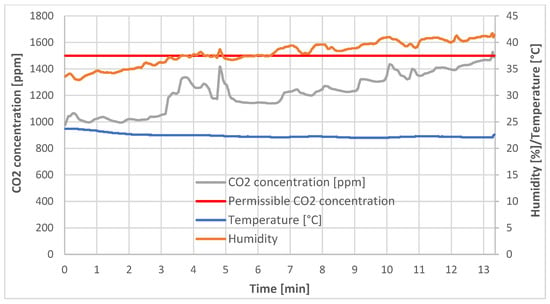
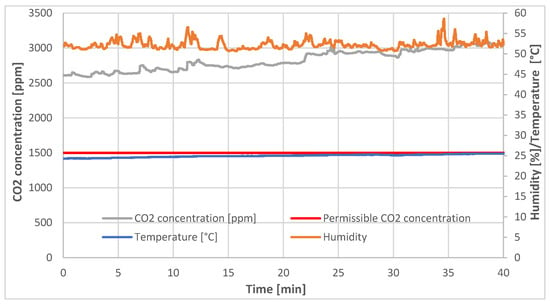
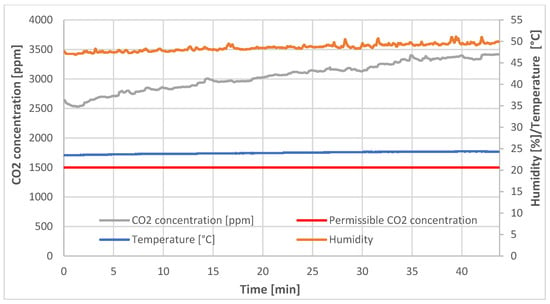
This article discusses the results of measurements and surveys on indoor air quality in Warsaw secondary school classrooms. Measuring selected air parameters and basing them on subjective user assessments enables a comprehensive diagnosis that identifies key issues. Temperature, humidity, and carbon dioxide concentration
[...] Read more.
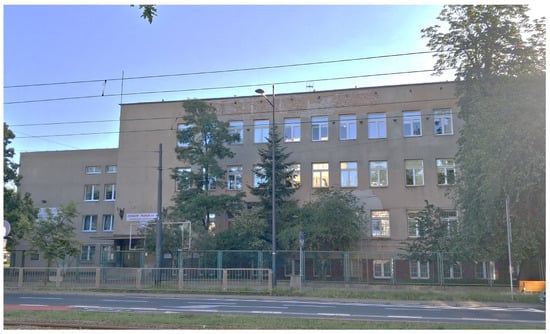
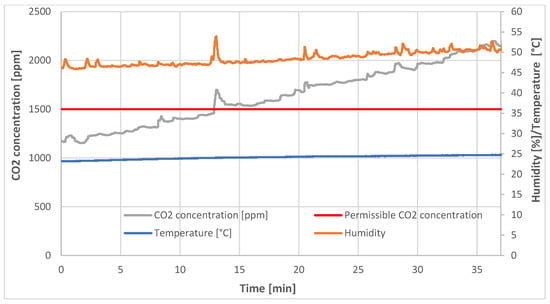
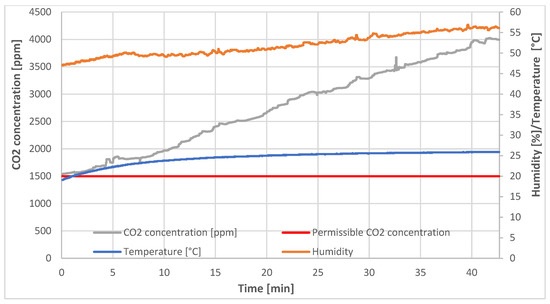
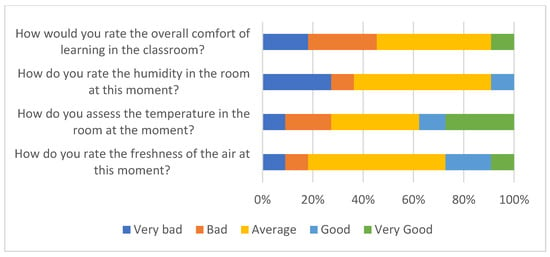
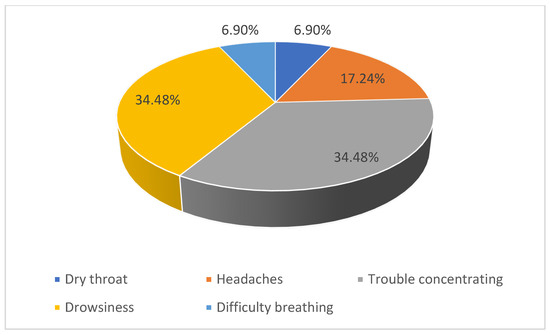
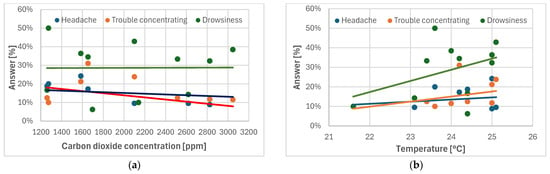
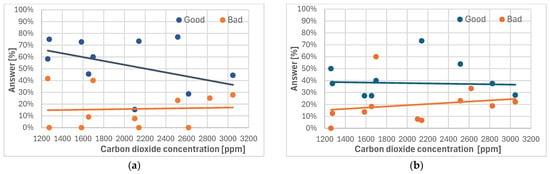
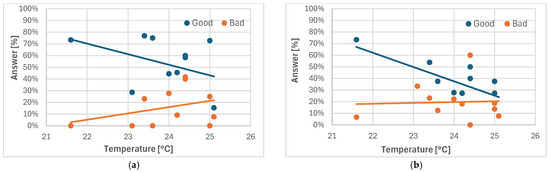
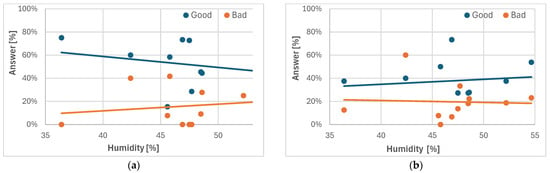
This article discusses the results of measurements and surveys on indoor air quality in Warsaw secondary school classrooms. Measuring selected air parameters and basing them on subjective user assessments enables a comprehensive diagnosis that identifies key issues. Temperature, humidity, and carbon dioxide concentration were measured in all rooms on the second floor. Concurrently, a survey was conducted among high school students. The aim of the survey was to gather students’ perceptions of the comfort of their stay in selected rooms and their opinions on air quality. The next step in the analysis was to correlate indoor air quality measurements with student perceptions. This allowed for the observation of numerous correlations and several paradoxes. An analysis of carbon dioxide concentration versus perceived comfort showed a distinct correlation. However, no correlation was observed between carbon dioxide concentration and perceived discomfort. Unfortunately, indoor air quality in all rooms where measurements were taken in the studied school was poor. The air parameters tested did not meet any standards. Students reported symptoms such as drowsiness, difficulty concentrating, and headaches, which are strongly associated with elevated carbon dioxide levels and impair learning efficiency.
Full article
(This article belongs to the Special Issue Ventilation and Indoor Air Quality)
►▼
Show Figures

Figure 1

Open AccessArticle
Spatial–Temporal Variations in Frost-Free Days During 1961–2023 in Qinghai Province, China
by
Fan Li, Guoqian Chen, Mengfan Zhao, Fei Li, Yingcun Yan and Liangdong Yan
Atmosphere 2026, 17(8), 741; https://doi.org/10.3390/atmos17080741 - 30 Jul 2026
Abstract
Rational development and utilization of cli mate resources are essential for mitigating frost disasters, particularly in high-altitude regions. This study investigates the spatiotemporal characteristics of frost events in Qinghai Province to improve understanding of frost evolution under climate change. Daily minimum temperature data
[...] Read more.
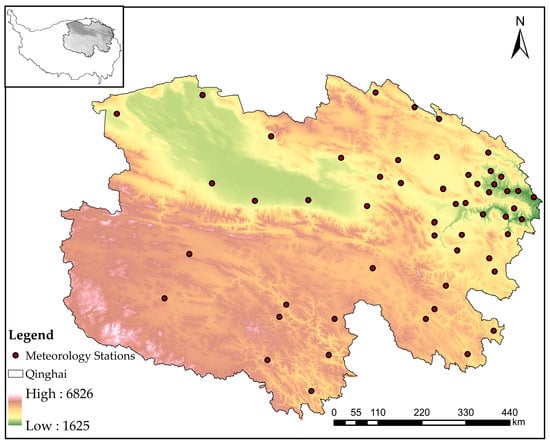
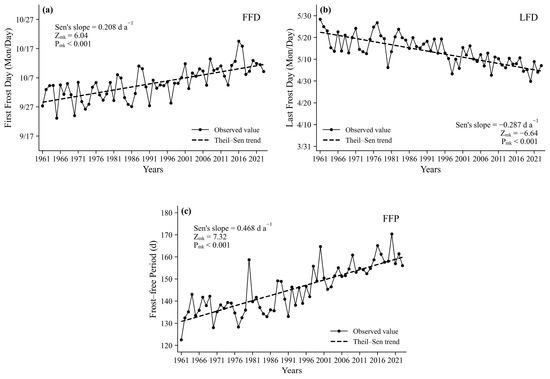
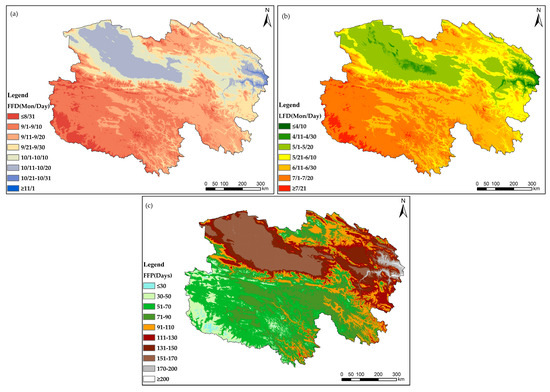
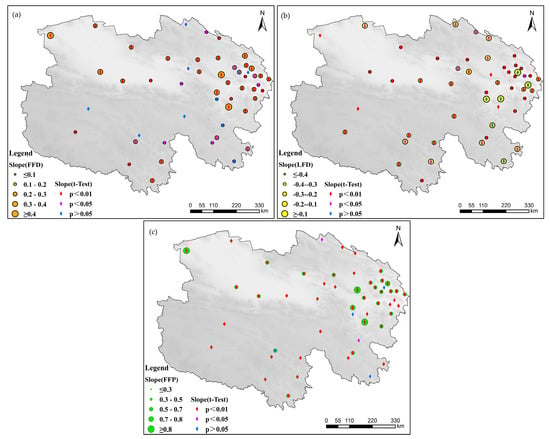
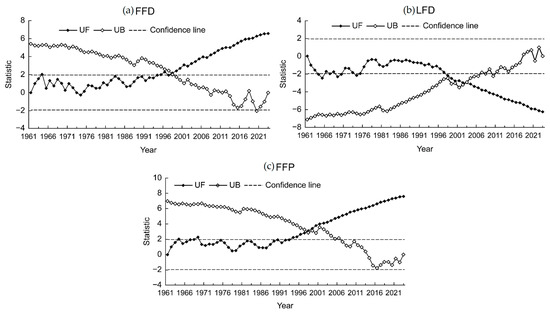
Rational development and utilization of cli mate resources are essential for mitigating frost disasters, particularly in high-altitude regions. This study investigates the spatiotemporal characteristics of frost events in Qinghai Province to improve understanding of frost evolution under climate change. Daily minimum temperature data from 51 meteorological stations from 1961 to 2023 were analyzed to determine the first frost date (FFD), last frost date (LFD), and frost-free period (FFP), along with their trends and influencing factors. Results show that the mean FFD, LFD, and FFP were 5 October, 14 May, and 144 days, respectively. Over the past six decades, LFD advanced, whereas FFD was delayed, leading to a marked extension of FFP, with trends of 2.08, 2.87, and 4.68 days per decade, respectively. These changes became more pronounced after the 1990s. Spatially, lower-altitude regions exhibited later FFD, earlier LFD, and longer FFP, whereas higher-altitude regions showed the opposite pattern. Correlation analysis indicates that frost characteristics are most strongly influenced by altitude, followed by latitude and longitude. Overall, climate warming has shortened the frost season and extended the growing period in Qinghai Province. These findings provide a scientific basis for optimizing agricultural zoning, adjusting cropping systems, and improving climate resilience in cold, high-altitude regions.
Full article
(This article belongs to the Section Climatology)
►▼
Show Figures

Figure 1

Open AccessArticle
Dual-Source Transport, Vertical Evolution, and Topographic Modulation of the March 2023 East Asian Dust Storm in the Context of 2000–2024 Spring Dust Variability
by
Yuxiang Ren, Jianhe Huang, Haipeng Duan, Xiaoyun Liu, Gulisumu Shayimu, Ruifeng Li and Ruming Chen
Atmosphere 2026, 17(8), 740; https://doi.org/10.3390/atmos17080740 - 30 Jul 2026
Abstract
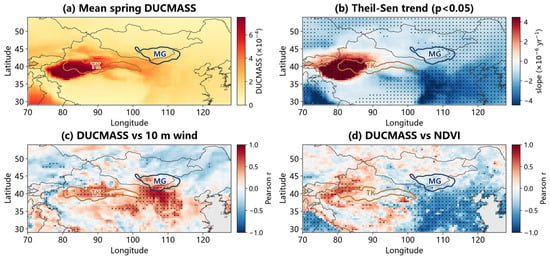
East Asian spring dust activity has generally weakened since the early 2000s (Theil-Sen trend −1.07 × 10⁻⁶ yr−1, significant over 62% of the domain), but severe events continue to occur when synoptic forcing, source-region dryness, and terrain-guided transport are favorably
[...] Read more.
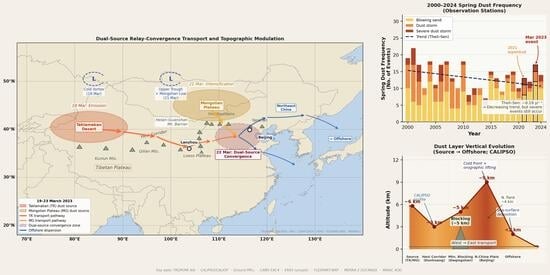
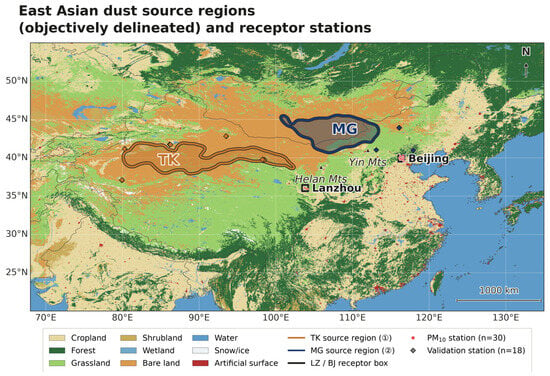
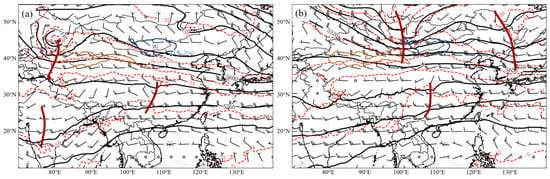
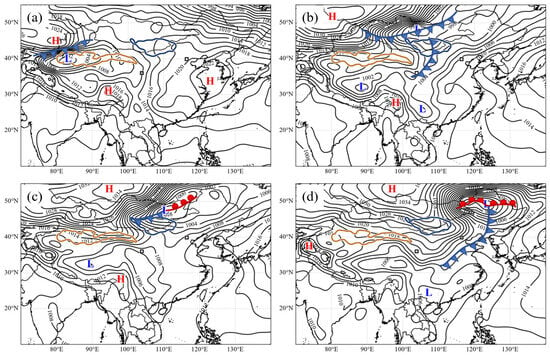
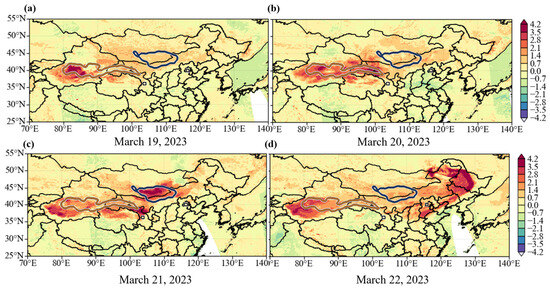
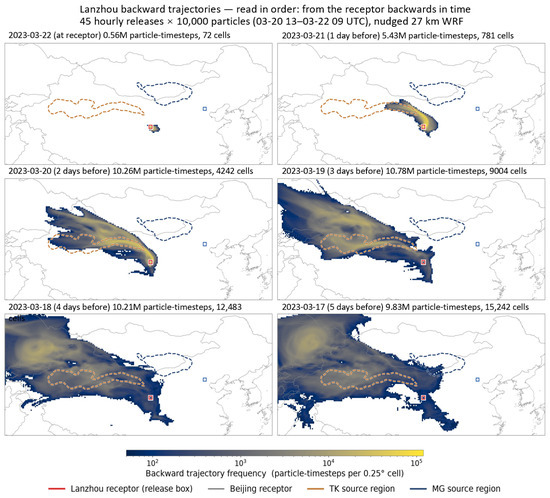
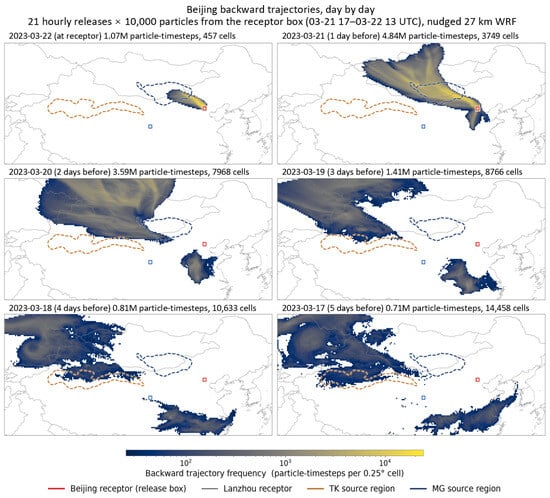
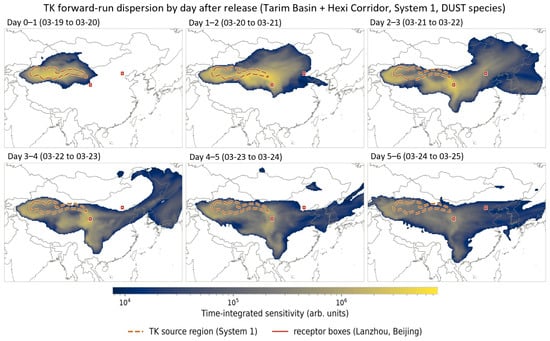
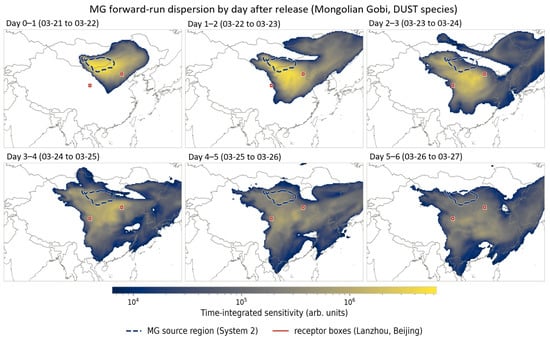
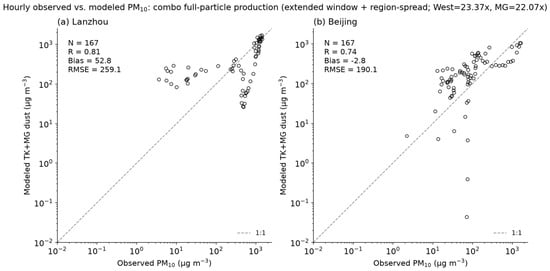
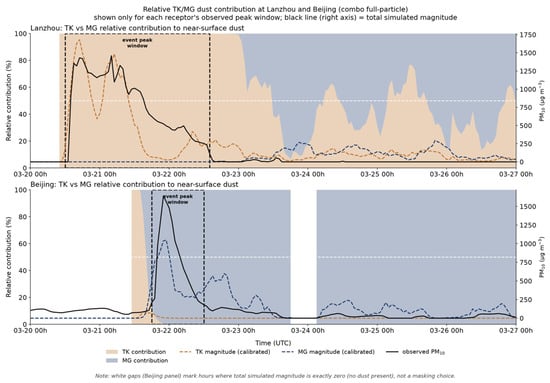
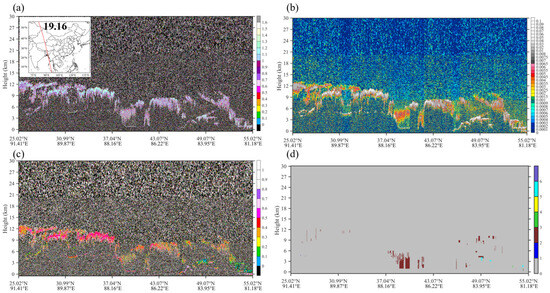
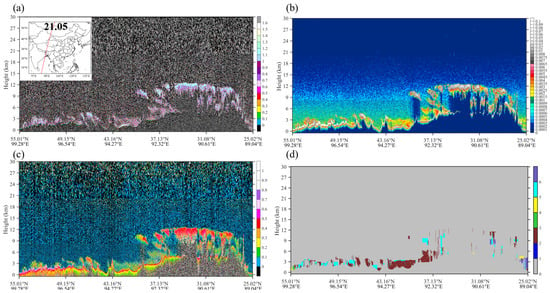
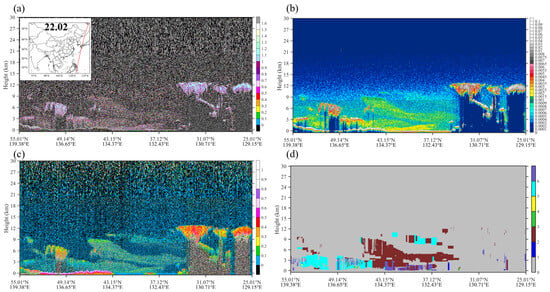
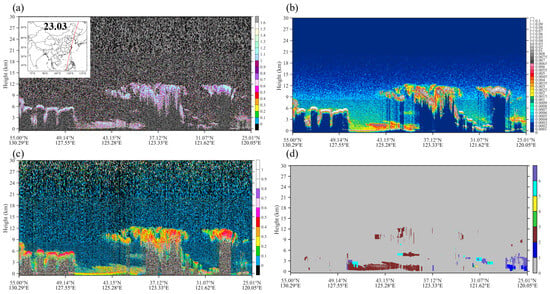
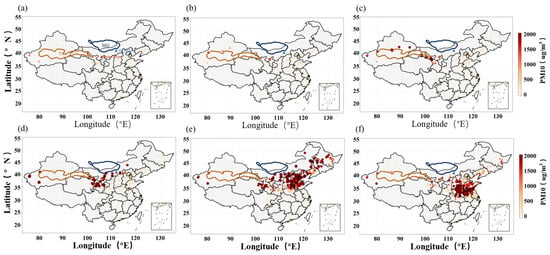
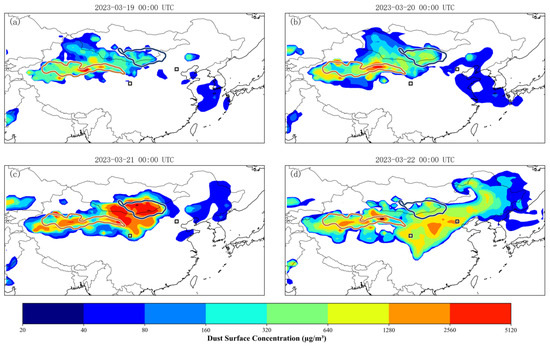
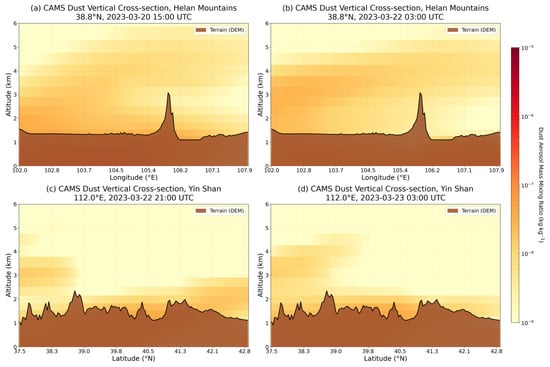
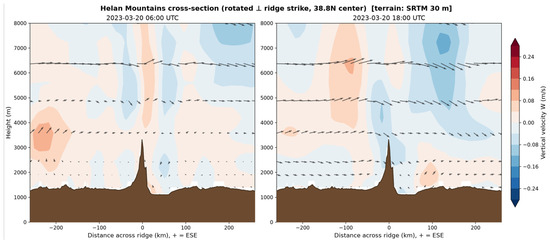
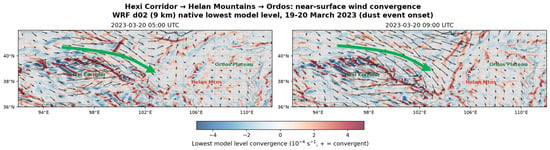
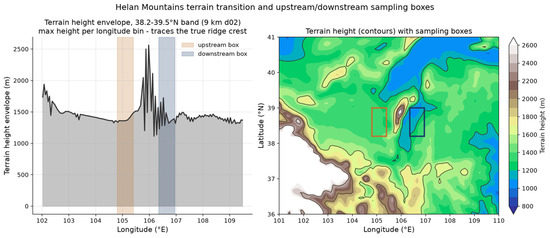
East Asian spring dust activity has generally weakened since the early 2000s (Theil-Sen trend −1.07 × 10⁻⁶ yr−1, significant over 62% of the domain), but severe events continue to occur when synoptic forcing, source-region dryness, and terrain-guided transport are favorably coupled. This study places the 19–23 March 2023 East Asian dust storm within this 2000–2024 background and provides an integrated three-dimensional analysis of its transport, vertical structure, and topographic controls. The event developed as a dual-source relay-convergence process: Taklamakan Desert dust was emitted first on 19 March and transported southeastward along the Hexi Corridor, while Mongolian Plateau dust intensified on 21 March and mainly affected North China. Independently calibrated, PM10-cross-validated FLEXPART-WRF trajectory arrays (R = 0.74–0.81) show Taklamakan contributed 100% of the calibrated near-surface dust mass at Lanzhou and Mongolian 98% at Beijing during each receptor’s event peak window. Four independent dynamical diagnostics quantify topographic control, showing the Helan Mountains attenuate westward-approaching Taklamakan dust by 23% across the range. TROPOMI AAI, CALIPSO, ground PM10, and CAMS EAC4 jointly corroborate multi-level cold-vortex/trough-frontal coupling and terrain blocking as the controlling mechanisms, demonstrating that extreme dust episodes can still occur under a weakening long-term background when dynamic lifting, dual-source activation, and topographic channeling act together.
Full article
(This article belongs to the Section Meteorology)
►▼
Show Figures

Graphical abstract
Open AccessArticle
Scenario-Based Assessment of Urban Heat-Stress Risk in Vilnius, Lithuania
by
Justina Kapilovaitė and Egidijus Rimkus
Atmosphere 2026, 17(8), 739; https://doi.org/10.3390/atmos17080739 - 30 Jul 2026
Abstract
Urban areas are increasingly exposed to heat stress under climate change due to rising temperatures, ageing populations, and increasing population density in cities. This study assesses current and future heat-stress risk in Vilnius, Lithuania, using the Humidex index and the CLIMADA risk modelling
[...] Read more.
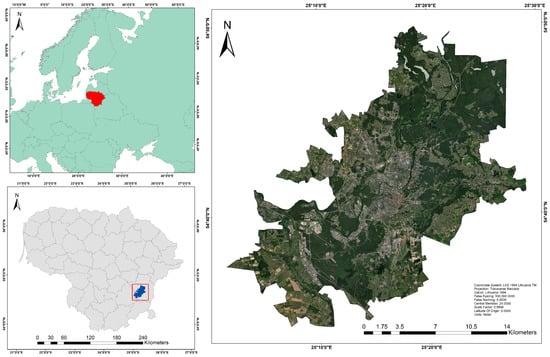
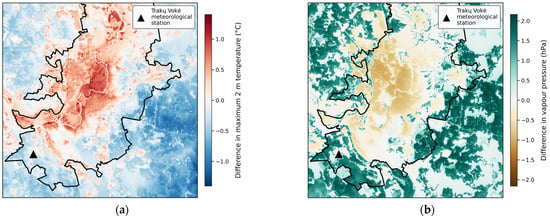
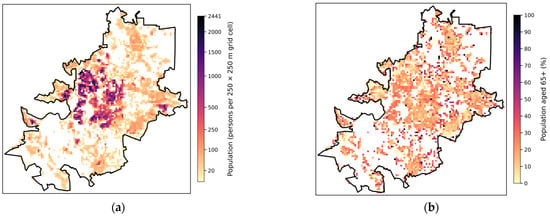
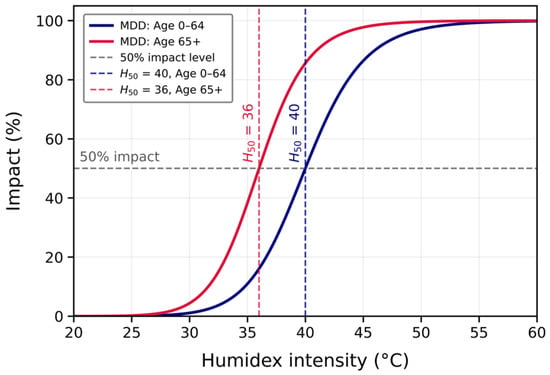
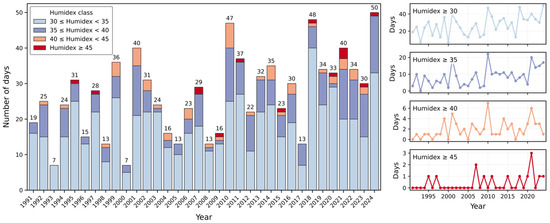
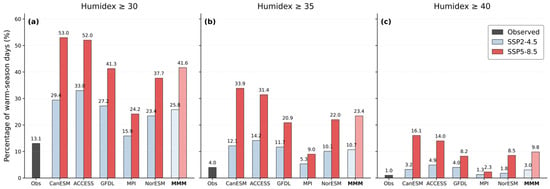
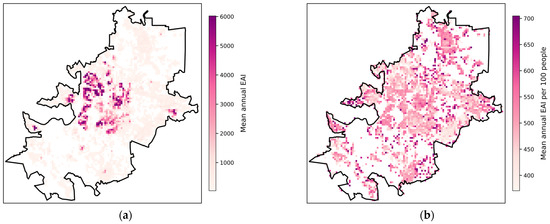
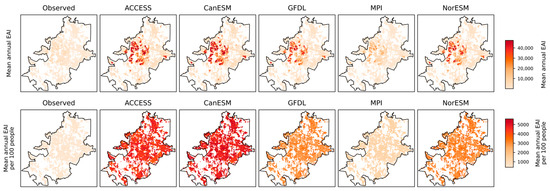
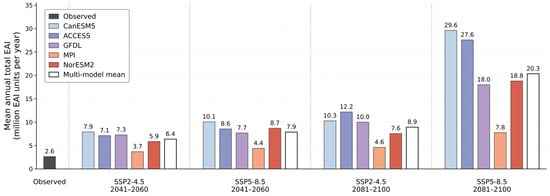
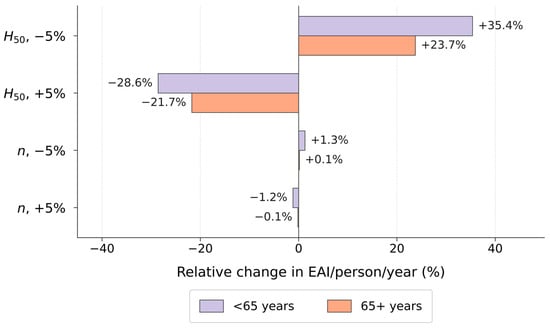
Urban areas are increasingly exposed to heat stress under climate change due to rising temperatures, ageing populations, and increasing population density in cities. This study assesses current and future heat-stress risk in Vilnius, Lithuania, using the Humidex index and the CLIMADA risk modelling framework. Historical heat-stress conditions are analysed using observational meteorological data, while future conditions are evaluated using five CMIP6 climate models under SSP2-4.5 and SSP5-8.5 climate scenarios for the mid and late 21st century. The risk assessment combines high-resolution Humidex-based hazard data, gridded population exposure, and age-specific vulnerability functions. In addition to temporal Humidex trend analysis, CLIMADA is used to estimate spatially explicit Expected Annual Impact and population-normalised impact indicators. The frequency of heat-induced stress has increased significantly—the number of days when the Humidex index was ≥30 has risen by 5.6 days per decade. It is projected that by the end of the century, the proportion of such warm-season days (April–October) will increase from 13.1% to 25.8% under the SSP2-4.5 scenario and to 41.6% under the SSP5-8.5 scenario. Spatial impact maps identify areas with elevated total and population-normalised heat-stress burden, while age-specific results show higher impacts among residents aged ≥ 65 years. Cumulative heat-stress burden, expressed as Expected Annual Impact, could increase by approximately 1.8–11.4 times. The framework provides a spatially consistent and age-sensitive approach for assessing urban heat-stress risk and supporting local climate adaptation planning.
Full article
(This article belongs to the Section Climatology)
►▼
Show Figures

Figure 1
Open AccessArticle
Estimating High-Resolution Latent Heat Flux from Satellite (AVHRR-SST) and Reanalysis Data During Summer in the Tokar Gap, Central Red Sea
by
Jamaan A. Turki and Fawaz Madah
Atmosphere 2026, 17(8), 738; https://doi.org/10.3390/atmos17080738 - 29 Jul 2026
Abstract
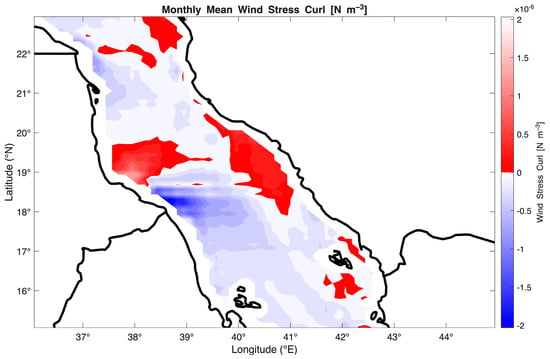
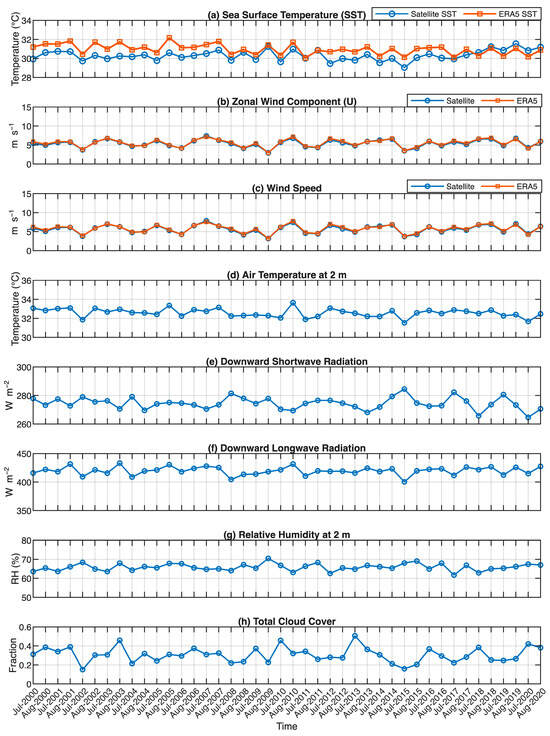
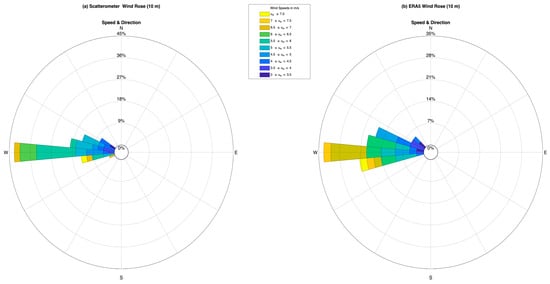
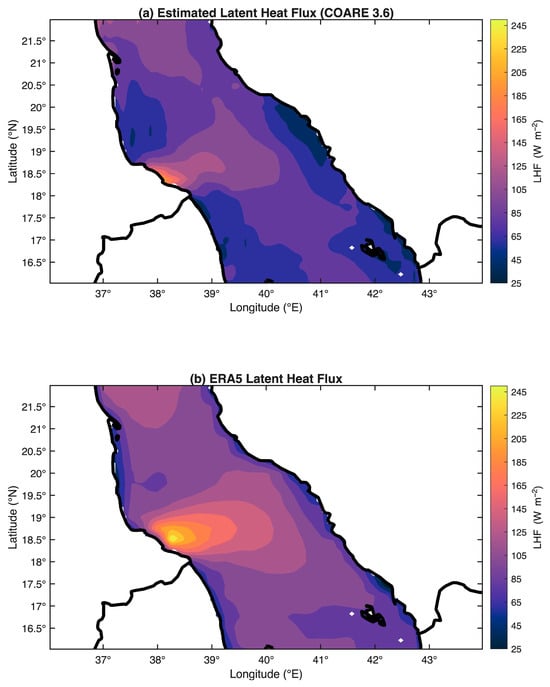
This study aims to estimate latent heat flux (LHF) over the central Red Sea during the summer months (July and August) of 2000–2020, corresponding with the occurrence of the Tokar Gap (TG) wind jets. Sea surface temperature (SST) was derived from the SeaDAS-based
[...] Read more.
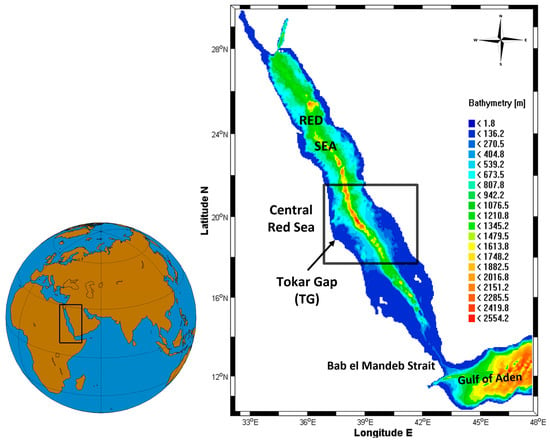
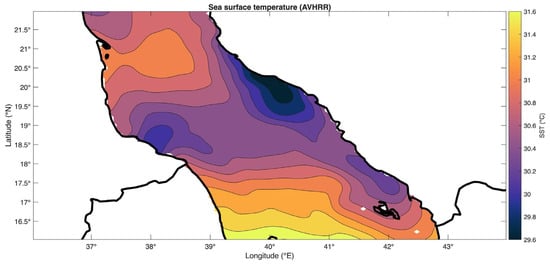
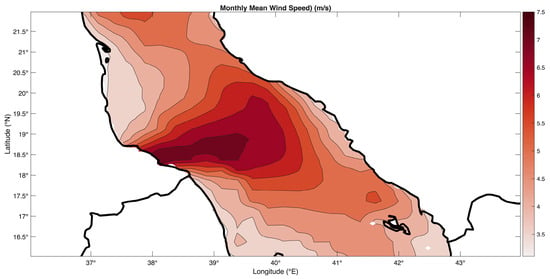
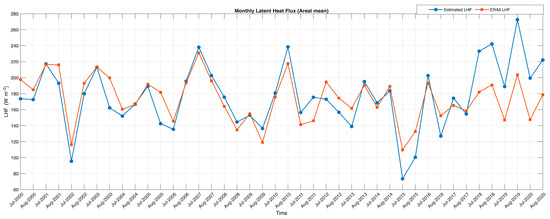
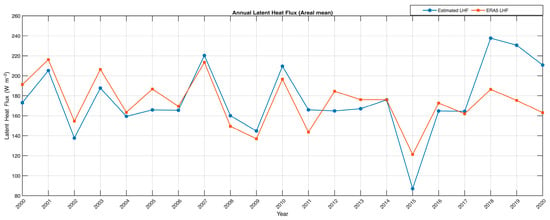
This study aims to estimate latent heat flux (LHF) over the central Red Sea during the summer months (July and August) of 2000–2020, corresponding with the occurrence of the Tokar Gap (TG) wind jets. Sea surface temperature (SST) was derived from the SeaDAS-based multi-sensor ESA CCI/C3S satellite product (AVHRR-SST), and wind data were obtained from the scatterometer product. Both datasets were re-gridded to a uniform spatial resolution of 0.05°. The AVHRR-SST and scatterometer wind speed were compared with the corresponding ERA5 reanalysis fields. Because both the satellite-derived estimates and ERA5 are model-based products rather than independent in situ observations, this comparison constitutes an intercomparison between two approaches rather than a validation. The AVHRR-SST and scatterometer wind speed showed good agreement with ERA5 fields (correlation coefficients CC = 0.66 and 0.93, respectively). The spatial distribution of the estimated LHF reproduced the ERA5 LHF patterns but with relatively lower magnitudes. Time series analysis near the TG region showed that the estimated LHF underestimated ERA5 values, with a correlation coefficient of 0.77 and a root mean square error (RMSE) of 25.8 W/m2. The results represent an intercomparison between two model- and satellite-based approaches and are limited by the absence of independent in situ buoy observations for direct validation.
Full article
(This article belongs to the Section Biosphere/Hydrosphere/Land–Atmosphere Interactions)
►▼
Show Figures

Figure 1

Open AccessArticle
Feasibility of Retrieving Stratospheric Aerosol Extinction Fields from GEO–LEO Limb Measurements: An Inversion Algorithm Approach
by
Alexandru Doicu, Dmitry S. Efremenko, Dirk Giggenbach and Adrian Doicu
Atmosphere 2026, 17(8), 737; https://doi.org/10.3390/atmos17080737 (registering DOI) - 29 Jul 2026
Abstract
This paper investigates the feasibility of retrieving stratospheric aerosol extinction fields from GEO–LEO limb measurements using a dedicated inversion framework. The retrieval problem is severely ill-posed and involves a fundamentally three-dimensional observation geometry. To obtain stable solutions, variations of the extinction field in
[...] Read more.
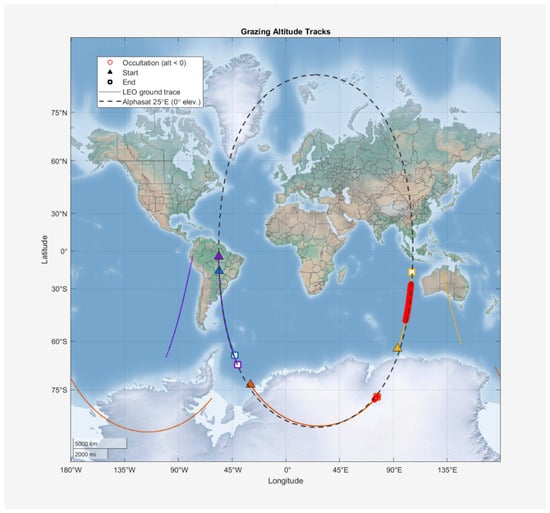
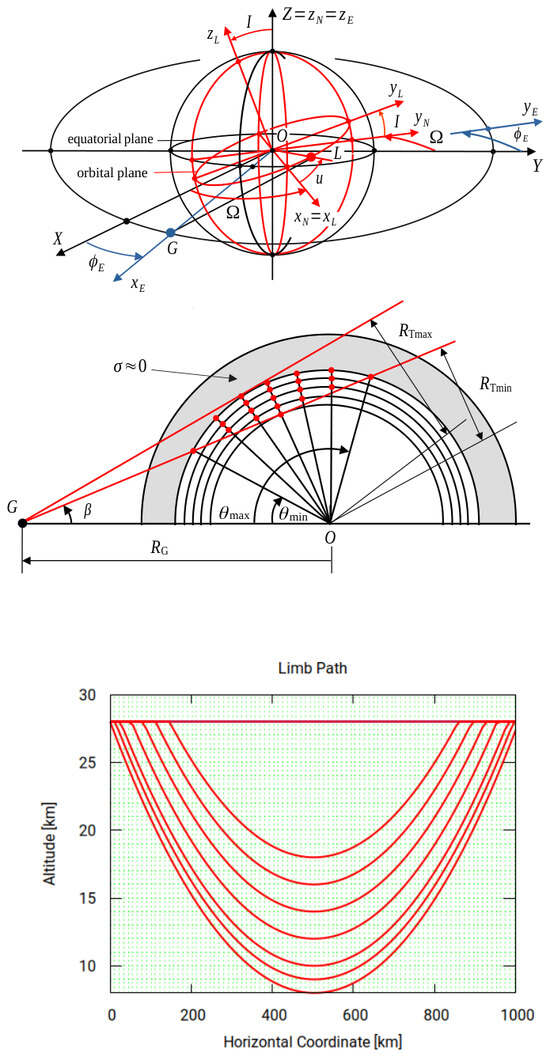
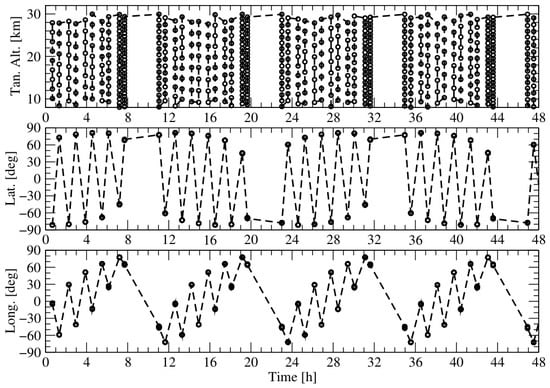
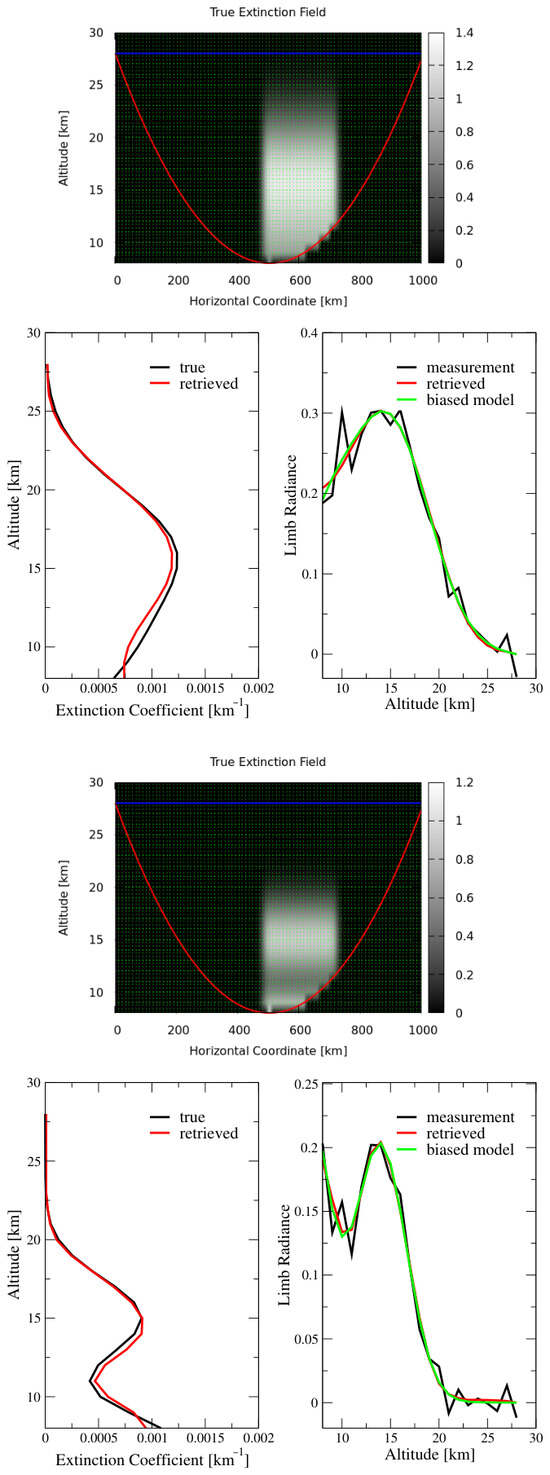
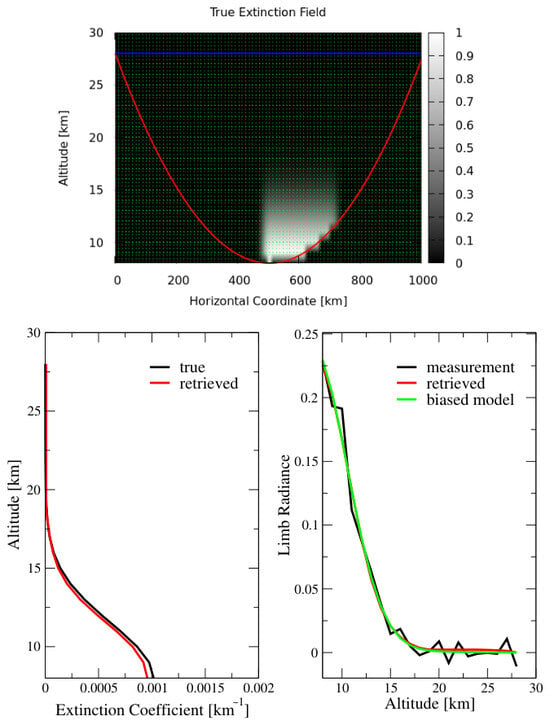
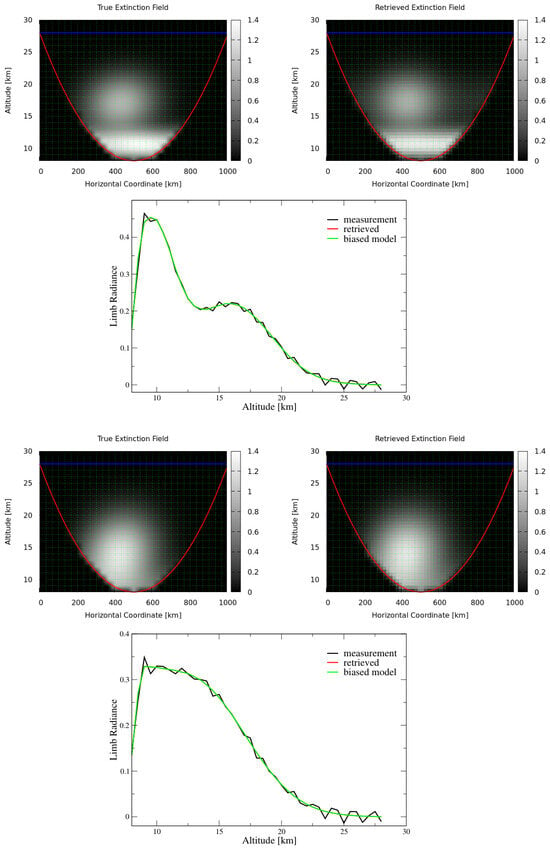
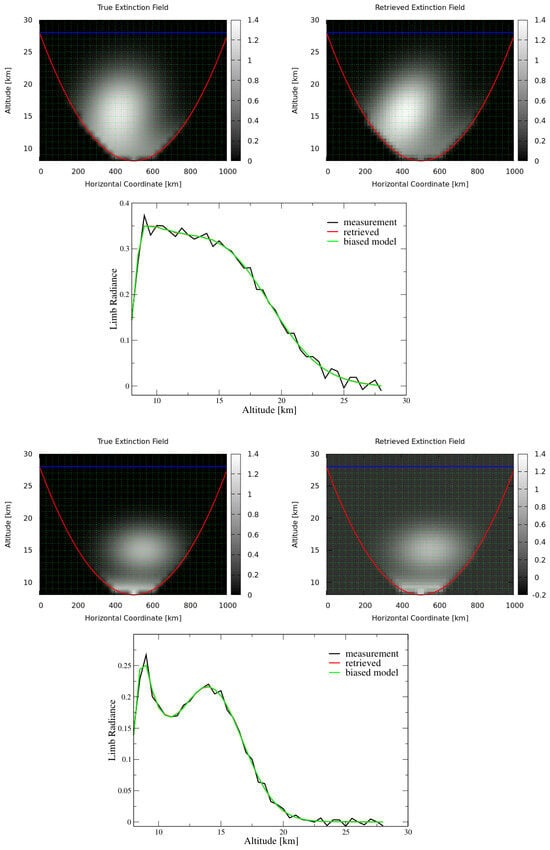
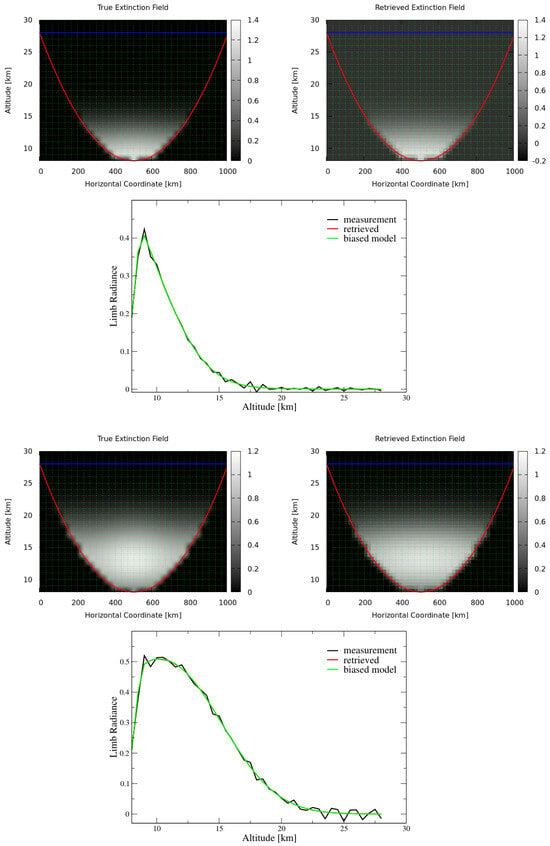
This paper investigates the feasibility of retrieving stratospheric aerosol extinction fields from GEO–LEO limb measurements using a dedicated inversion framework. The retrieval problem is severely ill-posed and involves a fundamentally three-dimensional observation geometry. To obtain stable solutions, variations of the extinction field in the cross-track direction are neglected, reducing the problem to the retrieval of radial and weakly horizontally varying aerosol distributions within a quasi-planar GEO–LEO geometry. Two simplified retrieval strategies are considered. In the first strategy, the radial extinction profile and the horizontal extent of the aerosol field are retrieved using external aerosol optical thickness observations as additional constraints. In the second strategy, the extinction field is represented by a parametric model and the corresponding model parameters are retrieved. To reduce the computational complexity, a simplified single-scattering forward model is adopted. The inversion problem is formulated as the minimization of a regularized Tikhonov function and is solved using a multistart optimization framework combining global random sampling, validation and selection of admissible starting points, local bounded optimization, discrepancy-principle filtering, and clustering of candidate solutions. Numerical simulations for a broad range of synthetic aerosol scenarios show that the proposed methodology is capable of reproducing the dominant aerosol structures with good accuracy. Although the retrieval problem remains strongly ill-conditioned, the effective degrees of freedom indicate that GEO–LEO limb measurements contain substantial independent information about the aerosol field and provide a promising basis for retrieving both radial aerosol extinction profiles and aspects of their horizontal structure.
Full article
(This article belongs to the Special Issue Observation and Properties of Atmospheric Aerosol)
►▼
Show Figures

Figure 1

Open AccessReview
Climate Change Impacts on Human Health in the Northern Hemisphere: A Narrative Review
by
Vidmantas Vaičiulis, Gabrielė Domkutė, Anna Papadima, Ričardas Radišauskas, Ivar Annus, Katrin Kaur and Gintarė Kalinienė
Atmosphere 2026, 17(8), 736; https://doi.org/10.3390/atmos17080736 - 29 Jul 2026
Abstract
Climate change is progressing most rapidly in the high-latitude regions of the Northern Hemisphere, where boreal and Arctic ecosystems are experiencing significant environmental changes and transformations. These ecosystems are being altered by rising temperatures, changing precipitation patterns characterized by more intense rainfall events,
[...] Read more.
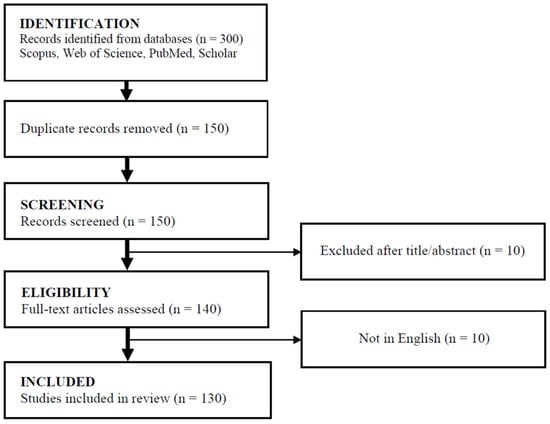
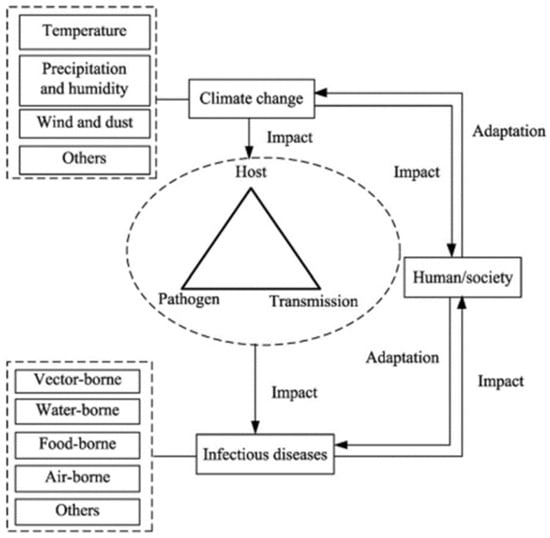
Climate change is progressing most rapidly in the high-latitude regions of the Northern Hemisphere, where boreal and Arctic ecosystems are experiencing significant environmental changes and transformations. These ecosystems are being altered by rising temperatures, changing precipitation patterns characterized by more intense rainfall events, decreasing snow and ice cover, and increasing floods, heat waves and fires. These changes pose significant risks to ecosystems, human health, and animal health, especially in the boreal zone. A narrative literature review was conducted across major scientific databases, including Scopus, Web of Science, PubMed, and Google Scholar, covering publications up to 2026. The evidence was combined thematically across key climate hazards and health domains, including infectious and non-communicable diseases, and mental health outcomes. The review shows that accelerating warming in northern regions is changing species distribution, increasing the risk of zoonoses and vector-borne diseases, and increasing cardiovascular, respiratory, and mental health issues. Extreme heat and cold events are important drivers of morbidity and mortality, while floods and wildfires contribute to long-term psychological distress. Vulnerable populations, including elderly adults and socioeconomically disadvantaged groups, are mostly affected. This review identifies key knowledge gaps that could be filled by developing evidence-based public health adaptation plans in high-latitude regions.
Full article
(This article belongs to the Special Issue Association Between Weather and Climate Conditions for Human and Animal Diseases)
►▼
Show Figures

Figure 1
Open AccessArticle
Source-Directional and Micrometeorological Influences on Short-Term NH3 Variability in a Livestock- and Agriculture-Influenced Peri-Urban Environment
by
Ji-Won Jeon, Sung-Won Park, Hyo-Won Lee, Soo-Jin Jeong, Pyung-Rae Kim, Young-Ji Han and Sang-Deok Lee
Atmosphere 2026, 17(8), 735; https://doi.org/10.3390/atmos17080735 - 28 Jul 2026
Abstract
Atmospheric ammonia (NH3) is an important alkaline precursor of secondary inorganic aerosols, but its variability in livestock- and agriculture-influenced peri-urban environments remains poorly constrained. In this study, atmospheric NH3 was measured at a peri-urban site in Chuncheon, South Korea and
[...] Read more.
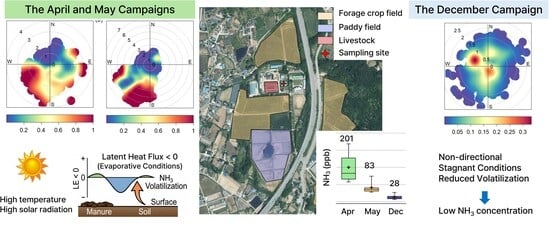
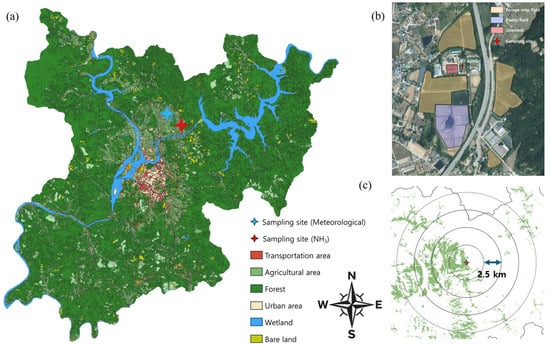
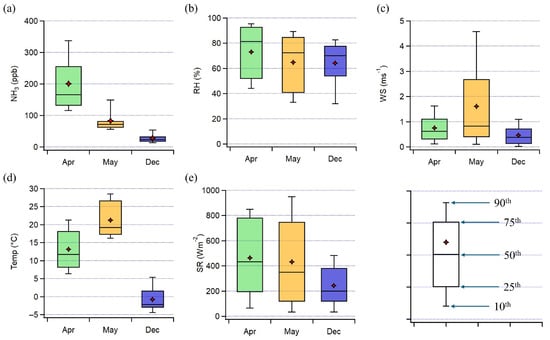
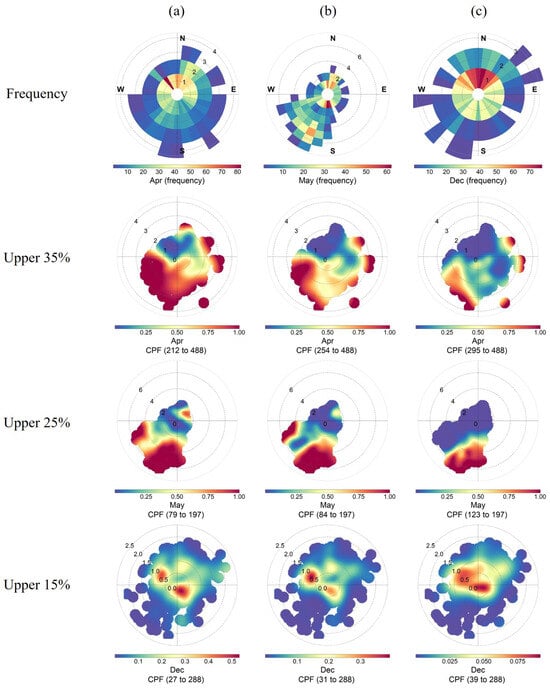
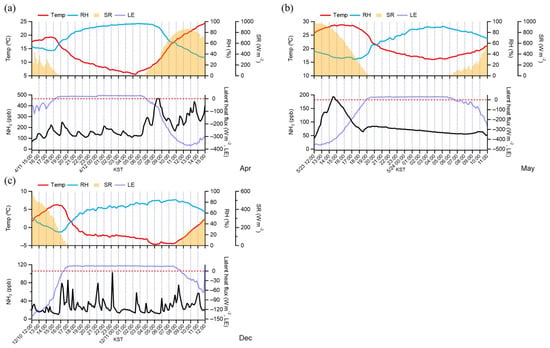
Atmospheric ammonia (NH3) is an important alkaline precursor of secondary inorganic aerosols, but its variability in livestock- and agriculture-influenced peri-urban environments remains poorly constrained. In this study, atmospheric NH3 was measured at a peri-urban site in Chuncheon, South Korea and its variability was examined in relation to micro-meteorology, source direction, and surface–atmosphere exchange. Mean NH3 concentrations were 200.8 ± 91.1 ppb during the April campaign, 83.0 ± 34.4 ppb during the May campaign, and 27.9 ± 16.2 ppb during the December campaign, indicating higher NH3 levels during the April and May campaigns than during the December campaign. Campaign-specific correlation analyses showed that the relationships between NH3 and micrometeorological variables differed among the observation periods, with robust associations observed in April and May but not in December. Moreover, the higher NH3 concentration in the April campaign than in the May campaign, despite the lower mean temperature, indicates that the observed variability was not controlled by temperature alone. Conditional probability function analysis showed that elevated NH3 concentrations in the April and May campaigns were mainly associated with southwesterly winds, suggesting the influence of nearby livestock and agricultural sources. The Penman–Monteith-derived latent heat flux further showed that daytime NH3 enhancement coincided with evaporative surface-exchange conditions potentially favorable for volatilization, although it did not directly quantify manure-derived NH3 emissions. In contrast, the December campaign showed lower NH3 concentrations, weaker source-directional patterns, and limited latent heat flux influence, suggesting suppressed volatilization and intermittent local accumulation under stable conditions. These results indicate that the conditions associated with short-term NH3 variability differed among the selected campaigns, reflecting complementary influences of source direction and campaign-specific micrometeorological and surface-exchange conditions, highlighting the need for concurrent gas- and particle-phase measurements to assess potential implications for PM2.5 formation.
Full article
(This article belongs to the Special Issue Ammonia Emissions and Particulate Matter (2nd Edition))
►▼
Show Figures

Graphical abstract
Open AccessArticle
Spatial Heterogeneity of Heatwave and Air Pollution Effects on Cause-Specific Mortality Across Greece
by
Ilias Petrou and Pavlos Kassomenos
Atmosphere 2026, 17(8), 734; https://doi.org/10.3390/atmos17080734 - 28 Jul 2026
Abstract
Climate change is intensifying heatwaves, wildfire activity, and dust transport in the Mediterranean region, yet their combined impacts on mortality remain poorly characterized. Associations between heatwaves, ambient air pollution, source-specific particulate matter, and cardiovascular and respiratory mortality were investigated across Greece at the
[...] Read more.
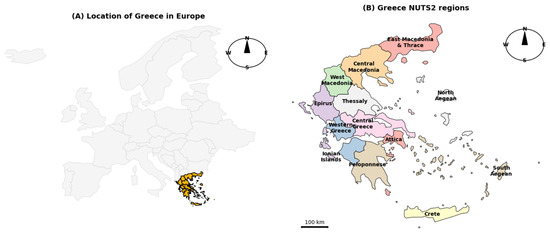
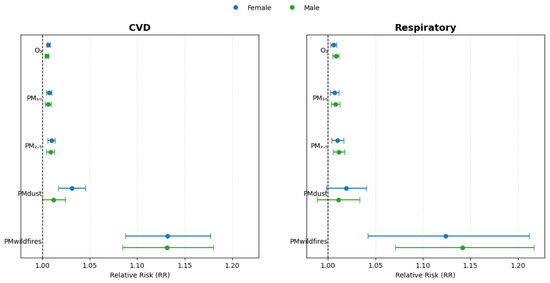
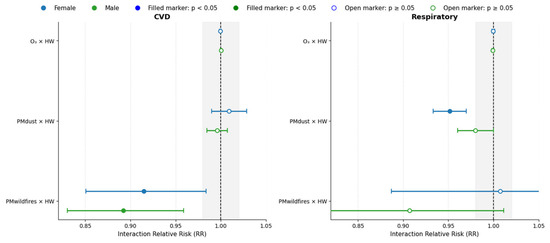
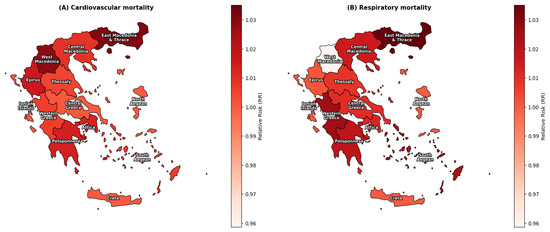
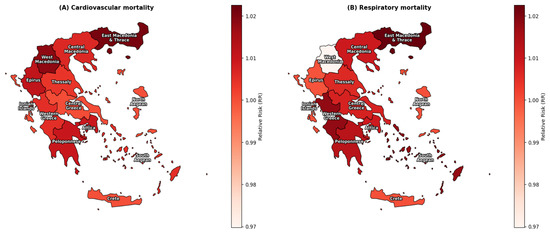
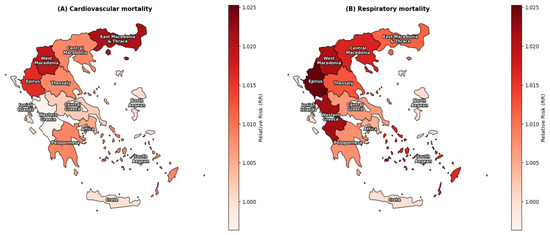
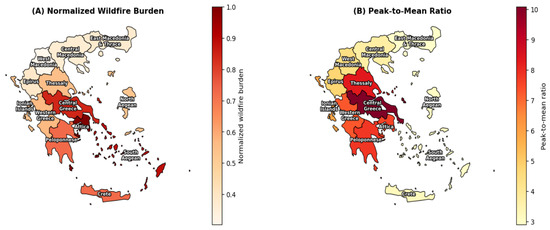
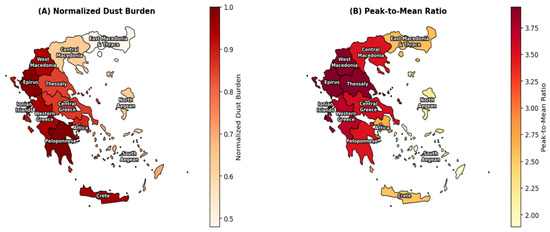
Climate change is intensifying heatwaves, wildfire activity, and dust transport in the Mediterranean region, yet their combined impacts on mortality remain poorly characterized. Associations between heatwaves, ambient air pollution, source-specific particulate matter, and cardiovascular and respiratory mortality were investigated across Greece at the NUTS2 regional level. Monthly mortality counts for 2014–2022 were analyzed using generalized linear Poisson regression models adjusted for region, year, age group, sex, relative humidity, and population size. Analyses included conventional pollutants (PM2.5, PM10, and O3), wildfire-related particulate matter, and Saharan dust-related particulate matter, while multiplicative interaction terms were used to evaluate modification of pollution effects during heatwave conditions. All major pollutants were positively associated with cardiovascular and respiratory mortality, with the strongest and most consistent effects observed for wildfire-related particulate matter. Heatwave–pollution interaction terms were generally weak, indicating that the combined effects of heat and air pollution were predominantly additive rather than strongly synergistic at the national scale. Spatial analyses revealed substantial regional heterogeneity, with stronger associations identified in parts of northern mainland Greece and selected urbanized regions. These findings highlight the importance of considering wildfire smoke and desert dust separately from conventional air pollutants and support the development of integrated climate-health adaptation strategies in Greece and other climate-vulnerable Mediterranean regions.
Full article
(This article belongs to the Special Issue The Drivers and Impacts of Climate Change over the Eastern Mediterranean (2nd Edition))
►▼
Show Figures

Figure 1

Open AccessArticle
An Optimization Approach for Specific Humidity Profiles Derived from FY-4B GIIRS
by
Fayuan Chen, Lizhen Huang, Huayang Li and Xinzhi Wang
Atmosphere 2026, 17(8), 733; https://doi.org/10.3390/atmos17080733 - 28 Jul 2026
Abstract
Specific humidity profile retrievals from the Geostationary Interferometric Infrared Sounder (GIIRS) onboard Fengyun-4B (FY-4B) are often degraded by cloud contamination, while strict quality control flags further limit data usability. To address these issues, an optimization framework for FY-4B GIIRS specific humidity profiles was
[...] Read more.
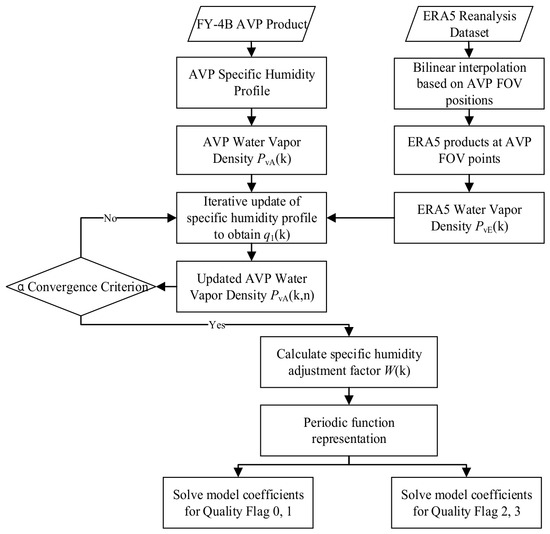
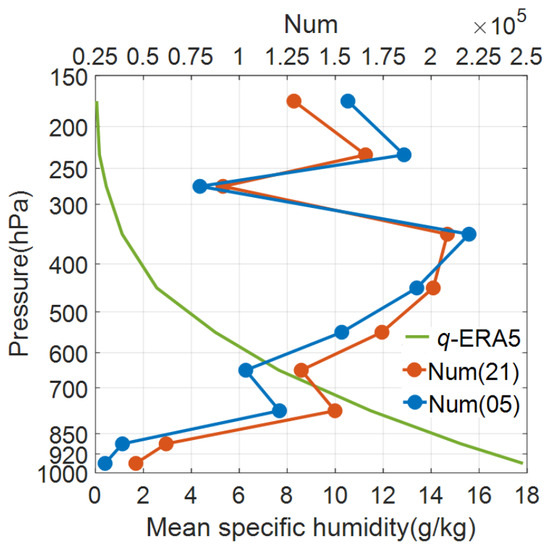
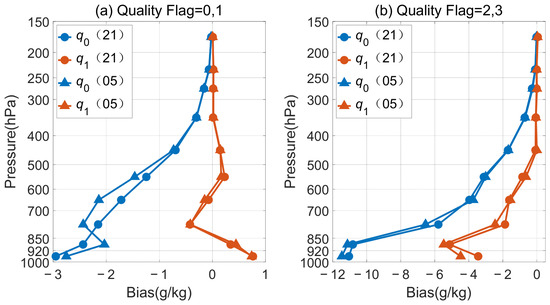
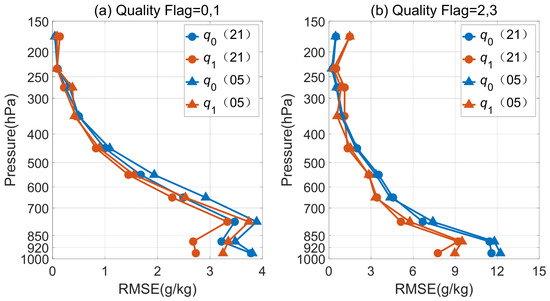
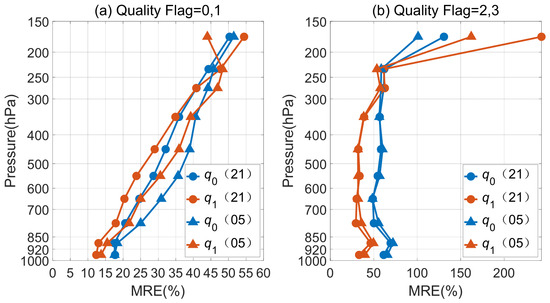
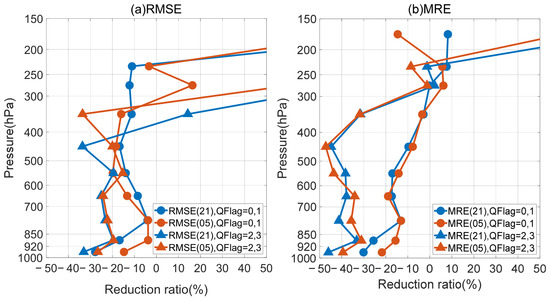
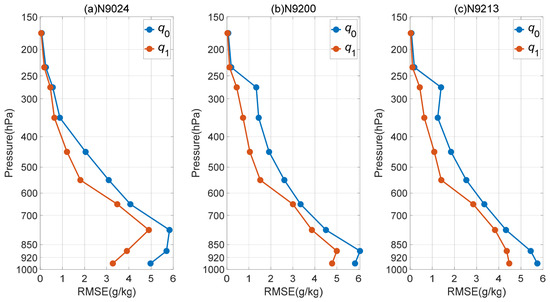
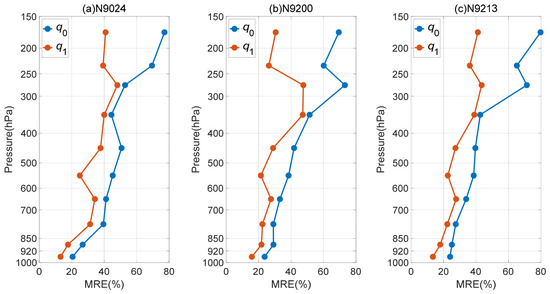
Specific humidity profile retrievals from the Geostationary Interferometric Infrared Sounder (GIIRS) onboard Fengyun-4B (FY-4B) are often degraded by cloud contamination, while strict quality control flags further limit data usability. To address these issues, an optimization framework for FY-4B GIIRS specific humidity profiles was developed using ERA5 reanalysis data spanning January 2023 to January 2024. Guangxi and the Beibu Gulf were selected as the study domain. Independent ERA5 datasets, not involved in model construction, were used as a benchmark to evaluate performance. The results indicate that the original FY-4B GIIRS specific humidity profiles tend to underestimate moisture relative to ERA5. For profiles with quality flags of 0 and 1, the Bias, Root Mean Square Error (RMSE), and Mean Relative Error (MRE) range of −3~0 g/kg, 0~4 g/kg, and 17~53%, respectively. After optimization, the bias is effectively reduced to 0 g/kg. RMSE shows an average reduction of 15% within the 700~300 hPa layer, while the most notable improvement in MRE occurs between 1000 and 920 hPa. For lower-quality data (Flags 2–3), the bias, RMSE, and MRE span −12~0 g/kg, 0~13 g/kg, and 48~140%, respectively. Following optimization, the bias range narrows to −6~0 g/kg. RMSE decreases by 20~40% from the near-surface layer up to 400 hPa, and MRE is reduced by 40% below 300 hPa. A case study of Typhoon “Peipah” further demonstrates the model’s effectiveness. At stations experiencing intense rainfall, the optimized specific humidity profiles show markedly improved accuracy, and the Mean Absolute Errors (MAEs) of derived forecast-related physical variables are substantially reduced. Overall, the proposed optimization model significantly enhances both the accuracy and practical usability of FY-4B GIIRS specific humidity profiles, providing more reliable data support for monitoring severe weather events such as typhoons and heavy rainfall.
Full article
(This article belongs to the Section Atmospheric Techniques, Instruments, and Modeling)
►▼
Show Figures

Figure 1
Open AccessArticle
Relative-Humidity Decomposition of July Rainfall Anomalies over the Middle–Lower Yangtze River Basin Associated with Eastern Mediterranean–West Asian March Precipitation
by
Jiawei Hao, Er Lu, Dian Yuan, Juqing Tu, Zhuoyuan Li, Xuehan Zhao and Hao Long
Atmosphere 2026, 17(8), 732; https://doi.org/10.3390/atmos17080732 - 28 Jul 2026
Abstract
Seasonal prediction of summer rainfall over the middle and lower reaches of the Yangtze River Basin (MLYRB) remains challenging because the linkage between preceding climate signals and regional precipitation anomalies involves complex dynamic and thermodynamic processes. This study examines March precipitation over the
[...] Read more.
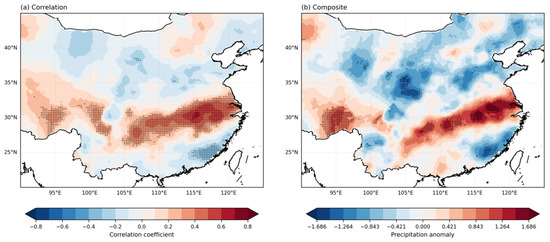
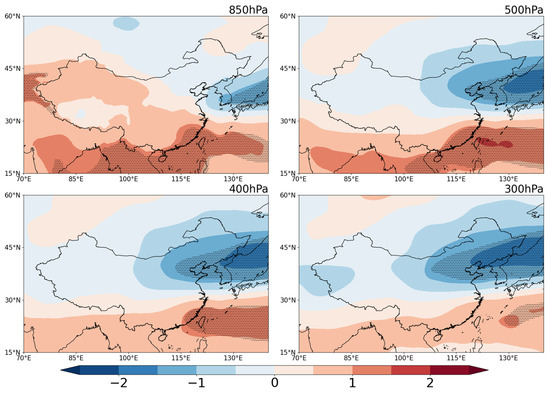
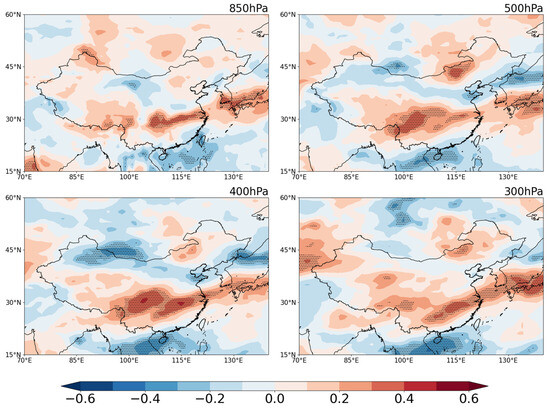
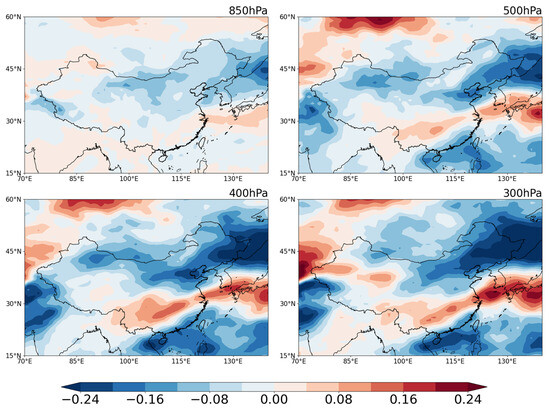
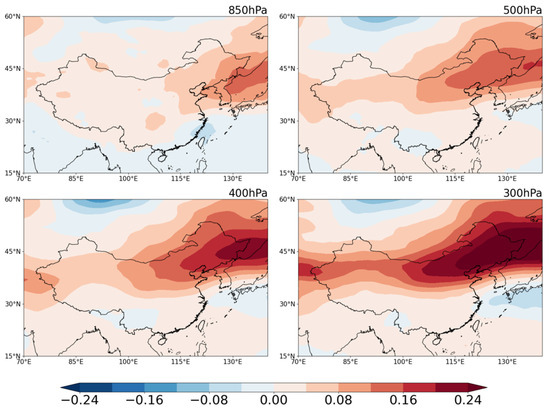
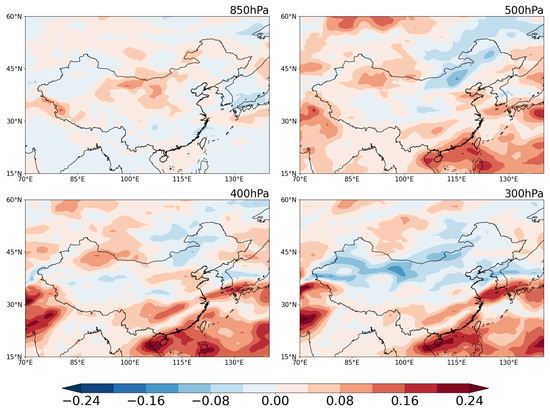
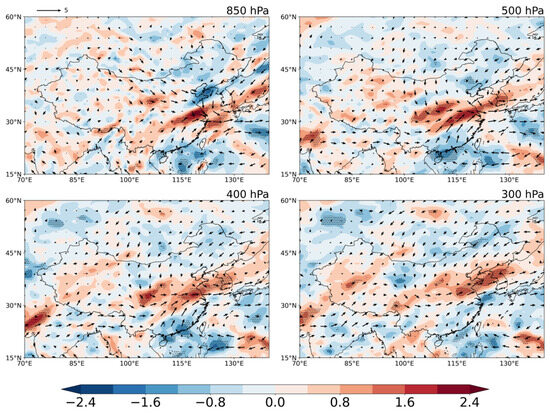
Seasonal prediction of summer rainfall over the middle and lower reaches of the Yangtze River Basin (MLYRB) remains challenging because the linkage between preceding climate signals and regional precipitation anomalies involves complex dynamic and thermodynamic processes. This study examines March precipitation over the eastern Mediterranean–West Asia region, hereafter referred to as PE, as an upstream spring signal associated with July rainfall anomalies over the MLYRB. The central objective is to determine, through a relative humidity decomposition framework, whether the humidification accompanying PE-related July rainfall anomalies is dominated by moisture changes or by temperature-related saturation effects. The results indicate that high-PE years are associated with a significant increase in July rainfall over the MLYRB. This rainfall enhancement is accompanied by anomalous circulation patterns favourable for moisture transport and convergence over eastern China. Meanwhile, positive relative humidity anomalies extend from the lower to the upper troposphere, with the 400 and 300 hPa levels showing a particularly close spatial correspondence with the significant rainfall anomalies over the rainfall region. Although absolute water vapour content decreases with height, the coherent upper-tropospheric relative humidity response indicates the presence of a deep moist layer, which is favourable for sustained condensation, reduced dry-air entrainment, and persistent monsoon rainfall. A further moisture–temperature decomposition shows that the PE-related relative humidity response is jointly controlled by changes in atmospheric moisture content and saturation vapour pressure. Over the MLYRB, the increase in relative humidity is primarily associated with enhanced moisture content, whereas temperature-induced changes in saturation conditions are more evident in regions with more coherent temperature anomalies. These findings suggest that the PE-related July rainfall anomaly is supported by a combination of dynamic moisture supply and thermodynamic humidification of the atmospheric column. The study provides a physically consistent explanation for the potential precursor relevance of the PE signal and emphasizes the importance of vertical humidity structure in understanding and predicting summer rainfall anomalies over eastern China.
Full article
(This article belongs to the Section Climatology)
►▼
Show Figures

Figure 1
Open AccessArticle
Vertical Accuracy Assessment and Bias Correction of Freely Available Global DEMs
by
Laleh Jafari, Ben Jarihani, Jack Koci, Ioan Vasile Sanislav, Stephanie Duce and Dipak Paudyal
Atmosphere 2026, 17(8), 731; https://doi.org/10.3390/atmos17080731 - 27 Jul 2026
Abstract
Accurate digital elevation models (DEMs) are essential for hydrological modelling and floodplain analysis, particularly in low-relief floodplains where small elevation errors can significantly affect flow routing and inundation extent. This study evaluated the vertical accuracy of six freely available global DEMs across the
[...] Read more.
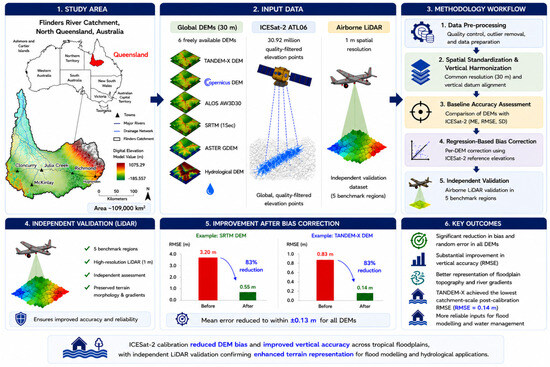
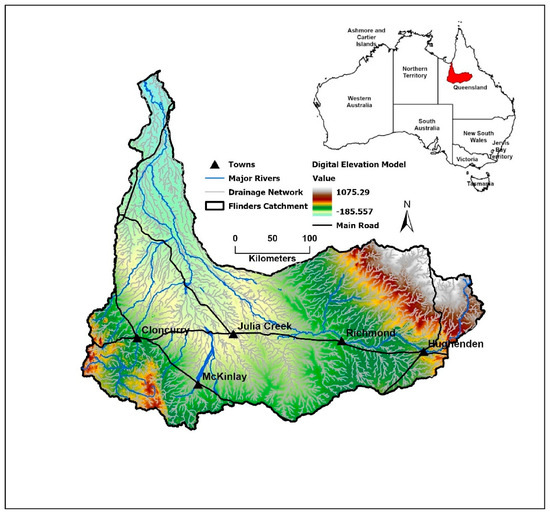
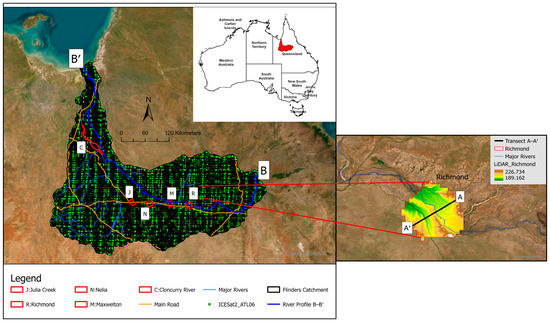
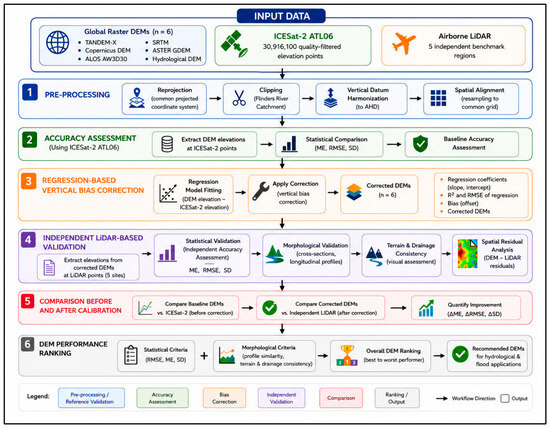
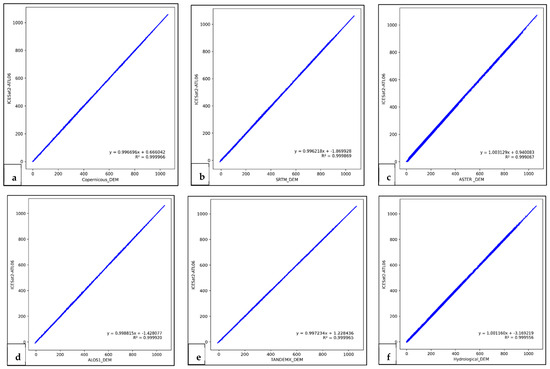
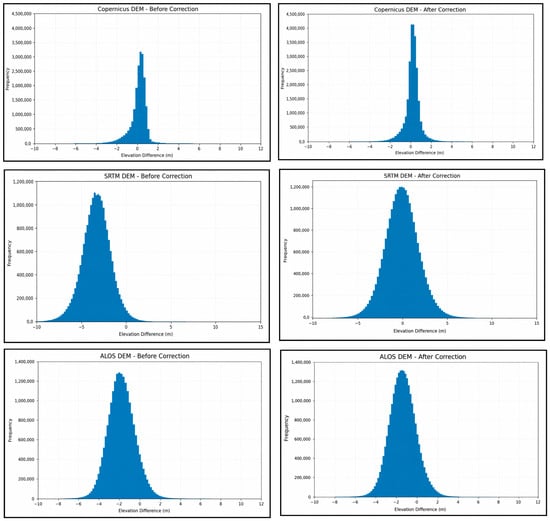
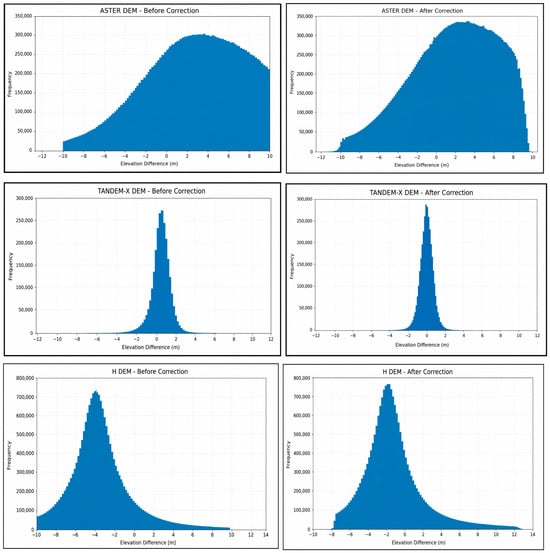
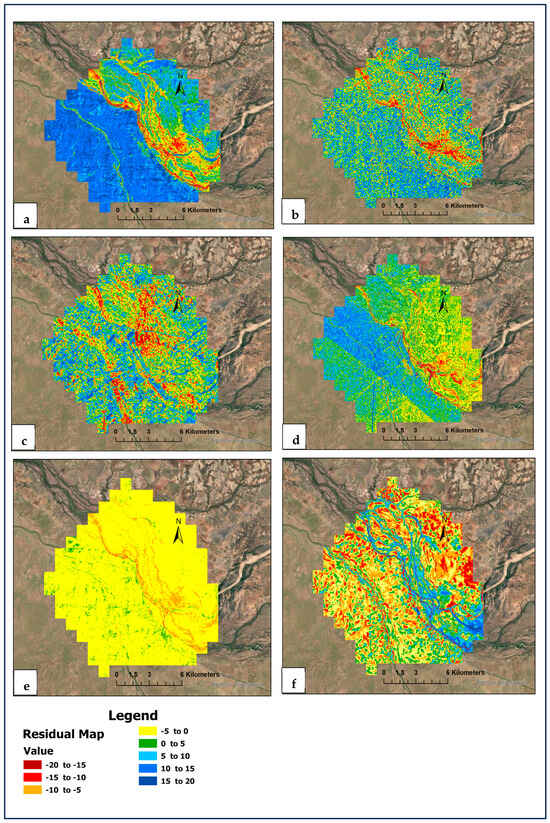
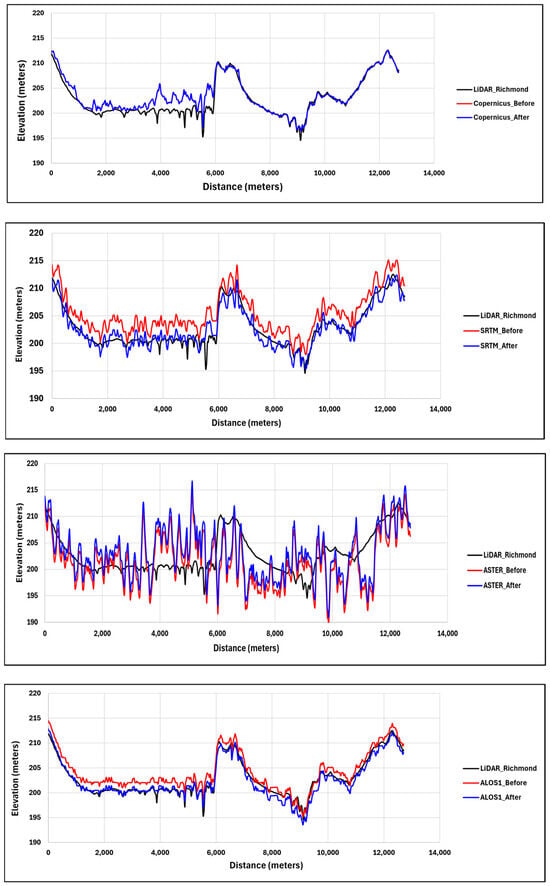
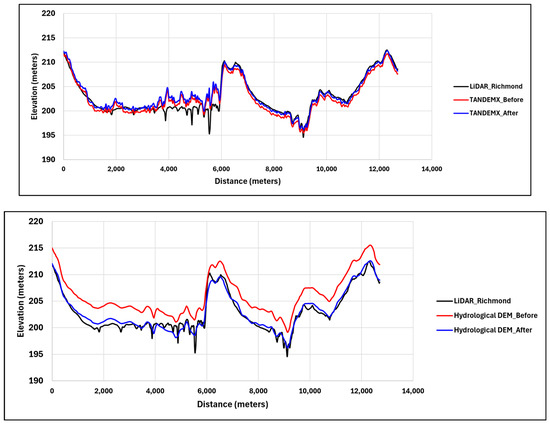
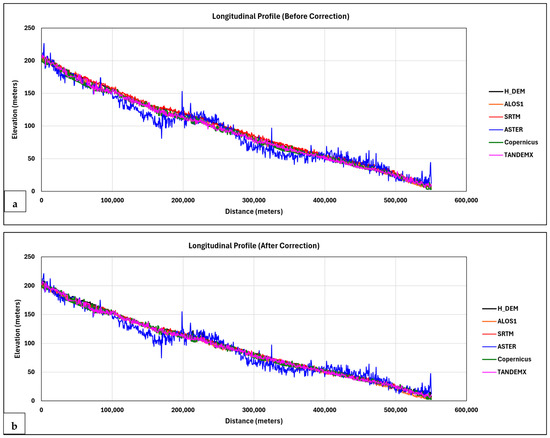
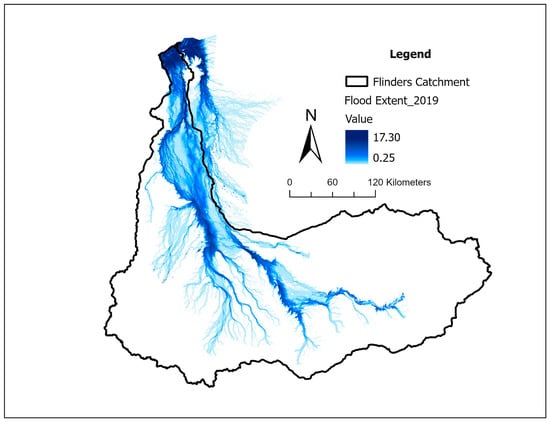
Accurate digital elevation models (DEMs) are essential for hydrological modelling and floodplain analysis, particularly in low-relief floodplains where small elevation errors can significantly affect flow routing and inundation extent. This study evaluated the vertical accuracy of six freely available global DEMs across the Flinders River catchment, North Queensland, Australia, using 30,916,100 quality-filtered ICESat-2 ATL06 elevation points for regression-based bias correction and airborne LiDAR datasets from five benchmark regions for independent validation. The evaluated DEMs included TANDEM-X, Copernicus DEM, ALOS AW3D30, SRTM, ASTER GDEM, and the Hydrological DEM. Vertical accuracy was assessed using mean error (ME), root mean square error (RMSE), and residual dispersion before and after calibration. Results showed substantial pre-calibration bias in the Hydrological DEM (ME = −2.93 m) and SRTM (ME = −2.66 m), whereas Copernicus DEM showed minimal initial bias (ME = −0.01 m). Regression-based correction reduced mean errors to within ±0.13 m across all DEMs. SRTM showed the largest improvement, with RMSE decreasing from 3.20 m to 0.55 m, while TANDEM-X achieved the highest post-calibration accuracy (RMSE = 0.14 m). Independent LiDAR validation confirmed improved vertical accuracy while preserving terrain morphology and river gradients.
Full article
(This article belongs to the Special Issue Mapping and Modelling Hydroclimate Extremes Using Remote Sensing and Advanced Geospatial Techniques)
►▼
Show Figures

Graphical abstract
Open AccessArticle
Field Evaluation of CALINE4-Based Carbon Monoxide Dispersion Modeling at a Signalized Intersection in Ulaanbaatar, Mongolia
by
Munkhtuya Lkhamsuren, Ganbaatar Gunsen, Tsolmonbaatar Danjkhuu, Ariunbayar Samdantsoodol and Naranbaatar Erdenesuren
Atmosphere 2026, 17(8), 730; https://doi.org/10.3390/atmos17080730 - 27 Jul 2026
Abstract
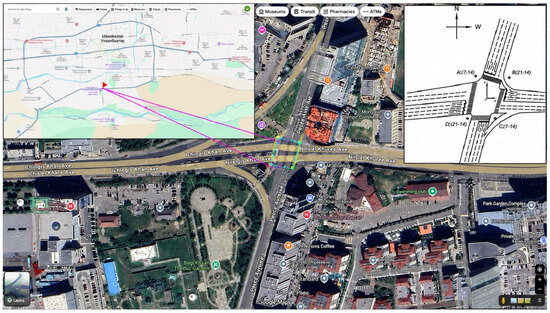
Urban intersections are important hot spots of traffic–related air pollution, particularly in places where signal delays and idling increase vehicle emissions. This study evaluates near–road carbon monoxide (CO) concentrations at a signalized four–leg intersection in Ulaanbaatar, Mongolia, by combining field measurements with CALINE4
[...] Read more.
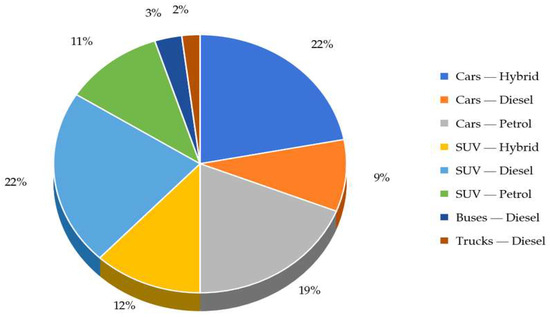
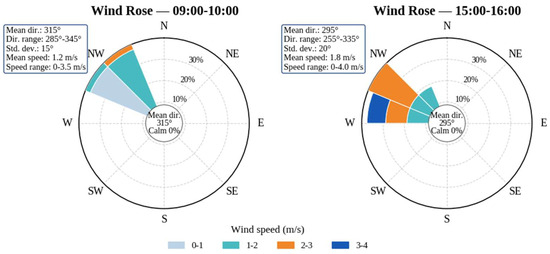
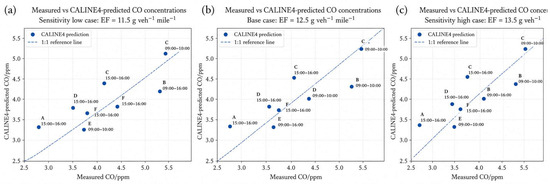
Urban intersections are important hot spots of traffic–related air pollution, particularly in places where signal delays and idling increase vehicle emissions. This study evaluates near–road carbon monoxide (CO) concentrations at a signalized four–leg intersection in Ulaanbaatar, Mongolia, by combining field measurements with CALINE4 dispersion modeling. CO concentrations were measured at four receptor locations during two observation periods, 9:00–10:00 and 15:00–16:00. Hourly traffic volume, fleet composition, microclimatic conditions, and receptor geometry were used as model inputs. A fleet-weighted CO emission factor of 12.5 g veh−1 mile−1, adjusted for vehicle age and local stop-and–go traffic conditions, was applied as the base case, while 11.5 and 13.5 g veh−1 mile−1 were tested as sensitivity scenarios. The base case CALINE4 results reproduced the measured spatial pattern reasonably well, with overall performance indicators of r2 = 0.759, FB = −0.006, NMSE = 0.010, RMSE = 0.400 ppm, and MAE = 0.325 ppm. Sensitivity analysis showed that higher emission factors increased predicted CO concentrations, although differences among scenarios were limited. The results suggest that the MOVES–CALINE4 modeling chain is suitable for preliminary screening level CO hot–spot assessment at congested intersections in Ulaanbaatar.
Full article
(This article belongs to the Special Issue Advances in Integrated Air Quality Management: Emissions, Monitoring, Modelling (4th Edition))
►▼
Show Figures

Figure 1
Journal Menu
► ▼ Journal Menu-
- Atmosphere Home
- Aims & Scope
- Editorial Board
- Reviewer Board
- Topical Advisory Panel
- Early Career Editorial Board
- Instructions for Authors
- Special Issues
- Topics
- Sections & Collections
- Article Processing Charge
- Indexing & Archiving
- Editor’s Choice Articles
- Most Cited & Viewed
- Journal Statistics
- Journal History
- Journal Awards
- Society Collaborations
- Conferences
- Editorial Office
Journal Browser
► ▼ Journal BrowserHighly Accessed Articles
Latest Books
E-Mail Alert
News
Topics
Topic in
Atmosphere, Earth, Encyclopedia, Entropy, Fractal Fract, MAKE, Meteorology
Revisiting Butterfly Effect, Multiscale Dynamics, and Predictability Using Ai-Enhanced Modeling Framework (AEMF) and Chaos Theory
Topic Editors: Bo-Wen Shen, Roger A. Pielke Sr., Xubin ZengDeadline: 31 July 2026
Topic in
Agronomy, Crops, Land, Plants, Atmosphere, Nitrogen, Agriculture, Methane
Multi-Objective Optimization of Staple Crop Production for Yield, Carbon Sequestration, and Greenhouse Gas Mitigation
Topic Editors: Qiang Xu, Wei Yang, Ziyin Shang, Peng ZhangDeadline: 31 October 2026
Topic in
IJERPH, Sustainability, Atmosphere, Environments, Toxics, Pollutants
Environmental Exposures, Disasters, and Population Health: Epidemiology and Evaluation
Topic Editors: Kai Yang, Beibei WangDeadline: 30 November 2026
Topic in
Atmosphere, GeoHazards, Geosciences, Water, Environments
Natural Hazards and Environmental Challenges in the Anthropocene Age, 2nd Edition
Topic Editors: Quoc Bao Pham, Eyyüp Ensar Başakın, Hone-Jay Chu, Ömer EkmekciogluDeadline: 31 December 2026
Conferences
14–16 October 2026
[ECAS-8] Present your Work at the 8th International Electronic Conference on Atmospheric Sciences

14–16 October 2026
[ECAS-8] Present your Work at the 8th International Electronic Conference on Atmospheric Sciences

Special Issues
Special Issue in
Atmosphere
Airborne Allergens: Detection, Modeling, and Forecasting
Guest Editor: Yan LyuDeadline: 31 July 2026
Special Issue in
Atmosphere
Typhoon/Hurricane Dynamics and Prediction (3rd Edition)
Guest Editors: Ching-Yuang Huang, Shu-Ya Chen, Kao-Shen ChungDeadline: 31 July 2026
Special Issue in
Atmosphere
Vehicle Emissions Testing, Modeling, and Lifecycle Assessment
Guest Editors: Fei Yu, Qun WangDeadline: 31 July 2026
Special Issue in
Atmosphere
Biogenic Volatile Organic Compound: Measurement and Emissions
Guest Editors: Ting Wu, Daocheng Gong, Shuangjiang Li, Paul V. DoskeyDeadline: 31 July 2026
Topical Collections
Topical Collection in
Atmosphere
Livestock Odor Issues and Air Quality
Collection Editor: Jacek Koziel
Topical Collection in
Atmosphere
Measurement of Exposure to Air Pollution
Collection Editor: Luca Stabile