



-
Lidar Measurements and High-Resolution Mesoscale Modeling of Coastally Trapped Disturbances off the Coast of California -
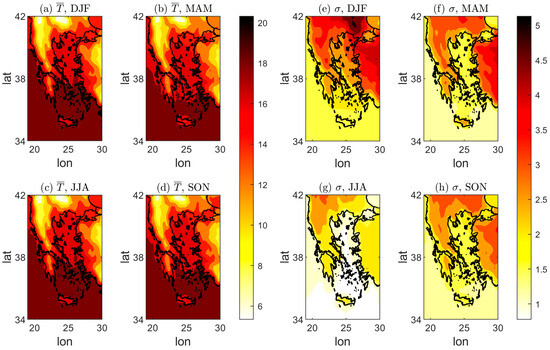
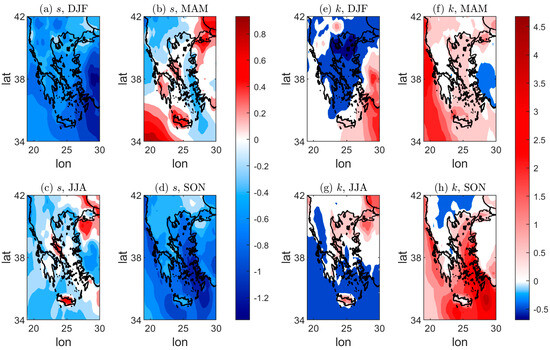
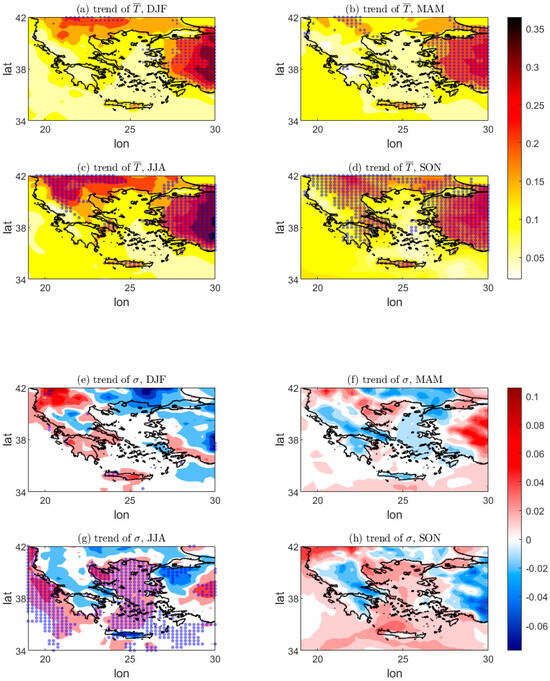
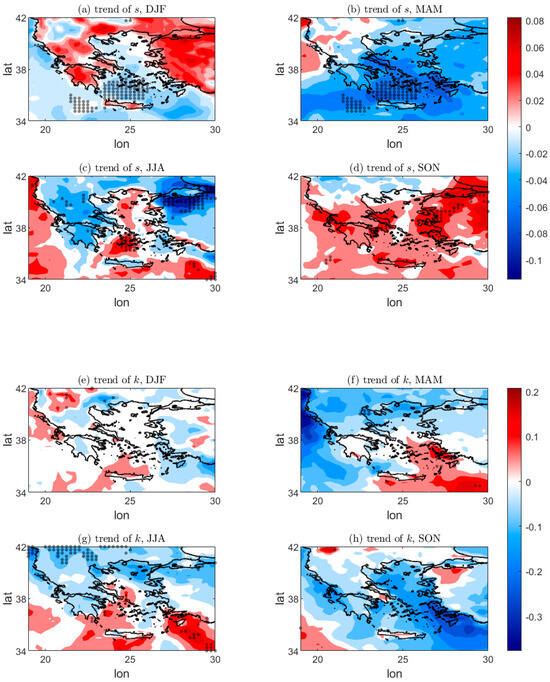
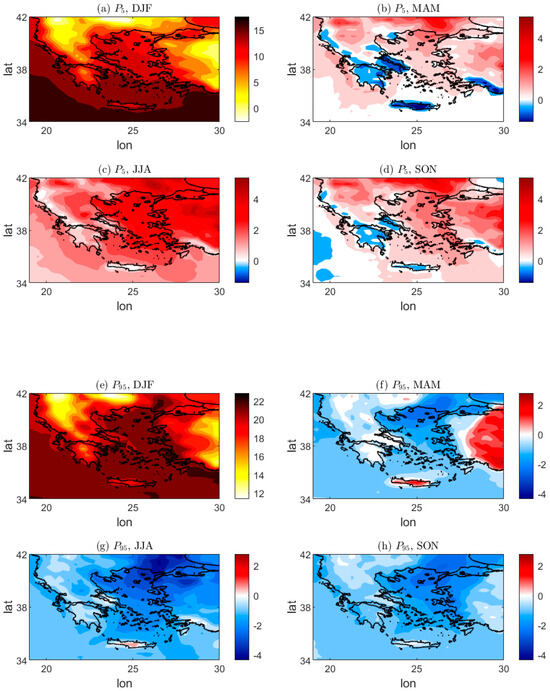
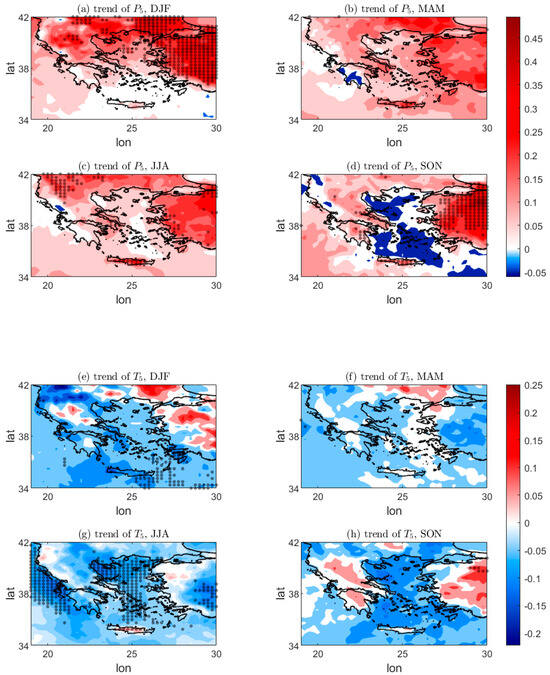
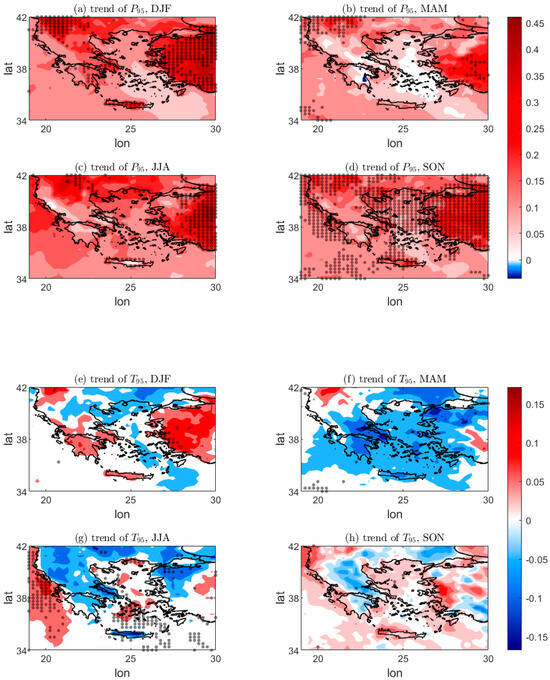
Beyond Mean Warming: Changes in the Distribution of 2 m Temperatures and Extremes in Greece over the Last 80 Years -
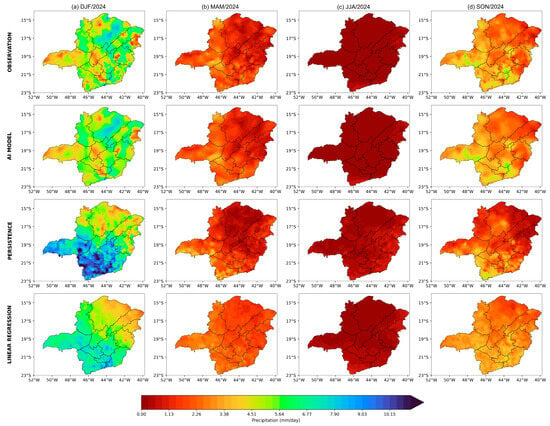
Use of Artificial Intelligence for Spatial Seasonal Precipitation Forecasting in Minas Gerais, Brazil -
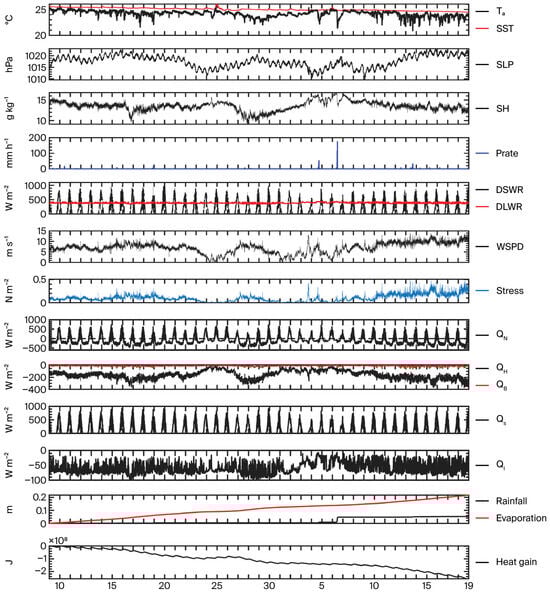
Estimates of Ocean–Atmosphere Heat Fluxes in the Tropical Atlantic from Different Bulk Parameterization Schemes Used Operationally in Brazil
Journal Description
Meteorology
Meteorology
is an international, peer-reviewed, open access journal on atmospheric science published quarterly online by MDPI.
- Open Access— free for readers, with article processing charges (APC) paid by authors or their institutions.
- High Visibility: indexed within Scopus and other databases.
- Rapid Publication: manuscripts are peer-reviewed and a first decision is provided to authors approximately 23.3 days after submission; acceptance to publication is undertaken in 5.2 days (median values for papers published in this journal in the first half of 2026).
- Recognition of Reviewers: APC discount vouchers, optional signed peer review, and reviewer names published annually in the journal.
- Meteorology is a companion journal of Atmosphere.
- Journal Cluster of Geospatial and Earth Sciences: Remote Sensing, Atmosphere, Geosciences, Climate, Quaternary, Earth, Geographies, Geomatics, Meteorology and Fossil Studies.
Latest Articles
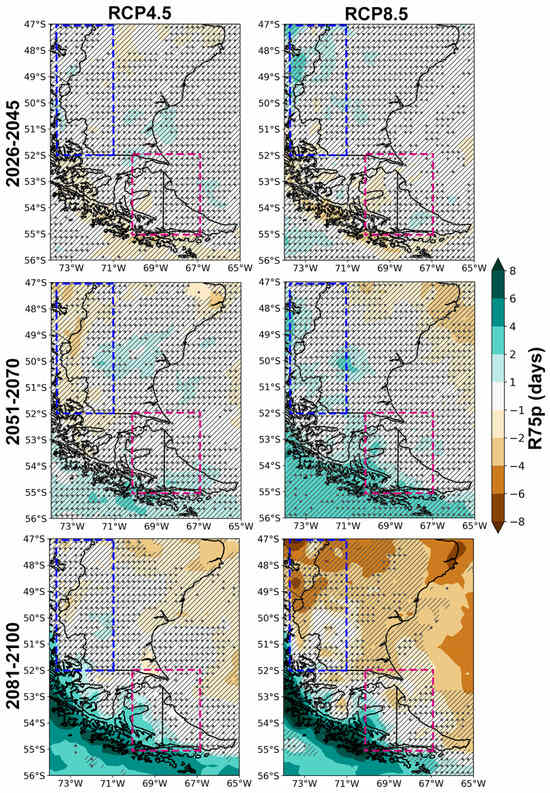
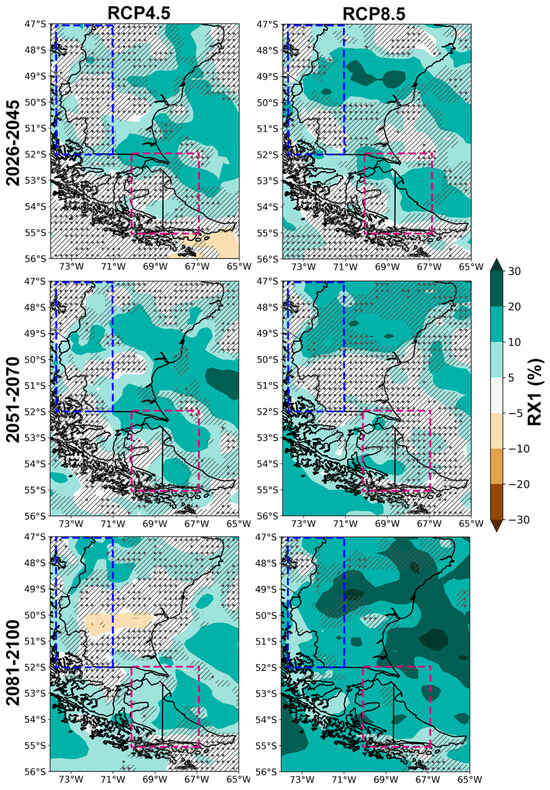
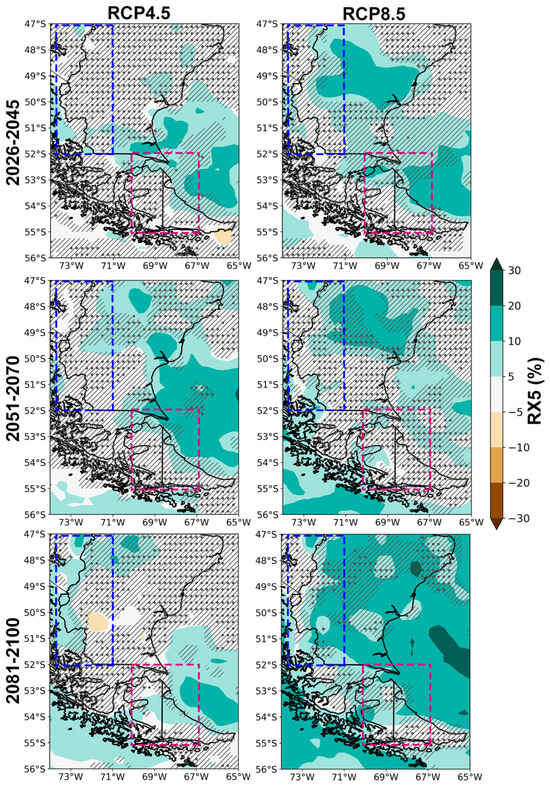
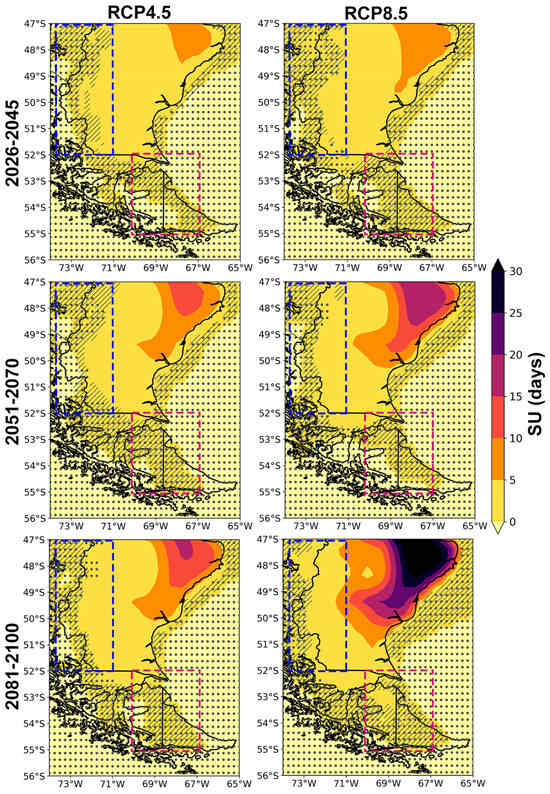
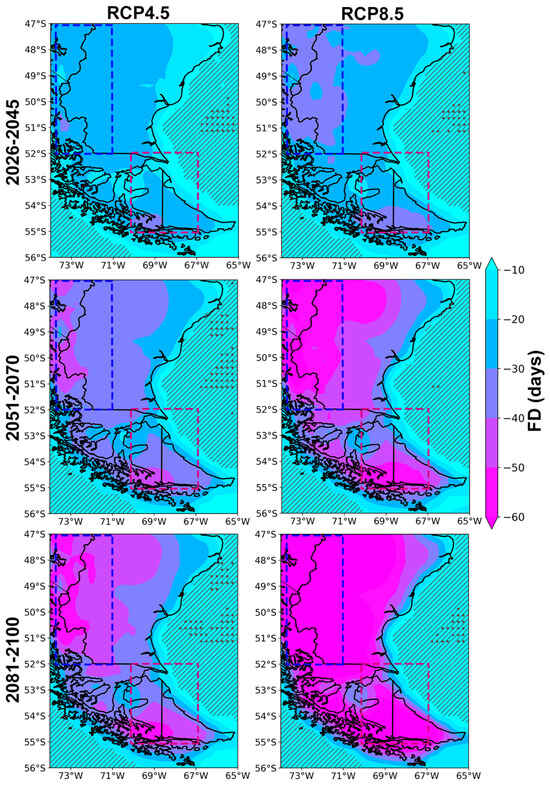
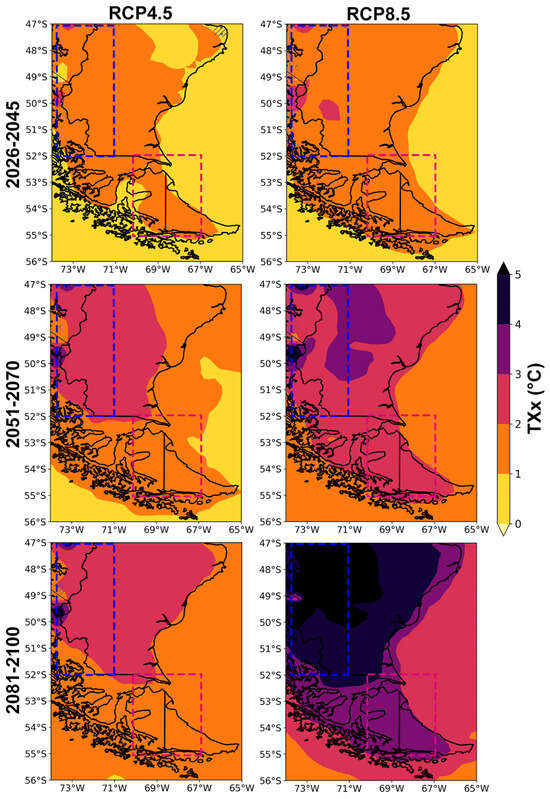
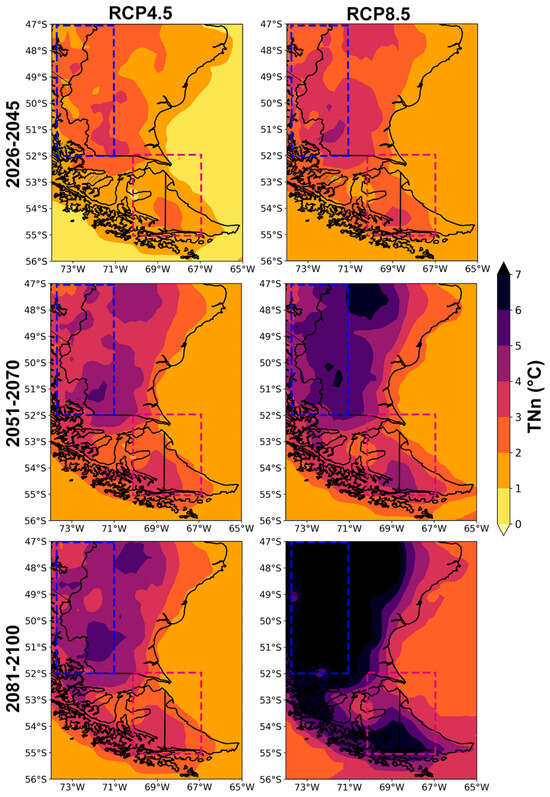
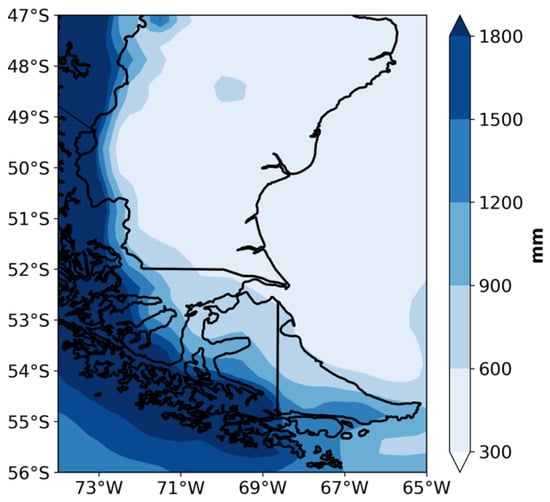
Projected Intensification of Temperature and Precipitation Extremes at the Southern Tip of South America: Insights from CORDEX Regional Climate Simulations
Meteorology 2026, 5(3), 23; https://doi.org/10.3390/meteorology5030023 - 4 Aug 2026
Abstract
►
Show Figures
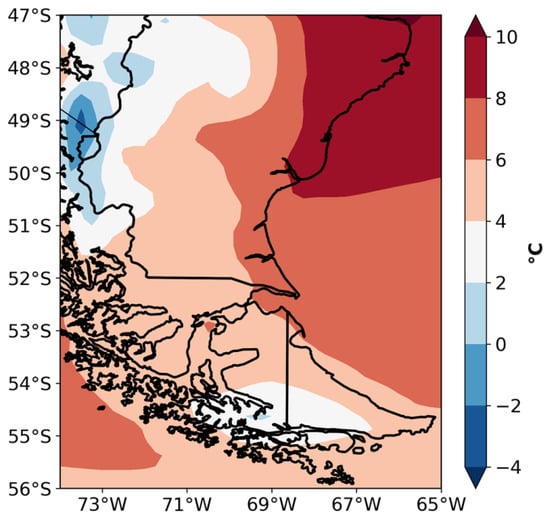
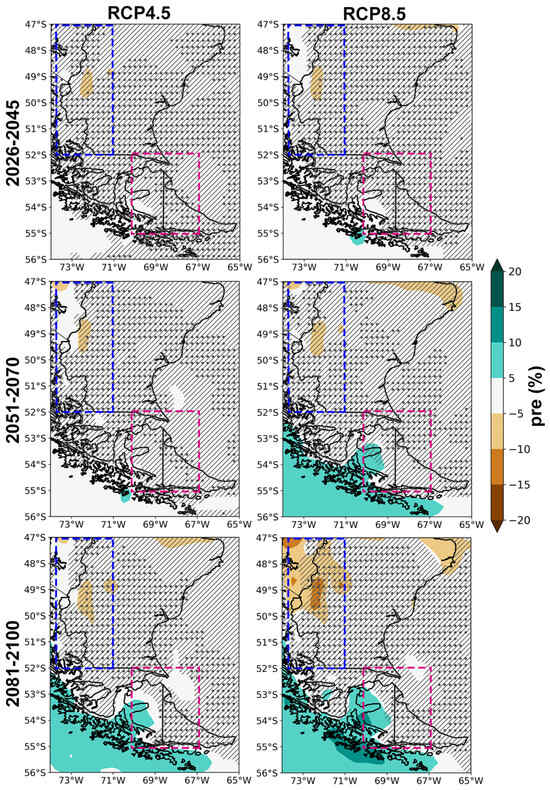
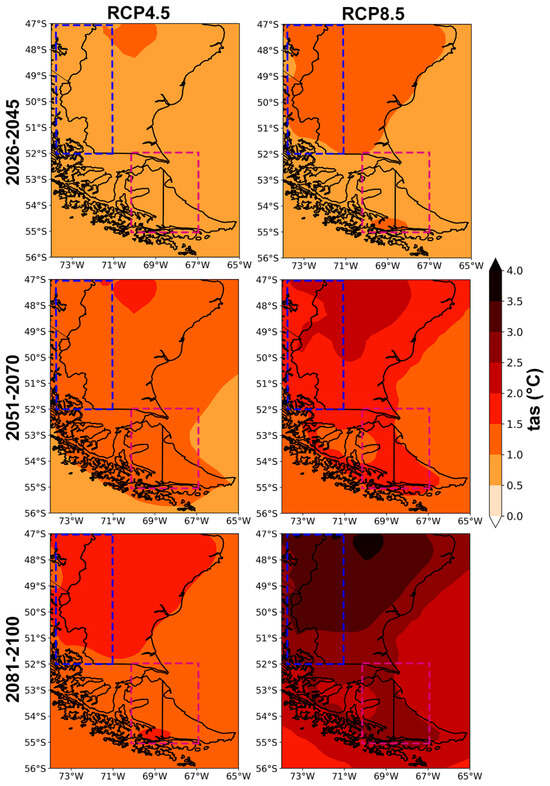
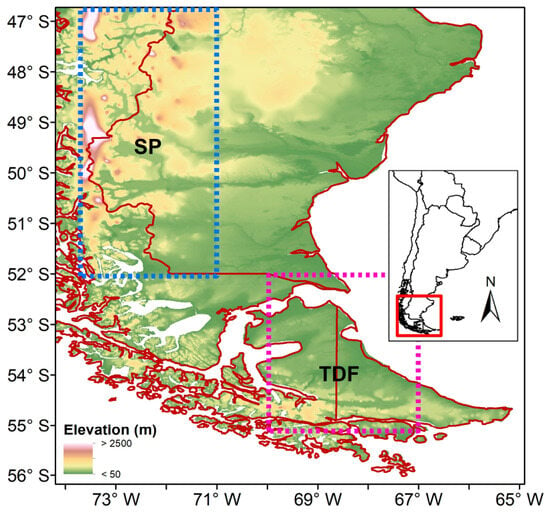
Southern South America encompasses temperate forests, steppe ecosystems, peatlands, fjords, and marine environments that support unique biodiversity and human communities, containing one of the world’s largest freshwater reserves in the Patagonian Icefields. Its relevance makes climate change a major threat to both natural
[...] Read more.
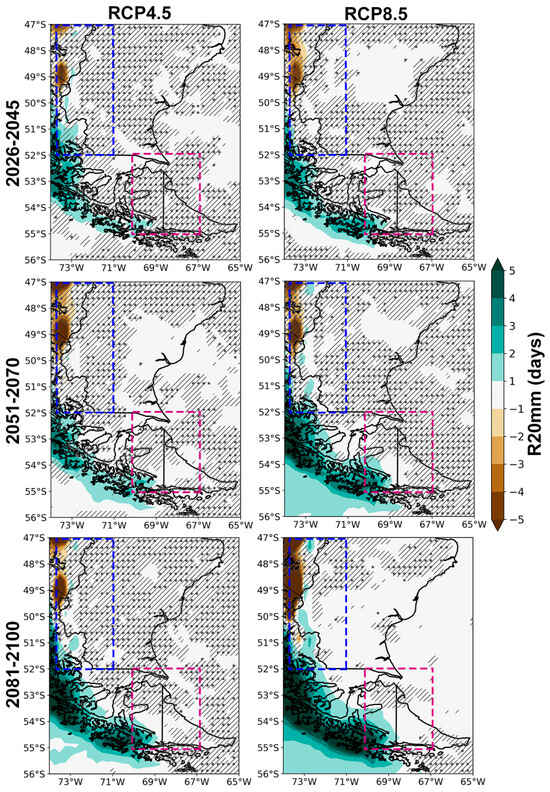
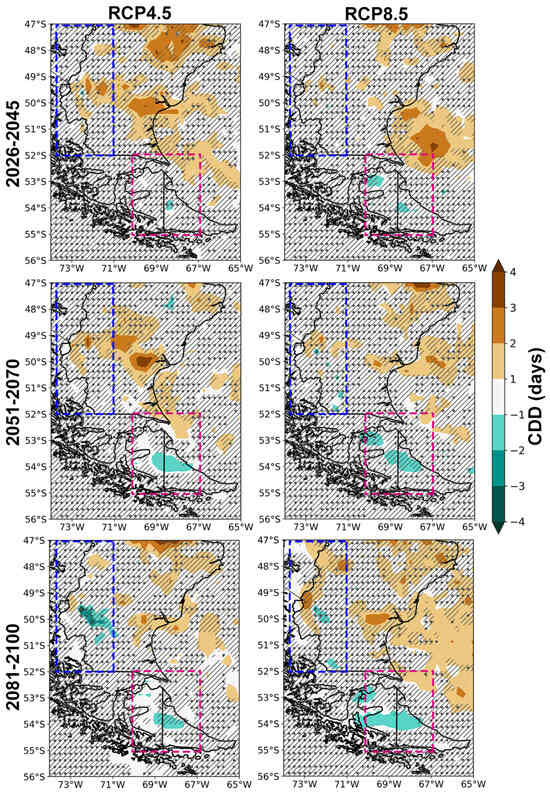
Southern South America encompasses temperate forests, steppe ecosystems, peatlands, fjords, and marine environments that support unique biodiversity and human communities, containing one of the world’s largest freshwater reserves in the Patagonian Icefields. Its relevance makes climate change a major threat to both natural ecosystems and human populations. Nevertheless, future changes in climate extremes, considering the complex topographic patterns that shape regional climatic patterns, remain uncertain. This study used an ensemble of regional climate models to assess future changes in a set of 9 temperature and precipitation extreme indices under two emissions scenarios (RCP4.5 and RCP8.5) and three future time horizons (2026–2045; 2051–2070 and 2081–2100). Our results reveal a robust intensification of temperature extremes, with minimum temperature extremes projected to increase by more than 7 °C under the high-emissions scenario by the end of the century, accompanied by increases exceeding 30 summer days in the northeastern portion of the region. In contrast, precipitation extremes exhibit larger spatial variability and uncertainty, although robust reductions in the frequency of days with precipitation exceeding 20 mm partially explain the projected drying trend, while increases in 1- and 5-day maximum precipitation indicate more intense heavy rainfall events across the Patagonian steppe. These results have clear implications for the cryosphere and the biodiversity of the region.
Full article
Open AccessArticle
Investigating the Combined Influence of the North Atlantic Oscillation and the East Atlantic Pattern on Monthly Precipitation Across Mainland Spain
by
Callum Cording and Harry West
Meteorology 2026, 5(3), 22; https://doi.org/10.3390/meteorology5030022 - 2 Aug 2026
Abstract
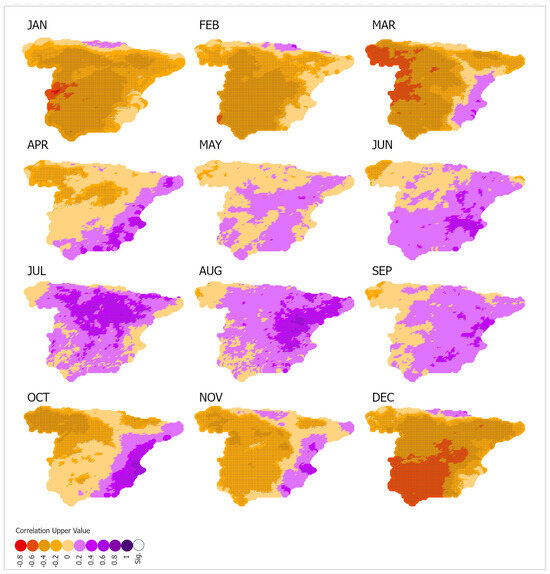
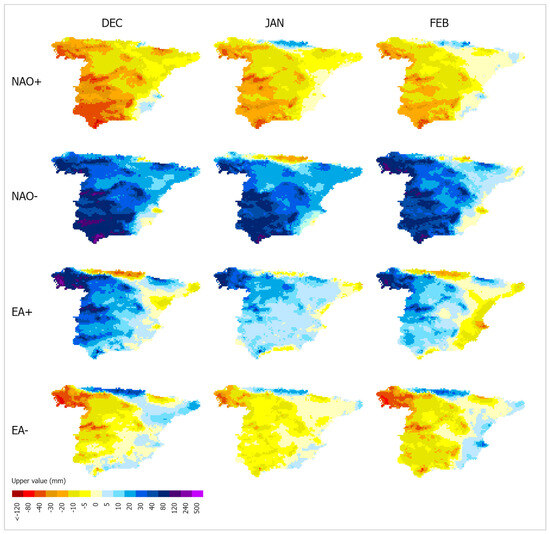
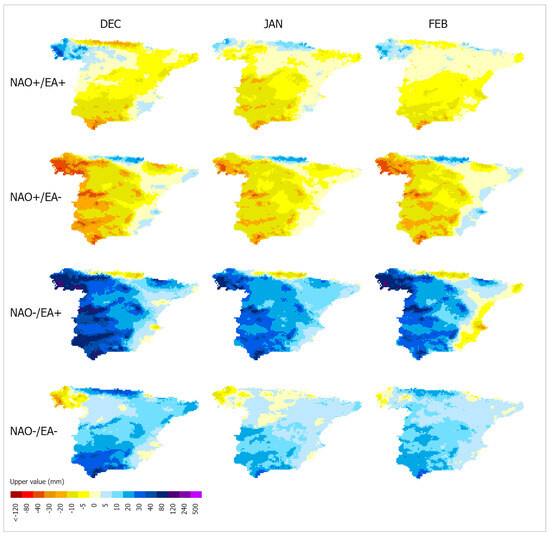
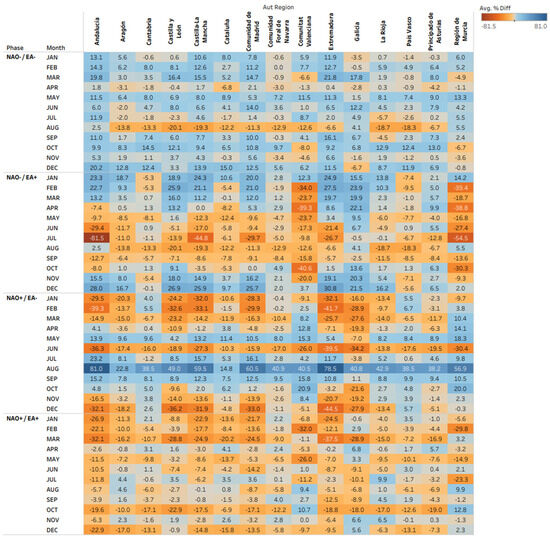
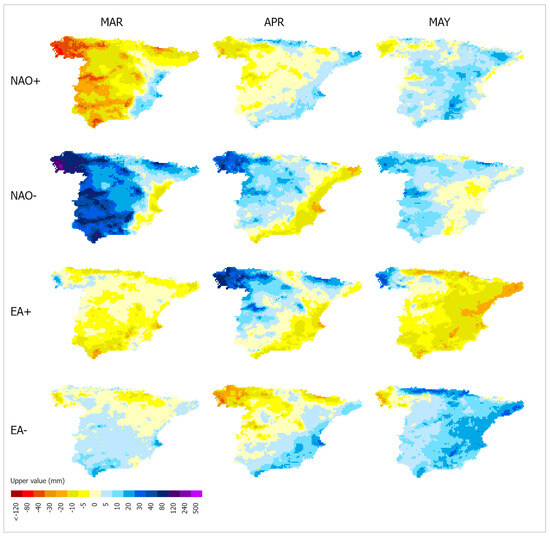
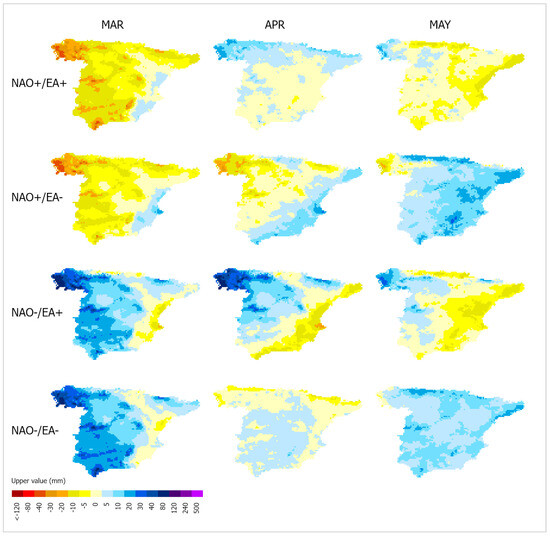
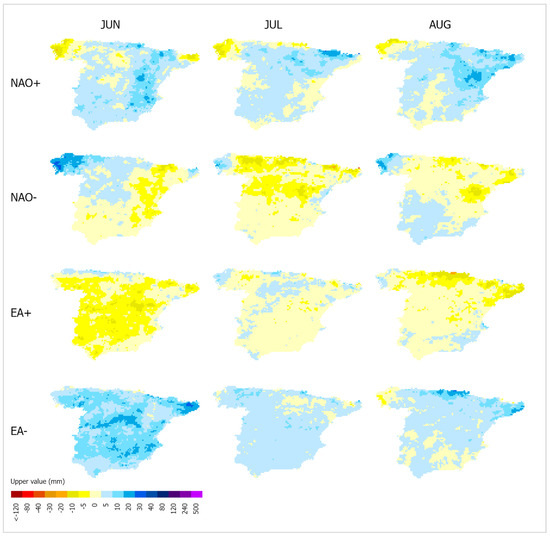
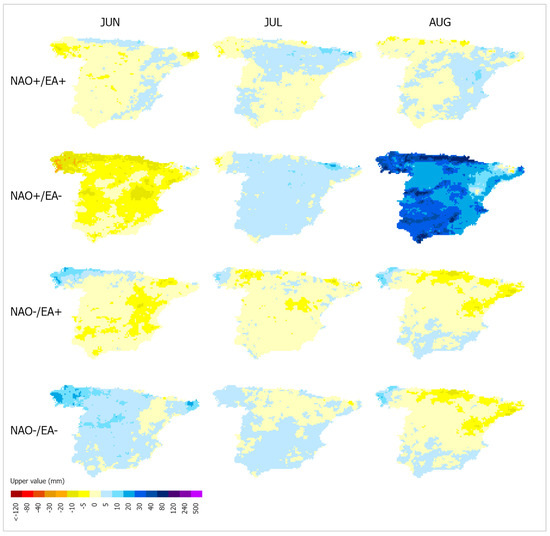
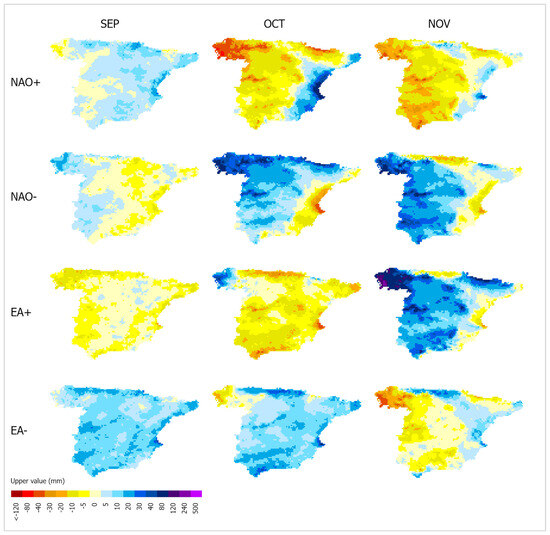
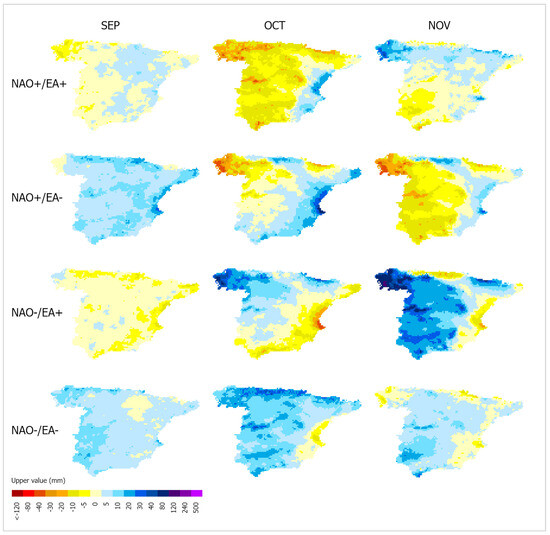
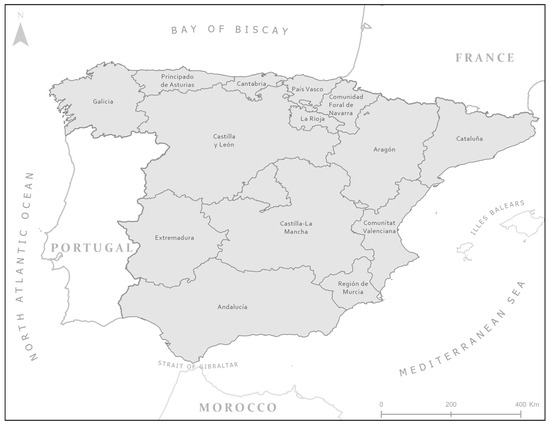
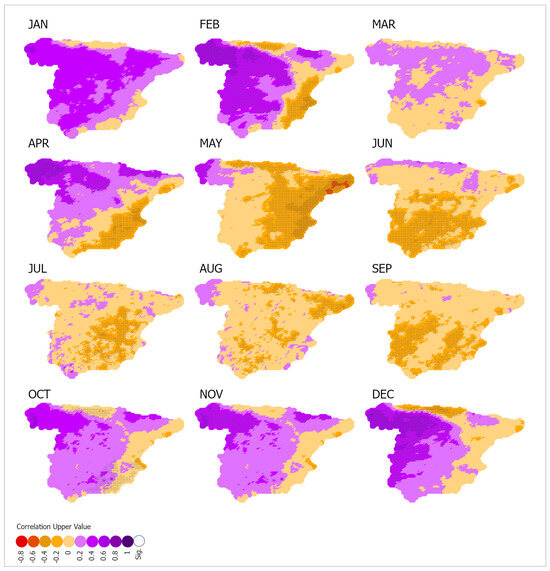
The combined influence of the NAO and EA on monthly precipitation across mainland Spain remains insufficiently understood despite their recognized importance for European climate variability. This study investigates how individual and combined NAO and EA phases influence monthly precipitation patterns across mainland Spain
[...] Read more.
The combined influence of the NAO and EA on monthly precipitation across mainland Spain remains insufficiently understood despite their recognized importance for European climate variability. This study investigates how individual and combined NAO and EA phases influence monthly precipitation patterns across mainland Spain using the MOPREDAScentury dataset between January 1950 and December 2020. Spatial correlation analyses and precipitation deviation mapping were used to identify regional and seasonal precipitation responses associated with each teleconnection phase. The results demonstrate that combined NAO/EA phases produce distinct precipitation signatures that vary considerably throughout the year, with the strongest and most spatially coherent relationships occurring during winter. Concurrent NAO−/EA −phases were associated with significantly wetter conditions, whereas NAO+/EA− phases generally produced drier conditions across much of mainland Spain. The influence of the NAO weakened through summer, while the EA became a more important control on precipitation variability. These findings demonstrate that considering the NAO and EA together provides a more comprehensive understanding of precipitation variability than analyzing either teleconnection independently, with potential applications for seasonal forecasting, drought preparedness and water resource management.
Full article
(This article belongs to the Special Issue Early Career Scientists’ (ECS) Contributions to Meteorology (2026))
►▼
Show Figures

Figure 1
Open AccessArticle
Impact of ASCAT Level-2 Soil Moisture Assimilation Using a Simplified Extended Kalman Filter in the AROME Model
by
Helga Tóth, Balázs Szintai and Hajnalka Breuer
Meteorology 2026, 5(3), 21; https://doi.org/10.3390/meteorology5030021 - 25 Jul 2026
Abstract
►▼
Show Figures
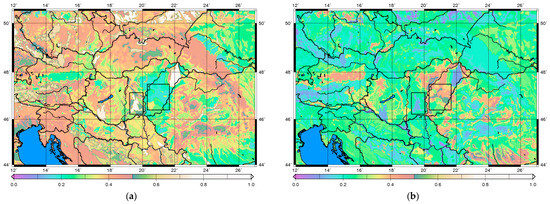
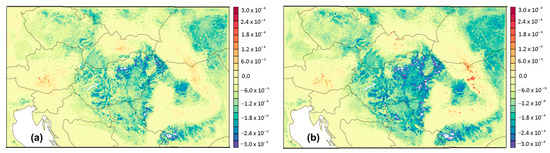
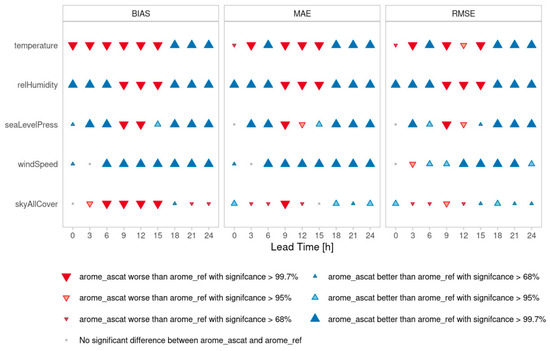
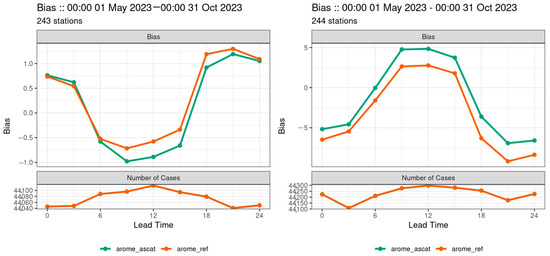
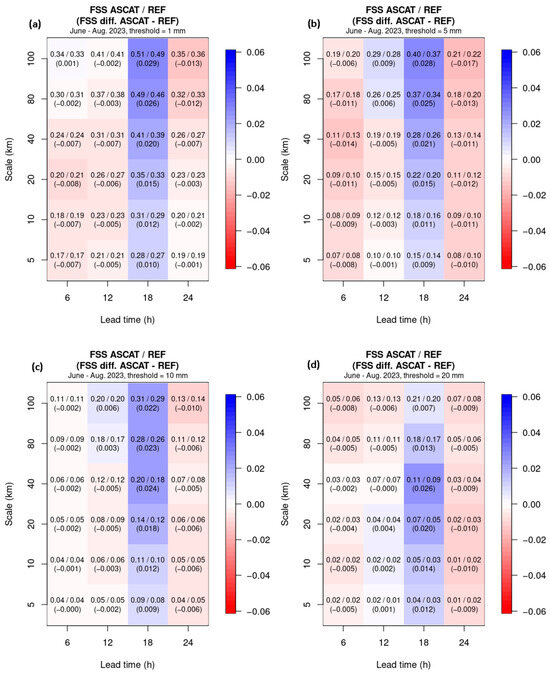
This study investigates the impact of assimilating Advanced Scatterometer (ASCAT) Level-2 surface soil moisture retrievals into the Application of Research to Operations at Mesoscale (AROME) model, the operational numerical weather prediction system of the Hungarian Meteorological Service. The Level-2 retrievals are geophysical soil
[...] Read more.
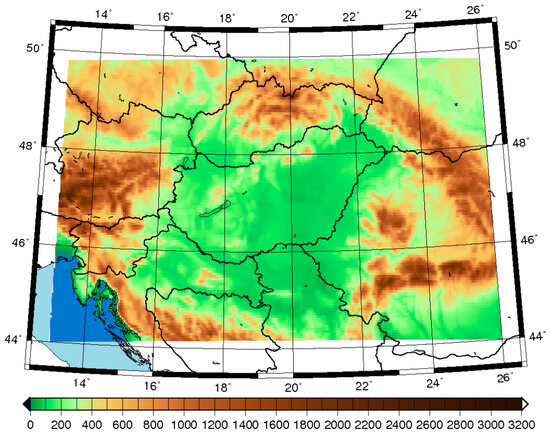
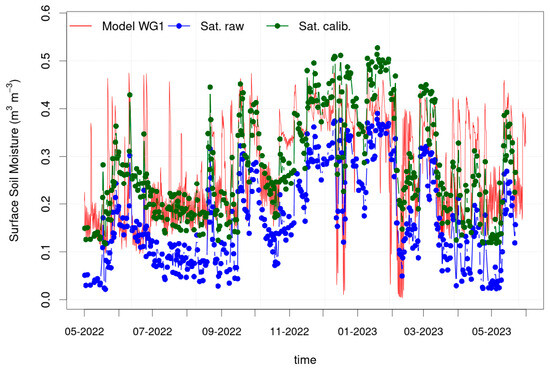
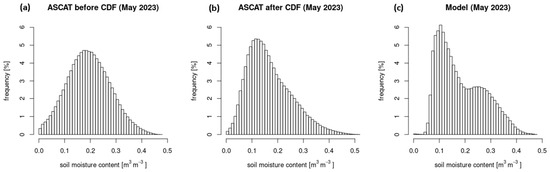
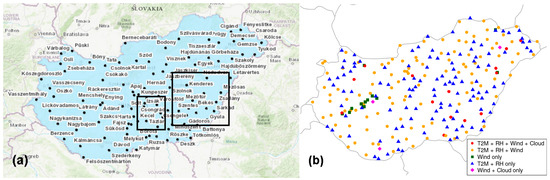
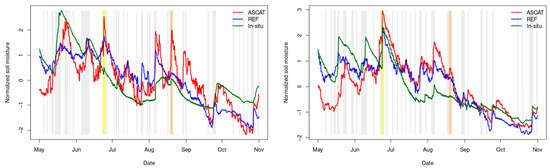
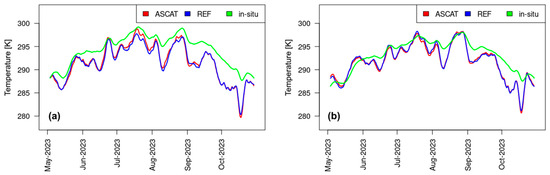
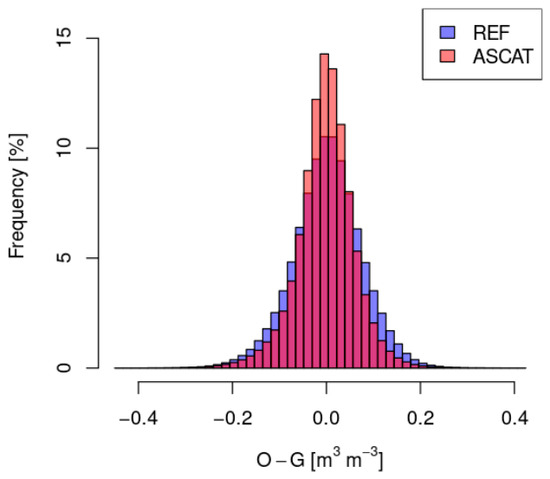
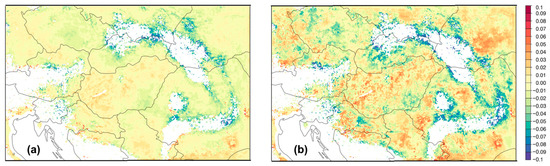
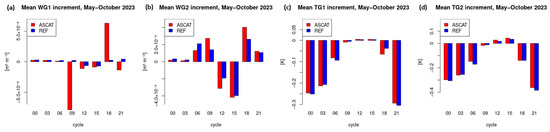
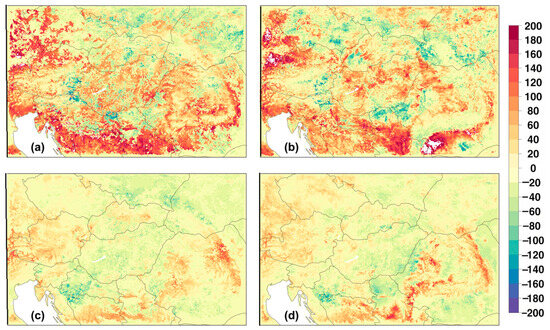
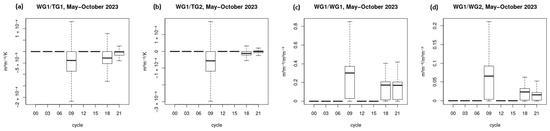
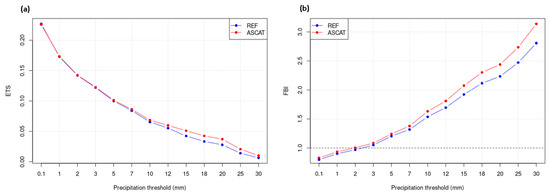
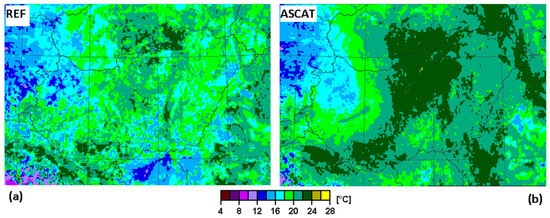
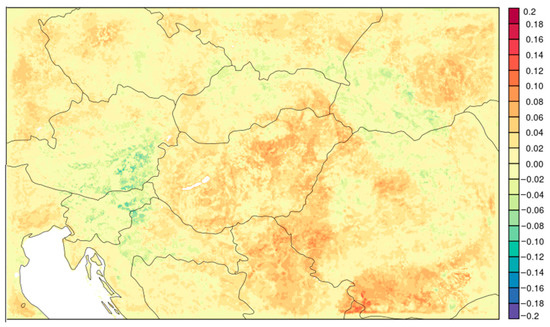
This study investigates the impact of assimilating Advanced Scatterometer (ASCAT) Level-2 surface soil moisture retrievals into the Application of Research to Operations at Mesoscale (AROME) model, the operational numerical weather prediction system of the Hungarian Meteorological Service. The Level-2 retrievals are geophysical soil moisture estimates derived from satellite radar backscatter observations and represent the uppermost soil layer (approximately 0–5 cm). Data assimilation is performed using a Simplified Extended Kalman Filter (SEKF) within the SURFEX surface modeling platform. In the reference configuration (REF), the same SEKF framework is applied, as used operationally for the assimilation of 2 m temperature and relative humidity observations. A second experiment (ASCAT) extends this configuration by additionally assimilating ASCAT surface soil moisture retrievals. The experimental period covers May–October 2023. The objective of the study is to quantify the added value of ASCAT soil moisture assimilation relative to the REF experiment, which does not assimilate ASCAT retrievals. Results indicate a systematic improvement in root-zone soil moisture and soil temperature, suggesting that the assimilation of surface soil moisture observations propagates beneficially to deeper soil layers. Verification against in situ and model-derived diagnostics shows a positive impact on near-surface atmospheric variables, particularly for 2 m temperature and humidity during nighttime conditions. Furthermore, precipitation verification reveals a measurable improvement, suggesting a beneficial influence of improved land–atmosphere coupling on short-range forecasts.
Full article

Figure 1
Open AccessArticle
Spatio-Temporal Variability and Trends of Precipitation and Climate Extremes over Morocco (1991–2020) Using Synoptic Observations’ Data
by
Meriem Ouattab, Hicham Charifi, Rachid Moustabchir, Albin Ullmann, Pascal Roucou and Fouad Gadouali
Meteorology 2026, 5(3), 20; https://doi.org/10.3390/meteorology5030020 - 22 Jul 2026
Abstract
►▼
Show Figures
Morocco, located at the southern margin of the Mediterranean climate-change hotspot, is exposed to a rapidly evolving precipitation regime whose national-scale characterization remains incomplete. This study delivers an integrated assessment of the spatio-temporal variability and trends of precipitation and its extremes over the
[...] Read more.
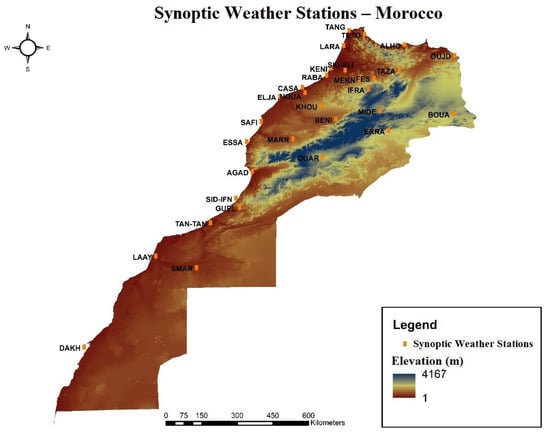
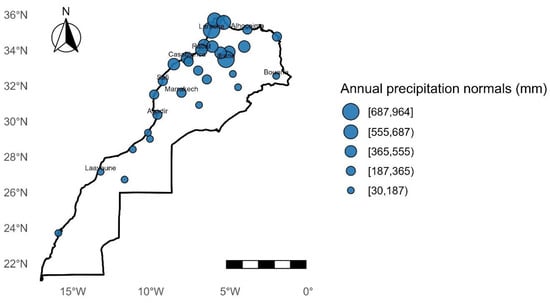
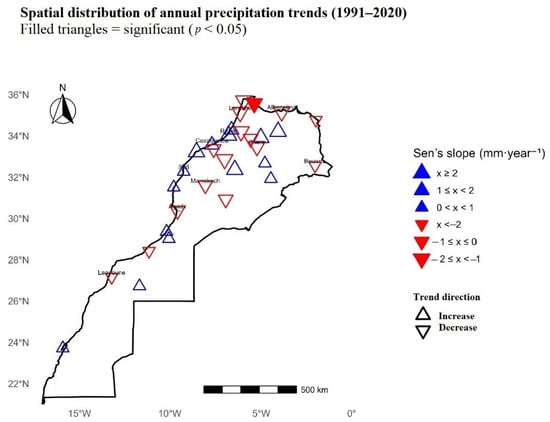
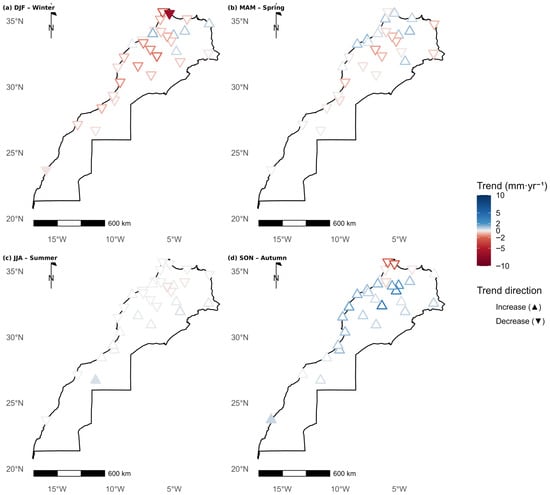
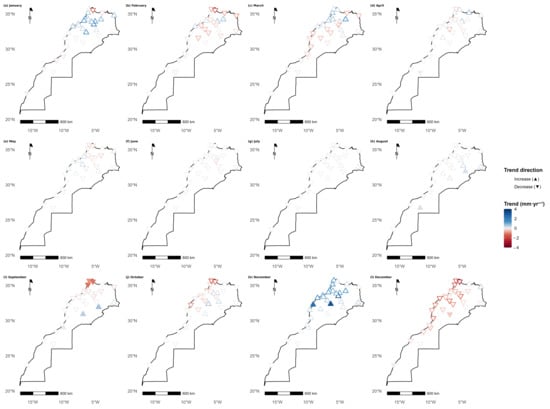
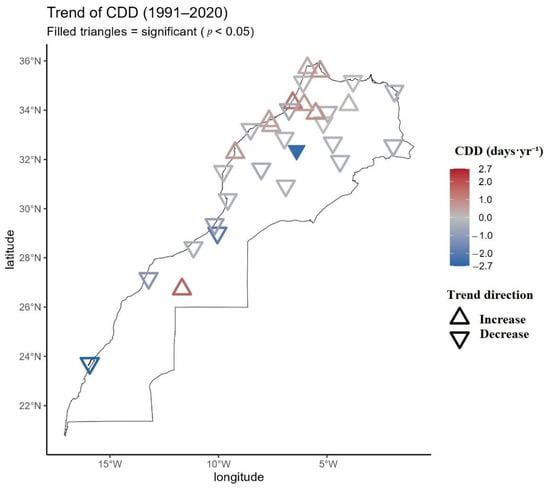
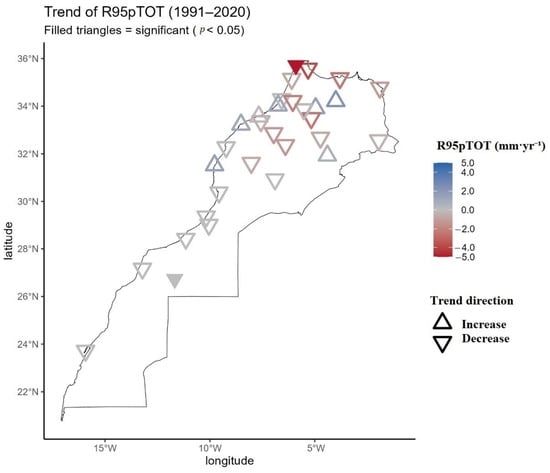
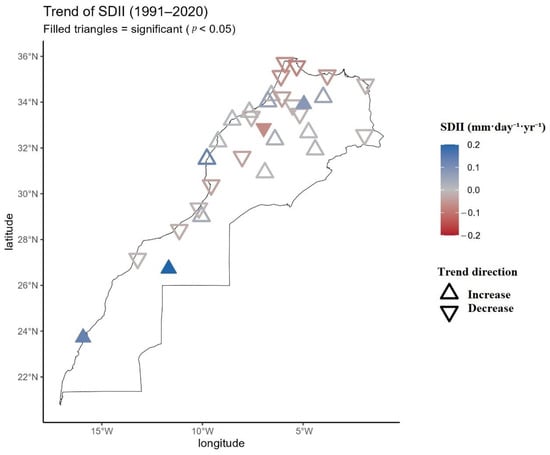
Morocco, located at the southern margin of the Mediterranean climate-change hotspot, is exposed to a rapidly evolving precipitation regime whose national-scale characterization remains incomplete. This study delivers an integrated assessment of the spatio-temporal variability and trends of precipitation and its extremes over the country during the most recent World Meteorological Organization (WMO) climate-normal period (1991–2020), based on daily observations from 31 synoptic stations operated by the Direction Générale de la Météorologie (DGM). Trends in annual, seasonal and monthly precipitation were quantified using the non-parametric Mann–Kendall test combined with Sen’s slope estimator, while the structural transformation of the rainfall regime was characterized through three indices recommended by the Expert Team on Climate Change Detection and Indices (ETCCDI): the Consecutive Dry Days (CDDs), the Simple Daily Intensity Index (SDII) and the amount of precipitation from very wet days (R95pTOT). The results reveal an apparent tendency toward a negative trend, with a predominance of negative precipitation trends in winter and early spring, most pronounced in February, that reach statistical significance at only a limited number of stations, partly offset by a spatially coherent wetting in November over central and eastern Morocco. The joint analysis of the three ETCCDI indices indicates a north–south contrasted reorganization: northern stations exhibit longer dry spells coexisting with intensified extreme rainfall, whereas southern stations show a generalized weakening of both intensity and extremes. These findings point to a structural shift toward more episodic and contrasted precipitation regimes, with the wet season starting later, ending earlier and concentrating rainfall into fewer but more intense events. The analysis provides an updated observational baseline for the validation of CMIP6 based regional projections and for the design of climate-resilient water and agricultural strategies in Morocco.
Full article

Figure 1
Open AccessEditorial
Heat, UV Radiation, and Other Related Atmospheric Stressors: Exposure Pathways, Health Effects, and Adaptation Needs
by
Andreas Matzarakis
Meteorology 2026, 5(3), 19; https://doi.org/10.3390/meteorology5030019 - 11 Jul 2026
Abstract
Heat and ultraviolet (UV) radiation are among the most consequential environmental stressors intensified by anthropogenic climate change [...]
Full article
Open AccessArticle
An Empirical Model for Non-Linear Pressure Drag Across Non-Hydrostatic Flow Regimes with Trapped Lee Waves
by
José Luis Argain
Meteorology 2026, 5(3), 18; https://doi.org/10.3390/meteorology5030018 - 7 Jul 2026
Abstract
►▼
Show Figures
This study introduces a novel empirical model to estimate the total pressure drag generated by trapped lee waves (TLW) and upward-propagating internal waves in moderate-to-strong non-hydrostatic, stratified flow over a mountain ridge, as a function of flow non-linearity. The core framework is based
[...] Read more.
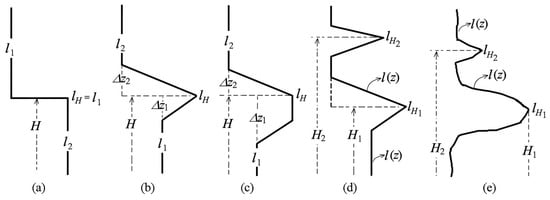
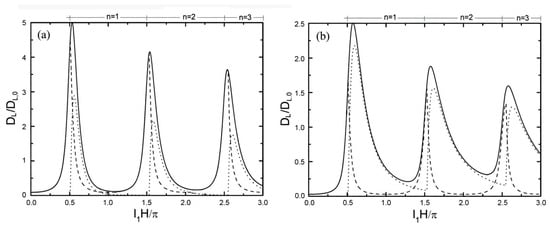
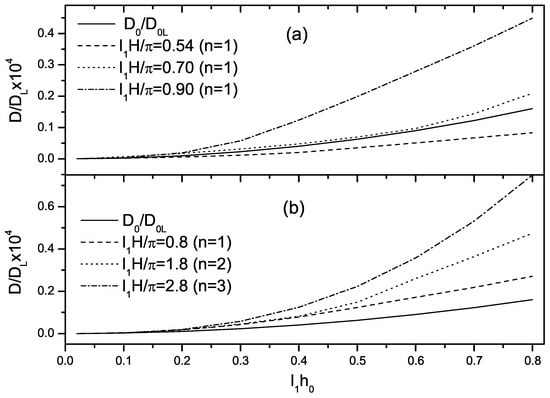
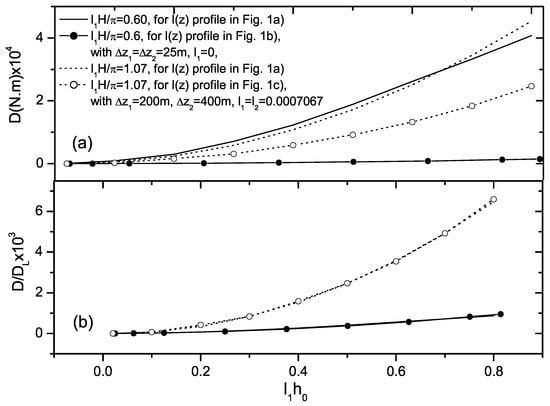
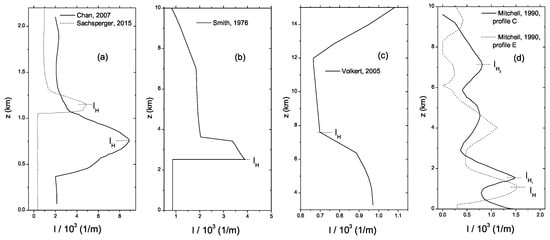
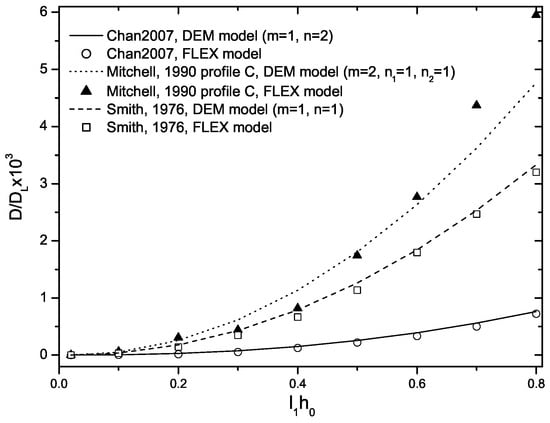
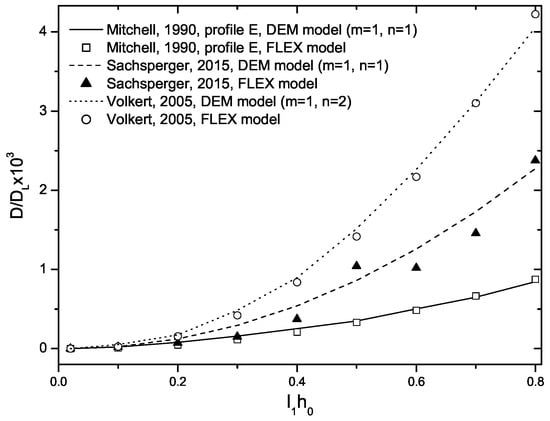
This study introduces a novel empirical model to estimate the total pressure drag generated by trapped lee waves (TLW) and upward-propagating internal waves in moderate-to-strong non-hydrostatic, stratified flow over a mountain ridge, as a function of flow non-linearity. The core framework is based on a two-layer atmosphere characterized by a piecewise-constant Scorer parameter, l, where a lower layer of constant underlies an upper layer with . This framework incorporates key features to extend beyond idealized assumptions, providing a reliable tool for predicting non-linear flow regimes over mountainous terrain, particularly those featuring realistic vertical profiles of the Scorer parameter. To develop the empirical formulation, a micro- to mesoscale numerical model is employed to simulate realistic, non-linear flows over steep topography. The proposed empirical model yields results that compare favorably with numerical simulations across a range of moderate-to-strong non-hydrostatic regimes, including complex cases derived from observational data and realistic vertical profiles of the Scorer parameter. The model demonstrates robust performance ranging from strongly to moderately non-hydrostatic regimes (the latter corresponding to dimensionless half-widths of approximately 5), and provides accurate drag estimates for non-linearities up to a dimensionless mountain height of approximately unity. Therefore, this empirical approach serves as a valuable foundation for improving drag parameterizations in weather prediction models, offering a computationally efficient alternative to high-resolution numerical downscaling over steep terrain.
Full article

Figure 1
Open AccessArticle
Synoptic Seasonal Approach to South Asian Monsoon Process
by
Md Rafiqul Islam and Scott C. Sheridan
Meteorology 2026, 5(3), 17; https://doi.org/10.3390/meteorology5030017 - 26 Jun 2026
Abstract
This study applies a synoptic seasonal climatological framework, extended vertically through the troposphere, to investigate the South Asian monsoon using daily mean data (1948–2024) from the NCEP–NCAR Reanalysis. A seasonal synoptic circulation framework was developed using self-organizing maps (SOMs) to classify four distinct
[...] Read more.
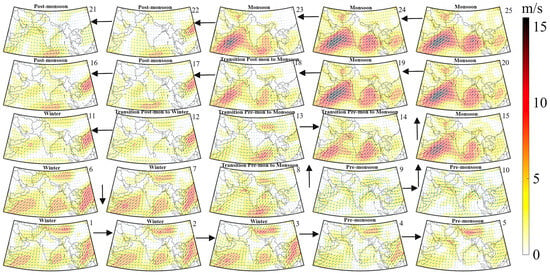
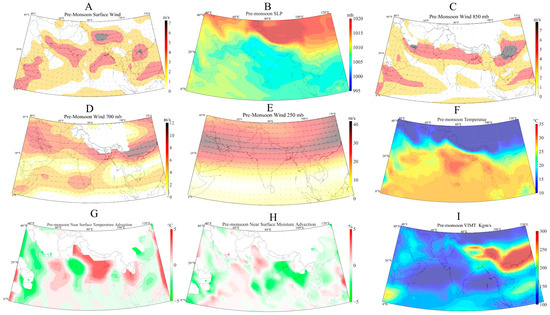
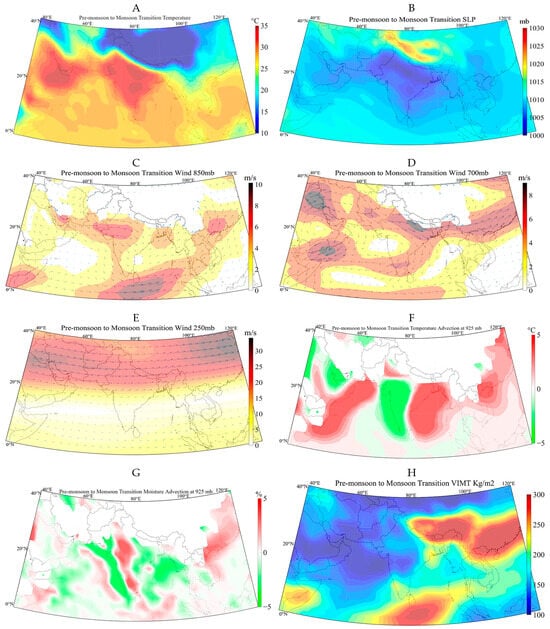
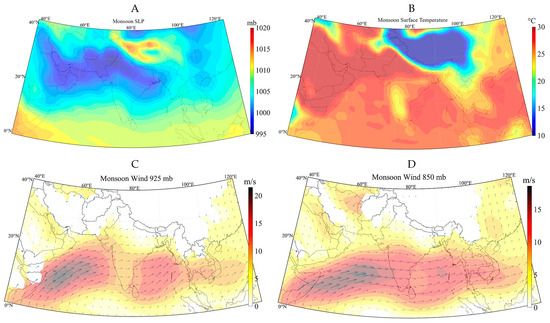
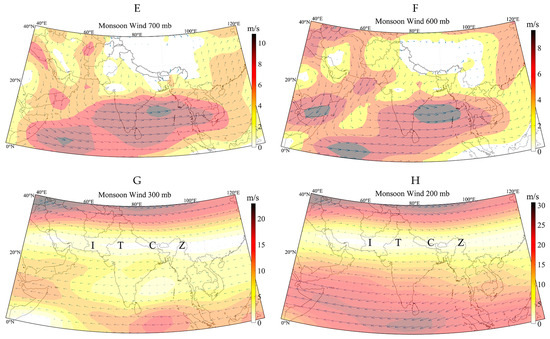
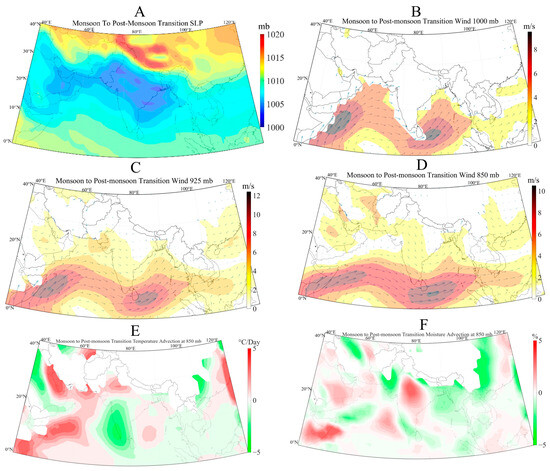
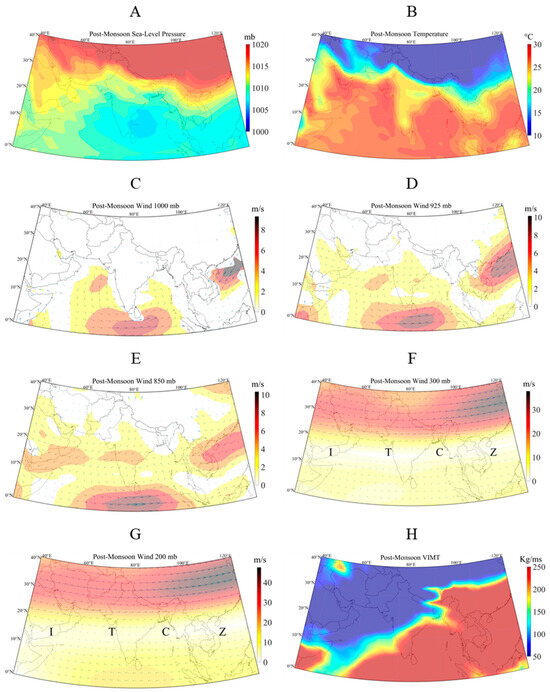
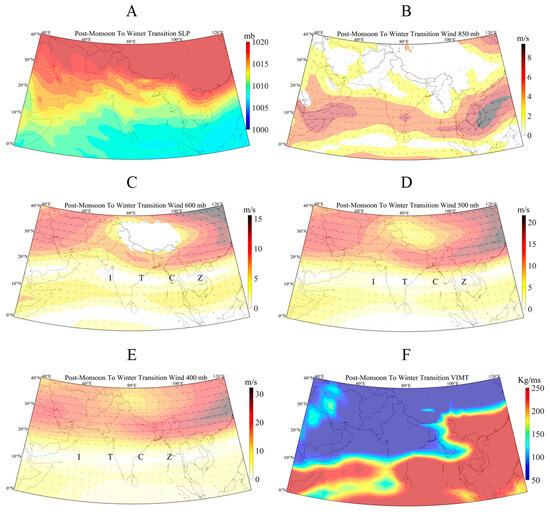
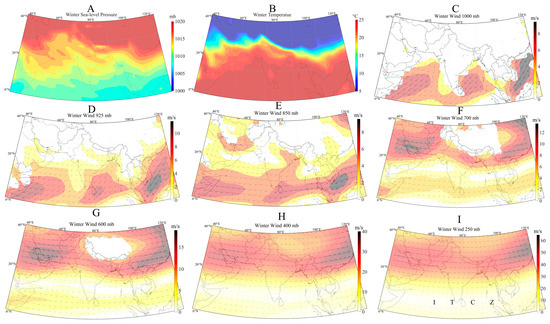
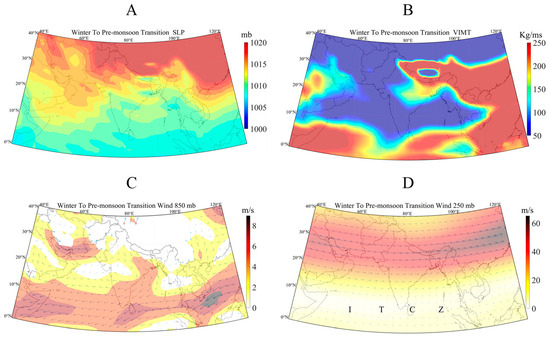
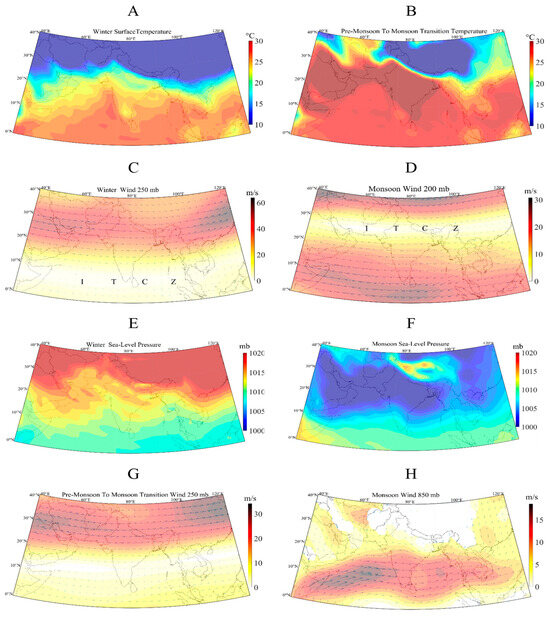
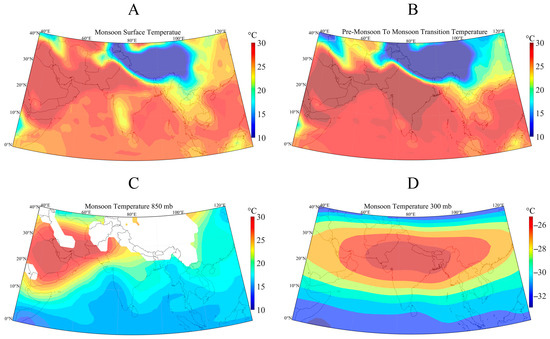
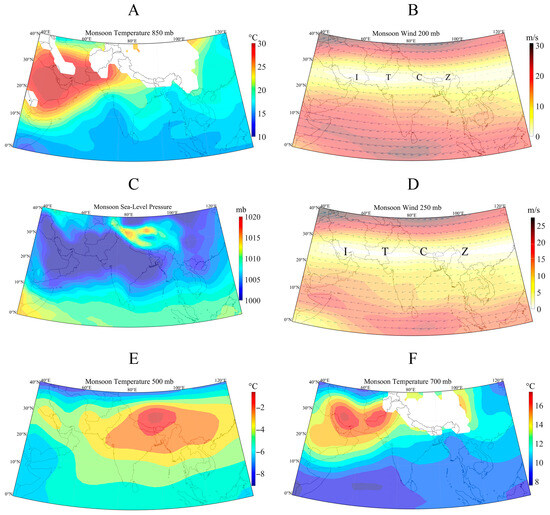
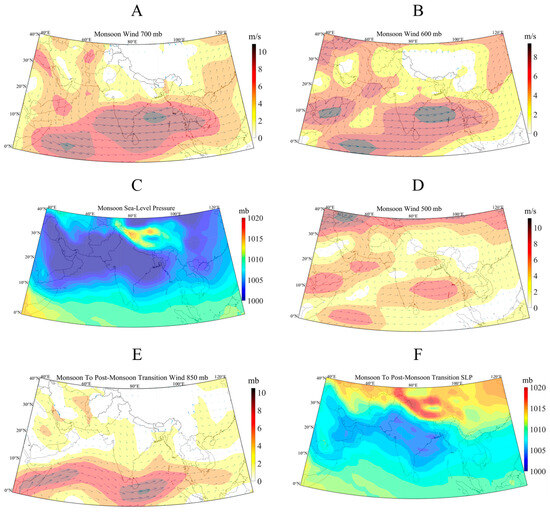
This study applies a synoptic seasonal climatological framework, extended vertically through the troposphere, to investigate the South Asian monsoon using daily mean data (1948–2024) from the NCEP–NCAR Reanalysis. A seasonal synoptic circulation framework was developed using self-organizing maps (SOMs) to classify four distinct seasons—winter, pre-monsoon, monsoon, and post-monsoon—and their transitional phases. Diagnostics including temperature and moisture advection and vertically integrated moisture transport (VIMT) were incorporated to examine circulation–environment interactions. The results highlight the pre-monsoon-to-monsoon transition as the most critical seasonal shift, marked by rapid land heating, steep pressure gradients, and northward ITCZ migration that initiates southwesterly monsoon winds. Classical land–sea thermal contrasts initiate the low-level monsoon wind reversal, while vertical circulation assessment suggests that mid- to upper-tropospheric thermal gradients, supported by latent heating and Hadley-type overturning, help organize and sustain monsoon circulation strength. Additionally, South Asian monsoon circulation is shifting from well-defined seasonal regimes toward more transitional states. The results reveal widespread warming, weakened VIMT during major monsoon-related phases, and uneven moisture redistribution, suggesting that climate change is reshaping the monsoon seasonal cycle through both thermodynamic and circulation-driven processes. Taken together, the findings demonstrate that monsoon dynamics arise not from a single mechanism but from interconnected processes operating across atmospheric layers. This vertically integrated synoptic circulation approach thus provides a more comprehensive framework for understanding monsoon processes.
Full article
(This article belongs to the Special Issue Early Career Scientists’ (ECS) Contributions to Meteorology (2026))
►▼
Show Figures

Figure 1
Open AccessArticle
Deep Climate Model Distillation for Localized Flood Forecasting in Low-Resource Areas
by
Julius Olaniyan, Deborah Olaniyan, Ibidun C. Obagbuwa and Madison N. Ngafeeson
Meteorology 2026, 5(2), 16; https://doi.org/10.3390/meteorology5020016 - 19 Jun 2026
Abstract
Floods remain among the most devastating natural disasters globally, disproportionately impacting low-resource regions where real-time flood forecasting is constrained by limited computational infrastructure and the scarcity of fine-resolution predictive models. Although state-of-the-art global climate models achieve high predictive accuracy, their scale and computational
[...] Read more.
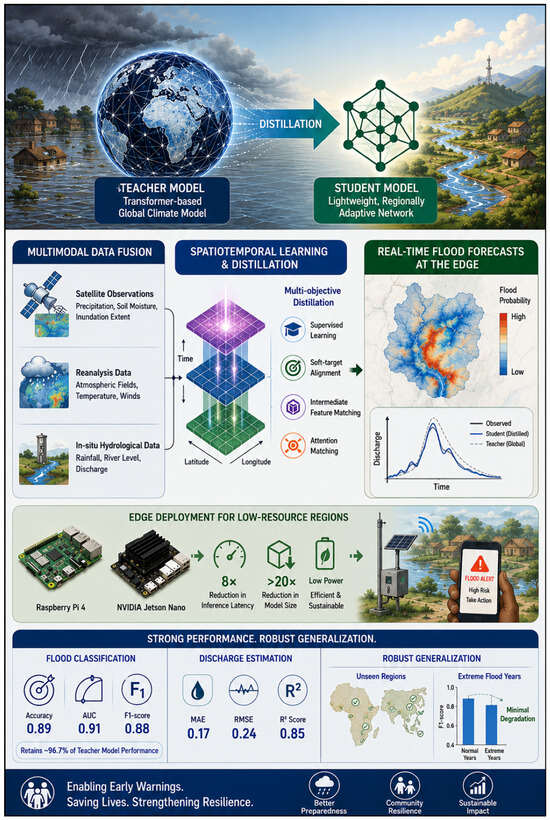
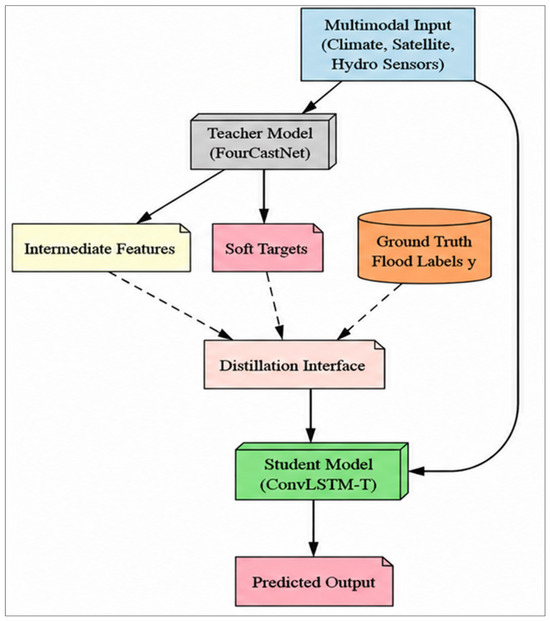
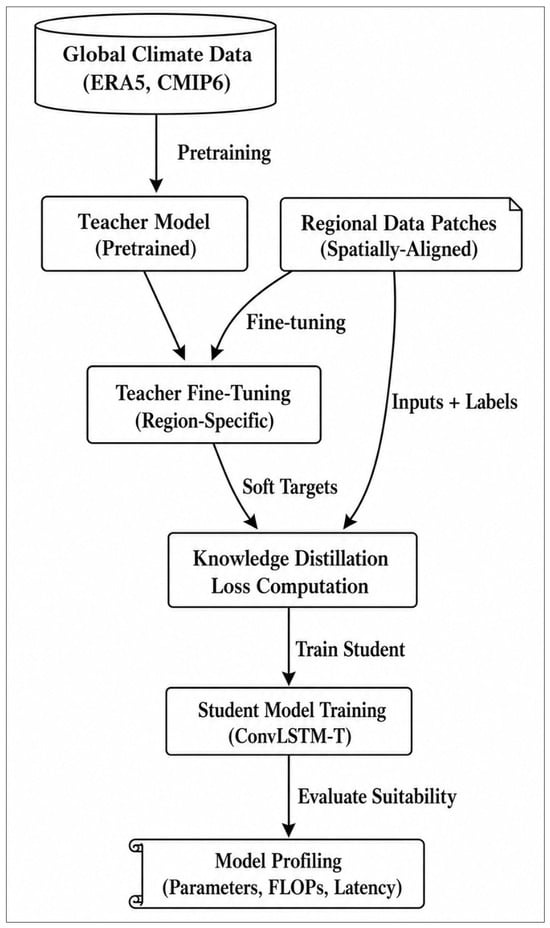
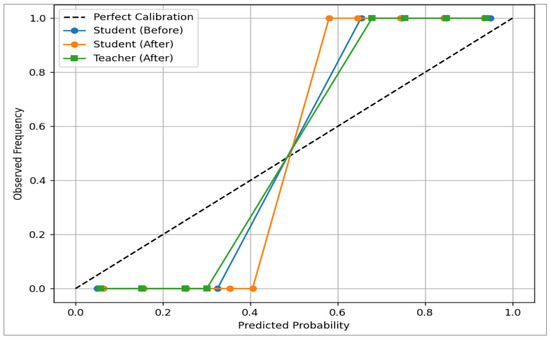
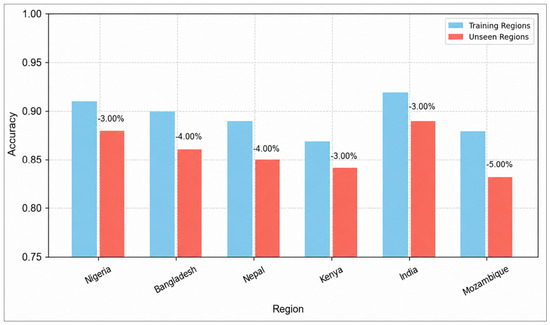
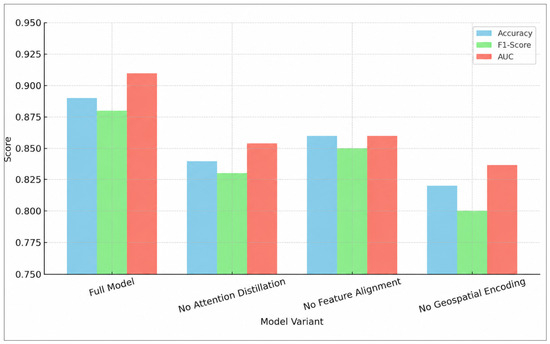
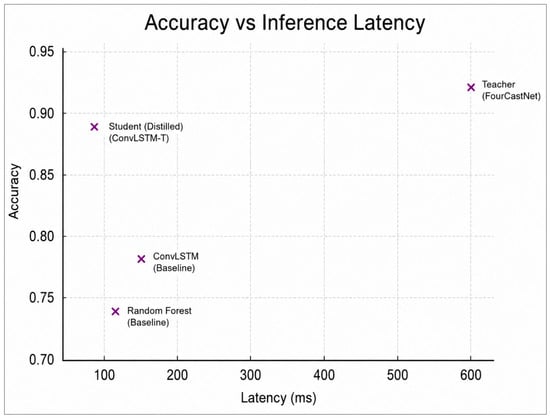
Floods remain among the most devastating natural disasters globally, disproportionately impacting low-resource regions where real-time flood forecasting is constrained by limited computational infrastructure and the scarcity of fine-resolution predictive models. Although state-of-the-art global climate models achieve high predictive accuracy, their scale and computational complexity restrict their applicability in localized and resource-constrained settings. This study proposes a deep climate model distillation framework that transfers knowledge from a high-capacity Fourier Neural Operator (FNO)-based global climate model inspired by FourCastNet into lightweight, regionally adaptive student networks suitable for edge deployment. The framework combines climate variables, satellite observations, and hydrological measurements to improve localized flood prediction. Knowledge transfer is achieved through a multi-objective distillation strategy that combines supervised learning, soft-target alignment, and intermediate feature matching. Experimental evaluation across multiple flood-prone regions in Sub-Saharan Africa and South Asia shows that the distilled student model achieves an average classification accuracy of 0.89, an AUC of 0.91, and an F1-score of 0.88, retaining approximately 96.7% of the teacher model’s predictive performance. In continuous discharge estimation, the model attains a mean absolute error of 0.17, RMSE of 0.24, and an R2 score of 0.85. The proposed distillation approach yields an 8× reduction in inference latency and over a 20× reduction in model size, enabling real-time execution on low-power edge devices such as the Raspberry Pi 4 and NVIDIA Jetson Nano. The student model further demonstrates robust regional and temporal generalization, with limited performance degradation in unseen geographic areas and during extreme flood years.
Full article
(This article belongs to the Special Issue Early Career Scientists’ (ECS) Contributions to Meteorology (2026))
►▼
Show Figures

Graphical abstract
Open AccessArticle
Variation in Radar Reflectivity Slopes in the Lower Troposphere at the West Coast of India During Pre-Monsoon and Monsoon Seasons Using Ground-Based C-Band Radar
by
Shailendra Kumar
Meteorology 2026, 5(2), 15; https://doi.org/10.3390/meteorology5020015 - 12 Jun 2026
Abstract
►▼
Show Figures
The present study investigates the statistical distribution of radar reflectivity slopes [S-Ze] in the lower troposphere along the west coast of India using a C-band radar during the pre-monsoon and monsoon seasons in 2024. The study period spans a range of
[...] Read more.
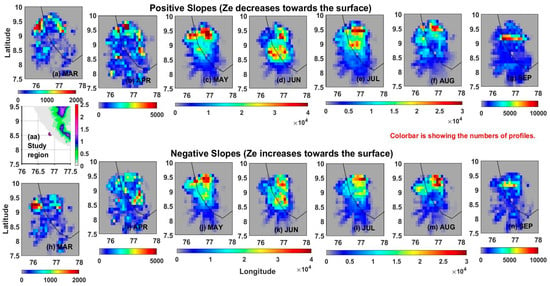
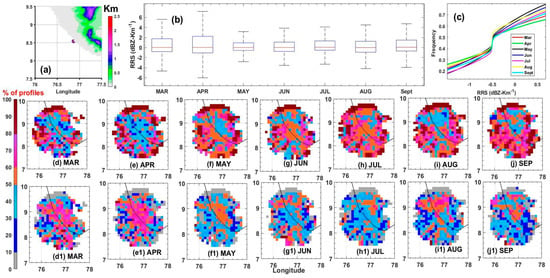
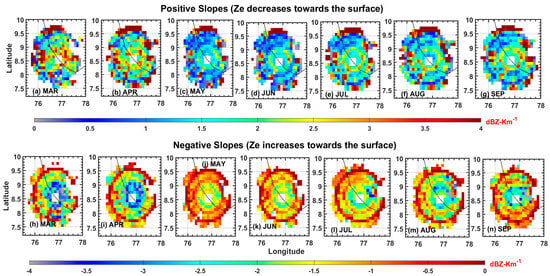
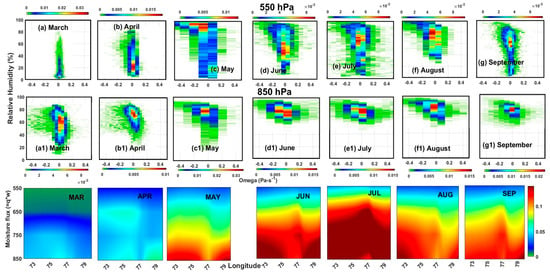
The present study investigates the statistical distribution of radar reflectivity slopes [S-Ze] in the lower troposphere along the west coast of India using a C-band radar during the pre-monsoon and monsoon seasons in 2024. The study period spans a range of meteorological conditions, from a drier atmosphere during pre-monsoon months to a moist atmosphere during the monsoon months, with varying updraughts and downdraughts. To investigate the S-Ze, we calculated the difference in Ze between 4 km and 2 km altitudes in the lower troposphere. The S-Ze could be either positive or negative, where, in a positive [negative] S-Ze, the Ze decreases [increases] towards the surface. The monthly variations in S-Ze from the pre-monsoon to monsoon months are observed in the lower troposphere and are higher in monsoon months compared to pre-monsoon months, which are too near the coast. The land–ocean contrasts of the vertical profiles contributing to +ve and −ve S-Ze are lower compared to north–south gradients and higher in monsoon months. The average S-Ze shows the highest +ve and −ve S-Ze magnitude near the coast among all the months. The highest magnitude in S-Ze is observed in March and April and is associated with the lower and higher numbers of vertical Ze profiles. The increase or decrease in hydrometeor size is less during the monsoon months (June, July, August, and September) compared to pre-monsoon months, where the March–April months have the highest increase or decrease in the hydrometeor’s size in the lower troposphere. The variations in the S-Ze are the combined effect of the atmospheric, thermodynamic (relative humidity (RH) and moisture flux), and dynamic conditions (zonal, meridional, and vertical velocity). Strong updraughts that carry RH to higher altitudes make the lower atmosphere drier and contribute to a +ve S-Ze; Ze tends to decrease in the lower troposphere. However, a weaker updraught or a moderate downdraught with sufficient RH provides sufficient time for hydrometeors to grow and contributes to −ve S-Ze, and Ze tends to increase in the lower troposphere. For example, in March and April, the atmosphere is dry, and we observe the largest decrease in hydrometeors near the coastal boundary. However, we also see significantly higher negative radar reflectivity slopes, and weak downdraughts provide enough time for hydrometeors to grow. In June and July, there are strong updraughts (downdraughts) with high (low) RH, making the atmosphere more conducive to a decreasing tendency in Ze and contributing to a higher fraction of +ve S-Ze. The results presented here would be an extension of the study from the satellite-based observations, revealing the extension of climatology for the inclusion of stratiform precipitation.
Full article

Figure 1
Open AccessArticle
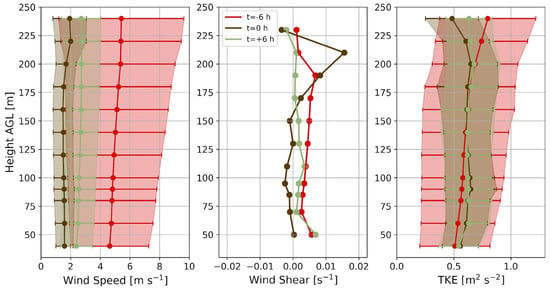
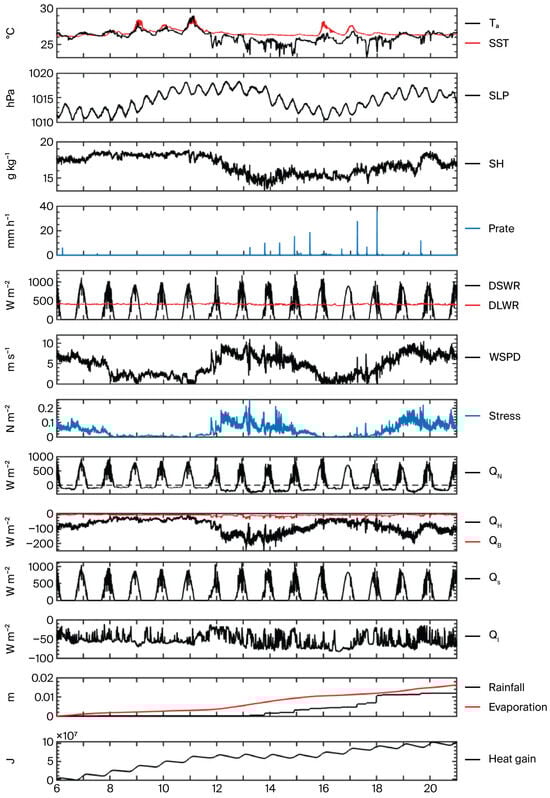
Estimates of Ocean–Atmosphere Heat Fluxes in the Tropical Atlantic from Different Bulk Parameterization Schemes Used Operationally in Brazil
by
Letícia Stachelski, Ronald Buss de Souza, Gilberto Fisch, Regiane Moura, Breno Tramontini Steffen and Luciano Ponzi Pezzi
Meteorology 2026, 5(2), 14; https://doi.org/10.3390/meteorology5020014 - 6 Jun 2026
Abstract
The ocean–atmosphere turbulent heat exchange plays a critical role in the energy and moisture budgets of the Tropical Atlantic Ocean (TAO) and in weather and climate forecasts. However, its estimation strongly depends on the choice of bulk parameterization, as direct in situ measurements
[...] Read more.
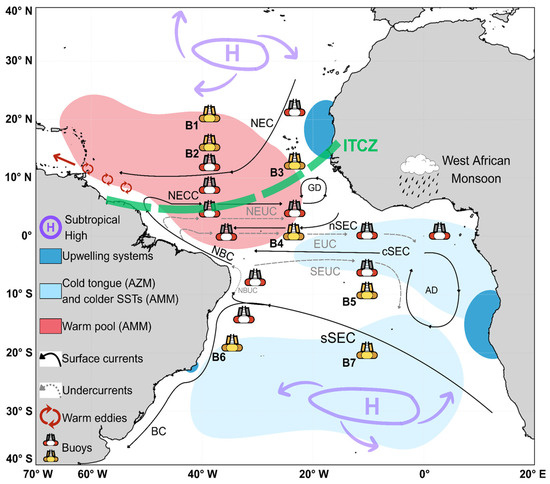
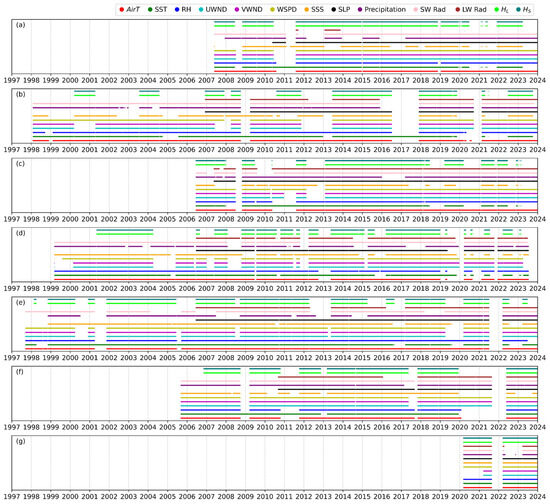
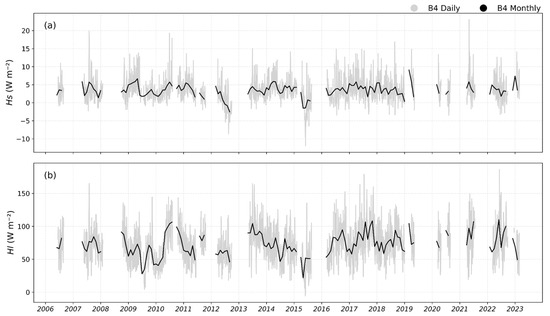
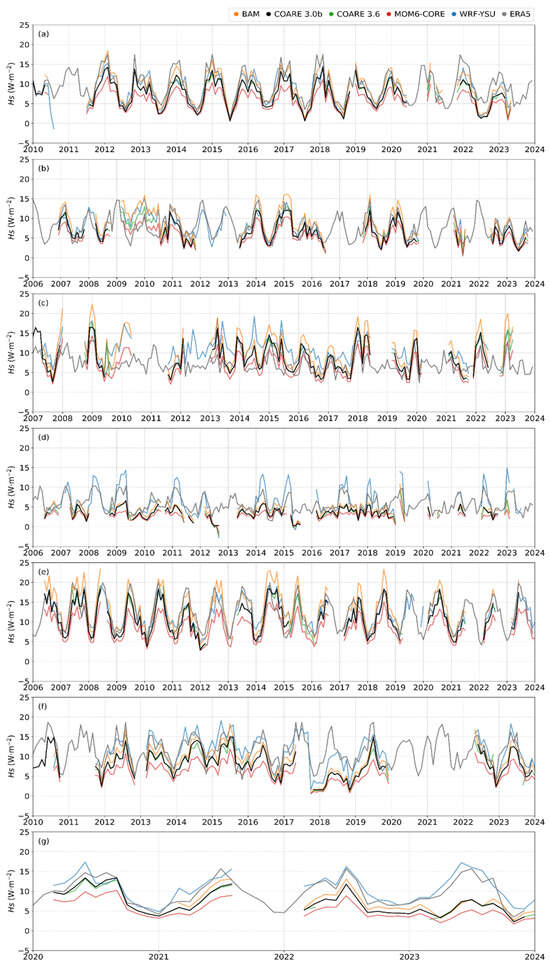
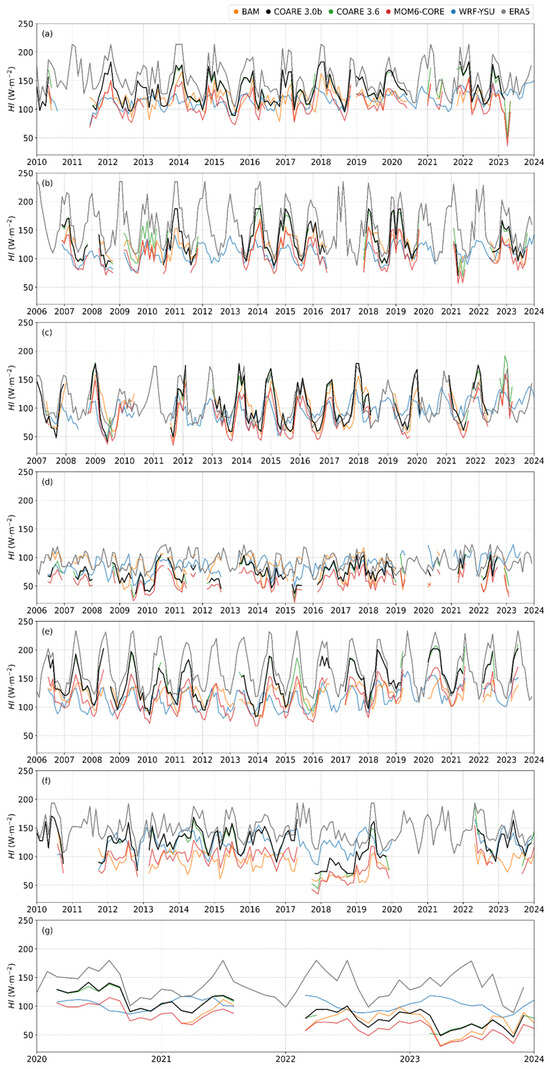
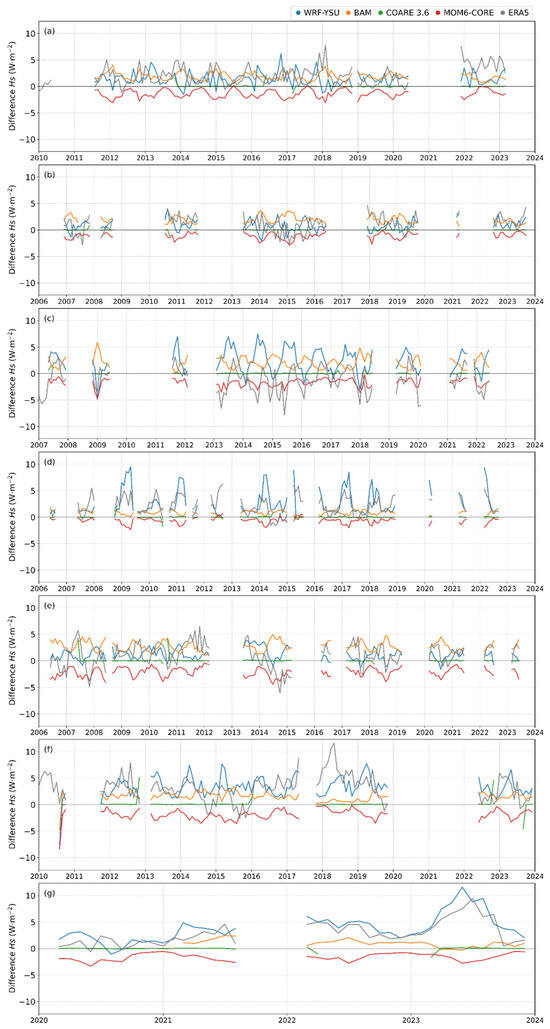
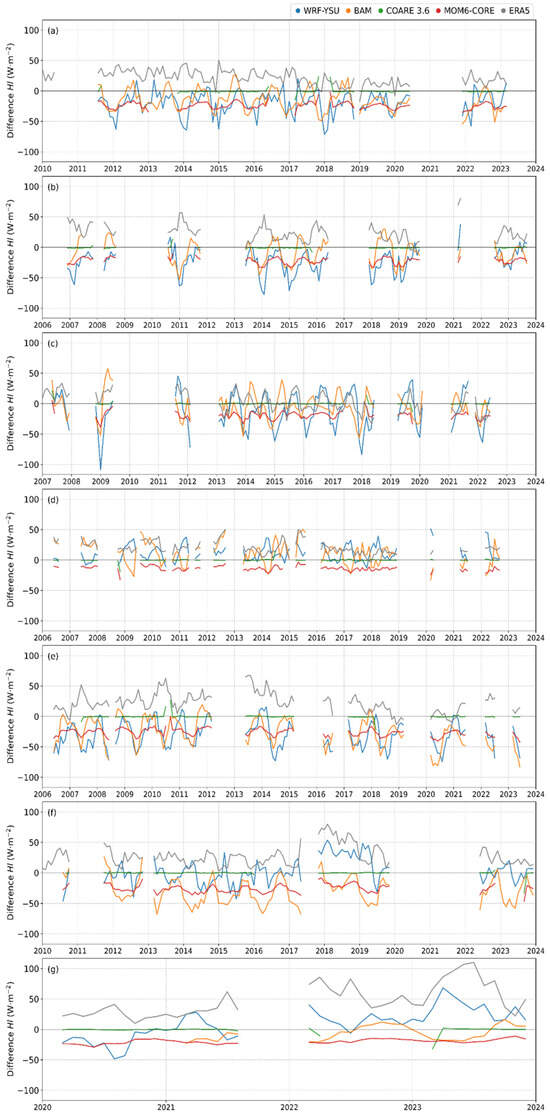
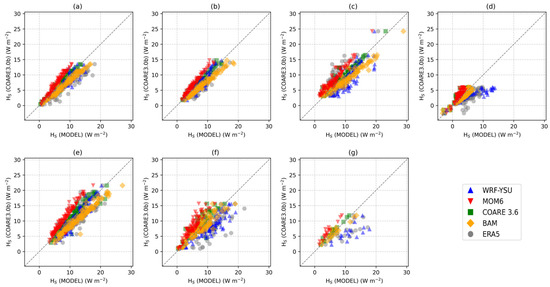
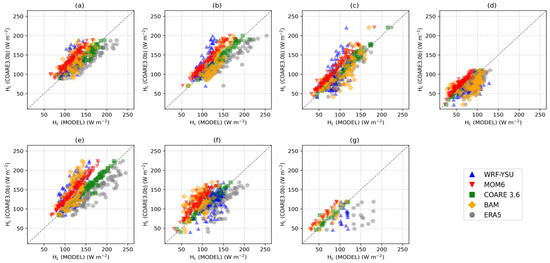
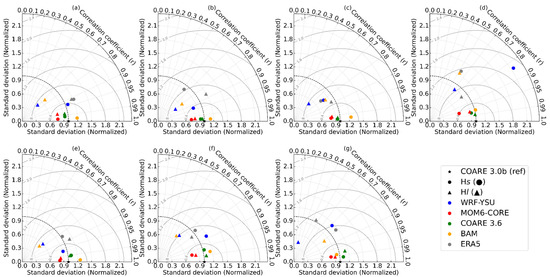
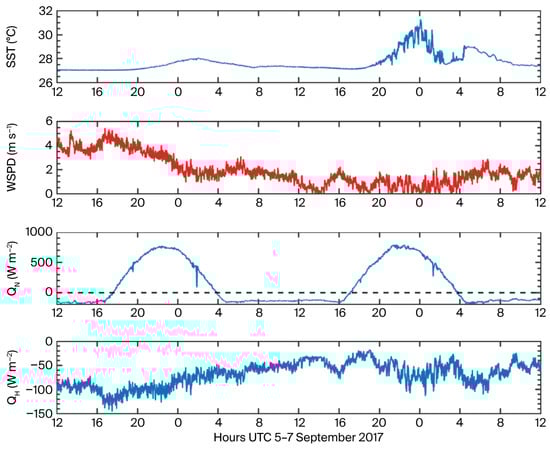
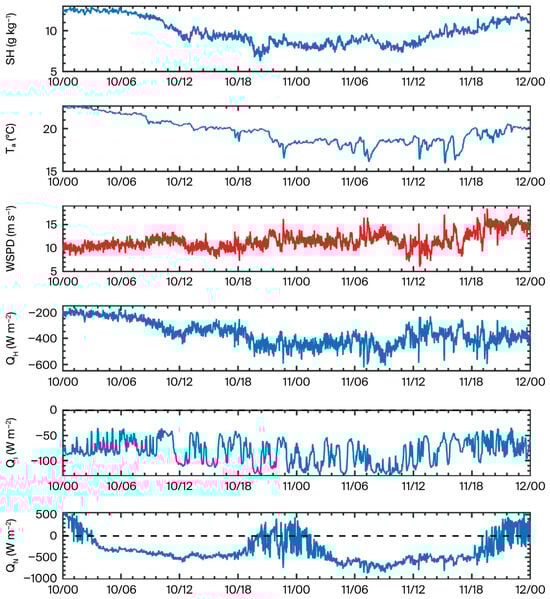
The ocean–atmosphere turbulent heat exchange plays a critical role in the energy and moisture budgets of the Tropical Atlantic Ocean (TAO) and in weather and climate forecasts. However, its estimation strongly depends on the choice of bulk parameterization, as direct in situ measurements are sparse. This study evaluates sensible (Hs) and latent (Hl) heat fluxes derived from three bulk parameterization schemes used operationally in models at the Brazilian Center for Weather Forecast and Climate Studies (CPTEC) of the National Institute for Space Research (INPE), Brazil: the Brazilian Atmospheric Model (BAM), the Modular Ocean Model version 6 (MOM6), and the Weather Research and Forecasting (WRF) model. Using daily in situ observations from seven Prediction and Research Moored Array in the Tropical Atlantic (PIRATA) buoys across the TAO during 1997–2023, we computed monthly mean fluxes and compared them against the Coupled Ocean–atmosphere Response Experiment (COARE) algorithm version 3.0b (COARE 3.0b) reference. COARE version 3.6 (COARE 3.6) and European Centre for Medium-Range Weather Forecast (ECMWF) Reanalysis 5th generation (ERA5) data were included as additional benchmarks. All offline schemes were forced with identical buoy data, isolating differences in internal physical assumptions. Hl is approximately one order of magnitude larger than Hs across all sites, and inter-scheme differences are substantially larger for Hl (±50 W∙m−2) than for Hs (±5 W∙m−2). All schemes reproduce the seasonal cycle linked to the Intertropical Convergence Zone (ITCZ) migration and trade-wind variability, with correlations generally exceeding 0.8 (p < 0.001) for most buoys. However, systematic magnitude biases remain. The Coordinated Ocean Research Experiments (CORE) bulk formulation implemented in MOM6 (MOM6-CORE) shows high temporal correlation (often r ≈ 1.0) but a persistent negative bias for both Hs and Hl (e.g., B1 Hl bias = −24.0 W∙m−2), indicating weaker turbulent exchange relative to COARE 3.0b. BAM overestimates Hs (by 1–3 W∙m−2) and underestimates Hl at most northern and southern sites, while the parametrization of the Yonsei University (YSU) implemented in the WRF model (WRF-YSU) amplifies Hs variability intermittently, particularly at the equator (B4). As expected, COARE 3.6 remains the closest to the reference (differences < 1 W∙m−2 for Hs and <7 W∙m−2 for Hl; r ≈ 0.99). ERA5 captures temporal variability well (r ≈ 0.7–0.9) but systematically overestimates Hl (positive bias up to +47.6 W∙m−2 at B7), implying stronger evaporative cooling. Buoy-specific regimes modulate skill. The choice of bulk formulation thus remains a first-order source of uncertainty in turbulent heat flux estimates over the TAO, with direct implications for mixed-layer heat budgets, SST evolution, and coupled ocean–atmosphere variability. MOM6-CORE provides the most consistent performance relative to the COARE reference and emerges as the most robust option for operational applications at CPTEC/INPE. The findings also provide guidance for improving the representation of ocean–atmosphere turbulent exchanges in MONAN (Model for Ocean-Land-Atmosphere Prediction), the new Brazilian Earth System Model under development for weather and climate prediction.
Full article
(This article belongs to the Special Issue Physical Interactions Between Ocean-Atmosphere Boundary Layers from Turbulent to Climate Scales)
►▼
Show Figures

Figure 1
Open AccessArticle
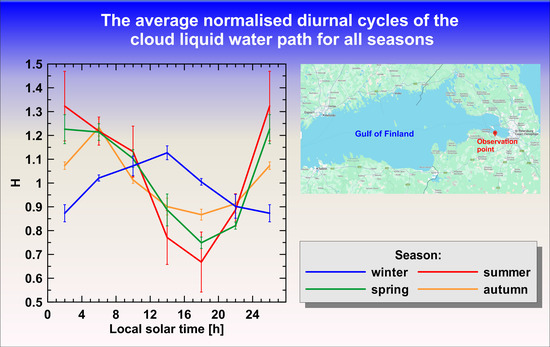
Estimates of the Diurnal Cycle of a Cloud Liquid Water Path near the Gulf of Finland Based on Long-Term Ground-Based Remote Microwave Measurements
by
Vladimir S. Kostsov, Dmitry V. Ionov and Maria V. Makarova
Meteorology 2026, 5(2), 13; https://doi.org/10.3390/meteorology5020013 - 31 May 2026
Abstract
►▼
Show Figures
Continuous ground-based microwave (MW) measurements with the RPG-HATPRO radiometer at the observational site of St. Petersburg State University located near the coastline of the Gulf of Finland have provided a large amount of data on the cloud liquid water path (LWP) of non-raining
[...] Read more.
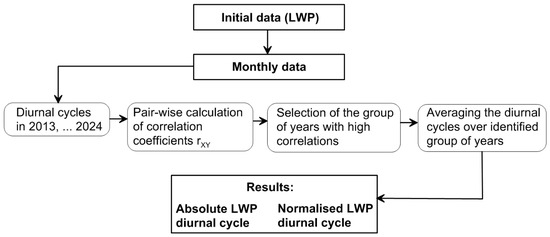
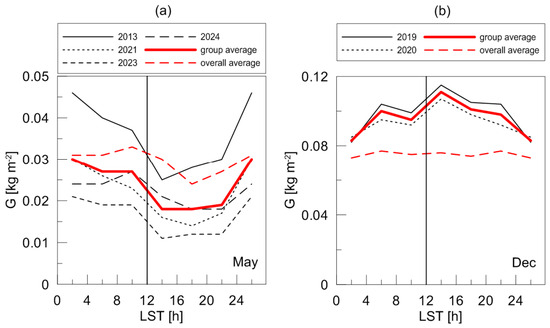
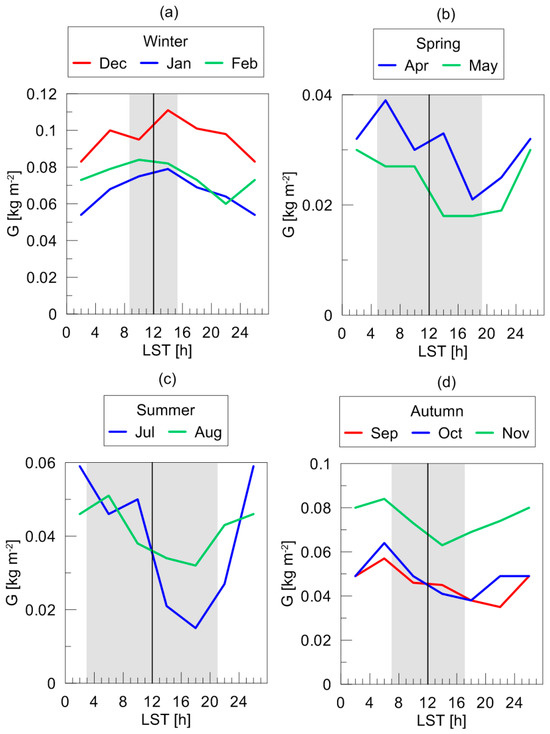
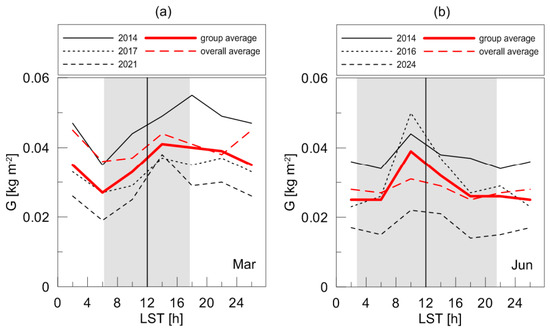
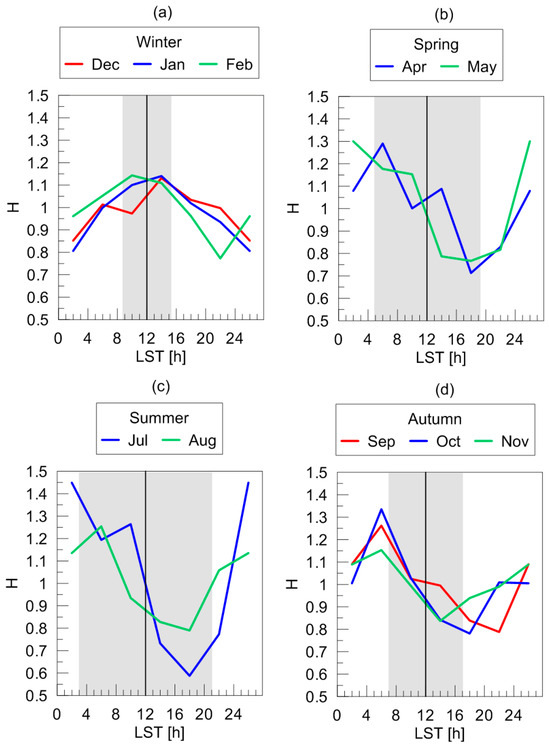
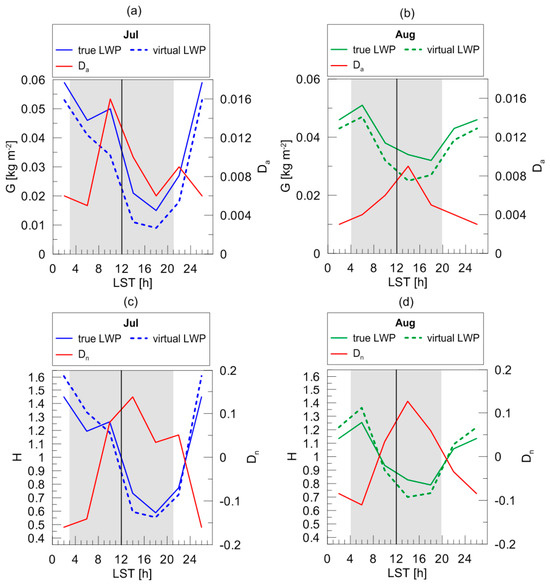
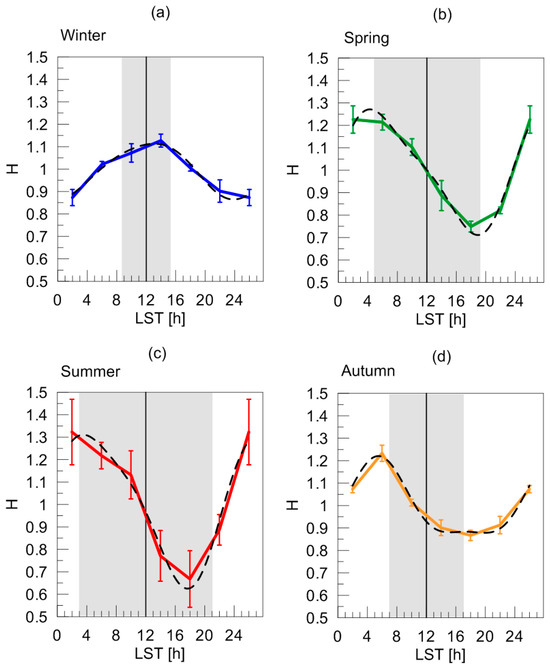
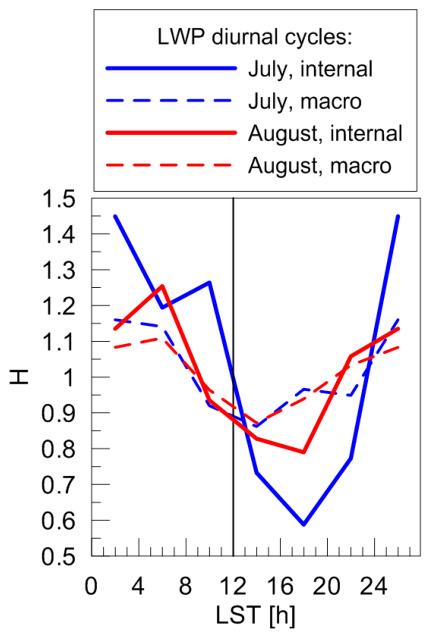
Continuous ground-based microwave (MW) measurements with the RPG-HATPRO radiometer at the observational site of St. Petersburg State University located near the coastline of the Gulf of Finland have provided a large amount of data on the cloud liquid water path (LWP) of non-raining clouds. The 12-year (2013–2024) time series of the LWP values has been analysed and the diurnal evolution of the LWP has been assessed for each month of the year. The calculations have been made for the LWP in the range 0–0.4 kg m−2 using different sampling subsets that include the so-called true and virtual LWP values. True LWP values correspond to measurements with clouds in the field of view of the radiometer, whereas virtual LWP values correspond to measurements with clouds or with clear sky in the field of view of the instrument and, therefore, virtual values can be zero (in clear sky cases). Based on the correlation analysis, time periods characterised by similar meteorological conditions and suitable for assessing the daily dynamics of LWP were identified. The LWP diurnal cycles in December, January, and February demonstrated a similar pattern with a maximum around local astronomical noon and with a minimum around midnight. For the remaining months except March and June, the maximum LWP is observed in the early morning and the minimum is observed in the afternoon. This cycle is characteristic of marine stratocumulus clouds. The diurnal cycles of the LWP in March and June, peaking in the afternoon and morning, respectively, are typical of convective continental clouds. Thus, the LWP diurnal cycle in the coastal zone of the Gulf of Finland may have characteristics of both marine and continental clouds. Parameters of the two-mode sinusoidal approximation of the diurnal cycle of the LWP in different seasons are presented.
Full article

Graphical abstract
Open AccessArticle
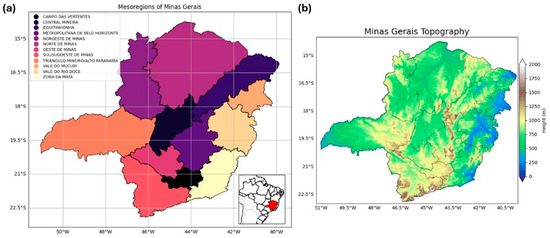
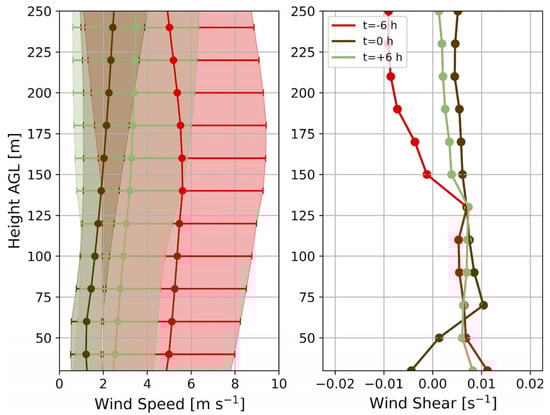
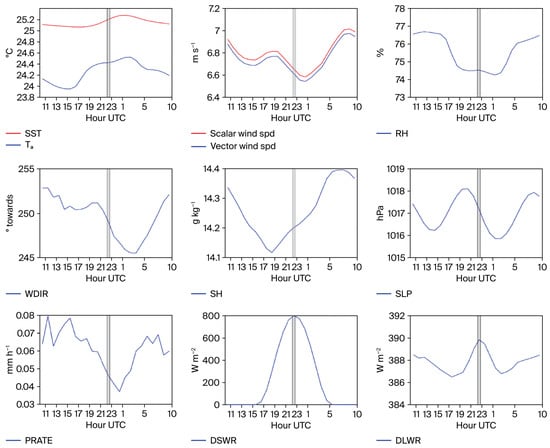
Use of Artificial Intelligence for Spatial Seasonal Precipitation Forecasting in Minas Gerais, Brazil
by
Matheus José Gomes, Juliana Aparecida Anochi and Marília Harumi Shimizu
Meteorology 2026, 5(2), 12; https://doi.org/10.3390/meteorology5020012 - 5 May 2026
Abstract
►▼
Show Figures
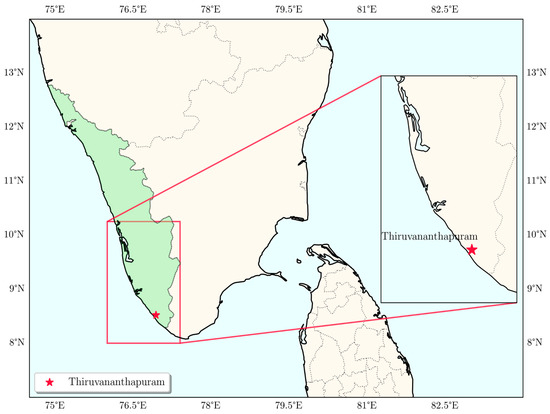
Seasonal precipitation forecasting remains challenging in regions with complex topography and high climatic variability, such as the state of Minas Gerais, Brazil. This study evaluates the performance of an Artificial Intelligence (AI)-based ensemble approach for seasonal precipitation prediction. The AI-based predictions are compared
[...] Read more.
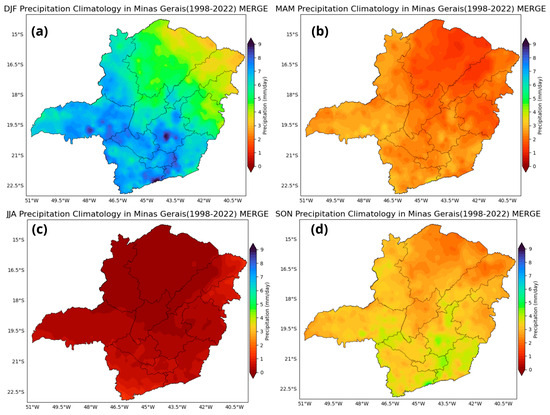
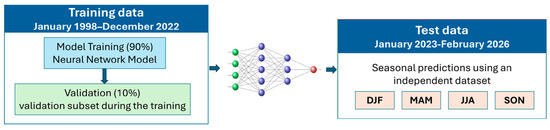
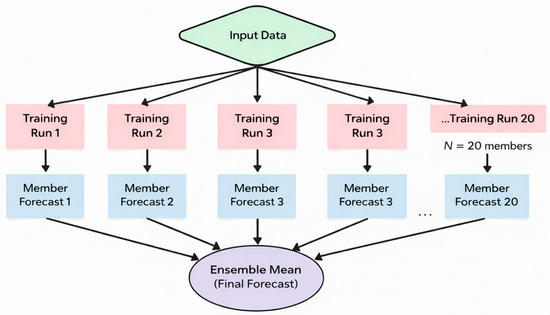
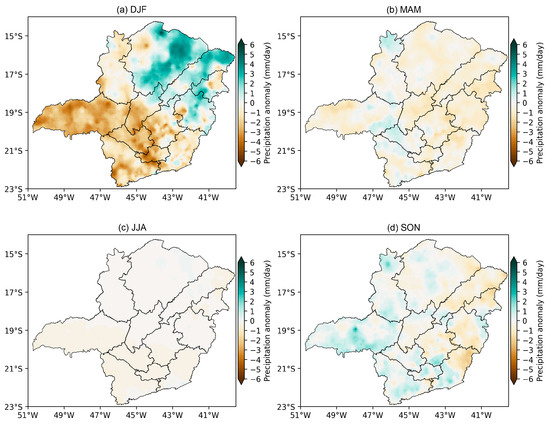
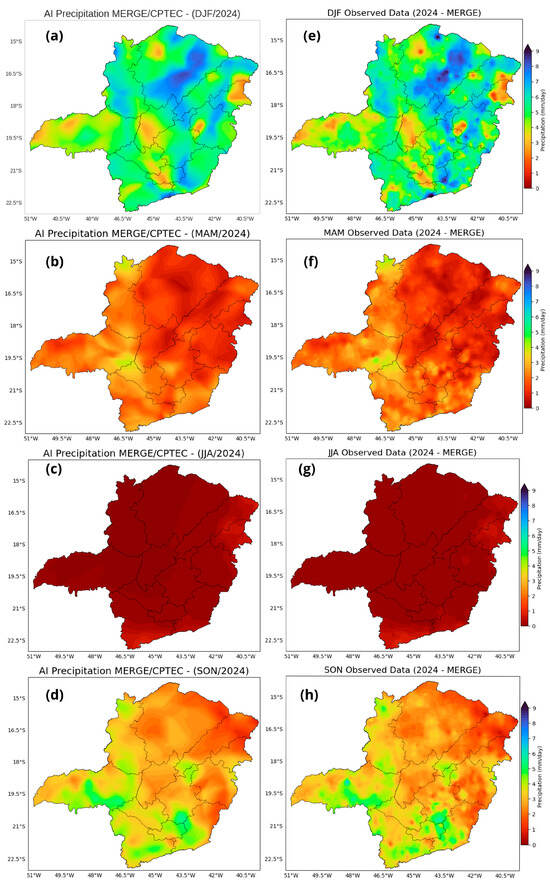
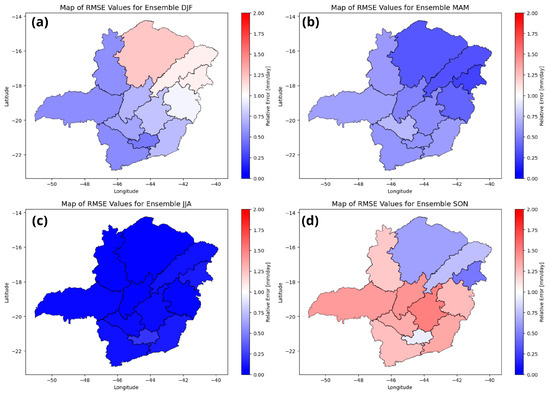
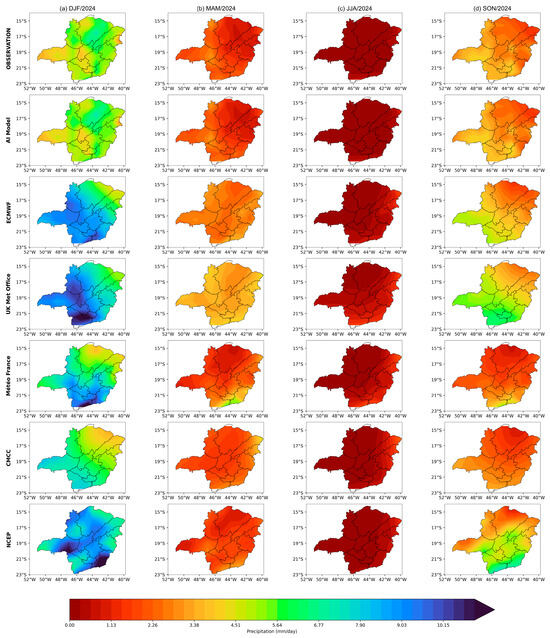
Seasonal precipitation forecasting remains challenging in regions with complex topography and high climatic variability, such as the state of Minas Gerais, Brazil. This study evaluates the performance of an Artificial Intelligence (AI)-based ensemble approach for seasonal precipitation prediction. The AI-based predictions are compared against outputs from multiple dynamical models, including those from the North American Multi-Model Ensemble (NMME) and the Copernicus Climate Data Store (CDS). The AI model was trained using high-resolution precipitation data from the Center for Weather Forecast and Climate Studies (CPTEC) dataset – MERGE-CPTEC – and subsequently applied to generate regional-scale seasonal forecasts. Model performance was assessed using Root Mean Square Error (RMSE), Mean Squared Error (MSE), and Pearson Correlation (r). The results indicate that the AI-based forecasts achieve competitive performance relative to dynamical models across all seasons, exhibiting lower error metrics and improved representation of spatial precipitation patterns. The highest forecast skill was observed during winter (June-July-August, JJA), when atmospheric conditions are more stable, and precipitation variability is low. During the wet seasons (December-January-February, DJF and September-October-November, SON), despite increased convective activity and spatial heterogeneity, the AI model maintained greater spatial coherence and closer agreement with observations than the dynamical forecasts. Overall, the findings demonstrate that AI-based approaches represent a promising and computationally efficient complementary tool for regional-scale seasonal precipitation forecasting, particularly in climatically heterogeneous regions.
Full article

Figure 1
Open AccessArticle
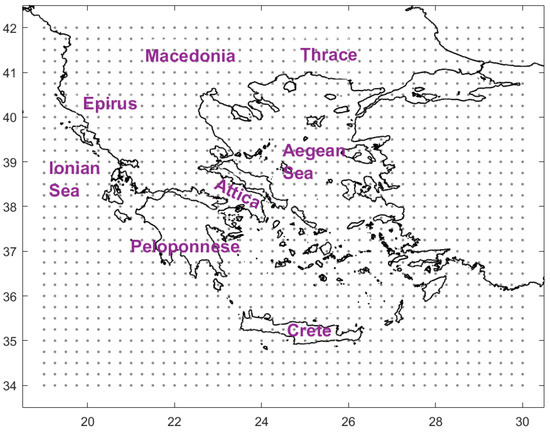
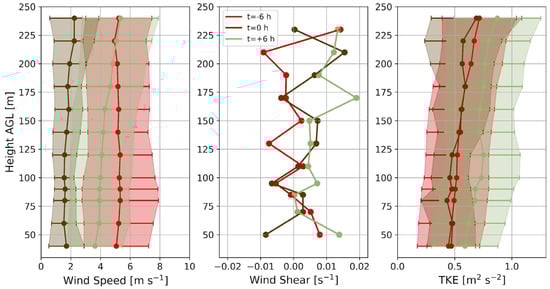
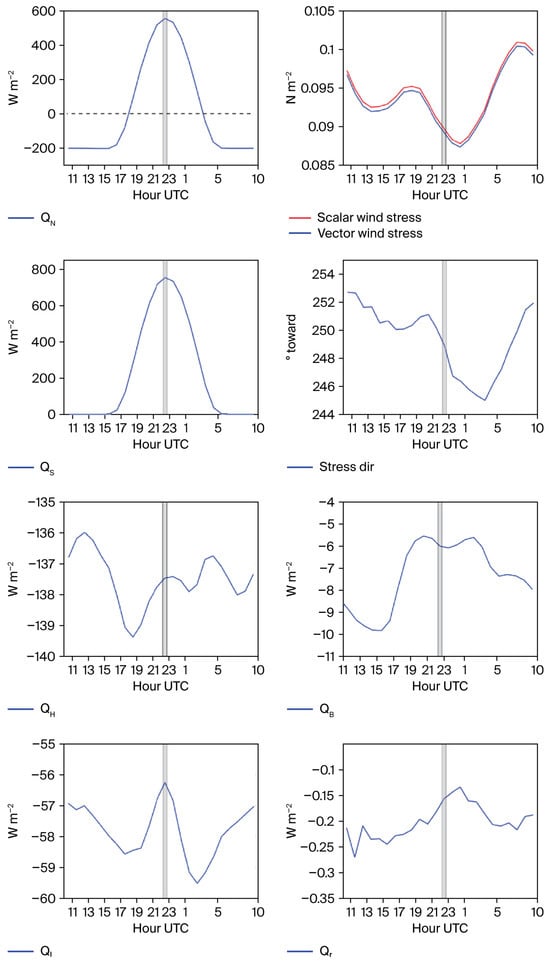
Beyond Mean Warming: Changes in the Distribution of 2 m Temperatures and Extremes in Greece over the Last 80 Years
by
Aikaterini Lampraki and Nikolaos A. Bakas
Meteorology 2026, 5(2), 11; https://doi.org/10.3390/meteorology5020011 - 4 May 2026
Abstract
►▼
Show Figures
The response of temperature extremes to recent warming at the local scale remains uncertain because changes in mean temperature may be accompanied by changes in the shape of the temperature distribution. While higher mean temperatures generally lead to more frequent heat waves and
[...] Read more.
The response of temperature extremes to recent warming at the local scale remains uncertain because changes in mean temperature may be accompanied by changes in the shape of the temperature distribution. While higher mean temperatures generally lead to more frequent heat waves and fewer cold events, variations in higher-order statistical moments can either amplify or moderate these effects. This study examines how the probability distribution of 2 m temperature has evolved during the last 80 years in Greece using the ERA-5 reanalysis dataset. The evolution of the first four statistical moments (mean, standard deviation, skewness and kurtosis) and of the 5th and 95th percentiles of daily mean temperature is calculated by splitting the time series into eight decades, with each decade representing a separate climatology. A clear increase in mean temperature is observed across Greece. However, trends in the higher-order moments are more complex: the standard deviation and skewness exhibit positive and negative trends that depend on the region and the season, while kurtosis trends are weaker with a few regional exceptions. These changes alter the response of temperature extremes to warming, resulting in non-uniform shifts of the 5th and 95th percentiles. In mountainous regions, extreme cold events during winter and autumn have decreased more strongly than expected from mean warming alone, while in marine regions extreme warm events during summer and autumn have increased beyond what would be expected by a shift in the mean. In other areas, changes in the distribution shape lead to weaker extremes than those predicted by mean warming alone. These results highlight the role that changes in temperature variability have in modulating the evolution of temperature extremes under climate warming.
Full article

Figure 1
Open AccessArticle
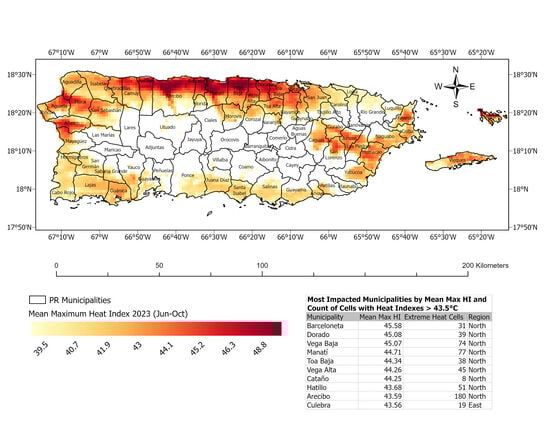
Spatial Analysis of Extreme Heat in Puerto Rico
by
José J. Hernández Ayala, Rafael Méndez-Tejeda, Kyara V. Virella Carrión and Jesús A. Hernández Londoño
Meteorology 2026, 5(2), 10; https://doi.org/10.3390/meteorology5020010 - 27 Apr 2026
Abstract
►▼
Show Figures
Puerto Rico has experienced increasingly frequent and intense extreme heat conditions in recent years, with the 2023–2024 warm seasons standing out for prolonged periods of dangerously high heat index values and widespread spatial exposure. These conditions are particularly concerning in tropical island environments,
[...] Read more.
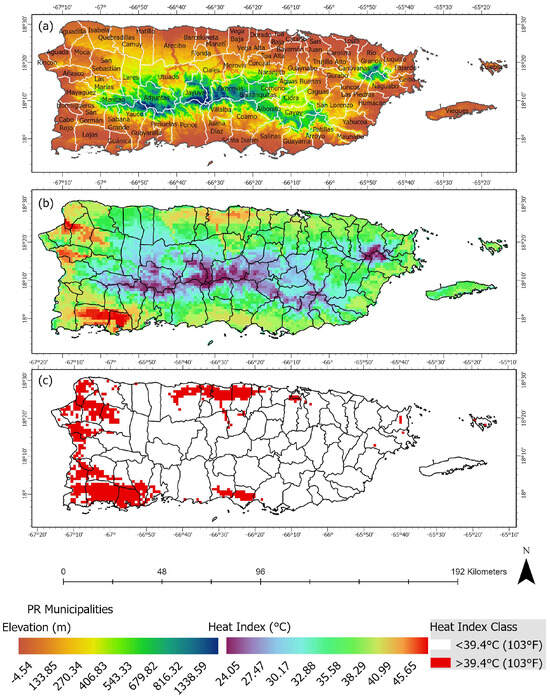
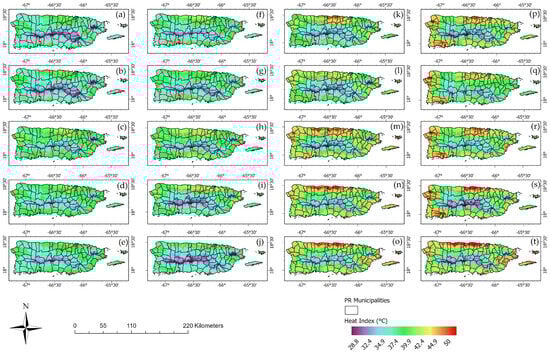
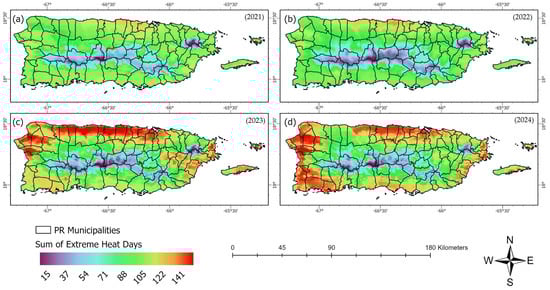
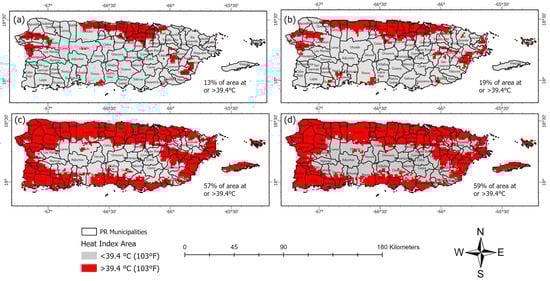
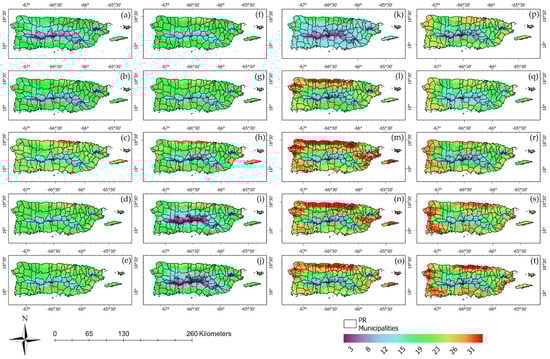
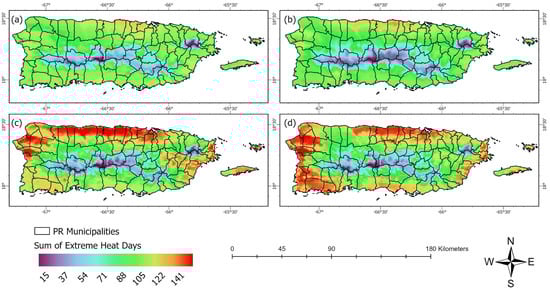
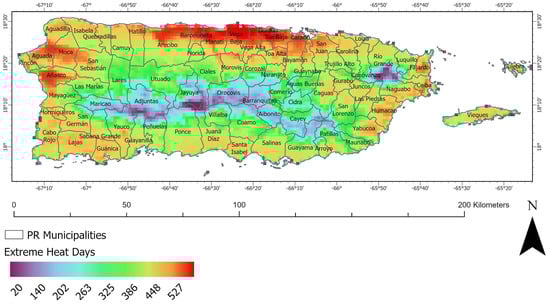
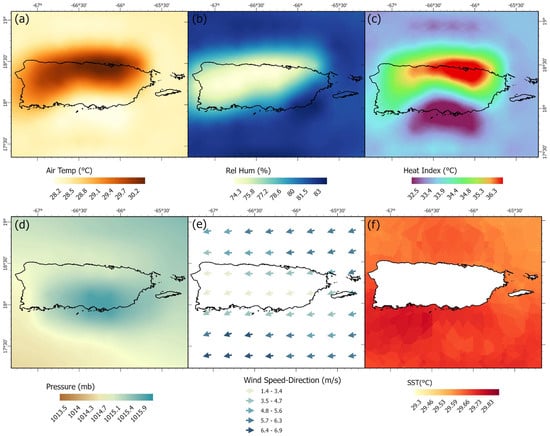
Puerto Rico has experienced increasingly frequent and intense extreme heat conditions in recent years, with the 2023–2024 warm seasons standing out for prolonged periods of dangerously high heat index values and widespread spatial exposure. These conditions are particularly concerning in tropical island environments, where high humidity limits physiological cooling and amplifies heat-related health risks. The main objective of this study is to identify and characterize extreme heat zones and events across Puerto Rico using NOAA-modeled heat index (apparent temperature) data, as well as to examine their spatial and temporal variability during the 2021–2024 period. Hourly modeled apparent temperature data between 2 and 4 pm, representing the warmest time of day, were analyzed for each day from June through October. Mean maximum and maximum heat index surfaces were generated for each month and warm season, and extreme heat zones were identified using the 103 °F (39.4 °C) danger threshold. Results show a persistent concentration of extreme heat in low-elevation coastal regions, particularly across the northern coastal plains from San Juan to Hatillo, with floodplain areas in Arecibo and Manatí exhibiting the highest and most consistent exposure. August was identified as the month with the highest mean maximum heat index across all study years, followed by September. The warm seasons of 2023 and 2024 exhibited the highest magnitudes and spatial extents of extreme heat, with some regions experiencing apparent temperatures exceeding 110 °F and up to 141 extreme heat days during peak afternoon hours. The findings indicate a transition from localized heat hotspots to widespread and sustained extreme heat exposure across Puerto Rico’s coastal regions. This study provides an island-scale assessment of extreme heat patterns with direct implications for public health, infrastructure planning, and heat-risk management in a warming tropical climate.
Full article

Graphical abstract
Open AccessArticle
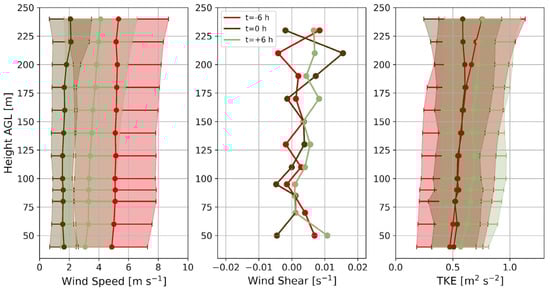
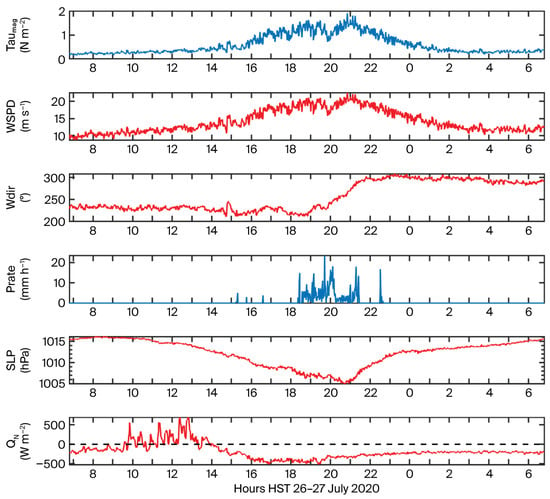
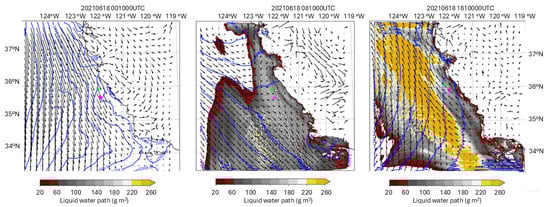
Lidar Measurements and High-Resolution Mesoscale Modeling of Coastally Trapped Disturbances off the Coast of California
by
Timothy W. Juliano, Sue Ellen Haupt, Eric A. Hendricks, Branko Kosović and Raghavendra Krishnamurthy
Meteorology 2026, 5(2), 9; https://doi.org/10.3390/meteorology5020009 - 25 Apr 2026
Abstract
►▼
Show Figures
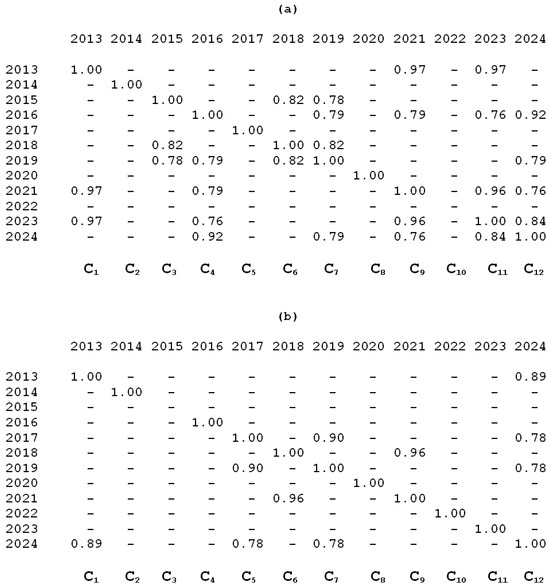
Coastally Trapped disturbances (CTDs) are shifts in wind direction from the pre-dominant direction to equatorward to poleward for a period of time. These CTDs occur during the warm season off the California coast and impact coastal weather conditions and planned offshore wind plants.
[...] Read more.
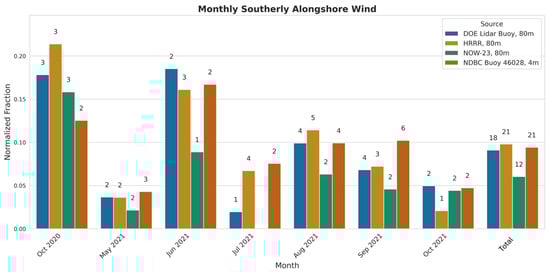
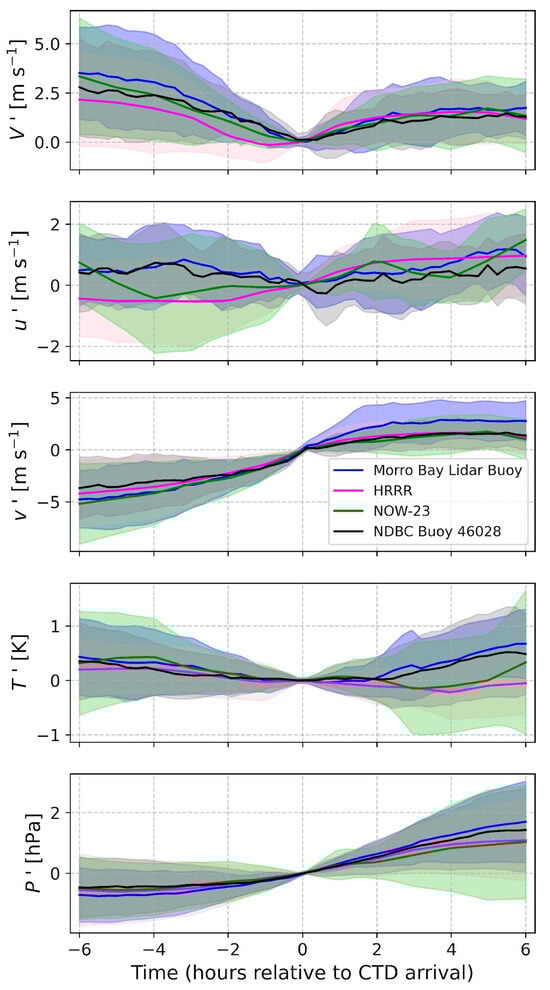
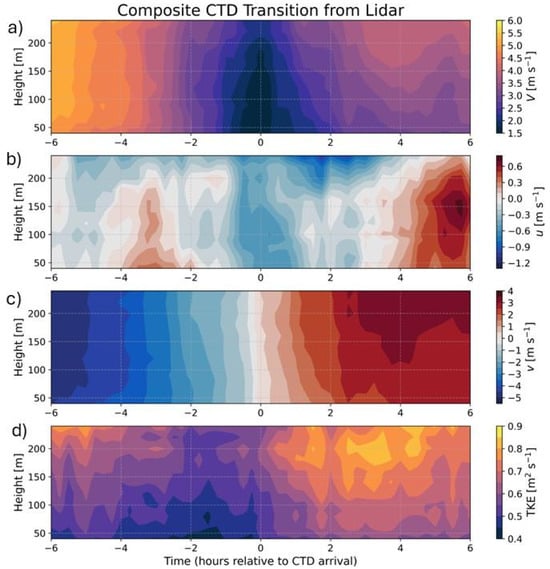
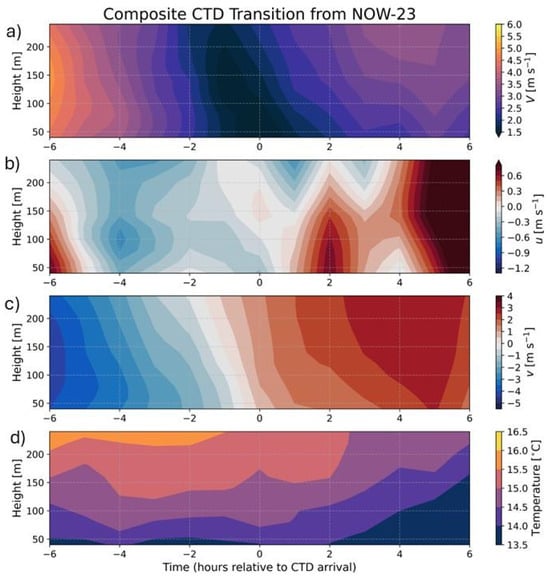
Coastally Trapped disturbances (CTDs) are shifts in wind direction from the pre-dominant direction to equatorward to poleward for a period of time. These CTDs occur during the warm season off the California coast and impact coastal weather conditions and planned offshore wind plants. This study assesses the characteristics of CTD events as observed by lidar and other offshore buoys, then evaluates the ability of modeling systems to capture the correct characteristics, leveraging model output from the High-Resolution Rapid Refresh (HRRR) operational modeling system and the NOW-23 (National Offshore Wind) model dataset. CTDs were analyzed for October 2020 and May through to October of 2021, identifying 18 unique CTD events, confirmed by a nearby National Data Buoy Center (NDBC) buoy. The HRRR model captured most of these events, but the NOW-23 model output contained only 12 events. Composites of the wind, temperature, and pressure perturbations pre-, during, and post-event demonstrated the diminishment in wind speed, particularly for the alongshore component. Although the NOW-23 model captured the alongshore wind component and pressure perturbations well, the cross-shore wind component and temperature perturbations varied substantially. When the turbulent kinetic energy deviation and wind shear was positive across all levels pre-event, the NOW-23 modeling system was less likely to capture the CTD event. In contrast, the events that were captured by the model tended to have negative wind shear aloft pre-event.
Full article

Figure 1
Open AccessArticle
Impact of the Atlantic Meridional Overturning Circulation on Global Precipitation in CMIP5 Model Projections
by
Mohima Sultana Mimi and Md Jahangir Alam
Meteorology 2026, 5(2), 8; https://doi.org/10.3390/meteorology5020008 - 1 Apr 2026
Cited by 1
Abstract
►▼
Show Figures
The Atlantic Meridional Overturning Circulation (AMOC) is a key regulator of the global climate system, yet its influence on future precipitation remains uncertain because climate models project widely varying degrees of weakening. Here, we examine the relationship between AMOC decline and global precipitation
[...] Read more.
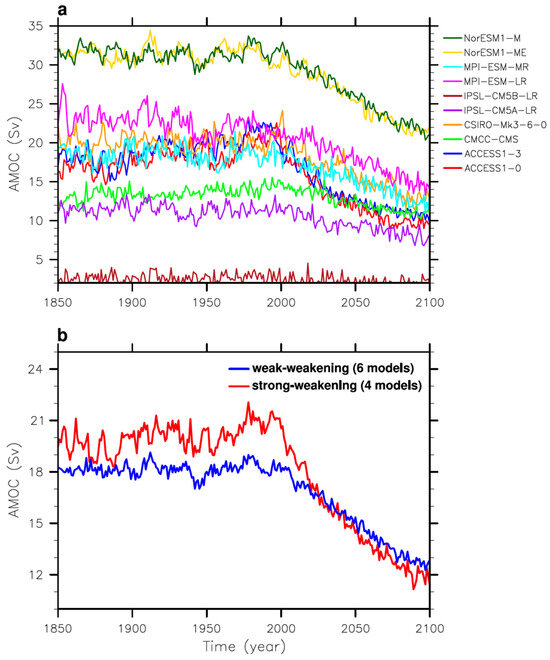
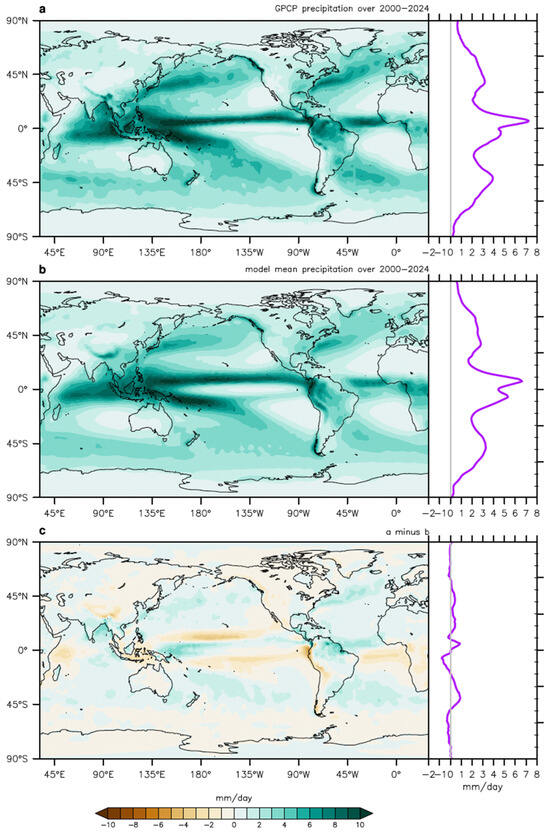
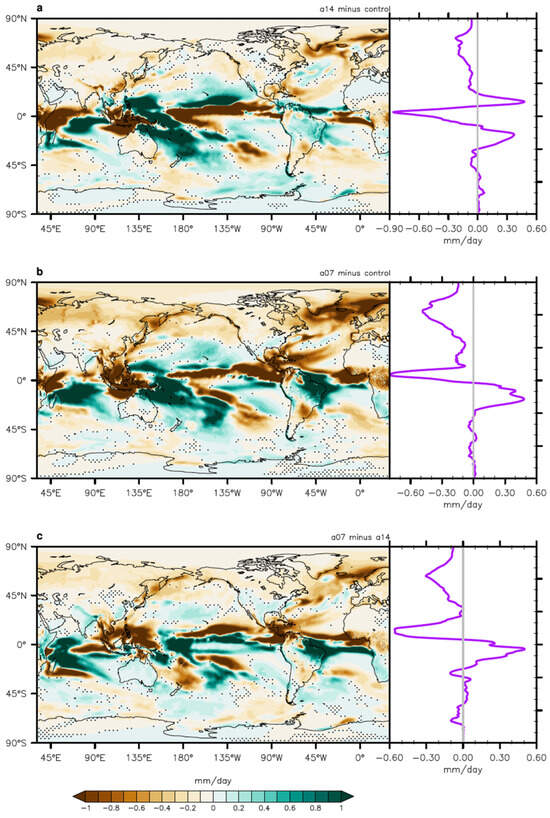
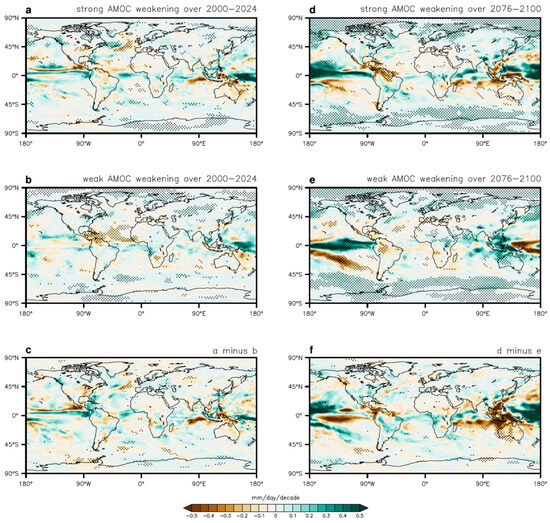
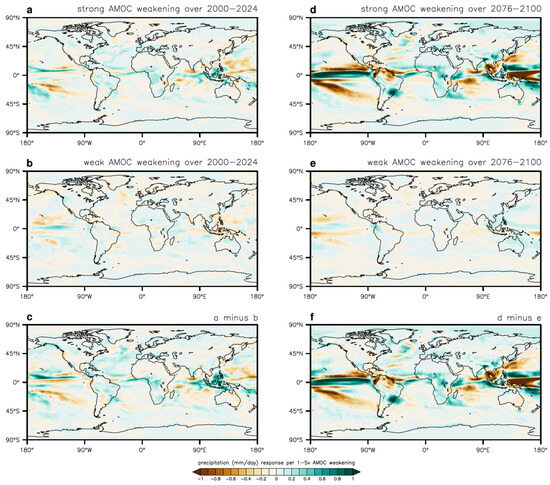
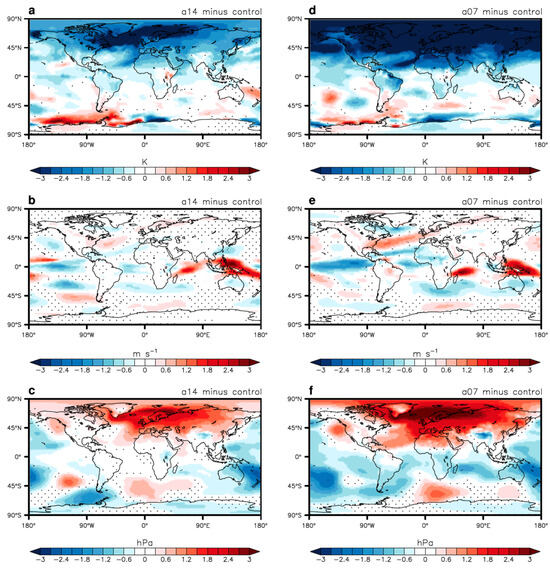
The Atlantic Meridional Overturning Circulation (AMOC) is a key regulator of the global climate system, yet its influence on future precipitation remains uncertain because climate models project widely varying degrees of weakening. Here, we examine the relationship between AMOC decline and global precipitation using historical and RCP8.5 simulations from ten CMIP5 models. Models are grouped by the magnitude of projected AMOC weakening, and an intermodel regression framework is used to quantify the sensitivity of precipitation to changes in overturning strength. The CMIP5 multi-model mean reproduces observed large-scale precipitation patterns. While early-century responses are modest, stronger AMOC weakening by the late century is associated with pronounced drying across the tropical North Atlantic and enhanced rainfall over the Indo-Pacific. Regression analysis indicates that precipitation within the Intertropical Convergence Zone decreases by ~2.3% per 1 Sv reduction in AMOC strength. Sensitivity experiments further show that reduced Atlantic heat transport cools the North Atlantic and shifts tropical rainfall southward. These results identify AMOC variability as an important source of uncertainty in projections of future global hydroclimate.
Full article

Figure 1

Open AccessArticle
Observed Trends in Aviation-Related Weather Hazards at Major Italian Airports Under Changing Climate Conditions
by
Jessica Cagnoni, Patrizio Ripesi, Stefano Amendola, Edoardo Bucchignani and Myriam Montesarchio
Meteorology 2026, 5(1), 7; https://doi.org/10.3390/meteorology5010007 - 20 Mar 2026
Abstract
►▼
Show Figures
Climate change (CC) is widely recognized as a major human concern, affecting society across all aspects and activities. Among various economic sectors, aviation is one of the most affected due to its exposure to adverse weather events. Consequently, adaptation and mitigation actions are
[...] Read more.
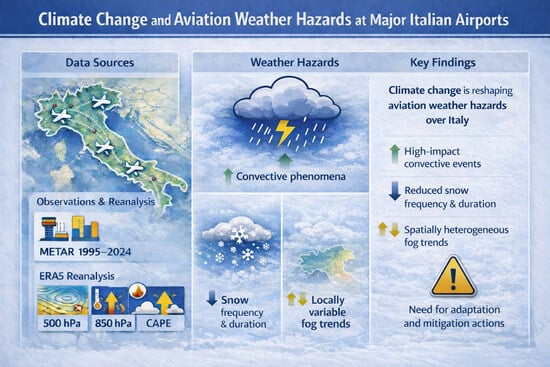
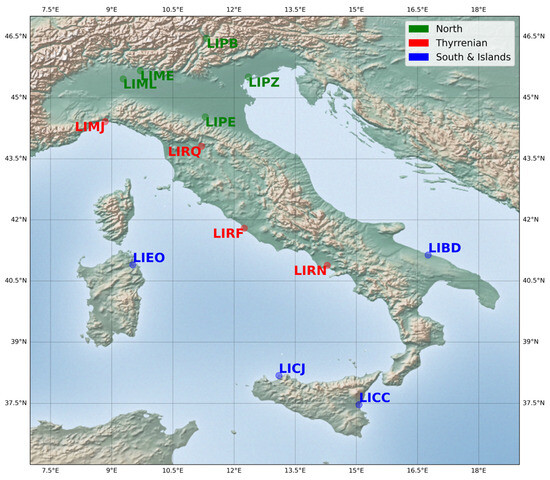
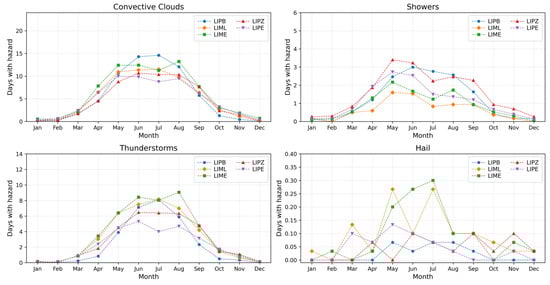
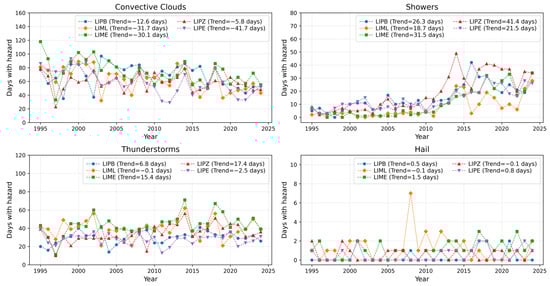
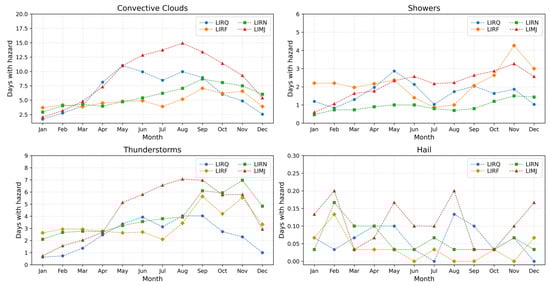
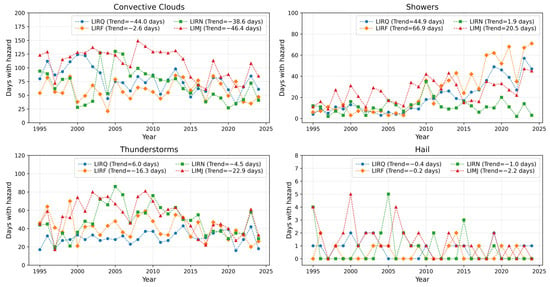
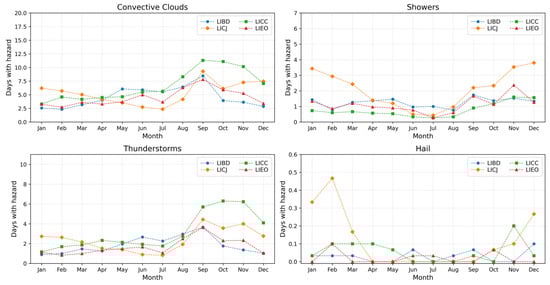
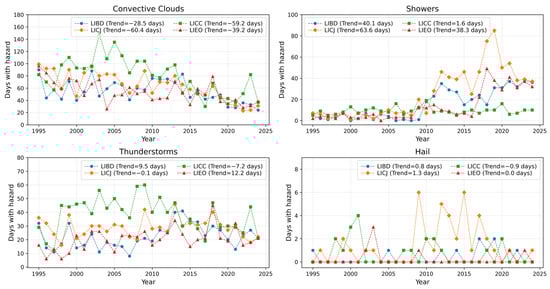
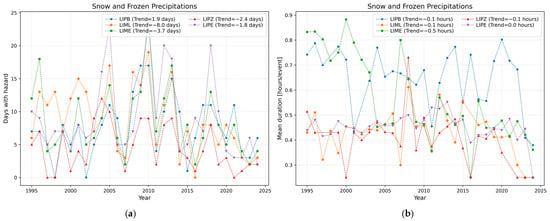
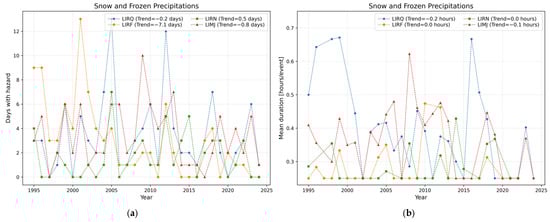
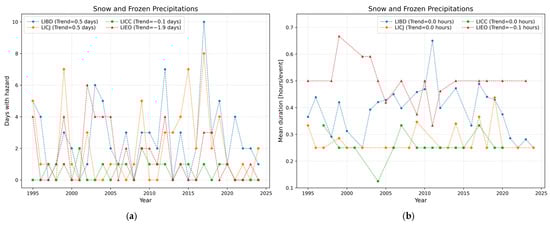
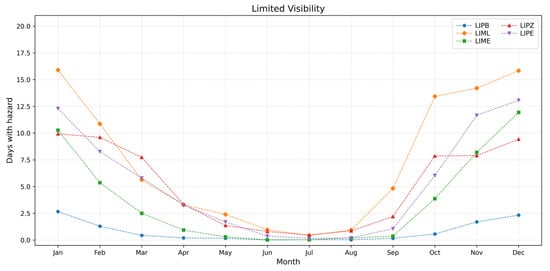
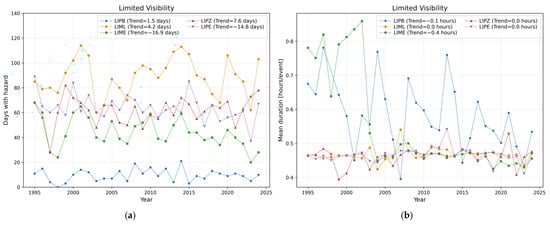
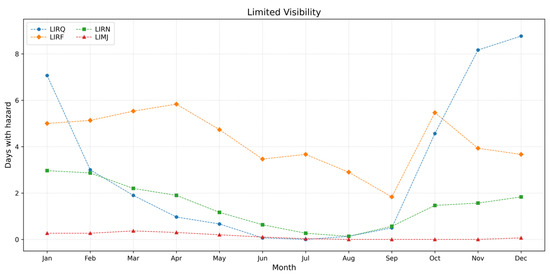
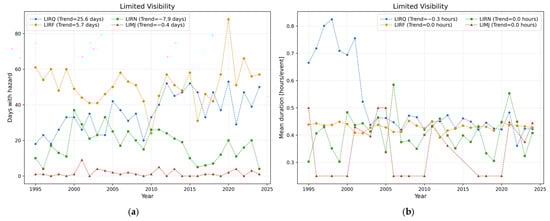
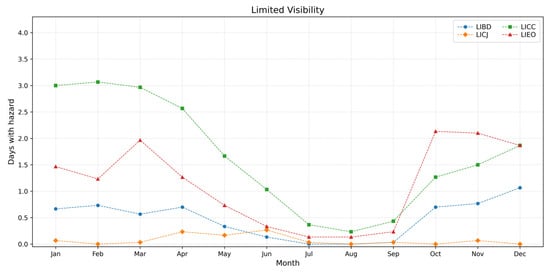
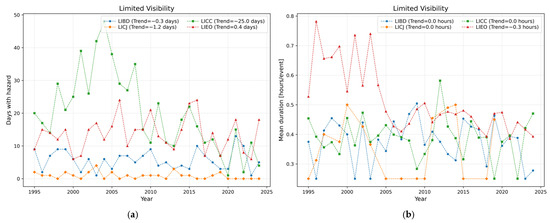
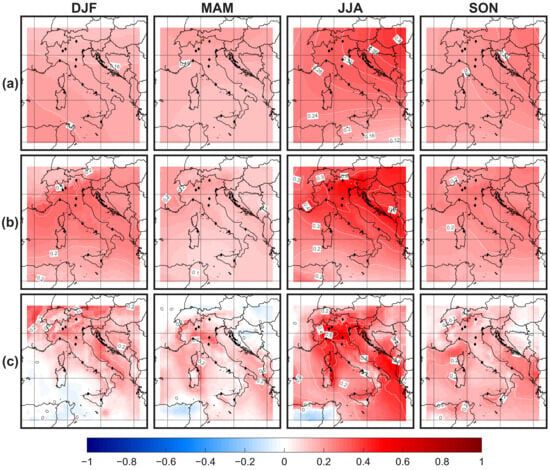
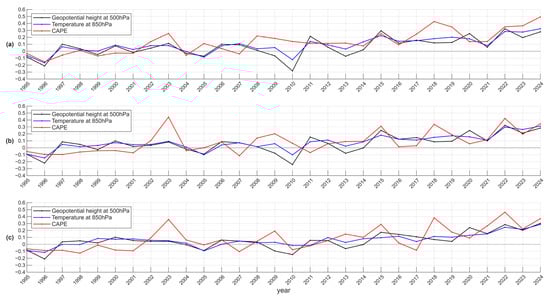
Climate change (CC) is widely recognized as a major human concern, affecting society across all aspects and activities. Among various economic sectors, aviation is one of the most affected due to its exposure to adverse weather events. Consequently, adaptation and mitigation actions are becoming increasingly important to reduce the negative effects of CC-driven extreme weather events on aviation operations. In this study, we analyzed 30 years of historical aerodrome meteorological routine reports (METARs) from several major Italian airports to assess multi-decadal changes in aviation weather-related hazards, based on observational evidence such as convection, visibility, and snow and freezing precipitation. Furthermore, we examined the ERA5 reanalysis dataset to assess potential anomalies in the synoptic circulation over the Euro-Mediterranean region that may drive fluctuations in local airport climatology. Our results reveal relevant trends for the considered aviation-related weather hazards, while also indicating meaningful links to variations in local and synoptic patterns. The observed increases in 500 hPa geopotential height, 850 hPa temperature, and convective available potential energy (CAPE) lead to changes in the climatology of the airports considered, including a general enhancement of thermoconvective phenomena, a reduction in events associated with synoptic-scale disturbances, an overall decrease in snowfall, and contrasting trends in fog occurrence depending on local factors.
Full article

Graphical abstract
Open AccessArticle
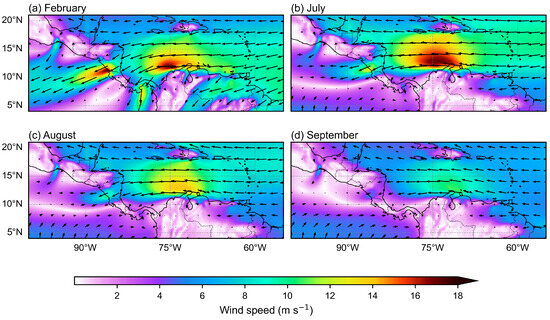
On the Interaction of Tropical Easterly Waves and the Caribbean Low-Level Jet Using Observed, ERA5 and WWLLN Data over the Intra-Americas Seas During OTREC 2019
by
Jorge A. Amador, Dayanna Arce-Fernández, Tito Maldonado and Erick R. Rivera
Meteorology 2026, 5(1), 6; https://doi.org/10.3390/meteorology5010006 - 19 Mar 2026
Abstract
►▼
Show Figures
Propagating easterly waves (EW) are analyzed here, within the dynamical environment of the Caribbean Low-Level Jet (CLLJ) using radiosondes from the Organization of Tropical East Pacific Convection (OTREC) field campaign, ERA5 reanalysis, and lightning from the World Wide Lightning Location Network (WWLLN) over
[...] Read more.
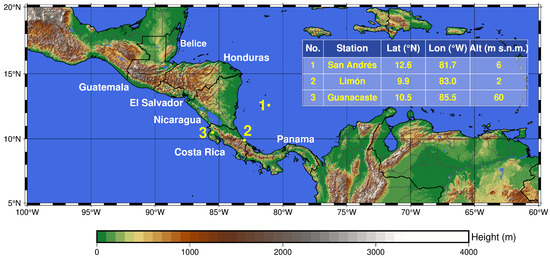
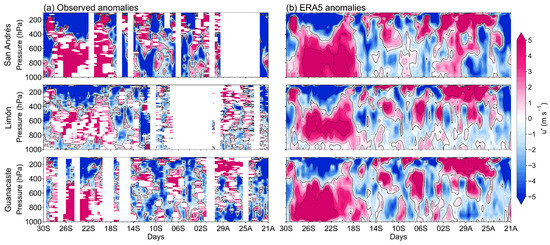
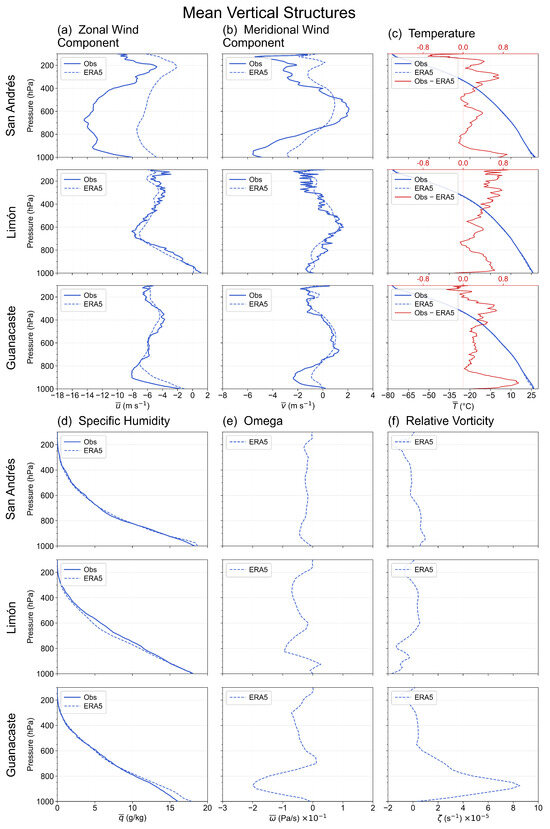
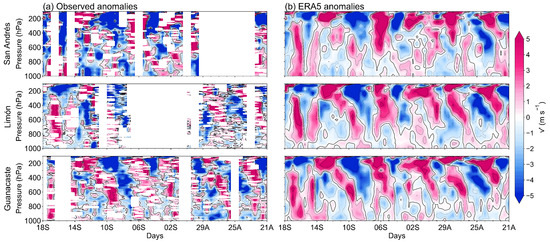
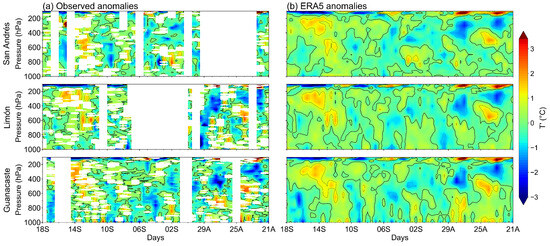
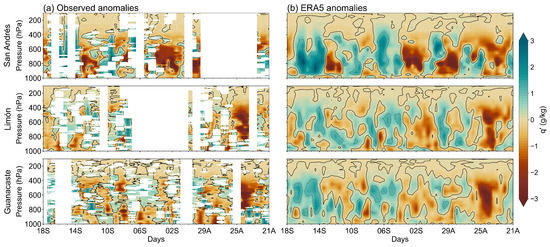
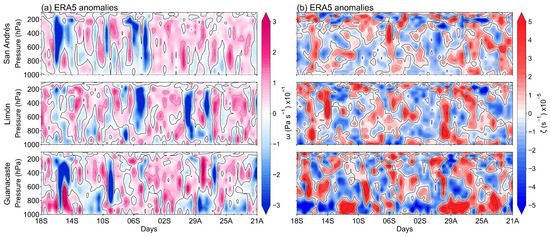
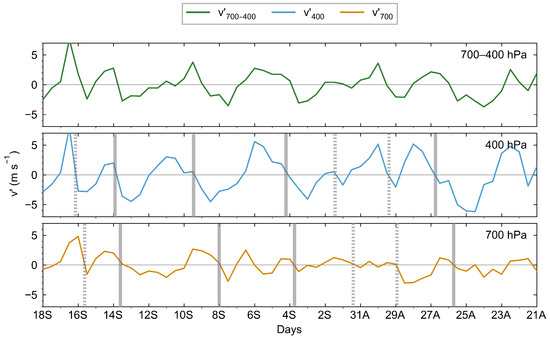
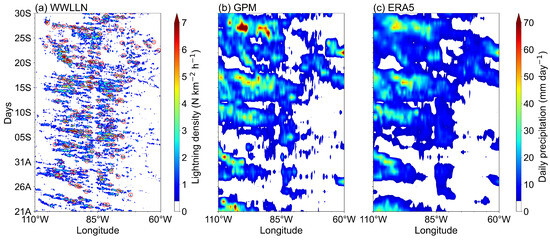
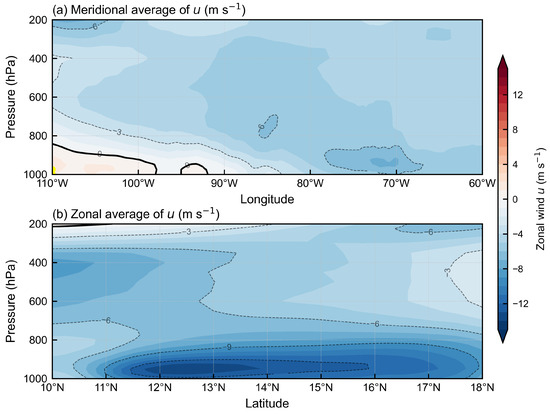
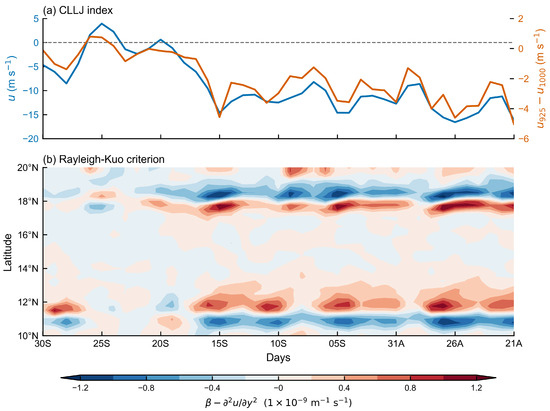
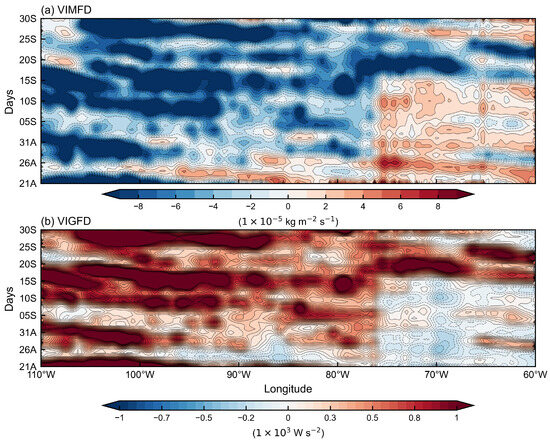
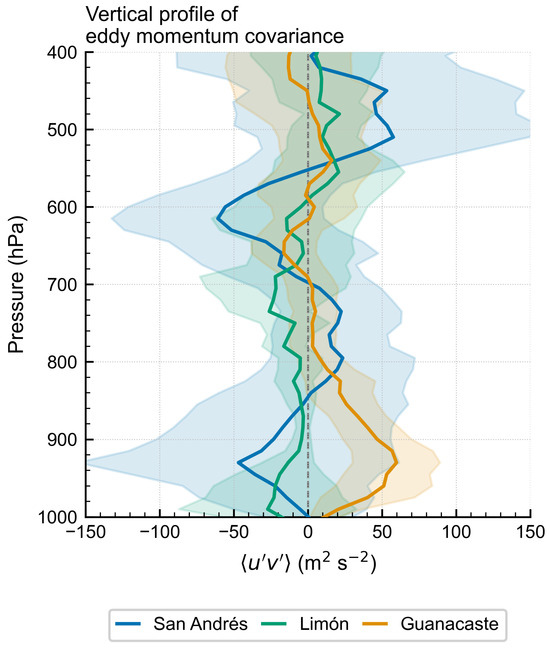
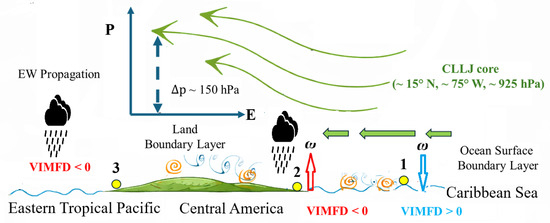
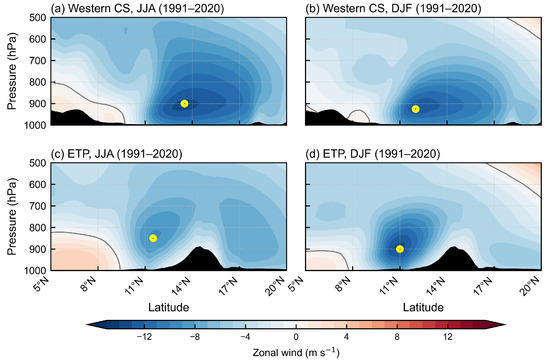
Propagating easterly waves (EW) are analyzed here, within the dynamical environment of the Caribbean Low-Level Jet (CLLJ) using radiosondes from the Organization of Tropical East Pacific Convection (OTREC) field campaign, ERA5 reanalysis, and lightning from the World Wide Lightning Location Network (WWLLN) over – N, – W during 21 August–30 September 2019. Radiosondes resolve the vertical structure of the waves at San Andrés (Colombia), Limón and Santa Cruz–Guanacaste (Costa Rica), while ERA5 provides spatial–temporal continuity and vertically integrated diagnostics—namely, the vertically integrated moisture flux divergence (VIMFD) and the vertically integrated geopotential flux divergence (VIGFD). Lightning from WWLLN and precipitation from ERA5 and the Integrated Multi-satellite Retrievals for the Global Precipitation Measurement mission (GPM IMERG) offer independent convective proxies to track disturbances. Mean profiles from radiosondes and ERA5 show strong agreement at Limón and Guanacaste and some differences at San Andrés, yet all datasets capture coherent, phase-locked anomalies in zonal wind, meridional wind, temperature, humidity, vertical velocity and vorticity used to diagnose EW–CLLJ interactions. VIMFD, VIGFD, lightning and precipitation exhibit westward-propagating cores that align with the above anomalies, indicating that organized convection is coupled to the disturbances, whereas the mean state preconditions the environment to enable wave-induced upward motion. A robust vertical adjustment of the CLLJ is documented: the core shifts from near 925 hPa over the Caribbean Sea to about 700 hPa over the Eastern Tropical Pacific ( hPa). This feature is reproduced by a 30-year ERA5 climatology, consistent with jet-exit forcing and enhanced boundary-layer coupling over land. Conditions favorable for barotropic instability using the Rayleigh–Kuo criterion, were present over most of the period. A qualitative barotropic conversion proxy, computed from the eddy momentum covariance , shows positive values in the lower troposphere at Guanacaste and in the layer 850–700 hPa at San Andrés, suggesting mean-to-eddy momentum transfer, whereas the signal at Limón is weaker. Together, these results provide a physically consistent view of EW–CLLJ interactions across the IAS; therefore, a schematic of those mechanisms is proposed here. The results highlight the need for high-resolution modeling and full energy-budget analyses.
Full article

Figure 1
Open AccessArticle
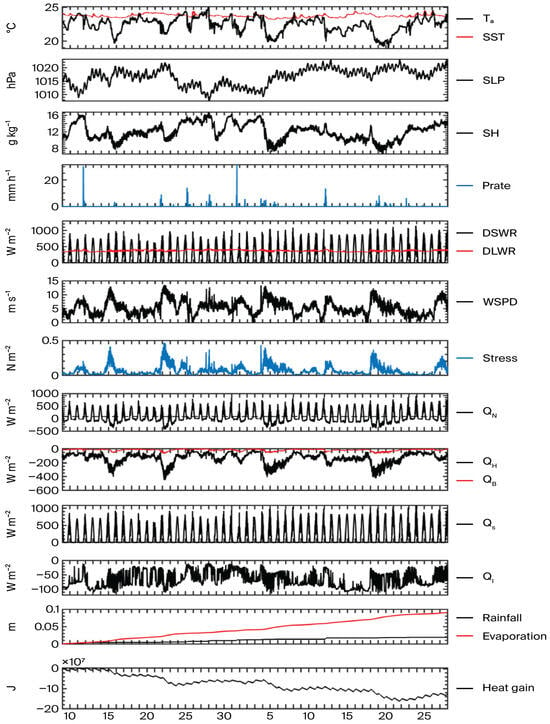
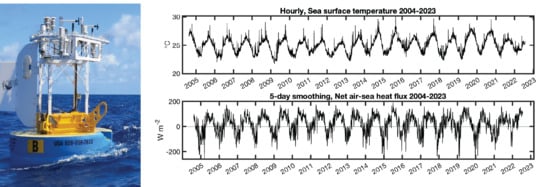
Surface Meteorology and Air–Sea Fluxes at the WHOTS Ocean Reference Station: Variability at Periods up to One Year
by
Robert A. Weller, Roger Lukas, Sebastien P. Bigorre, Albert J. Plueddemann and James Potemra
Meteorology 2026, 5(1), 5; https://doi.org/10.3390/meteorology5010005 - 3 Mar 2026
Abstract
►▼
Show Figures
An eighteen-year record of in situ surface meteorology and computed bulk air–sea fluxes of heat, freshwater, and momentum from an ocean site windward of the Hawaiian Islands is presented. Observations were logged every minute. The one-minute, one-hour, and one-day time series statistics are
[...] Read more.
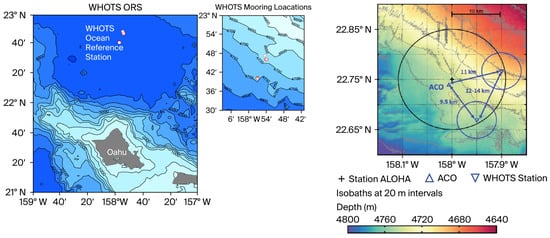
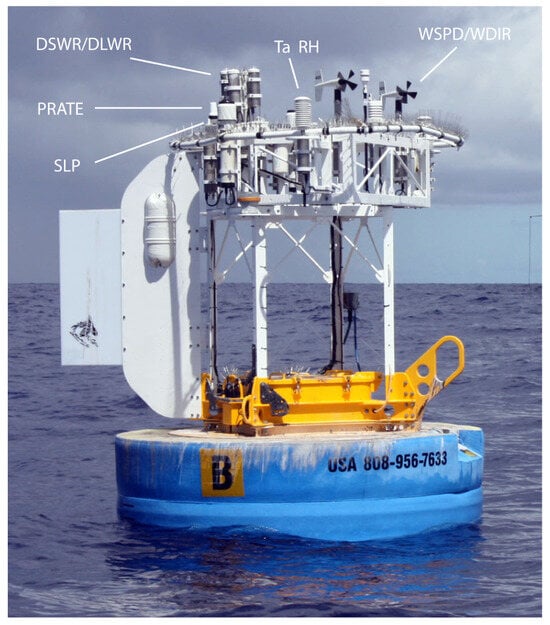
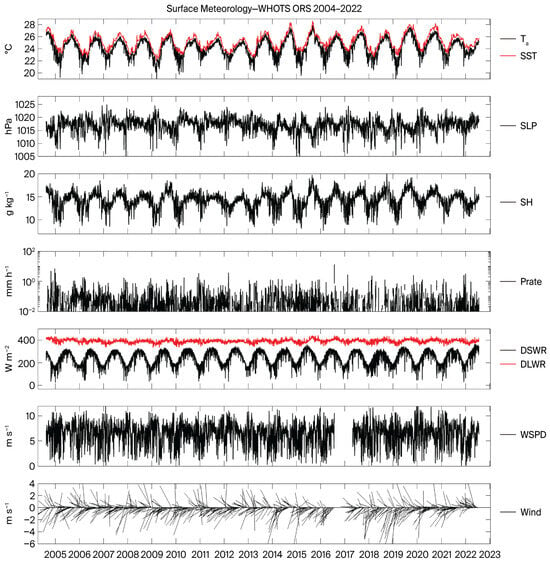
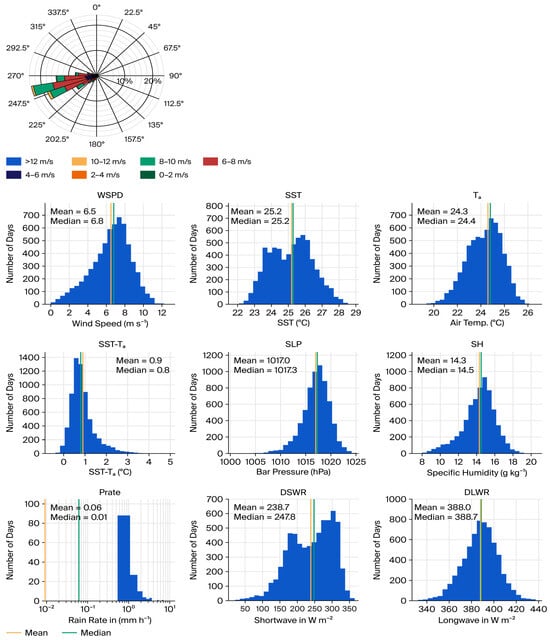
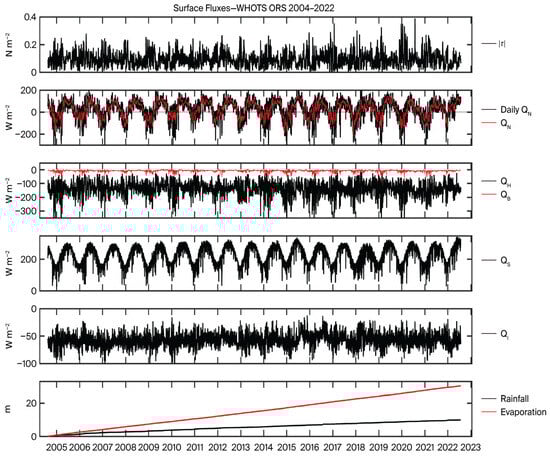
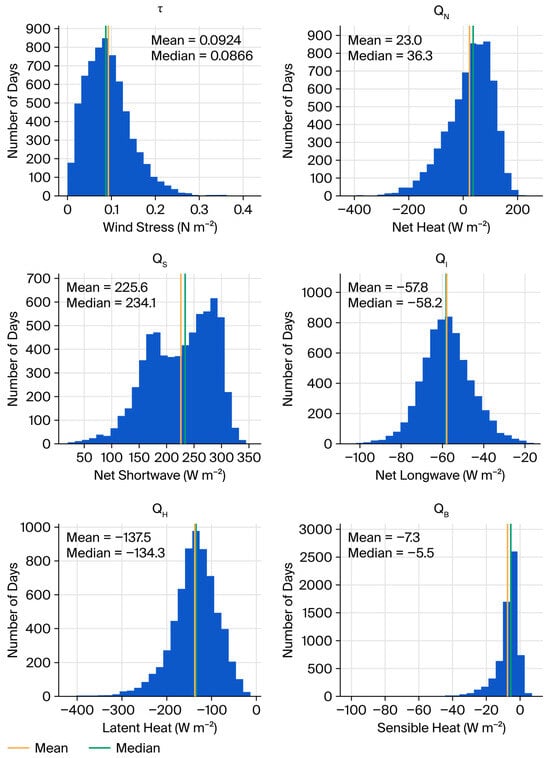
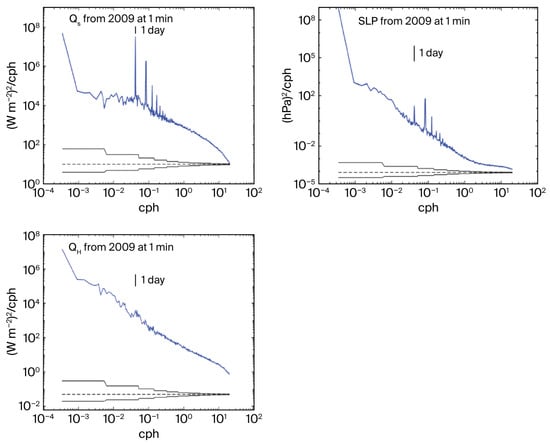
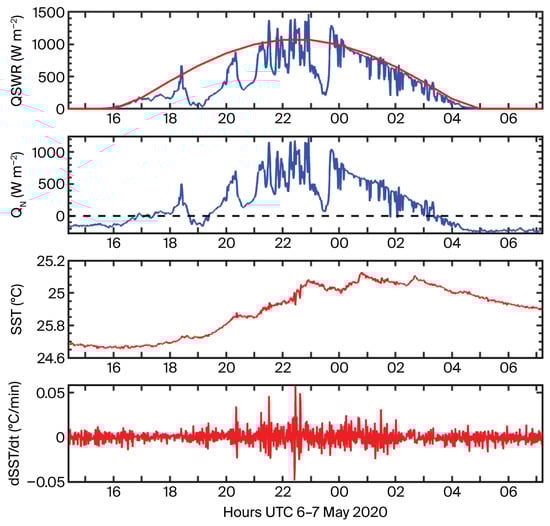
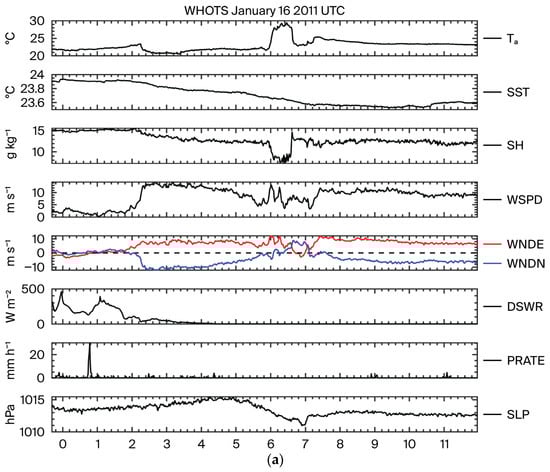
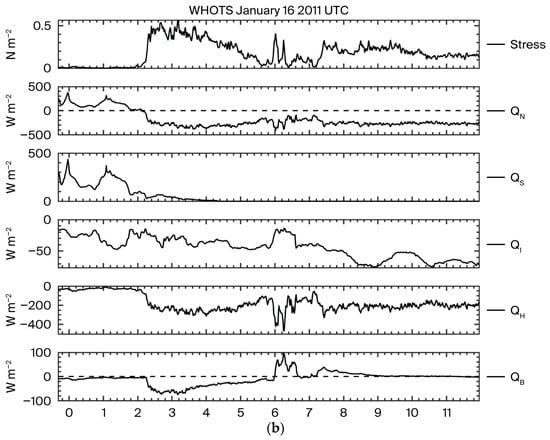
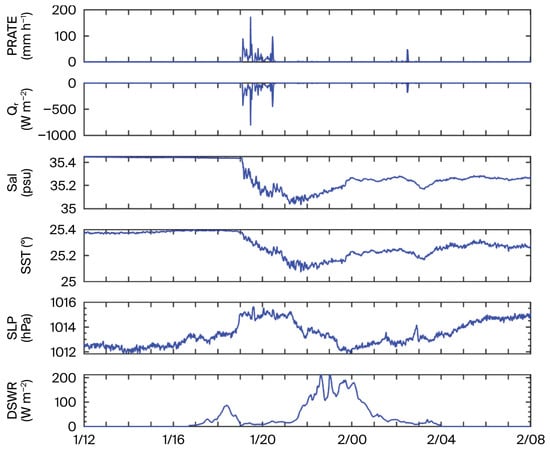
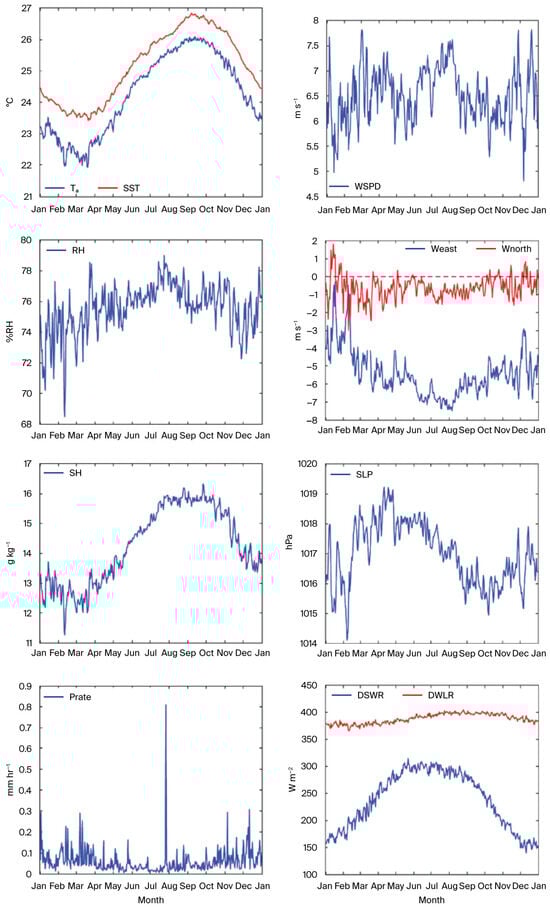
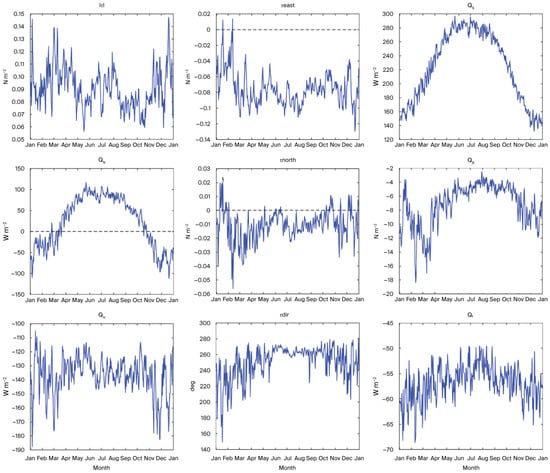
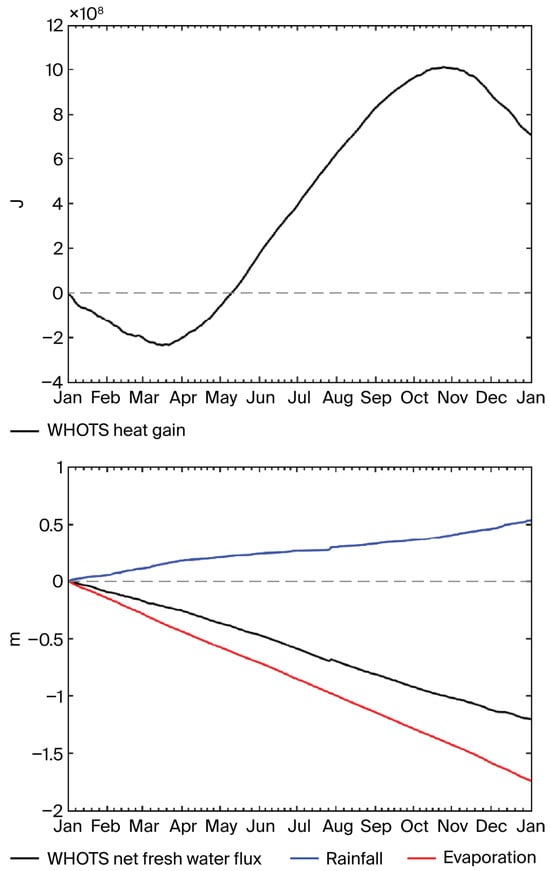
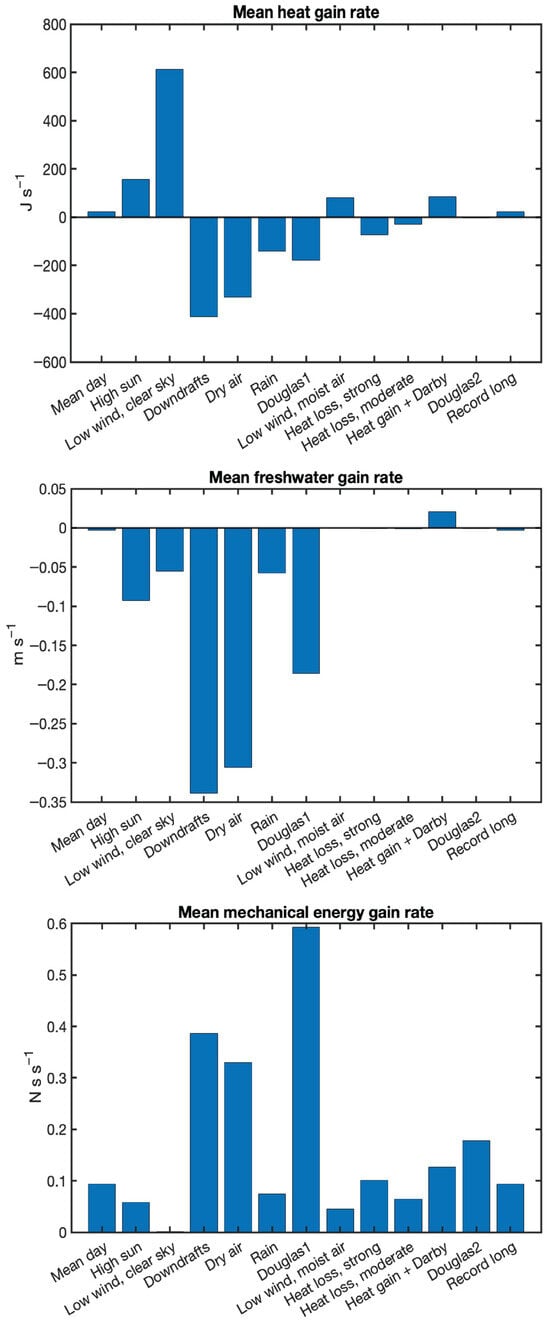
An eighteen-year record of in situ surface meteorology and computed bulk air–sea fluxes of heat, freshwater, and momentum from an ocean site windward of the Hawaiian Islands is presented. Observations were logged every minute. The one-minute, one-hour, and one-day time series statistics are presented. The daily-averaged time series provide an overview of this trade wind site, with mean wind of 6.8 m s−1 toward the west–southwest, mean ocean heat gain of 23.2 W m−2, and freshwater loss of 1.2 m yr−1. Energetic variability was found at the higher sampling rates, evidenced by spectral peaks in solar insolation and sea-level pressure and by striking transient signals including short-lived insolation values higher than clear-sky values, short periods with air warmer than the sea surface, and by series of downdrafts of dry air. At longer periods, the presence of moist air accompanying low winds and sunny skies enhanced ocean heating. Winter events with dry air and wind, resulting in large latent and net heat loss, led to ocean cooling. Signals of two hurricanes, Darby and Douglas, were recorded. Normalized by their duration, short-lived events have the potential to make significant contributions to the heat, freshwater, and mechanical energy exchanges.
Full article

Graphical abstract
Open AccessArticle
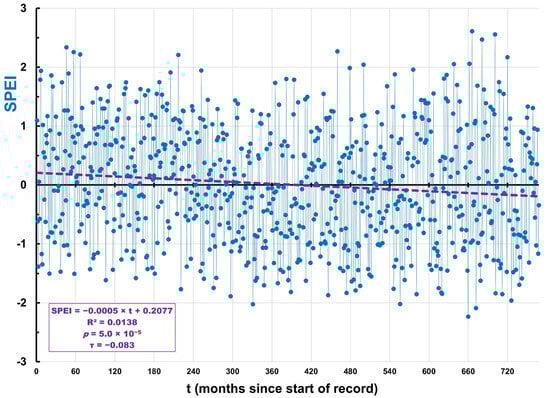
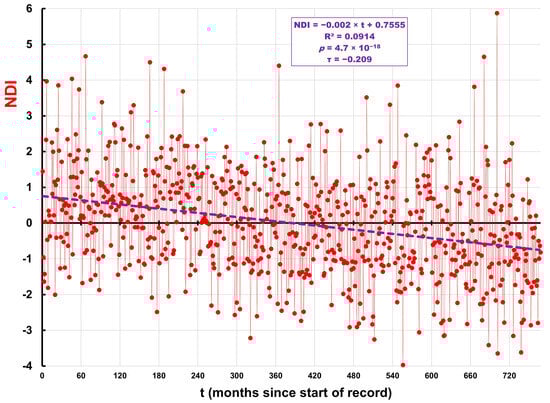
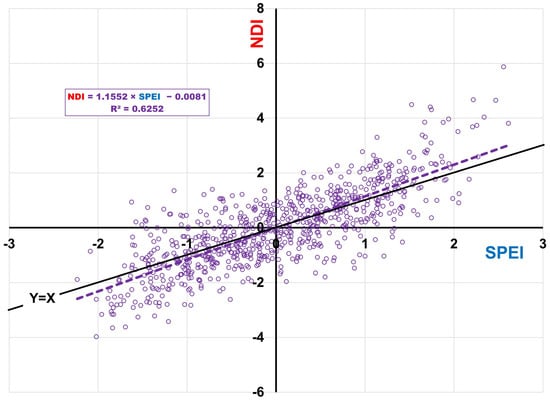
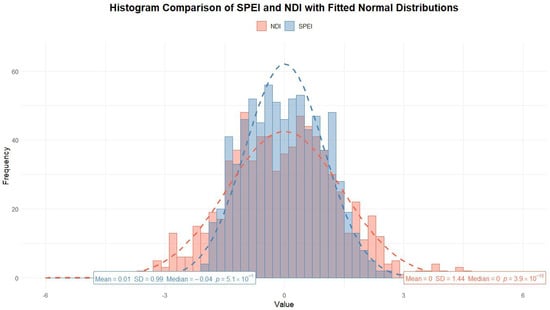
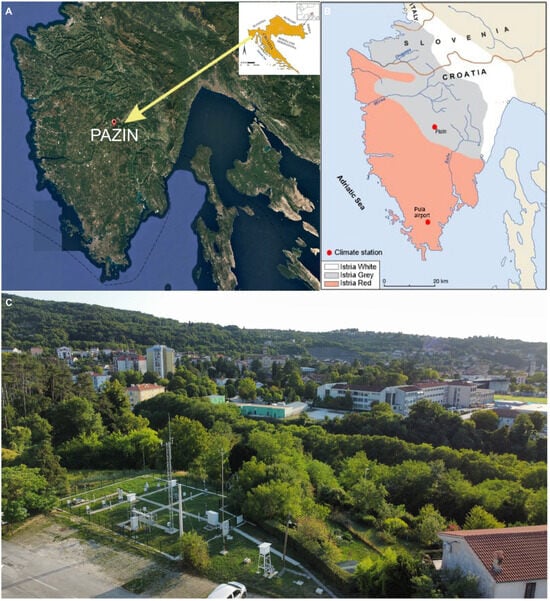
Assessing Drought Intensification with SPEI and NDI in Pazin, Istria (Northern Adriatic, Croatia)
by
Ognjen Bonacci, Ana Žaknić-Ćatović, Tamara Brleković, Tanja Roje-Bonacci and Anita Filipčić
Meteorology 2026, 5(1), 4; https://doi.org/10.3390/meteorology5010004 - 5 Feb 2026
Abstract
►▼
Show Figures
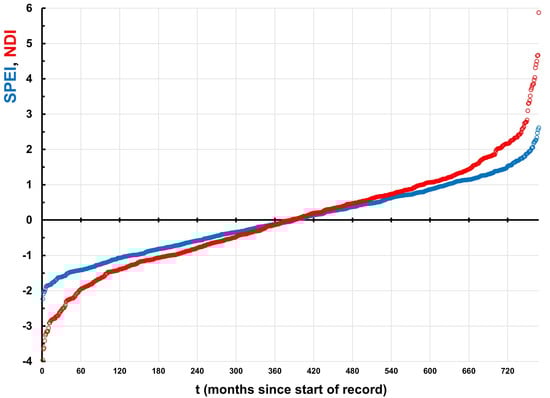
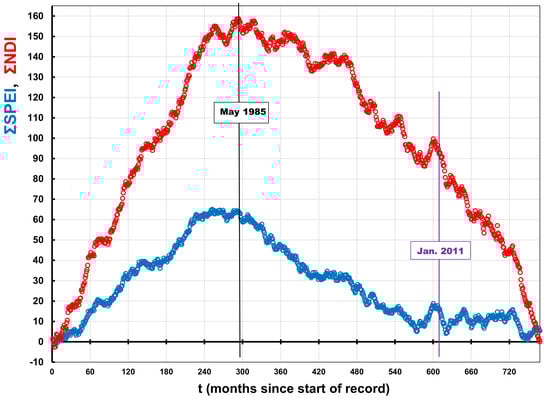
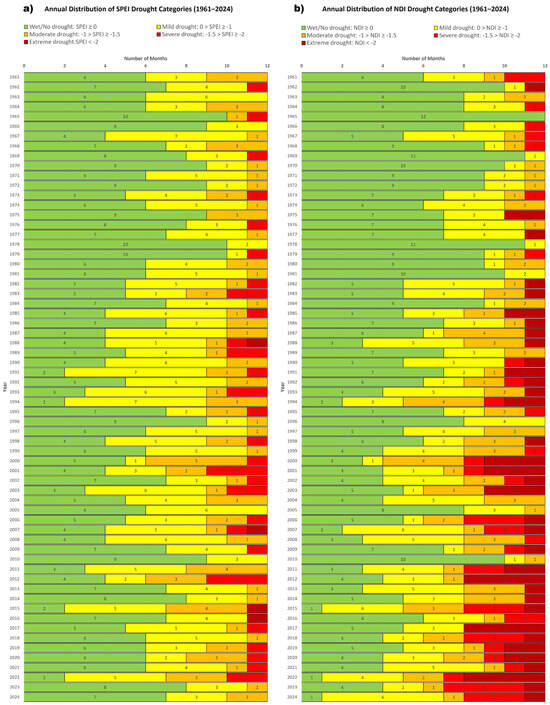
This study investigates the intensification of drought in the continental part of the Istrian peninsula using two standardized drought indices: the Standardized Precipitation Evapotranspiration Index (SPEI) and the New Drought Index (NDI). Monthly precipitation and temperature data from the main meteorological station in
[...] Read more.
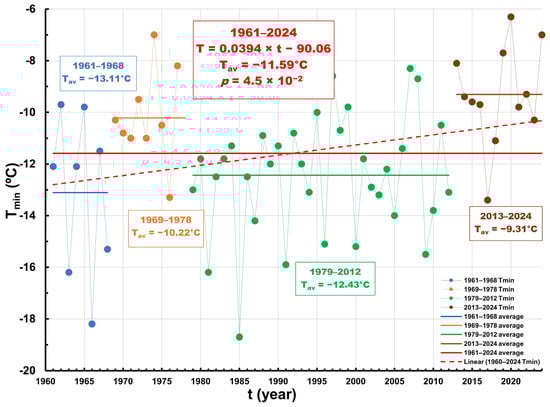
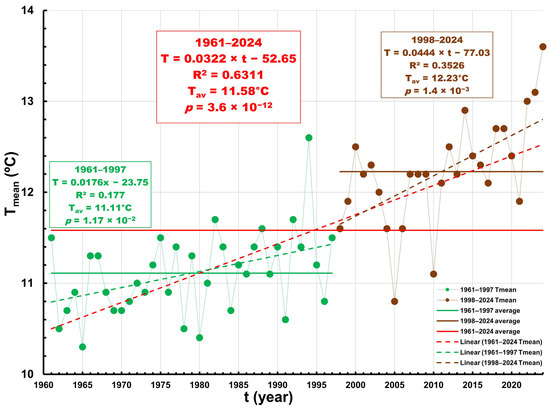
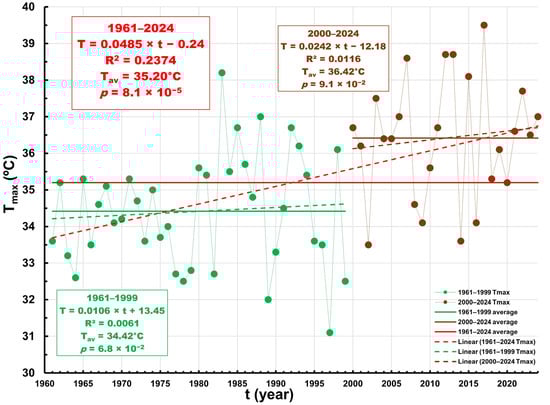
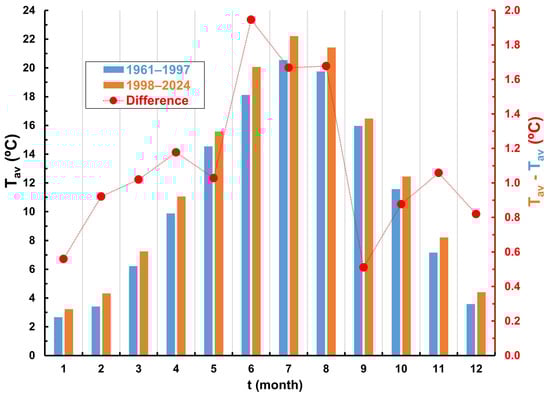
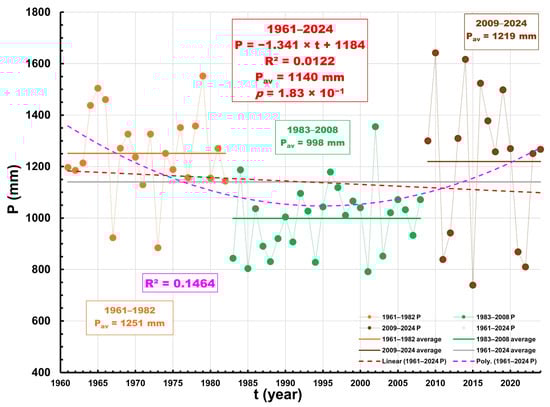
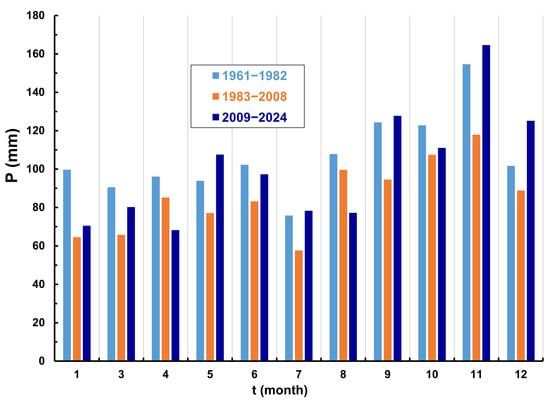
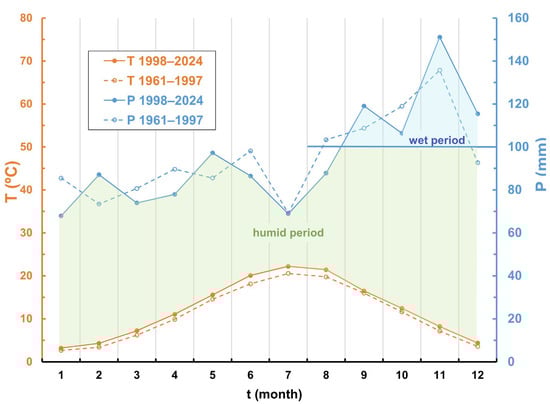
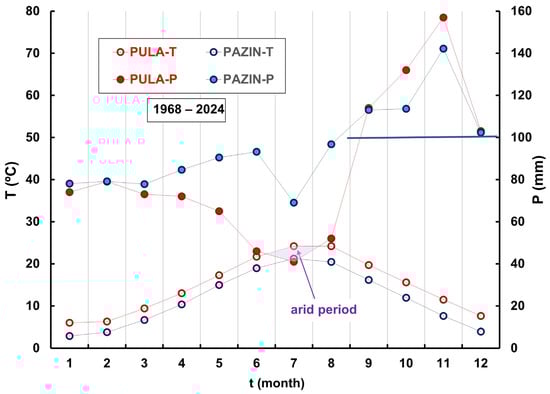
This study investigates the intensification of drought in the continental part of the Istrian peninsula using two standardized drought indices: the Standardized Precipitation Evapotranspiration Index (SPEI) and the New Drought Index (NDI). Monthly precipitation and temperature data from the main meteorological station in Pazin, covering the period 1961–2024, were analyzed. Statistical methods, including linear regression, Mann–Kendall test, and Rescaled Adjusted Partial Sums (RAPS) analysis, were applied to detect trends and fluctuations in the time series. Results indicate a significant increase in mean annual air temperatures since the late 1990s, with particularly strong warming in summer months. Precipitation trends, although highly variable, did not show a statistically significant long-term decline. Both drought indices reveal an intensification of drought conditions after 1985, with NDI showing stronger sensitivity to temperature rise than SPEI. Seasonal analyses demonstrate that drought occurrence is most pronounced during the warm part of the year, while cumulative series indicate a shift from predominantly wet to predominantly dry conditions after the mid-1980s. The comparison of the two indices shows a high degree of agreement but also highlights the added value of NDI in detecting temperature-driven drought processes. The findings emphasize the growing risk of more frequent and severe droughts in humid regions of Istria, including the potential for flash drought events. These results may support the development of improved drought early-warning systems and adaptation strategies in the Mediterranean context.
Full article

Figure 1

Highly Accessed Articles
Latest Books
E-Mail Alert
News
Topics
Topic in
Climate, Forecasting, Meteorology, Remote Sensing
Application of Artificial Intelligence in Extreme Weather Monitoring and Forecasting
Topic Editors: Leiming Ma, Changjiang Zhang, Zhaoliang ZengDeadline: 31 August 2027
Special Issues
Special Issue in
Meteorology
Early Career Scientists’ (ECS) Contributions to Meteorology (2026)
Guest Editor: Edoardo BucchignaniDeadline: 31 December 2026
Special Issue in
Meteorology
Highly Resolved Numerical Models in Regional Weather Forecasting
Guest Editors: Davide Cinquegrana, Antonio Ricchi, Edoardo BucchignaniDeadline: 30 April 2027
Special Issue in
Meteorology
Feature Papers in Meteorology
Guest Editors: Paul Williams, Bong-Chul Seo, John H. Van BoxelDeadline: 31 July 2027