Article

Beyond Barriers: Constructing the Cloud Migration Complexity Index for China’s Digital Transformation

1
School of Artificial Intelligence, Wuhan Polytechnic, Wuhan 430072, China
2
School of Economics & Trade, Guangdong University of Finance, Guangzhou 510521, China
3
School of Economics, Zhongnan University of Economics and Law, Wuhan 430073, China
*
Author to whom correspondence should be addressed.
J. Theor. Appl. Electron. Commer. Res. 2024, 19(3), 2239-2268; https://doi.org/10.3390/jtaer19030109
Submission received: 25 August 2023 / Revised: 29 August 2024 / Accepted: 30 August 2024 / Published: 3 September 2024

Abstract

:
In the digital era, cloud computing stands as a pivotal tool in the transformative journey of enterprises, with China’s tech landscape serving as a prime exemplar. However, when enterprises embrace cloud computing, they face complex hurdles, mainly technical ones. To understand how the complexity of cloud migration affects their digital transformation, our research meticulously constructed business process models for business deployment in both non-cloud and cloud contexts, spanning the IaaS, PaaS, and SaaS levels. By harnessing China’s public cloud market data, we constructed the Cloud Migration Complexity Index, providing a tangible metric to gauge the intricacies of cloud migration and their implications on digital transformation. The findings illustrate that a decrease in cloud migration complexity significantly accelerates digital transformation, with the reduction in SaaS complexity having the most profound impact. Analyzing businesses of varying scales, the diminishing complexity of SaaS predominantly boosts digital transformation for non-SME enterprises, while reduced PaaS complexity is most beneficial for SMEs. This study advocates for the government to expand the PaaS market and suggest that cloud providers develop more PaaS-based products to optimize cloud migration both technically and economically.

1. Introduction

The digitalization of enterprises is the pivotal trend shaping the future of business. Digitalization involves leveraging digital technologies to transform business activities, processes, competencies, and models, enhancing the enterprise’s capability to generate value [1]. However, as enterprises embark on their digitalization journey, they confront numerous technical challenges, including integrating with existing systems, ensuring data privacy and security, addressing the lack of internal skills and knowledge, and adapting to rapid technological changes [2]. A key strategy to address these digitalization challenges is the adoption of cloud computing, often referred to as ‘business cloudification’. Cloud technology offers scalable and flexible solutions that enable enterprises to rapidly adapt to changing business needs, enhance operational efficiency, and facilitate innovative business models [3].
Cloud computing, as a paradigm shift in information technology, has profoundly transformed the way organizations manage and operate their IT infrastructure. Defined by the National Institute of Standards and Technology (NIST), cloud computing allows ubiquitous, convenient, on-demand network access to a configurable pool of computing resources which can be rapidly provisioned and released with minimal management effort or interaction with the service provider [4]. This technology includes three service models: Infrastructure as a Service (IaaS), Platform as a Service (PaaS), and Software as a Service (SaaS). Each model represents a different layer of abstraction, offering distinct levels of control, flexibility, and management [5,6,7]. By utilizing cloud services, organizations can navigate the complexities of digital transformation more effectively, mitigating the risks associated with traditional IT infrastructures [8]. While cloud computing offers numerous benefits, the technical hurdles associated with migrating to the cloud persist and can impact enterprises’ decisions, especially for small and medium-sized enterprises (SMEs) [9]. These hurdles include technical compatibility, lack of domain expertise, and technical experience [10].
In China, the expanding cloud computing market, led by public cloud providers such as Alibaba Cloud, is continuously innovating and introducing new products and features to reduce the complexity of cloud migration [11]. These offerings have the potential to streamline the cloudification process, making it more accessible to a wider range of organizations.
Cloud transformation is a crucial step for businesses on their digitalization journey [12]. However, this transformation often presents technical hurdles that most enterprises must overcome to fully benefit from digital technology. While the complexity of enterprises migrating to the cloud is gradually decreasing, existing studies have largely overlooked the impact of these complex changes on enterprises’ digital transformation both from a technical perspective and at a macro level.
Recognizing this gap in the literature, we emphasize the importance of addressing the technical challenges organizations encounter when adopting cloud services. As the transition to the cloud can significantly impact the pace and success of an enterprise’s digital transformation, analyzing from this perspective is highly relevant. To this end, we have constructed a technical complexity index for enterprise cloud migration. This index provides a quantifiable measure of the difficulty associated with cloud migration, offering a more nuanced understanding of the technical aspects that can influence an enterprise’s digitalization journey.
To measure the complexity index of cloud migration, we first measured the complexity of enterprise business migrating to the cloud. By delving deeper into the different service models of cloud computing—IaaS, PaaS, and SaaS—it becomes evident that substantial differences exist in deploying business services across these three levels, both in terms of process and complexity [13]. Figure 1 illustrates the deployment model for the different cloud computing layers.
IaaS is the most flexible model, offering businesses a full range of services similar to those traditionally performed by an in-house IT department. It provides hardware, storage, servers, and data center space. Businesses opting for IaaS are responsible for managing applications, data, runtime, middleware, and operating systems [14]. This approach requires the enterprise to possess significant technical expertise, making the deployment process relatively complex.
PaaS simplifies the deployment process by providing a platform for developers to create, run, and manage applications. The complexity lies in the development of applications rather than infrastructure management, as the latter is handled by the service provider [15]. However, PaaS requires specialized skills in the platform-specific language and tools, and its relative complexity can depend heavily on the user’s experience with the platform.
SaaS is the simplest model for businesses, allowing them to use software over the internet, typically through a subscription-based payment model. Deployment at this level involves minimal complexity, as businesses are only responsible for input and management of their data. The rest—applications, runtime, data, middleware, operating system, virtualization, servers, storage, and networking—are handled by the service provider [16].
Recognizing that the complexity of migration varies across the three levels of cloud computing (IaaS, PaaS, SaaS), we propose several Business Process Model and Notation (BPMN) process models [17] based on these three cloud service models to gauge the impact of cloud migration complexity on enterprise digitalization [18]. These models aim to provide a more granular and technically grounded perspective on the cloudification process. In conjunction with data on the size of the public cloud market in China, we developed a relative annual index called the Cloud Migration Complexity Index (CMCI) to assess the complexity of enterprise cloud migration.
Following the measurement of cloud migration complexity, this paper employs data from Chinese publicly listed companies between 2012 and 2021 to empirically explore the relationship between the degree of a company’s digital transformation and the complexity of its cloud migration. This investigation is further refined by considering the three levels of cloud computing (IaaS, PaaS, SaaS). Given that SMEs may face higher technical barriers to cloud computing migration, the empirical estimates differentiate the sample of listed companies into SMEs and non-SMEs. This distinction allows for a more nuanced analysis of the impacts and challenges faced by different types of companies.
The possible innovations of this study lie in four key aspects. First, this study measures the complexity of cloud migration based on different cloud computing levels (IaaS, PaaS, SaaS) and constructs an index for cloud migration complexity. Second, it is the first to explore the relationship between cloud migration complexity and the digital transformation of Chinese enterprises. Third, empirical research reveals that the complexity of cloud migration has a significant negative effect on the enterprises’ digital transformation, particularly for SMEs. Fourth, the reduction in the complexity at the PaaS level has the greatest effect on promoting the digitalization of SMEs.
The rest of this paper is organized as follows. Section 2 provides a literature review. Section 3 introduces the construction of cloud deployment business process models, along with the measurement of model complexity and the associated index. Section 4 presents the theoretical framework. Section 5 outlines the empirical design approach. Section 6 presents empirical results. Section 7 discusses the complexity measurements and empirical results. Section 8 concludes the study.

2. Literature Review

2.1. Cloud Migration

Cloud migration, the transfer of business operations into the cloud, has become a fundamental strategy for digital transformation. The benefits of this move are numerous, including cost reduction, scalability, and increasing operational agility [4]. For example, shifting from a capital expenditure model to an operational expenditure model can result in significant cost savings [19]. Additionally, the scalability of cloud services allows businesses to quickly adapt to fluctuating workloads, thereby improving efficiency [20].
Nevertheless, numerous challenges exist. Data security and privacy are paramount concerns, as transferring sensitive data to a third-party environment can expose it to greater risk [21]. While cloud computing offers efficiency in managing business resources and improving traditional business practices, it also introduces significant security issues [22]. Cloud migration can require significant resources and time [23]. Migrating to the cloud can require substantial human and financial resources, including the purchase and maintenance of hardware, software, and network resources, as well as training staff to use the new systems.
The migration process’s complexity is a daunting challenge, and the lack of necessary skills for managing and operating cloud environments can further complicate the migration process [24]. As mentioned above, the challenges faced by enterprises during cloud migration primarily stem from the complexity of system migration to the cloud and the shortage of professional capabilities related to cloud computing.

2.2. Complexity Measurement

System migration is a complex systematic project, and its complexity plays a crucial role in the decision-making process of whether to migrate. Various approaches have been proposed to assess this complexity, including cost models, theoretical models, and process model-based methods. Cost models often integrate various parameters such as system architecture, data volume, and degree of re-architecting to determine the potential complexity of system migration [25]. Several studies have adopted theoretical modeling frameworks from management science to assess the complexity of organizations migrating to cloud computing. For example, the TOE-DOI model has been used to evaluate the complexity of migrating to cloud computing [26]. The TOE model has been applied to assess the complexity of cloud computing adoption in higher education institutions [27]. Additionally, the TAM/TOE hybrid model has been utilized to evaluate the impact of complexity on organizations to choose cloud computing technology. A cloud computing complexity assessment model was developed using survey data from IT staff in the Australian local government [28].
The production process of a product or service can be represented by a set of structured activities defined by the business process [29]. The business process model defines functions and structures to represent the activities [30]. The evaluation of the complexity of the process model helps identify defects in the business process, leading to improvements [31]. Based on the control structure of the process model, some complexity metrics have been proposed to evaluate the complexity of process models. Cognitive Weight (CW), which considers human information processing capabilities, was introduced as a measure of cognitive complexity to evaluate business process models [32]. The Cross-Connectivity (CC) metric was proposed to assess the closeness of the connection between activities, serving as a measure of complexity [33]. To further identify small changes in the structure, a new complexity measure formula YC was proposed [34], which was further optimized on the Scale metric [35]. YC has been used to measure the complexity of deploying systems in cloud computing environments [36]. A new complexity measure formula, CP, which is more sensitive than YC in identifying change in activity location and branch logic type in the business model, has also been proposed [37]. Given that the greatest challenges in cloud migrating arise from the technical level, complexity assessment based on the business process model can more accurately evaluate the complexity of system migration from a technical perspective.

2.3. Cloud Computing and Enterprise Digitalization

In recent years, the scale of individuals and organizations using cloud computing has accelerated [38]. Public cloud has become the dominant form of cloud computing [39]. Public cloud provides infrastructure and services to the public or any organization [40]. It has become the preferred choice for enterprises [41]. Enterprises adopting public cloud can obtain benefits such as high scalability, capital expenditure savings, and pay-as-you-go [42].
The competitive pressure brought about by globalization urges enterprises to choose digital transformation [43]. Large enterprises tend to be more advanced in digitalization compared to SMEs, with factors affecting the digitalization of SMEs primarily related to information technology, employee skills, and digital strategy [44]. Enterprise transformation to cloud computing is critical to enterprise digital transformation [45]. The improvement of China’s network infrastructure, including artificial intelligence and cloud computing, has promoted the digitization of enterprises [46]. The development of cloud computing technology also has promoted the digital transformation of Chinese enterprises [47].
From the above literature, it is evident that enterprise digitalization is positively correlated with the progress of cloud computing technology. However, there is limited literature analyzing the impact of technical complexity of enterprise migration to the cloud on enterprise digitalization from a technical perspective. This study aims to construct a Cloud Migration Complexity Index based on different levels of cloud computing and use it to analyze the impact of cloud migration complexity on enterprise digitalization in China.

3. The Cloud Migration Complexity Index

Digitalization within enterprises invariably involves the deployment of business systems. In China, Alibaba Cloud has consistently led the market as the top public cloud provider, making it an ideal reference for standard deployment models [48]. Each enterprise faces highly diverse business needs, leading to significant variability in the business platform architectures they use. To measure the complexity of cloud migration for Chinese enterprises, this study proposed a standard deployment model based on the core service modules provided in Alibaba Cloud’s ‘Best Practices for Deploying a Typical Business Website’ [49]. In this architecture, all modules are deployed using clustering to avoid single points of failure, and all services are integrated into the monitoring system to ensure a certain level of high availability [50]. The resulting standard deployment model is shown in Figure 2.
This study constructs a business process model for this standard deployment model. For each of the three levels of cloud computing—IaaS, PaaS, and SaaS—as well as non-cloud scenarios, we establish a Business Process Model and Notation (BPMN) [17] and compute the complexity of the business model.
The willingness to cloud adoption is challenged by various factors [51], and studying these challenges can provide guidance for cloud migration [52]. By using the complexity of non-cloud deployment as a baseline and measuring the deployment complexity under different cloud computing models, this study can determine the relative complexity of migration to different cloud models. Combining this analysis with data from China’s digital economy and cloud computing market, we derive a cloud migration complexity index for enterprises. This index offers valuable insights into the relative technical difficulty of migrating business processes to the cloud across different levels of the cloud service model.

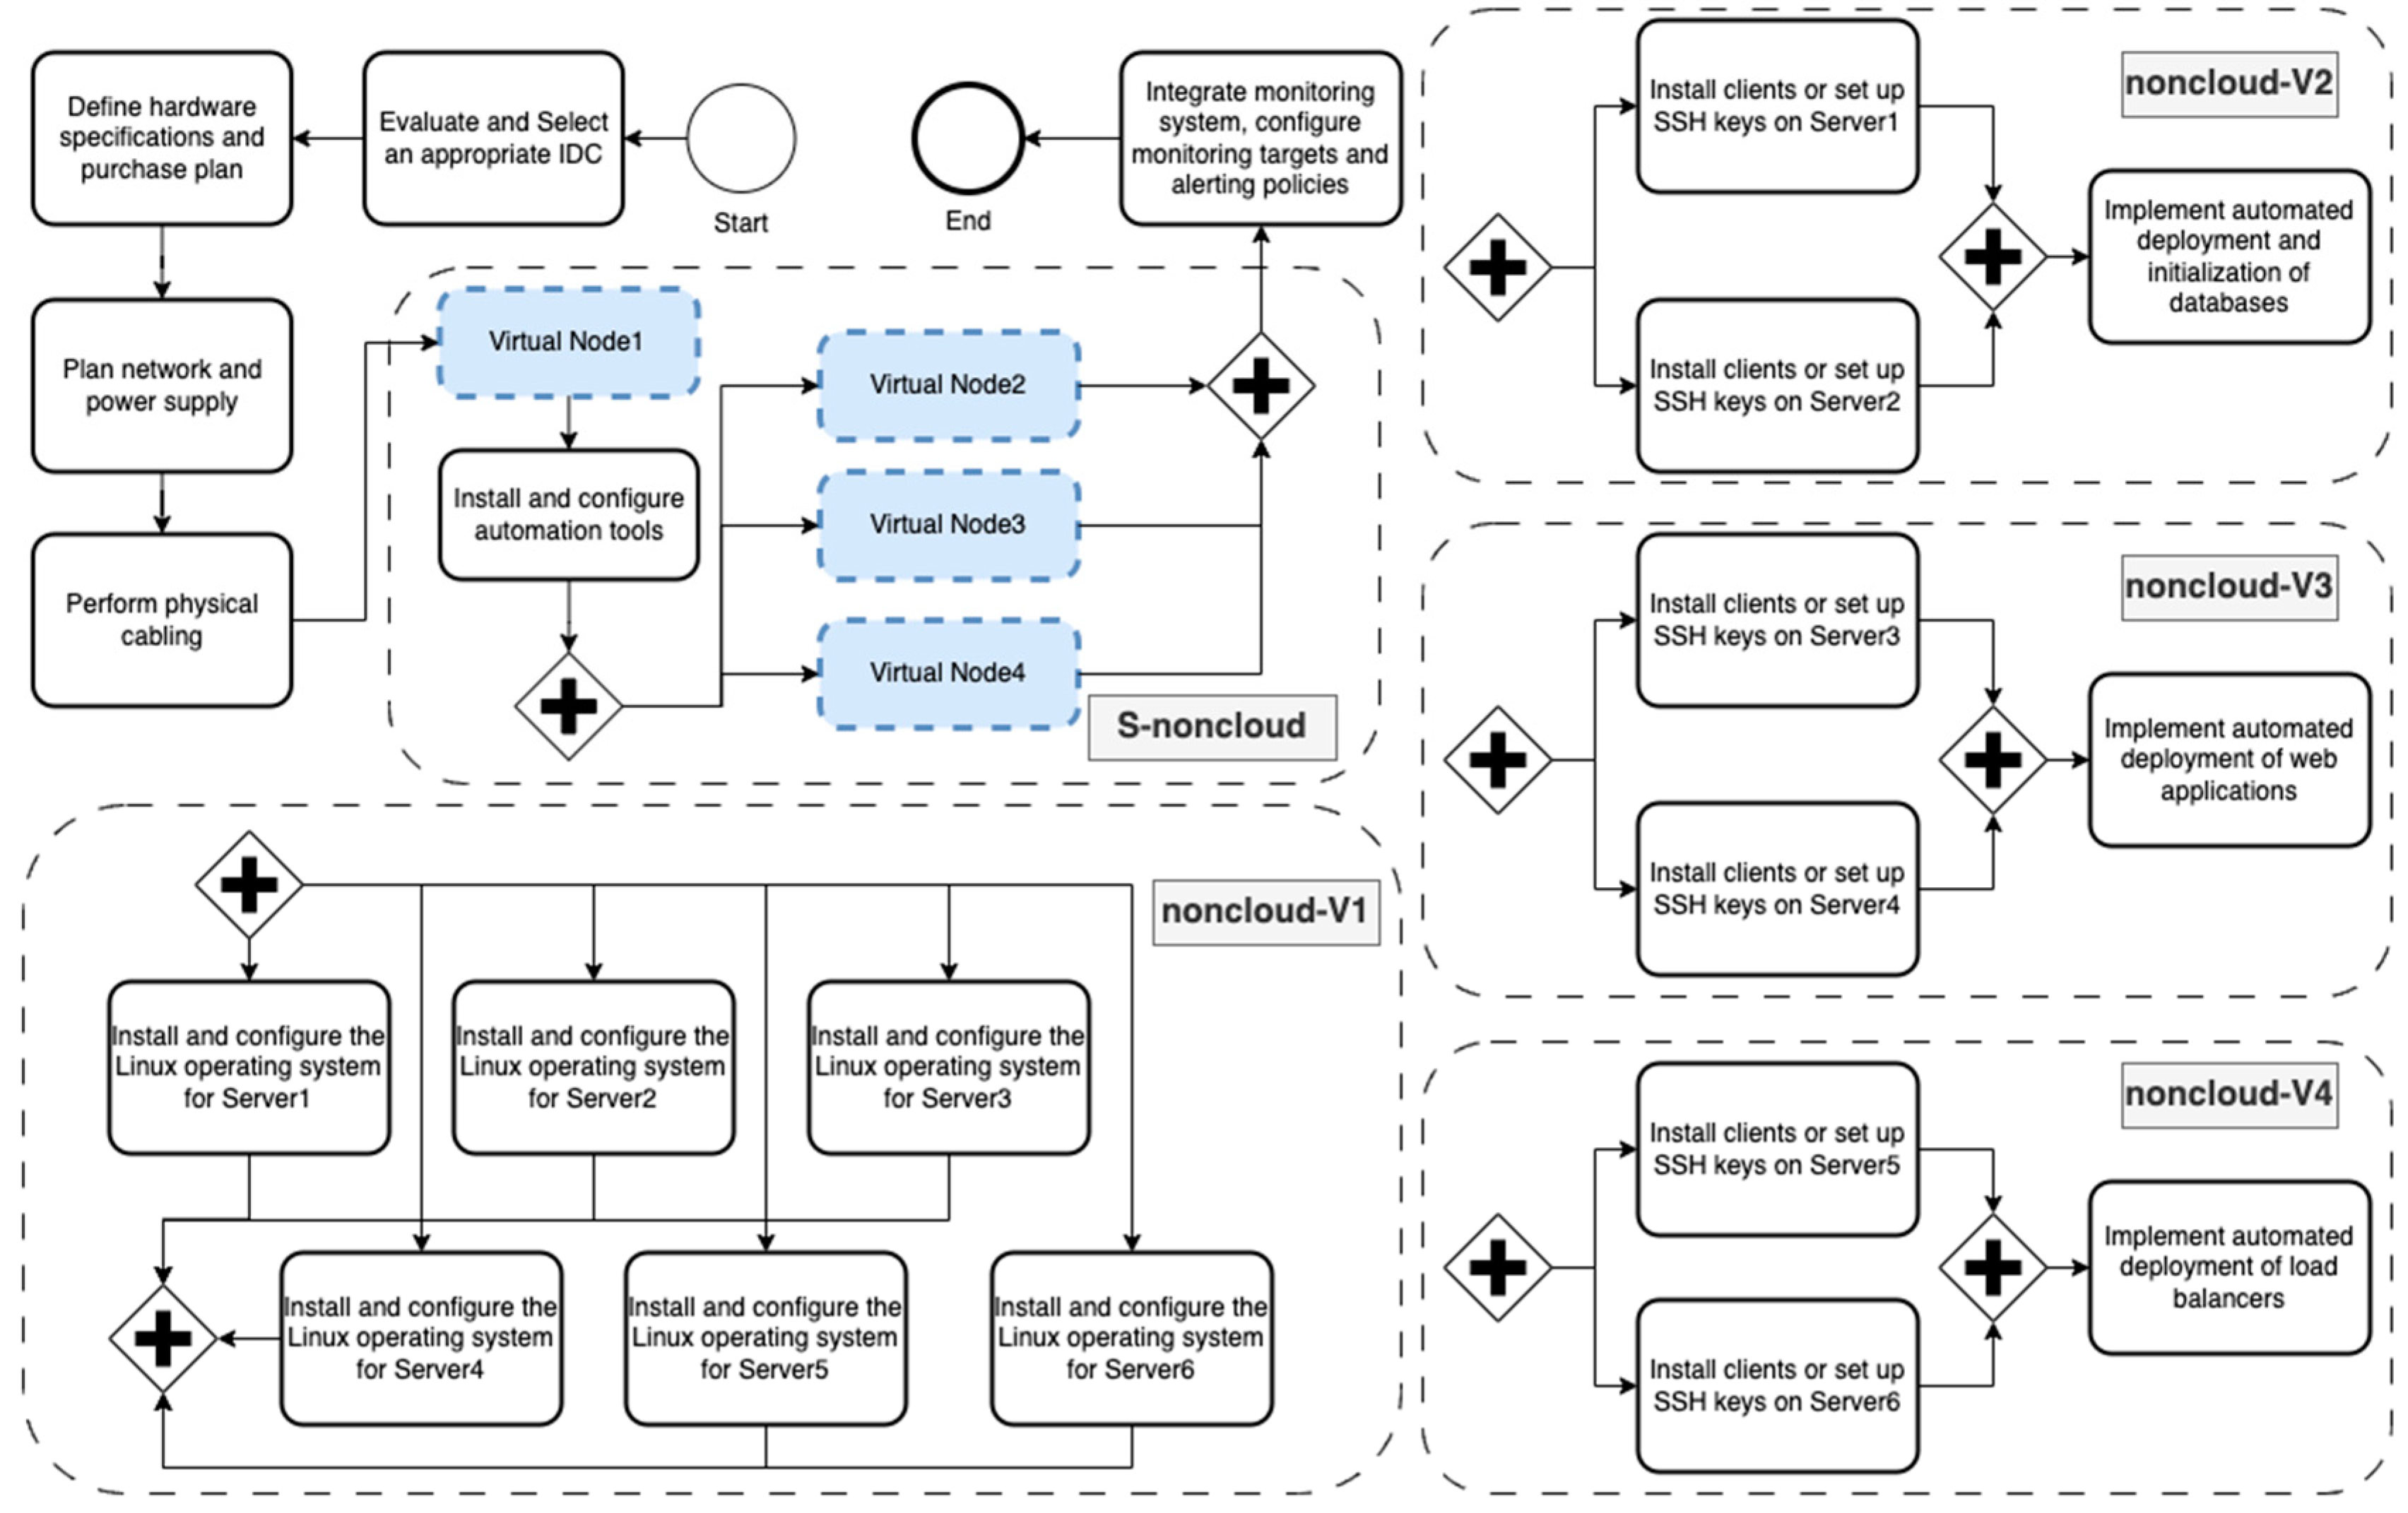
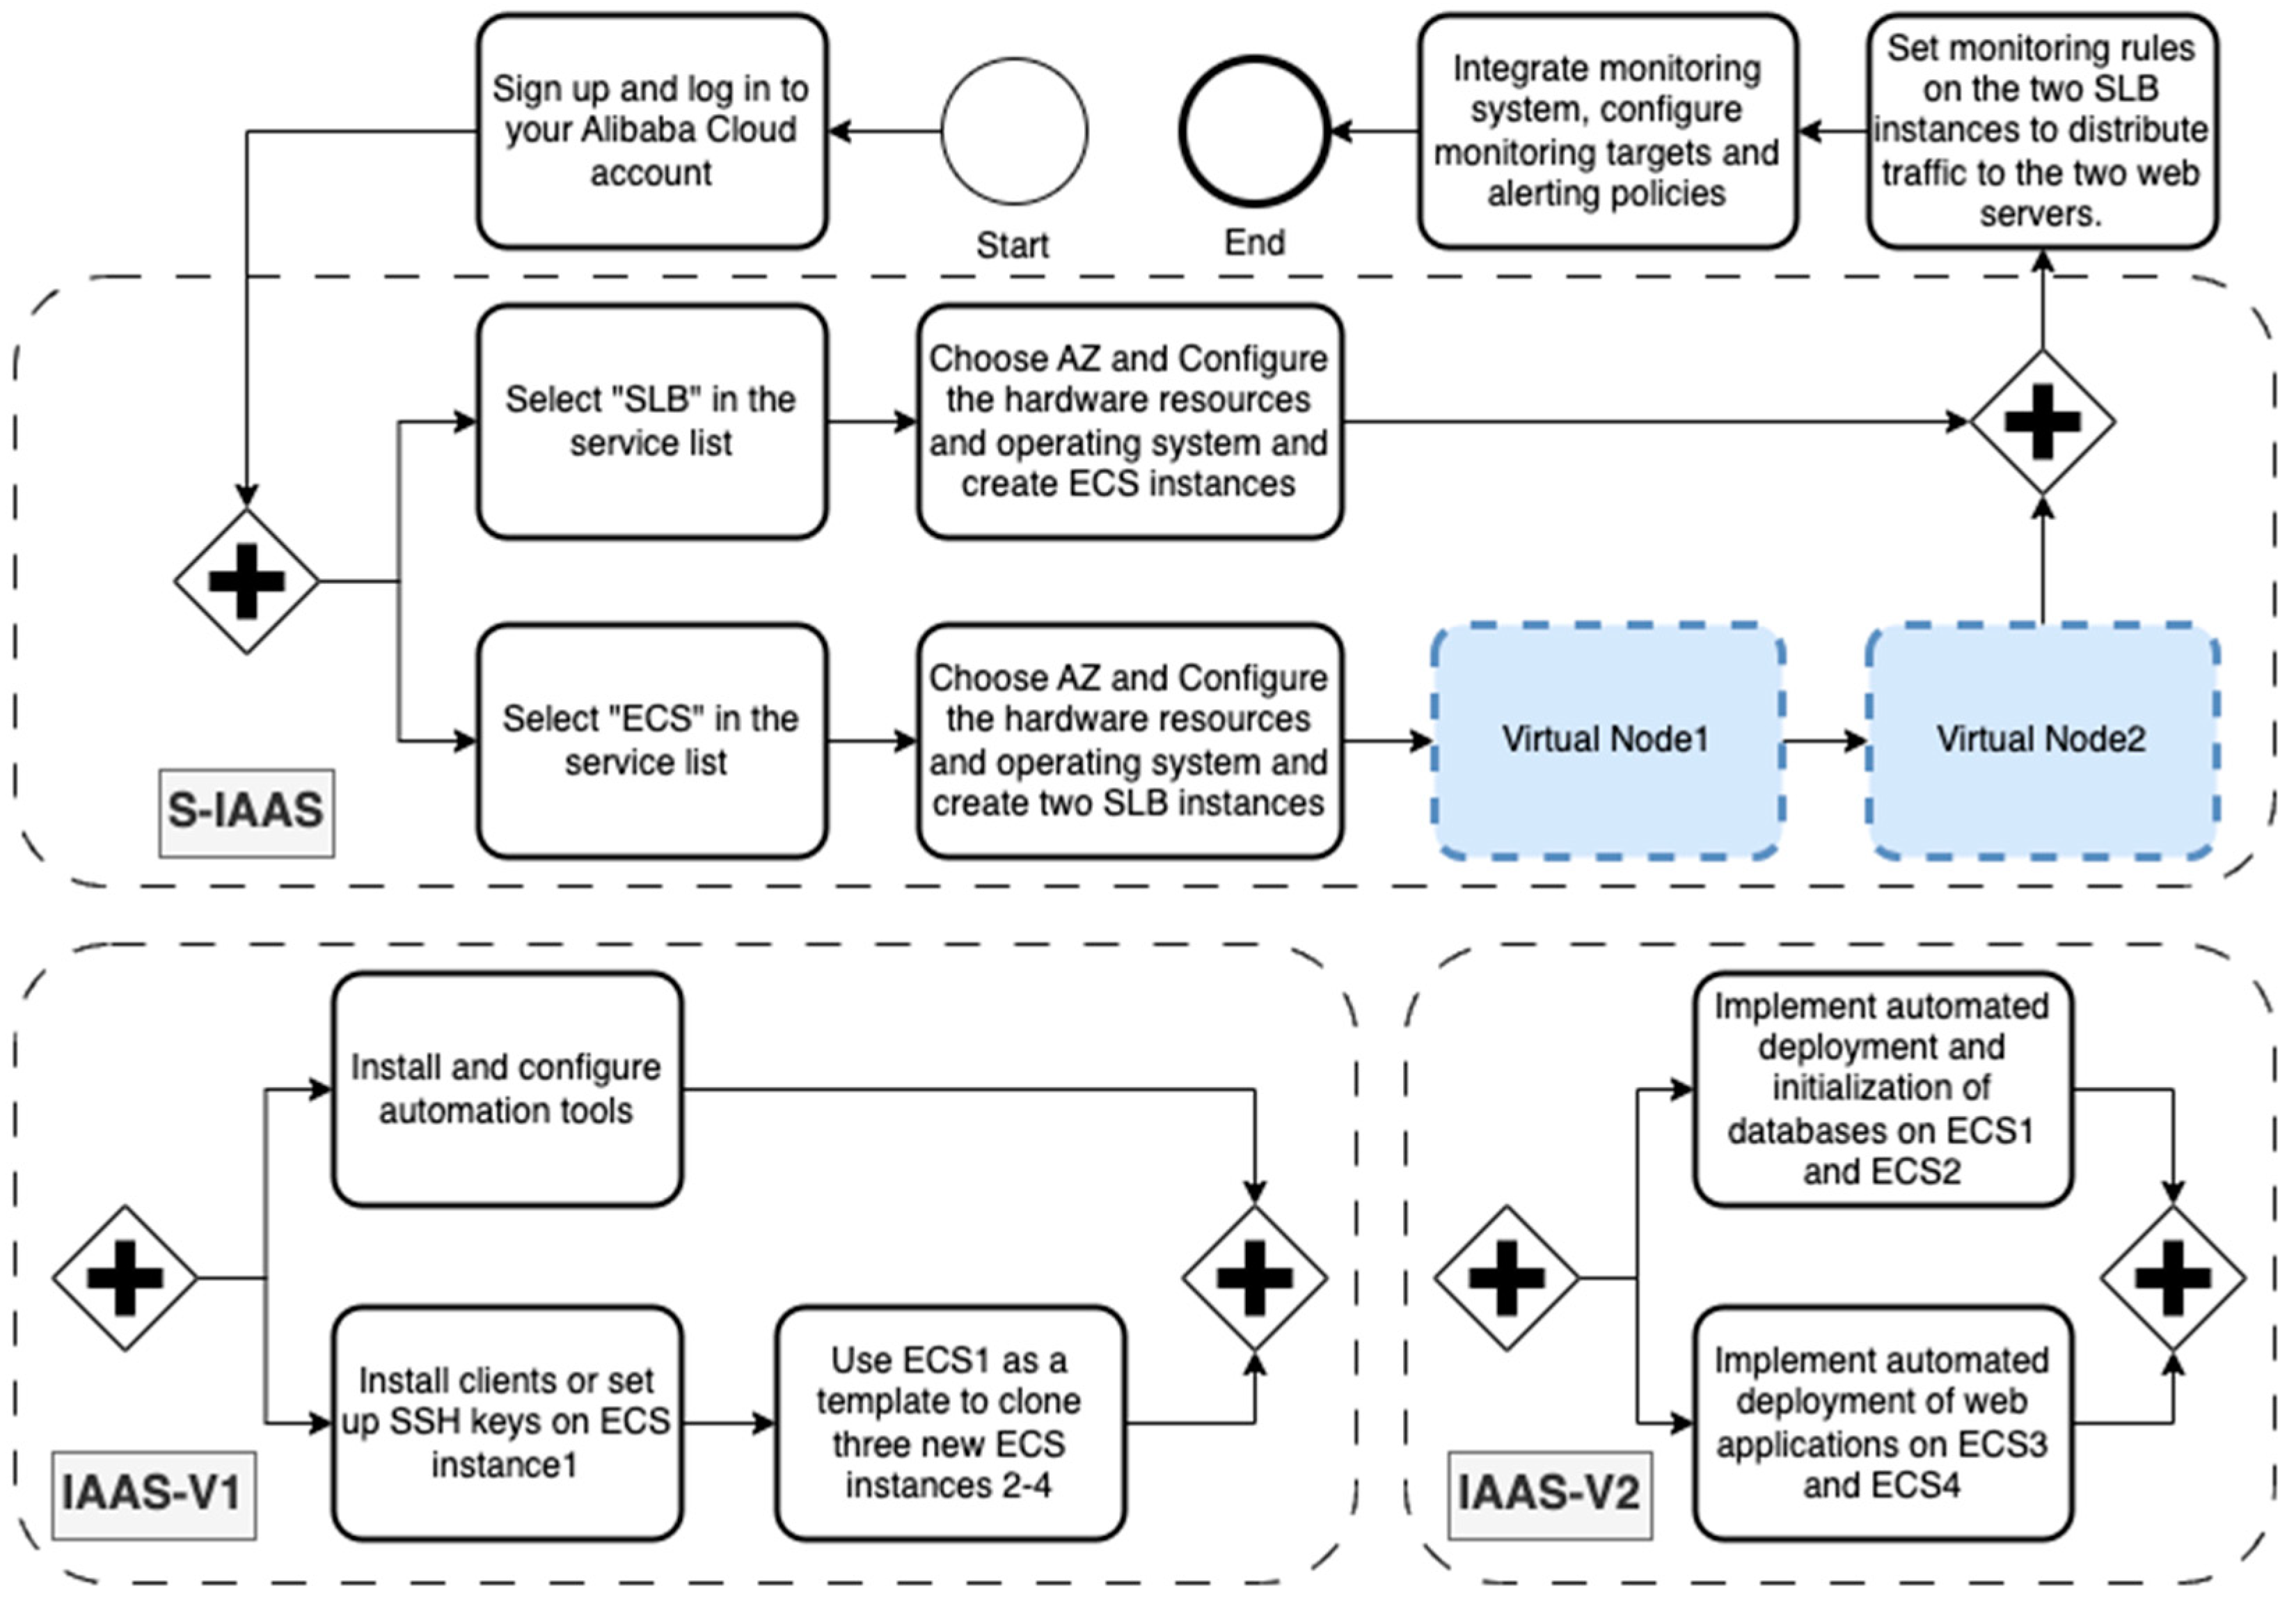
3.1. BPMN for Business Service Deployment

A process model is a representation of a process that serves as a blueprint of how a business operation is carried out. The Business Process Model and Notation (BPMN) is a standard for business process modeling, providing a graphical notation for specifying business processes in a flowchart [17]. In this study, the standard deployment model includes a Load Balancer cluster composed of two SLBs, a web service cluster consisting of two servers for handling business processes, and a relational database cluster made up of two servers in a master–slave replication configuration. Given that monitoring systems often address various business needs [53], this standard model also includes a pre-deployed monitoring system for integration with other services. Using DevOps technologies can help simplify the deployment process [54]. Therefore, during deployment operations, we utilize automation tools such as Ansible or Puppet, along with services provided by cloud platforms, to quickly clone configured servers.
We established BPMNs for four scenarios: traditional non-cloud, IaaS, PaaS, and SaaS. The analysis for each scenario is as follows:
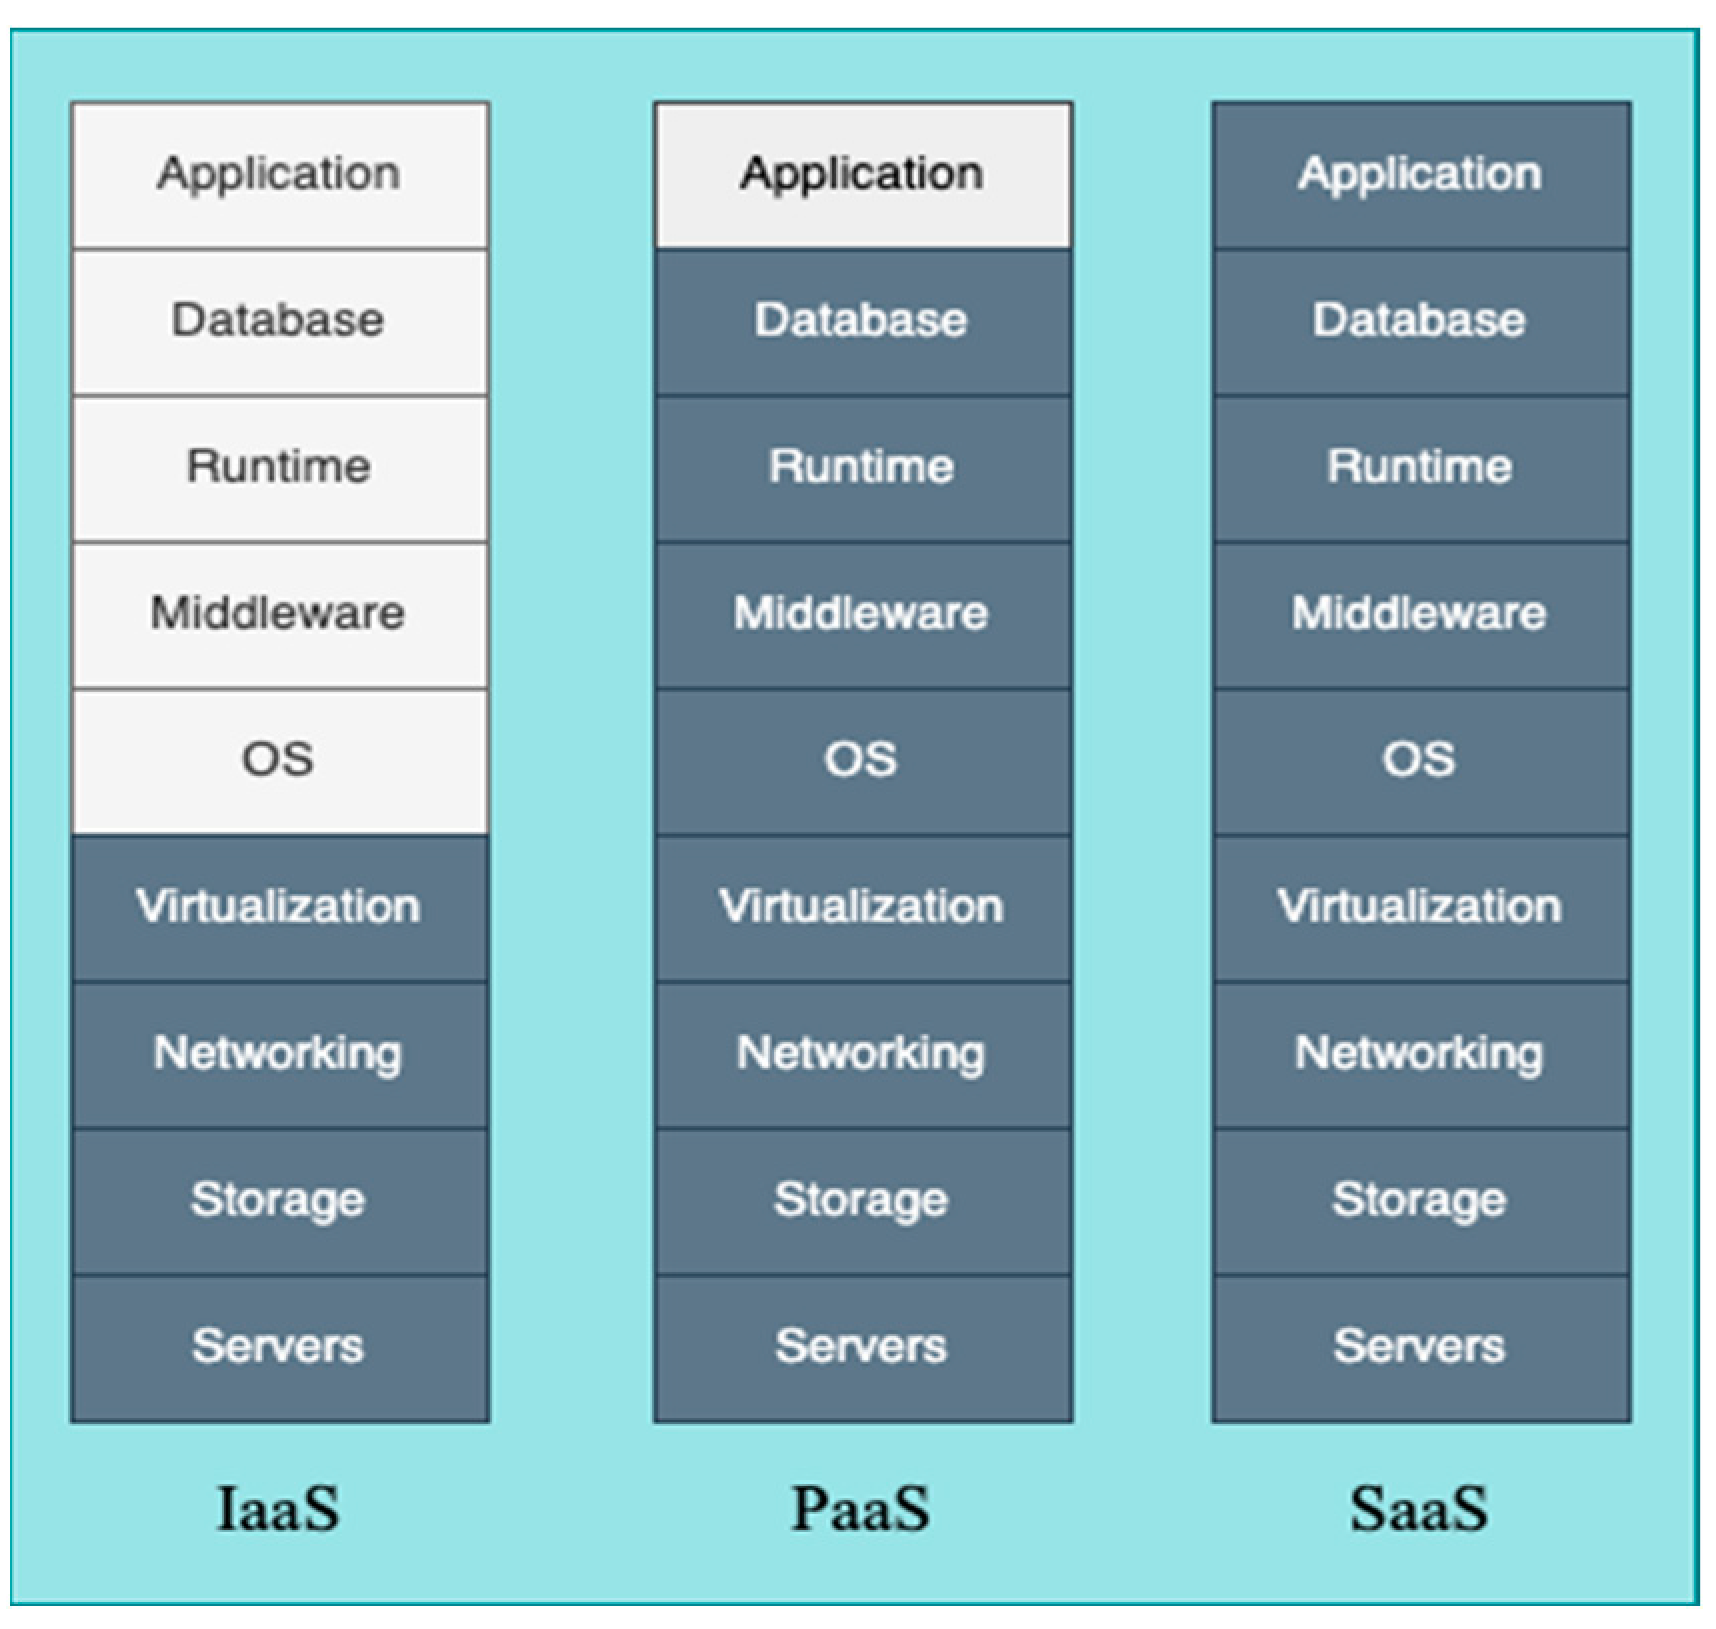
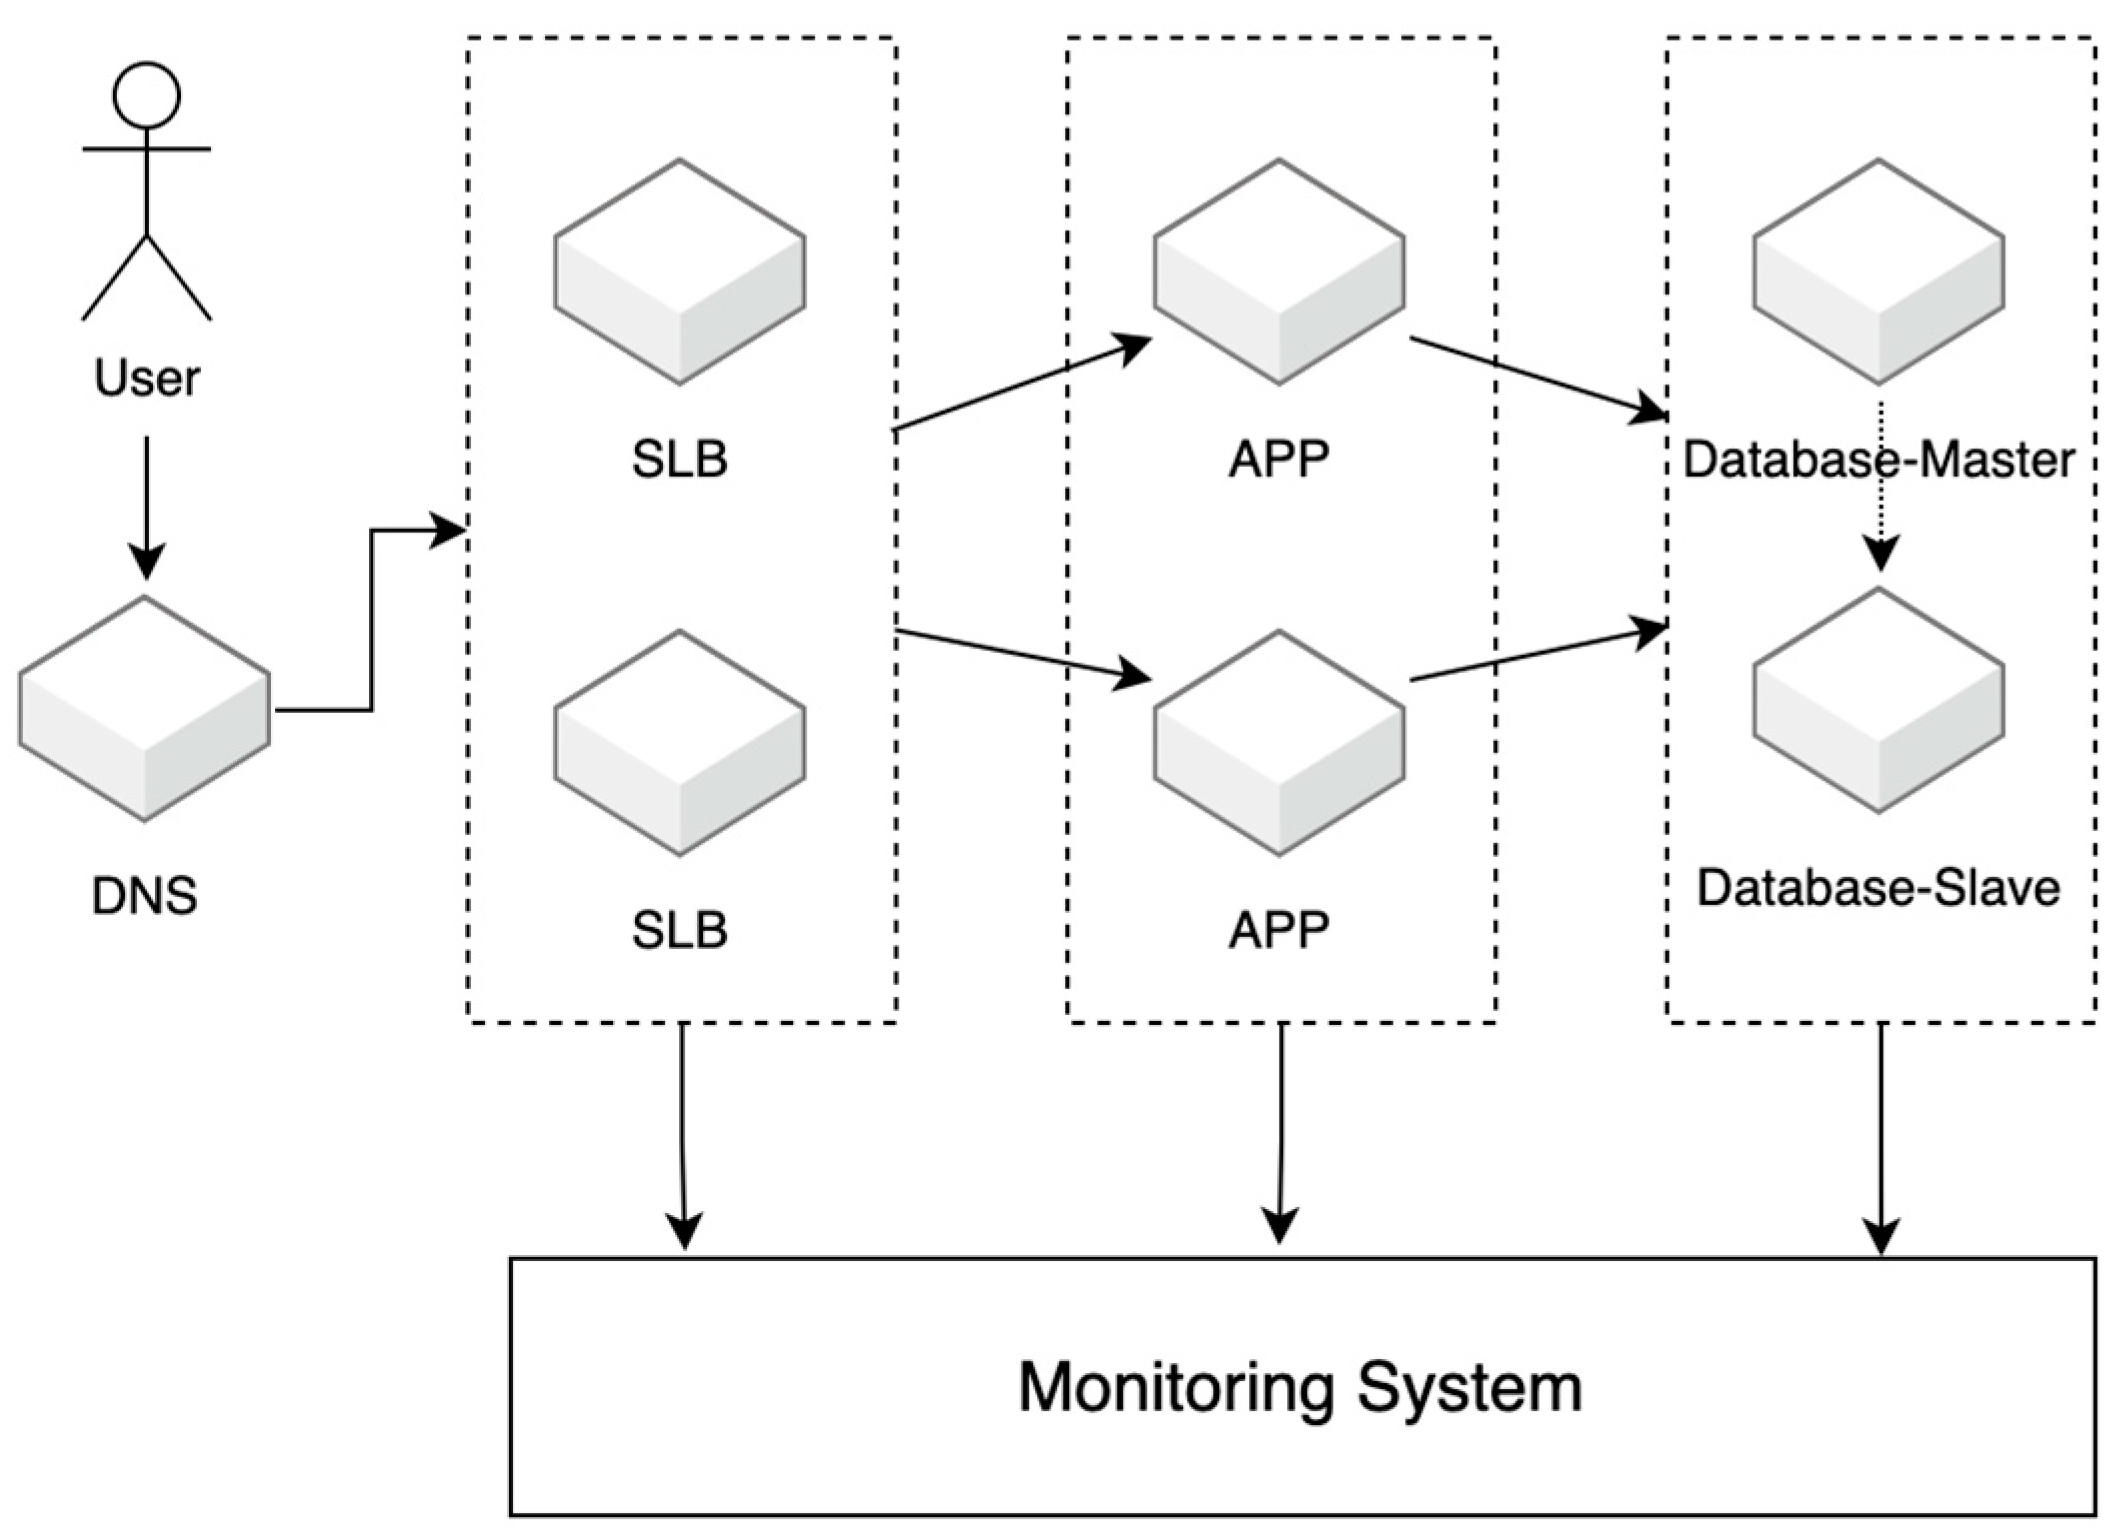
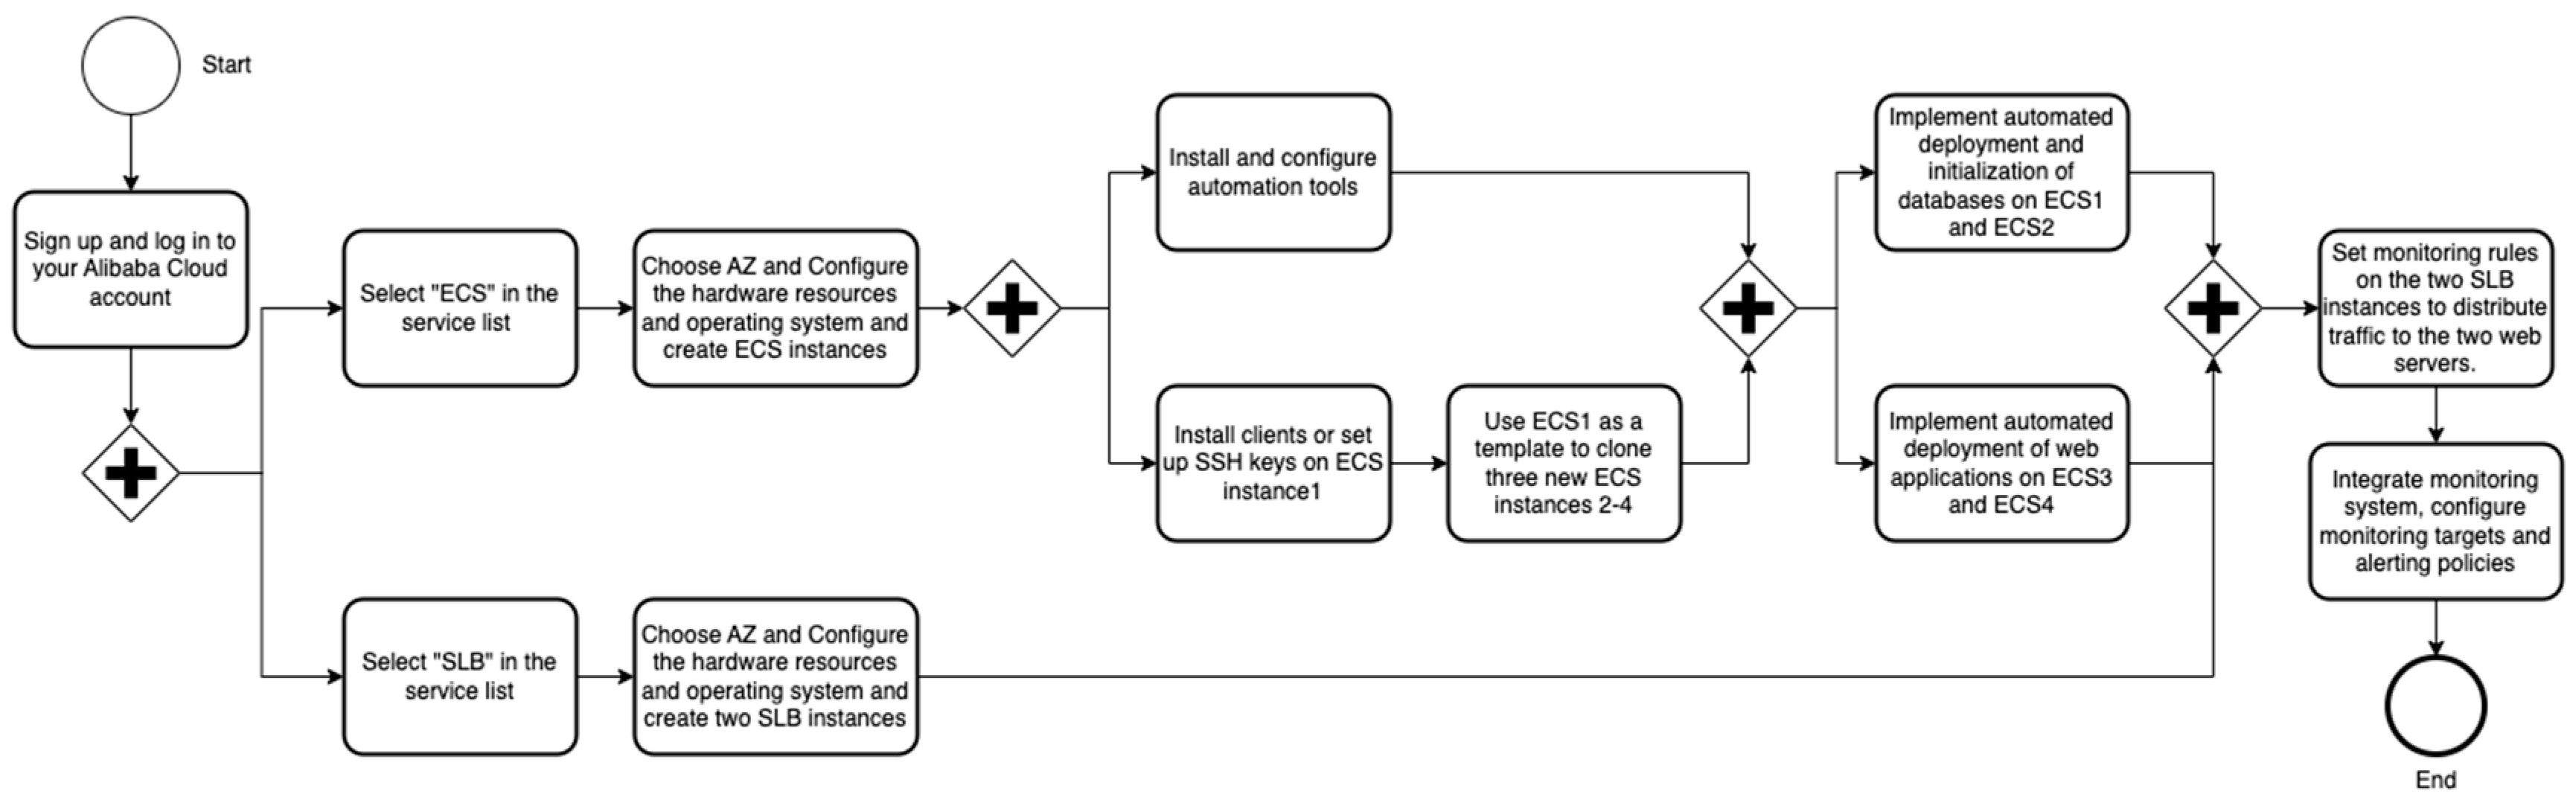
  • Non-cloud: Businesses need to complete the entire process from power supply, hardware layout, and server procurement to operating system installation and service deployment. This involves manually installing systems, configuring networks, and setting up required services on each server. While automation tools can simplify the deployment and configuration processes, the environment for these tools must be first be configured, including initializing the network, storage, and permissions on all physical servers. Additionally, since different services (e.g., SLB load balancers, application servers, and database servers) have varying deployment requirements, businesses need to write customized configuration files for each service to ensure alignment with the standard deployment model. For load balancers, application servers, and databases, high availability is considered, meaning these components are deployed in pairs.
  • IaaS: Businesses utilize Alibaba Cloud’s ECS for servers and Alibaba’s SLB for load balancing. Configured servers can be quickly cloned using features provided by cloud service providers. While automation tools can simplify the configuration of application and database servers, these tools still require initial setup. However, SLB configuration can be managed directly on the Alibaba Cloud platform, which simplifies the process compared to using automation tools.
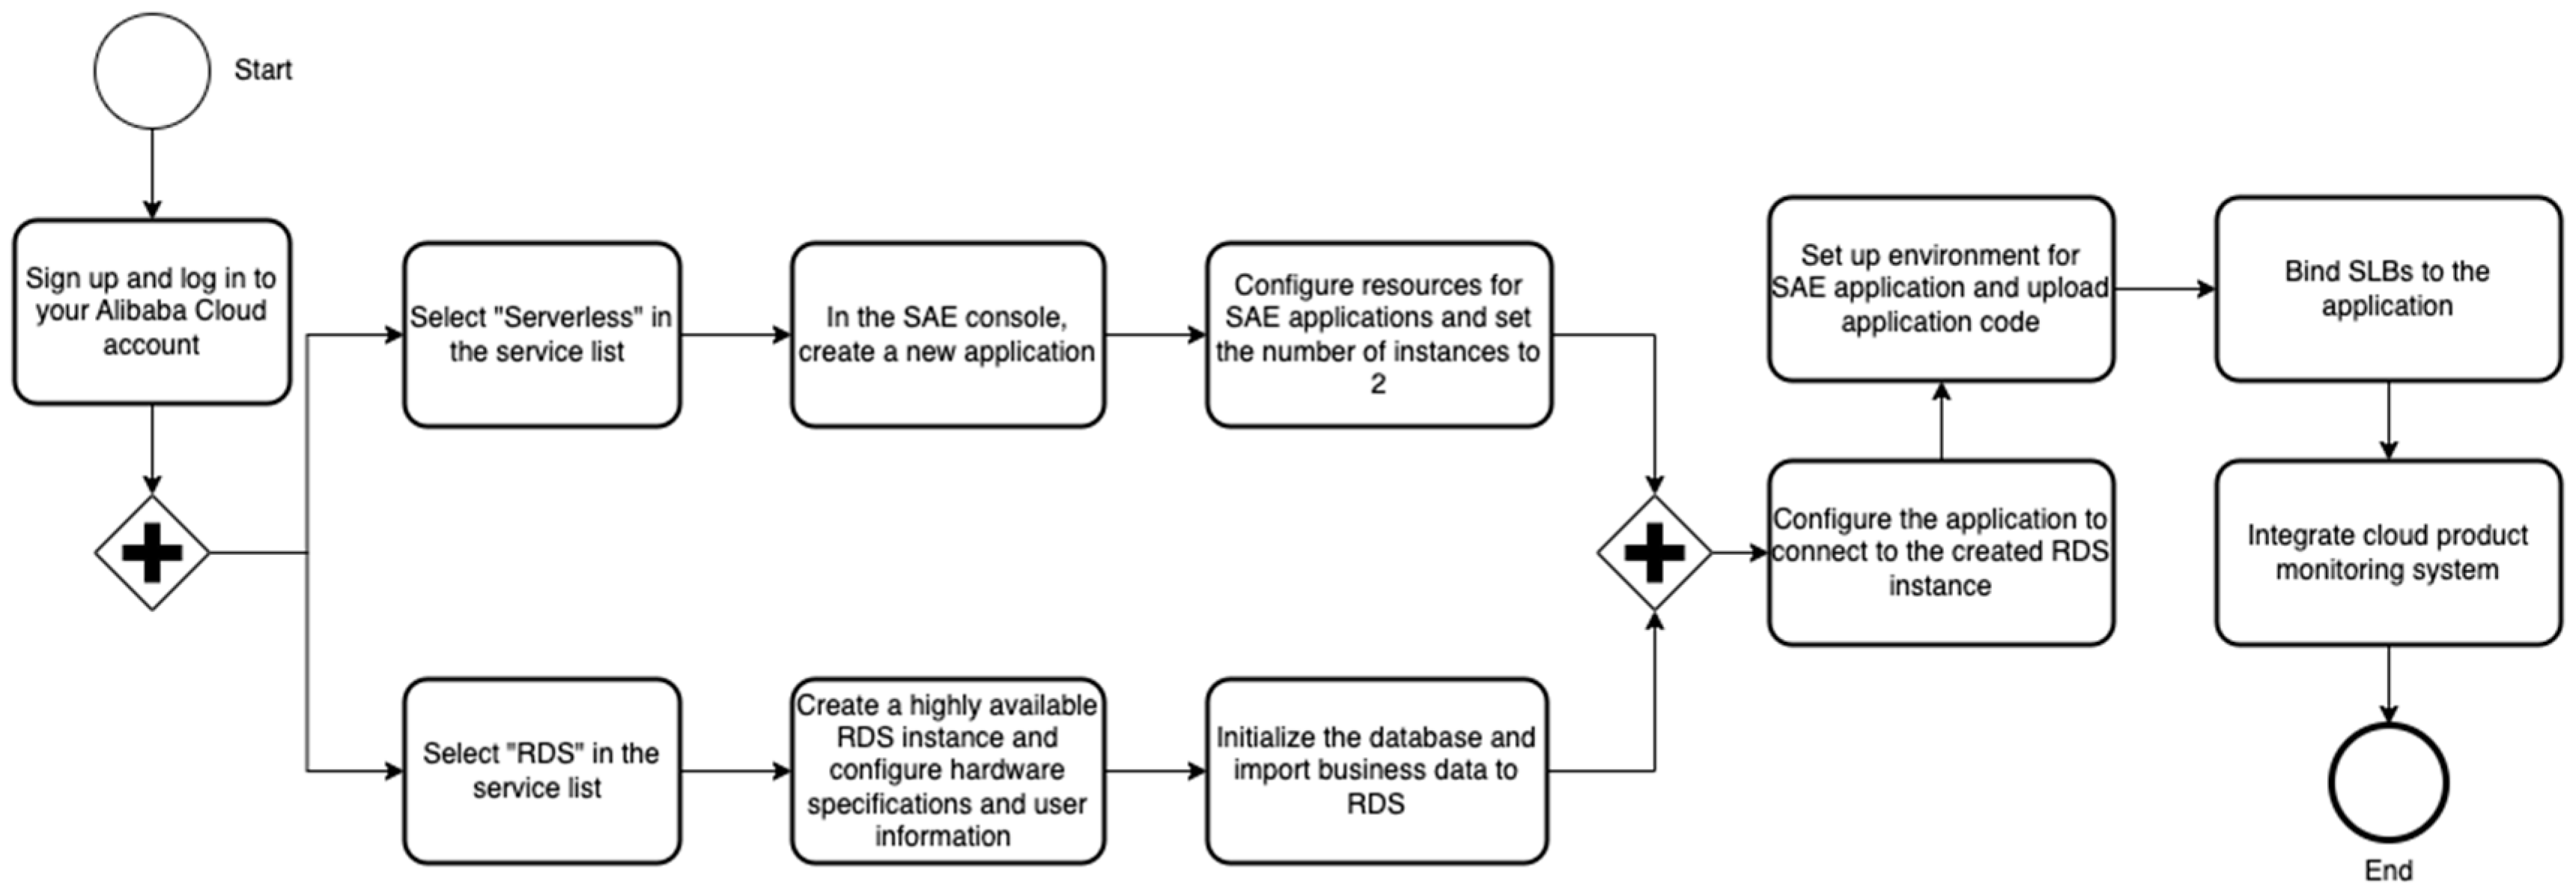
  • PaaS: Businesses use Alibaba Cloud’s Serverless App Engine (SAE) and RDS, which offer managed environments for running applications and databases, thereby reducing manual configuration. SAE simplifies high-availability setups for application servers by allowing automatic scaling through simple adjustments to server quantities on the platform. Similarly, RDS makes it easy to create high-availability database instances during the instance creation process. These tools replace the need for automation tools used in non-cloud and IaaS environments, significantly streamlining the deployment process.
  • SaaS: Due to the nature of SaaS, there is no need for specific server-level deployment or configuration. Businesses focus primarily on customization based on their specific needs, configuring the system and importing data into an already-completed platform [55]. This reduces the complexity of deployment and shifts the emphasis to application-level configurations that align with business requirements.
Based on the above analysis, we have constructed BPMNs for business deployment based on non-cloud, IaaS, PaaS, and SaaS, as shown in Figure 3, Figure 4, Figure 5 and Figure 6.

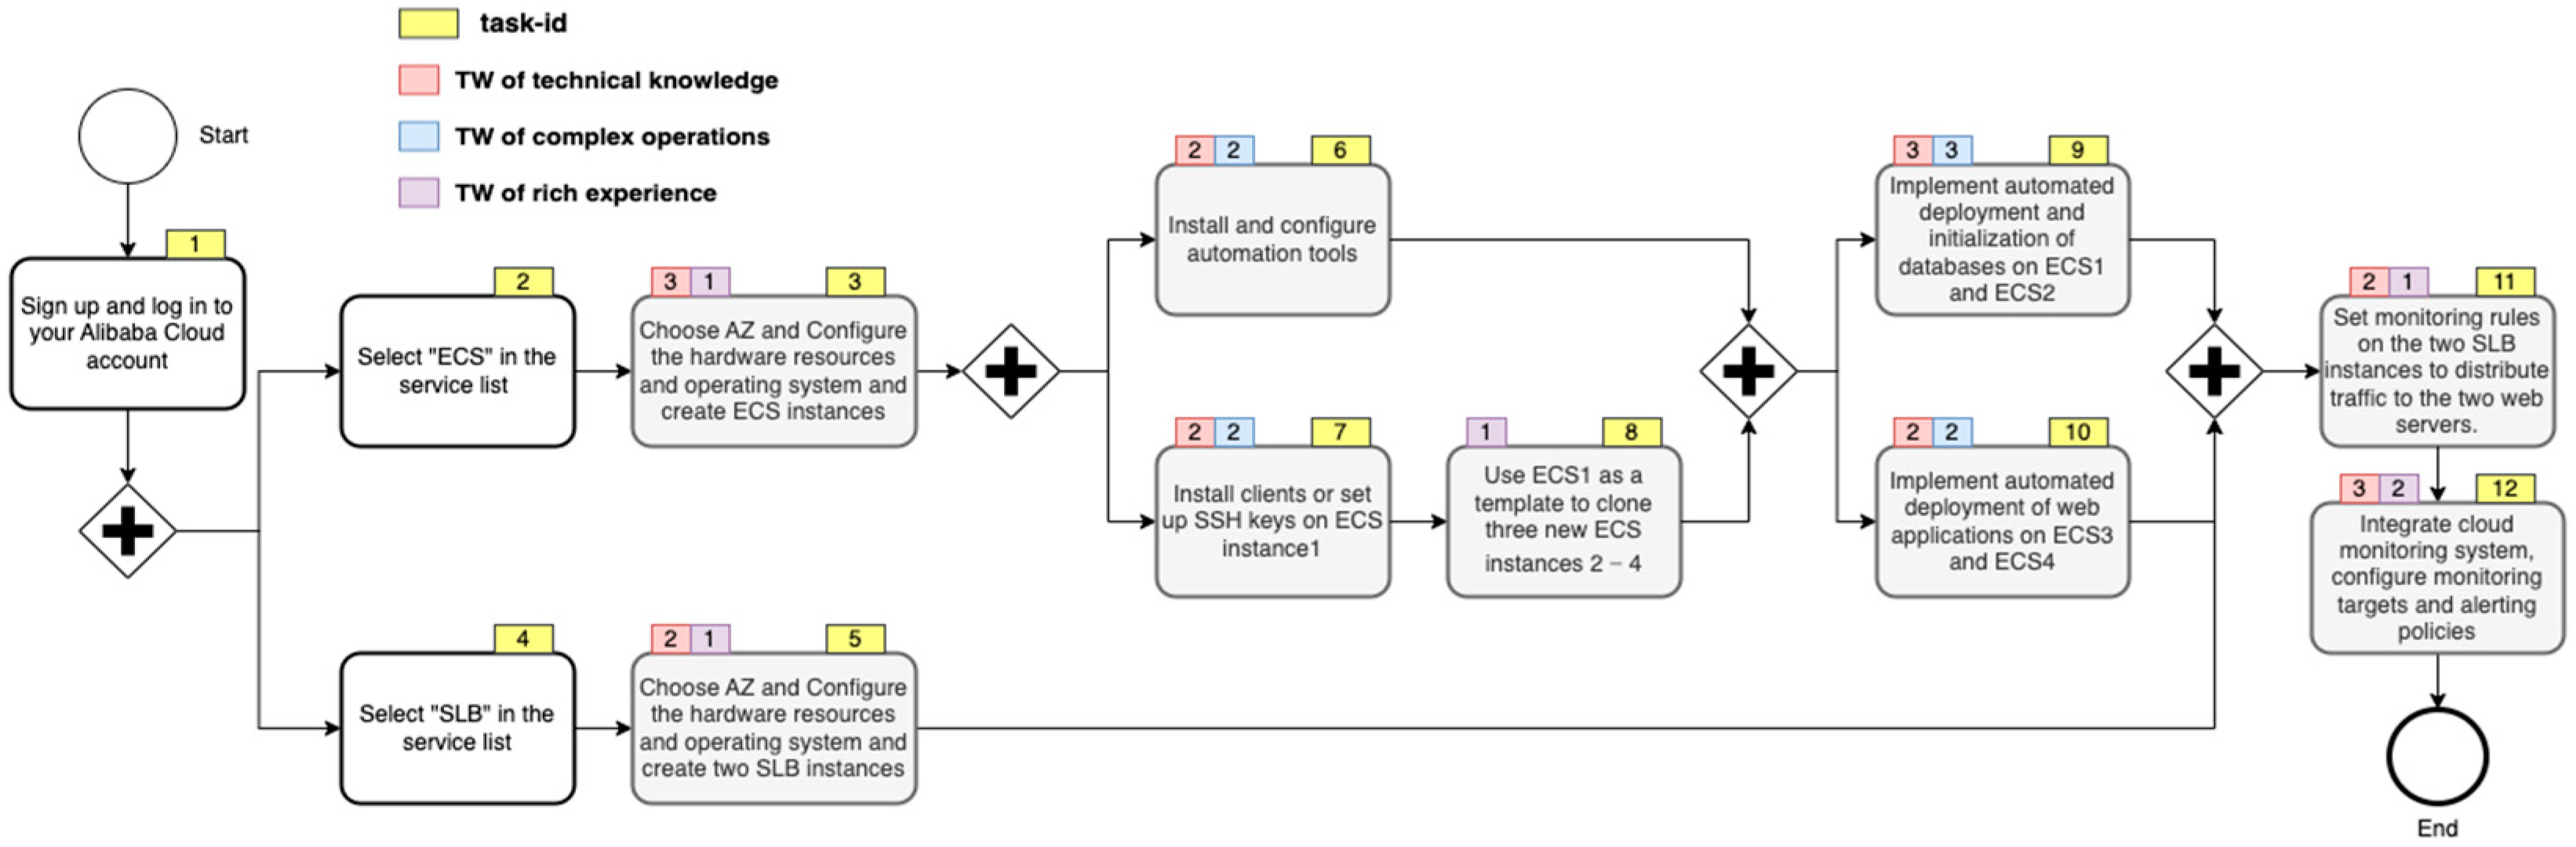
3.2. Complexity Measurement of Business Deployment

3.2.1. Method of Measurement

Business process complexity comprises several facets, including activity, control structure, resource, and cognitive complexity. Cognitive Weight (CW) introduced cognitive measures to calculate the complexity of business processes [32]. The Cross-Connectivity (CC) metric evaluates complexity by measuring the closeness of connections between activities [33]. However, these methods are limited in their ability to capture changes in the model structure. Cardoso [56] proposed the Control-Flow Complexity (CFC) algorithm to calculate the impact of different branching structures on process complexity. Nonetheless, the CFC algorithm only considers branching structures limited to AND, OR, and XOR, which presents certain limitations. Yaqin et al. [35] introduced a complexity metric, known as the Yaqin complexity formula, which is sensitive to minor alterations in structure, branching logic type, branch quantity, loops, and depth. Zhou et al. [37] proposed a new complexity measurement (CP) which emphasizes control structures and considers the influence of activity number and position within branching structures on process model complexity. This metric distinguishes between branch structure connections and defines their complexity, aiming for a more accurate reflection of changes in process model complexity.
Satisfying eight of the nine properties proposed by Weyuker [57], CP demonstrates theoretical validity. It is more sensitive to structural changes in the process model than other complexity measures, thereby more accurately reflecting the changes in process model complexity. While the Yaqin complexity formula considers structural changes and various other parameters, it is less sensitive to changes in the process model structure. Consequently, this study selects CP for complexity measurement due to its heightened sensitivity to structural changes and its more precise reflection of process model complexity.
As described in the CP formula [37], the complexity measurement formula of BPMN is as follows:
C P = C S seq + C S AND + C S XOR + C S OR + C S cyc
where C S s e q   is the sum complexities of the sequence structure, C S A N D is the sum complexity of the AND branching structure, C S X O R is the sum complexities of the XOR branch structure, C S O R is the sum complexities of the OR branch structure, C S s e q is the sum complexities of the sequence structure, and C S c y c is the sum complexities of the loop structures.
For sequence structure, the formula to measure the complexity is as follows:
C S seq = W seq N seq = N seq
where C S s e q is the complexity of the sequence structure, W s e q is the weight of the sequence structure, defined as 1, and N s e q represents the number of all nodes in the sequence structure.
The formulas for calculating the complexity of the AND, XOR branch structure are as follows:
N S AND i = j = 1 n 1 [ i = 1 N j + 1 C i j ( k = 1 j N k ) + 1 c N j + 1 1 i 1 ]
C S AND i = W AND N S AND i
N XOR i = n
C S XOR i = W XOR N S XOR i
For the branch structure i , N S is the number of sequences that activities in the structure can form, C S is the complexity of the structure, the number of the branch in the structure is represented by n , N j represents the number of activities on the j t h branch, and C m n represents its mathematical meaning in combination calculations. W is the weight of the structure, and its value varies depending on the structure type; for the AND branch structure, W A N D = 4 , and for the XOR branch structure, W X O R = 3 .
The complexity formula of the OR structure combines the structural complexity measurement formulas of AND and XOR as follows:
N S OR i = ( 1 2 n 1 1 ) N S AND i + ( 2 n 2 2 n - 1 1 n ) N S XOR i
C S OR i = W OR N S OR i = 7 N S OR i
where the complexity of the OR branch structure C S O R i is regarded as the probability combination of the two types of branch structures of AND and XOR; the probability of all branches being executed is 1 2 n 1 . In this case, the number of active sequences is the same as that of the AND structure. The rest of the cases can be regarded as the combination of active sequences of the XOR structure; the probability of each branch being executed is 1 n .
The complexity of the loop structure C S c y c is defined as follows:
C S cyc = W cyc N cyc N = 3 N cyc N
where N represents the number of all nodes in the process model and N c y c is the number of all nodes in the loop structure.
Based on the above description, we can measure the complexity of the business deployment process model of PaaS( C P P a a S ) and SaaS( C P S a a S ). However, as shown in Figure 3 and Figure 4, there are some composite structures composed of multiple AND structures in the BPMN based on non-cloud and IaaS. The measurement theory of CP proposes that calculating these combined structures requires splitting them into a single structure type and inserting a virtual node in the original structure that can replace the split node when necessary. To measure the complexity of these business models we defined, we split the structure according to the CP theory, and the results are shown in Figure 7 and Figure 8.
In Figure 7, after splitting the BPMN from Figure 3, the AND structure responsible for server configuration and OS initialization is replaced by Virtual Node 1. Similarly, the AND structures for the installation and configuration of the database, application servers, and load balancer are replaced by Virtual Node 2, Virtual Node 3, and Virtual Node 4, respectively. The structures after splitting corresponding to these virtual nodes are represented as noncloud-V1, noncloud-V2, noncloud-V3, and noncloud-V4 in Figure 7.
In Figure 8, after splitting the BPMN from Figure 4, the AND structure involving the configuration of automation tools and application servers is replaced by Virtual Node 1 and the AND structure for database configuration is replaced by Virtual Node 2. The structures after splitting corresponding to these virtual nodes are represented as IAAS-V1 and IAAS-V2 in Figure 8.
After splitting, the complexity of the non-cloud level business deployment process model can be expressed by the following formula:
C P noncloud = ( C P S noncloud + C P noncloud V 1 ) ( C P noncloud V 2 + C P noncloud V 3 + C P noncloud V 4 ) + C P noncloud seq
where C P S noncloud , C P noncloud V 1 , C P noncloud V 2 , C P noncloud V 3 , and C P noncloud V 4 are the CP complexity of the S–noncloud, noncloud–V1, noncloud–V2, noncloud–V3, and noncloud–V4 structures, respectively, and C P noncloud s e q is the complexity of the remaining sequence structure in the non-cloud business model. The complexity of the IaaS-level business deployment process model can be expressed by the following formula:
C P IaaS = C P S IaaS ( C P IaaS V 1 + C P IaaS V 2 ) + C P IaaS seq
where C P S IaaS , C P IaaS V 1 , and C P IaaS V 2 are the CP complexity of the S–IAAS, IAAS–V1, and IAAS–V2 structures, respectively, and C P IaaS seq is the complexity of the remaining sequence structure in the IaaS business model.

3.2.2. Assignment of Technical Weight

One of the primary obstacles to cloud migration for businesses lies within the technical sphere [10]. Therefore, when calculating the complexity of business migration to the cloud, it is crucial to consider technical complexity. As discussed above, certain tasks involve significant technical complexity, requiring specialized technical knowledge, complex operations, or extensive task-related experience. However, the technical complexity of these tasks is not considered during the CP-based complexity measurement [37].
To measure the dimensions of complexity, this study classifies tasks based on whether they require specific technical knowledge, complex operations, or rich experience and assigns different technical weights (TW) to these tasks.
Our definitions for specialized technical skills, complex operations, and rich experience are as follows:
  • Specialized Technical Skills (Knowledge): The technical skills required to complete tasks, primarily ICT-related skills. Specific items refer to those listed in the ESCO (European Skills, Competences, Qualifications, and Occupations) [58].
  • Complex Operations (Operations): Tasks that involve complex operational processes, such as executing more than five operating system commands, writing complex configuration files for tools, or performing operations that span multiple hosts or platforms.
  • Rich Experience (Experience): The experience or soft skills needed to complete tasks, such as management and financial skills or proficiency in configuring and operating specific public cloud platforms.
We assign TW weights to all nodes in the BPMN of the standard deployment model. The weight for specialized technical skills is TW(Knowledge), the weight for complex operations is TW(Operations), and the weight for rich experience is TW(Experience).
TW of tasks in the process model (PM) is defined as follows:
for all tasks of PM do
  TW of task is assigned to 1
  if specific technical knowledge is required do
    TW of task increments by TW(Knowledge)
  end
  if complex operations are required do
    TW of task increments by TW(Operations)
  end
  if rich experience is required do
    TW of task increments by TW(Experience)
  end
end
After the assignment of TW, the BPMN of business deployment is shown in Figure 9, Figure 10, Figure 11 and Figure 12. For specific sub-item information related to the TW assignments for each task, please refer to Appendix A.
In the complexity measurement of the business model, this study further converts the TW assigned to tasks into a sequence structure composed of a corresponding number of general tasks before performing calculations, as shown in Figure 13.

3.2.3. Post-Processing of Measurement Results

Upon completion of the CP measurement, we noticed that the results were quite large. To make these numbers more manageable for subsequent indicator construction, this study applied a logarithmic transformation to the measured results. The logarithmic transformation is a commonly used technique in data analysis to reduce the skewness of the dataset, making the data more interpretable and suitable for further analysis [59]. Importantly, this conversion does not affect the sensitivity to structural changes established by the original measurement method.
To gauge the relative complexity of enterprise cloud migration based on IaaS, PaaS, and SaaS, this study used the complexity of the non-cloud scenario as a benchmark, setting its complexity at 1, as follows:
R C noncloud = C P noncloud C P noncloud = 1
where R C noncloud is the relative complexity; this gives us a standardized baseline to compare the complexities of cloud-based scenarios. Then, this study normalized the results to convert the complexity measure into a relative complexity index. The relative complexity of cloud-based scenarios are as follows:
R C IaaS = C P IaaS C P noncloud
R C PaaS = C P PaaS C P noncloud
R C SaaS = C P SaaS C P noncloud
This normalization process is a crucial step as it allows for comparability across different deployment scenarios by transforming the complexity scores onto the same scale. The complexity measurement results of cloud-based scenarios are shown in Table 1.

3.3. Measurement of Cloud Migration Complexity Index

In the Information and Communications Technology (ICT) sector, it is crucial to recognize the significant role market size plays in promoting innovation, broadening product variety, and enhancing product functionality. Market size is directly proportional to the scope of potential demand. Larger markets entail diverse consumer needs and preferences, acting as a catalyst for firms to innovate [60]. In the face of diverse demand, companies are incentivized to develop novel solutions, technologies, and methods to meet these needs effectively. The higher volumes associated with larger markets allow firms to distribute the costs of Research and Development (R&D) over a larger number of units, reducing the cost per unit [61]. This cost reduction also encourages the creation of more diverse and feature-rich products.
Cloud computing plays a pivotal role in the field of Information and Communications Technology (ICT). The technological innovations introduced by cloud computing companies have led to the development of more advanced products, significantly reducing the complexity of business operations. For instance, Alibaba Cloud introduced Server Load Balancer (SLB) after the launch of Elastic Compute Service (ECS). Before the advent of SLB, businesses had to manually deploy load balancers such as Nginx [62] and HA Proxy [63] on ECS and carry out configurations, a process that demanded high technical skills and was significantly more complex than using SLB. Moreover, continuous improvements to products and features have lowered technical barriers for users. An example of such innovation is Alibaba Cloud’s Serverless App Engine (SAE), a PaaS offering. Launched in 2018, it was not until 2021 that it introduced the feature to support SLB HTTP protocol binding. Before this update, configuring network access for applications was considerably more complex.
Therefore, we propose to construct a cloud migration complexity index (CMCI) for businesses, incorporating the cloud migration complexity measured in Section 3.2, along with the size of China’s cloud computing market [48,64,65], as shown in Figure 14.
In the digital economy era, enterprises have a strong need to migrate to the cloud, yet they often encounter technical barriers. Reducing cloud migration complexity can effectively meet this demand, significantly promoting cloud product adoption and expanding the cloud market size. Therefore, there is a clear positive correlation between the reduction in enterprise cloud migration complexity and the growth of the cloud market.
From an economic perspective, supply and demand together shape the market. A reduction in cloud migration complexity reflects improved cloud product performance, which is a supply-side factor. However, demand-side changes must also be considered. The rapid development of the digital economy has led to a growing demand for cloud technology among enterprises, thereby increasing the cloud market size. By excluding the impact of digital economy development when calculating cloud migration complexity, we can more accurately reflect the portion of market size expansion attributable to reduced cloud migration complexity.
This paper posits that market size expansion is driven by both the reduction in cloud migration complexity, due to advancements in cloud computing technology, and the increased demand for cloud computing by enterprises. To exclude the impact of the increased demand for cloud computing from the market size, we define the cloud computing technology coefficient, excluding the influence of the digital economy, as C I . The calculation method of C I is as follows:
C I j = M S j D M j ; j { I a a S , P a a S , S a a S }
where M S is the market size of China’s public cloud and D M is the size of China’s digital economy [66,67]. As the latest features used in the business process model come from 2021, this study uses this year as a baseline to measure the reduction in cloud computing complexity brought about by the increase in cloud computing technology. The complexity reduction per cloud computing technology coefficient increase is given by D P , for which the formulas for IaaS, PaaS and SaaS are as follows:
D P IaaS = R C IaaS C I IaaS
D P PaaS = R C PaaS C I PaaS
D P SaaS = R C SaaS C I SaaS
where R C is the relative complexity measured in Section 3.2 and C I is the cloud computing technology coefficient of China’s public cloud in 2021.
Based on the D P , the complexity reduction by different cloud computing levels is given by C R , and then the annual C M C I for businesses is as follows:
C R j , t = C I j , t D P j ( M S j , t M S p , t )
C M C I t = 1 j C R j , t ; j { IaaS , PaaS , SaaS }
where j is the level of cloud computing (IaaS, PaaS, SaaS), t represents the year, M S p , t represents the market size of public cloud in China at the t th year, and C I j , t represents the cloud computing technology coefficient of public cloud at different levels (IaaS, PaaS, SaaS) in China at the t th year. The measurement results of the index are shown in Figure 15.

4. Theoretical Framework

In the contemporary dialogue surrounding digital transformation, the ease of cloud migration stands as a central determinant influencing the trajectory of enterprise evolution. Simplifying the journey to the cloud transcends mere technical enhancements; it fundamentally reshapes the enterprise’s pathway to digital maturity. When the complexities of cloud migration are reduced, enterprises are freed from the multifaceted technical impediments that traditionally serve as bottlenecks. This shift accelerates the pace of digital transformation, allowing enterprises to more quickly harness the vast capabilities inherent in cloud technologies.
Furthermore, by streamlining cloud integration, enterprises can more effectively allocate their finite resources [68]. Rather than diverting substantial manpower and financial assets toward troubleshooting and navigating complex integration challenges, they can redirect these resources toward innovation and strategic digital initiatives. This reallocation not only amplifies the pace of digital transformation but also deepens it, as enterprises can explore advanced digital functionalities earlier in their transformation journey.
Moreover, a simplified cloud migration process inherently reduces the multifarious risks associated with digital transition, from data migration anomalies to potential security vulnerabilities. The mitigation of these risks, coupled with the enhanced efficiency of resource allocation, invariably fosters a more seamless and robust digital transformation [69]. Ultimately, as enterprises navigate the labyrinth of digital metamorphosis, the clarity and simplicity of their cloud integration strategy emerge as a pivotal catalyst, driving both the pace and depth of their transformation efforts.
Based on this, this paper proposes Hypothesis 1.
Hypothesis 1.
Reducing the complexity of cloud migration can promote the digital transformation of enterprises.
In the domain of cloud computing, three prominent tiers delineate the architecture: Infrastructure as a Service (IaaS), Platform as a Service (PaaS), and Software as a Service (SaaS). Among these, the transformative potential of SaaS for enterprise digital transition is distinctly prominent. SaaS, transcending the traditional boundaries of software deployment, allows enterprises to access and utilize software applications directly over the Internet. This shift alleviates the need for intricate installations, ongoing maintenance, and the associated overheads of in-house IT infrastructure. Beyond technical convenience, SaaS introduces an operational paradigm where businesses can swiftly adapt to market changes, integrating cutting-edge functionalities without the lead time of development or the hurdles of platform integration. The subscription-based model of SaaS further aligns with contemporary business needs, offering scalability and financial flexibility, critical for businesses navigating the volatile waters of the digital age.
In contrast to IaaS and PaaS, which provide foundational and developmental capabilities, respectively, SaaS offers immediate, tangible tools and solutions, driving enterprise digital initiatives at an accelerated pace. Hence, among the three layers of cloud computing, SaaS emerges as the cornerstone, playing a pivotal role in shaping and accelerating the digital transformation of modern enterprises.
Based on this, this paper puts forward Hypothesis 2.
Hypothesis 2.
Among the three levels of cloud computing, the reduction of SaaS complexity has the greatest effect on the digital transformation of enterprises.
In the intricate milieu of enterprise digital transformation, the interplay between the scale of a business and its digital adaptability becomes a focal point of analysis. Within this context, Software as a Service (SaaS) emerges as a key catalyst, particularly for larger enterprises. These expansive entities, characterized by their vast operational networks, intricate workflows, and diverse business units, often struggle to ensure operational consistency, seamless integration, and streamlined data analytics across their domains. SaaS platforms, designed for uniform deployment and centralized management, effectively address these challenges, ensuring that digital strategies are cohesively executed and insights are uniformly derived across the enterprise [70].
Moreover, large enterprises frequently face the necessity for rapid adaptability in response to market shifts due to their operational scale. The modular nature of SaaS allows these businesses to quickly integrate and leverage new functionalities, ensuring they remain agile in an ever-evolving digital landscape. This contrasts with the often time-consuming and resource-intensive traditional software deployment processes, which can hinder the pace of digital innovation.
Additionally, the financial frameworks within which large enterprises operate often emphasize the importance of predictability and scalability. The subscription-based model intrinsic to SaaS aligns harmoniously with these financial imperatives, offering scalable solutions with predictable expenditure patterns. This financial alignment not only ensures budgetary coherence but also amplifies the return on investment from digital initiatives.
In summation, for large-scale entities navigating the complexities of the digital age, SaaS stands out as a cornerstone, not merely complementing their digital transformation endeavors but actively amplifying them. By offering solutions that address the unique challenges faced by these enterprises, SaaS ensures they remain at the forefront of digital innovation, maximizing both their operational and financial efficiencies.
Based on this, this paper puts forward Hypothesis 3.
Hypothesis 3.
For non-SMEs, SaaS plays a greater role in their digital transformation.
In the economic calculus of digital evolution, especially for small and medium-sized enterprises (SMEs), the role of Platform as a Service (PaaS) assumes pronounced significance. The digital trajectory of SMEs is often punctuated by constraints, not merely of vision or ambition but of tangible resources. Within this context, the allure of PaaS becomes evident. PaaS presents a middle ground between the foundational rigidity of Infrastructure as a Service (IaaS) and the turnkey specificity of Software as a Service (SaaS). It offers a canvas, rich with tools and frameworks yet flexible enough to be molded according to the unique digital aspirations of each enterprise [71].
For SMEs, which often operate under stringent budgetary confines, the cost implications of building and maintaining proprietary infrastructures can be daunting, if not prohibitive [72]. PaaS obviates this need, offering scalable and robust platforms without the associated capital expenditures. Moreover, the developmental agility offered by PaaS allows SMEs to prototype, iterate, and deploy digital solutions at a pace that aligns with market demands, without the financial burdens typically associated with such rapid innovation cycles.
Additionally, the modularity of PaaS ensures that SMEs pay for only the tools and services they require, allowing for a more granular control over operational expenditures. This economic efficiency, when juxtaposed with the potential revenue streams unlocked by rapid digital innovation, positions PaaS as a pivotal catalyst in the digital transformation journey of SMEs. In summary, when the digital aspirations of SMEs intersect with economic pragmatism, PaaS emerges as the most potent enabler, harmonizing cost-efficiency with transformative potential.
Based on this, this paper proposes Hypothesis 4.
Hypothesis 4.
PaaS plays the greatest role in the digital transformation of SMEs.

5. Research Design

5.1. Model Construction

To validate the impact of cloud migration complexity on enterprise digitization, this study establishes the following benchmark regression model:
d i g i , t = β 0 + β 1 C M C I t + x β x c o n t r o l s i , t + ε i , t
where i represents the enterprise, t represents the year. The dependent variable d i g i , t represents the digitization level of enterprise i in year t . The complexity index of cloud migration measured in this study is denoted as C M C I t . The control variables are represented by c o n t r o l s i , t , and ε i , t is a random disturbance term, and β 0 is a constant term. In empirical estimation, standard errors are clustered at the enterprise level. The core focus of this model is the estimated coefficient β 1 . If the coefficient of β 1 is significantly negative, it indicates that the level of enterprise digitization is inversely related to the complexity of cloud migration. A decrease in cloud migration complexity contributes to the improvement of enterprise digitization, while an increase in cloud migration complexity inhibits it. It should be noted that C M C I t will be completely collinear with the time fixed effects. Therefore, time fixed effects are not controlled in the benchmark regression model of this study. To mitigate the problem of omitted variables caused by this, this study includes macro-environmental variables such as the logarithm of per capita GDP at the prefecture-level city and the level of regional financial development in the control variables.
Given the varying impact of different levels of cloud computing on enterprise cloud migration, to further distinguish the impact of reducing complexity at each level on the degree of enterprise digitization, this study also measures the complexity reduction indicators (CR) of the IaaS, PaaS, and SaaS levels, measured in Section 3.3 and shown in Figure 14. These indicators are used to replace the enterprise cloud complexity index in the benchmark estimation, respectively. It should be noted that the core variable in the benchmark estimation is the cloud migration complexity index (CMCI), while the core variable in this part is the complexity reduction indicators of the three levels of cloud computing. As analyzed earlier, the expected coefficients of the two core variables are opposite. That is, the coefficient of CMCI is significantly negative and the coefficients of the CR of the IaaS, PaaS, and SaaS levels are significantly positive.
This study is also interested in the digitization transformation among SMEs in the context of changes in business cloud complexity. Therefore, the sample is divided into SMEs and non-SMEs for sub-sample estimation, allowing for a comparative analysis of the role of cloud migration complexity indicators in different types of enterprises’ digital transformation. Specifically, companies whose stock codes are between 002001–002999, representing listed companies in the small and medium board, are considered SMEs. Other enterprises are non-SMEs.
Endogeneity issues, characterized by a potential bidirectional causality between enterprise cloud migration complexity and digital transformation, may be present. To obtain more robust estimations, this study employs the instrumental variable (IV) method to test for robustness. The chosen instrument is the annual revenue from Alibaba’s Cloud Computing products. The rationale behind selecting the annual revenue of Alibaba’s Cloud Computing products is twofold. Firstly, Alibaba is the largest provider of cloud computing products in China, making its revenue a suitable proxy for the country’s cloud computing development. Secondly, the revenue figures for Alibaba’s cloud computing are not directly linked to the digital transformation of individual enterprises, satisfying the relevance and exogeneity assumptions of an instrument. In our empirical estimations, further tests will be conducted for weak instrument issues and under-identification, further validating the efficacy of this chosen instrument.

5.2. Variable Description

5.2.1. Dependent Variable

The dependent variable is enterprise digitization level ( d i g ). In existing research, the mainstream approach to measuring the enterprise digitization level is to use the frequency of words related to enterprise digitization in the annual reports of listed companies to characterize the degree of their transformation. We consider digitization-related keyword frequencies across ten dimensions: artificial intelligence technology, big data technology, security technology, virtual reality technology, cloud computing technology, Internet of things technology, financial technology, business models, payment methods, and digital technology applications; all keywords are listed in Appendix B. This study first downloads the annual reports of listed companies from 2012 to 2021 from the cninfo website. Next, a dictionary of enterprise digitization terms is constructed based on the digitization-related word frequency. After removing stop words, the number of occurrences of digitization level words in the full text of the annual report is counted, the degree of digitization transformation is calculated, and the index of enterprise digitization level is constructed.

5.2.2. Independent Variables

The cloud migration complexity index (CMCI) and complexity reduction indicators (CR) of the IaaS, PaaS, and SaaS are the independent variables. For the specific construction method, refer to the previous description in Section 3.3. CMCI represents the overall complexity of cloud migration, and CR reflects the complexity reduction indicator contributed by different cloud computing levels. We also measure CMCI and CR differently depending on whether or not we classify the technical complexity of the tasks in the business process model; see Section 3.2 for classification methods.

5.2.3. Control Variables

This study also needs to control the characteristic variables that may affect the level of enterprise digitization. First is the digital background variable of senior executives. The digital background of senior executives will affect the digital decision-making of the enterprise. This study uses the senior executive professional information in the personal characteristics data of the listed company’s directors and supervisors to construct a dummy variable of the senior executive’s digital background. Those who have studied specialties involving “information, intelligence, software, electronics, communications, systems, networks, automatic, wireless, computer” are considered executives with a digital background. If any executive in a listed company has a digital background, the indicator is 1; otherwise, it is 0. Secondly, the internal governance structure of the enterprise is considered, with the concentration of equity variable included in the control variables. Further, the good operating performance of the enterprise is key to ensuring continuous investment in enterprise digitization. Based on this, this study also controls important factors affecting enterprise digitization such as enterprise age, enterprise size, return on net assets, and asset–liability ratio. For further details, refer to the variable description in Table 2.
The descriptions of the main variables of this study are shown in Table 2.

5.3. Sample and Data Description

5.3.1. Research Sample and Data Source

This study selects listed companies in China’s Shanghai and Shenzhen A-shares from 2012 to 2021 as the research sample. Basic information and financial data at the enterprise level come from the Wind database, and macroeconomic data come from the annual city statistical yearbooks. The indicators used to measure the cloud migration complexity come from the measurement results in Section 3.3.
In the empirical estimation, only enterprises with normal listing status are retained, excluding ST, *ST, suspended listing, termination of listing, and enterprises in the delisting consolidation period. Considering the inherent digital characteristics of the digital industry, this study also excludes enterprises whose main business involves the digital industry.

5.3.2. Descriptive Statistics of Variables

Table 3 lists the descriptive statistical results of the main regression variables. According to the results in Table 3, the average index of the Cloud Migration Complexity Index is 0.776. The complexity of enterprise cloud migration has changed significantly from 2012 to 2021.
The average level of digitization of listed companies is 13.428. The overall digitization level of listed companies is relatively low, and there are large differences in the degree of digitization among different enterprises. Among the samples of listed companies, SMEs account for 25.3%.

6. Results

6.1. Baseline Regression

Table 4 lists the baseline estimation results of this study. The dependent variable in the estimation is the degree of enterprise digitization and the core independent variable is the CMCI. The baseline regression is listed in regression (1) of Table 4. To obtain robust estimation results, this study replaces the core dependent variables in the baseline regression with the unclassified CMCI for estimation to verify the baseline regression, and the estimation results are listed in regression (2). As shown in Table 4, there is a significant negative correlation between the CMCI and the degree of enterprise digitization. This result remains robust across different specifications of the CMCI, indicating that the decrease in CMCI significantly promotes enterprise digitization. Based on the results from the instrumental variable estimation, the p-value for the Kleibergen–Paap rk LM statistic is less than 0.01. This indicates a significant rejection of the null hypothesis of “under identification of the instrument” at the 1% level. Additionally, the Cragg–Donald Wald F statistic is significantly greater than 10, suggesting that the instrument chosen in this study is not weak. Thus, the selection of the instrumental variable is deemed appropriate. From the IV estimations, the absolute values of the coefficient are smaller than those of the baseline estimations. Therefore, both its sign and significance level are consistent with the baseline estimation. This suggests that the negative relationship between the decrease in enterprise cloud migration complexity and the enhancement of enterprise digital transformation is robust. This verifies Hypothesis 1.
To explore the role of complexity reduction in the IaaS, PaaS, and SaaS levels of cloud computing in the digital transformation of enterprises, this study uses the complexity reduction indicators of these three levels as core variables for empirical estimation. Both IV and non-IV estimations yield robust results. However, for the sake of brevity, only the outcomes of the IV estimation are presented in Table 5. The results presented in the subsequent tables are all based on the IV estimations.
In Table 5, the dependent variable is the degree of digital transformation of the firm, and the core independent variables for estimates (1)–(6) are icr, icr_tech, pcr, pcr_tech, scr, and scr_tech, respectively. From the results in Table 4, the reduction in complexity at all three levels of cloud computing (IaaS, PaaS, and SaaS) significantly promotes the digital transformation of enterprises. Among them, the reduction of complexity at the SaaS level plays the greatest role, followed by the reduction of complexity at the PaaS level. This confirms Hypothesis 2.

6.2. SMEs and Non-SMEs

To further explore the difference between the impact of CMCI on the digital transformation of SMEs and non-SMEs, this study divides the sample of listed companies into SMEs and non-SMEs for separate estimation. The estimation results are shown in Table 6. In Table 6, the core independent variable for estimates (1) and (2) is cmci, and the core independent variable for (3)–(4) is cmci_tech. Estimates (1) and (3) are the results of the estimation of SMEs, and (2) and (4) are the results of the estimation of non-SMEs. From the estimation in Table 6, the increase in enterprise cloud complexity will significantly negatively affect the degree of enterprise digitization, and this impact is greater in SMEs. This means that the digital transformation of SMEs is more affected by the complexity of cloud migration. The higher the complexity of enterprise cloud migration, the more difficult it is for SMEs to transform digitally.
The complexity reduction indicators of the IaaS, PaaS, and SaaS levels of cloud computing generally significantly promote the digital transformation of enterprises, but the specific effects vary between SMEs and non-SMEs. To verify this assertion, this paper replaces the core independent variables in the baseline regression with the complexity reduction indicators of the IaaS, PaaS, and SaaS levels of cloud computing indicators, respectively, and the estimation results are listed in Table 7.
In Table 7, the core independent variable for estimates (1) and (2) are icr_tech, those for (3)–(4) are icr_tech, and those for (5)–(6) are scr_tech. Estimates (1), (3), and (5) are the results of the estimation of SMEs, and (2), (4), and (6) are the results of the estimation of non-SMEs. From the estimation results, the complexity reduction of the IaaS and PaaS levels has a greater effect on the digital transformation of SMEs. Especially at the PaaS level, the complexity reduction indicator of this level greatly promotes the digital transformation of SMEs, but it does not significantly affect the digital transformation of non-SMEs. However, the complexity reduction of the SaaS level has a greater impact on non-SMEs firms. This result is consistent with the previous analysis and verifies Hypothesis 3 and Hypothesis 4.
This study also conducts estimations using the complexity reduction indicators of the IaaS, PaaS, and SaaS levels of cloud computing before classification. The estimation results are shown in Table 8. As shown in Table 8, the results remain robust, consistent with the findings in Table 7. This validates the effectiveness and robustness of the estimation results of this study.

7. Discussion

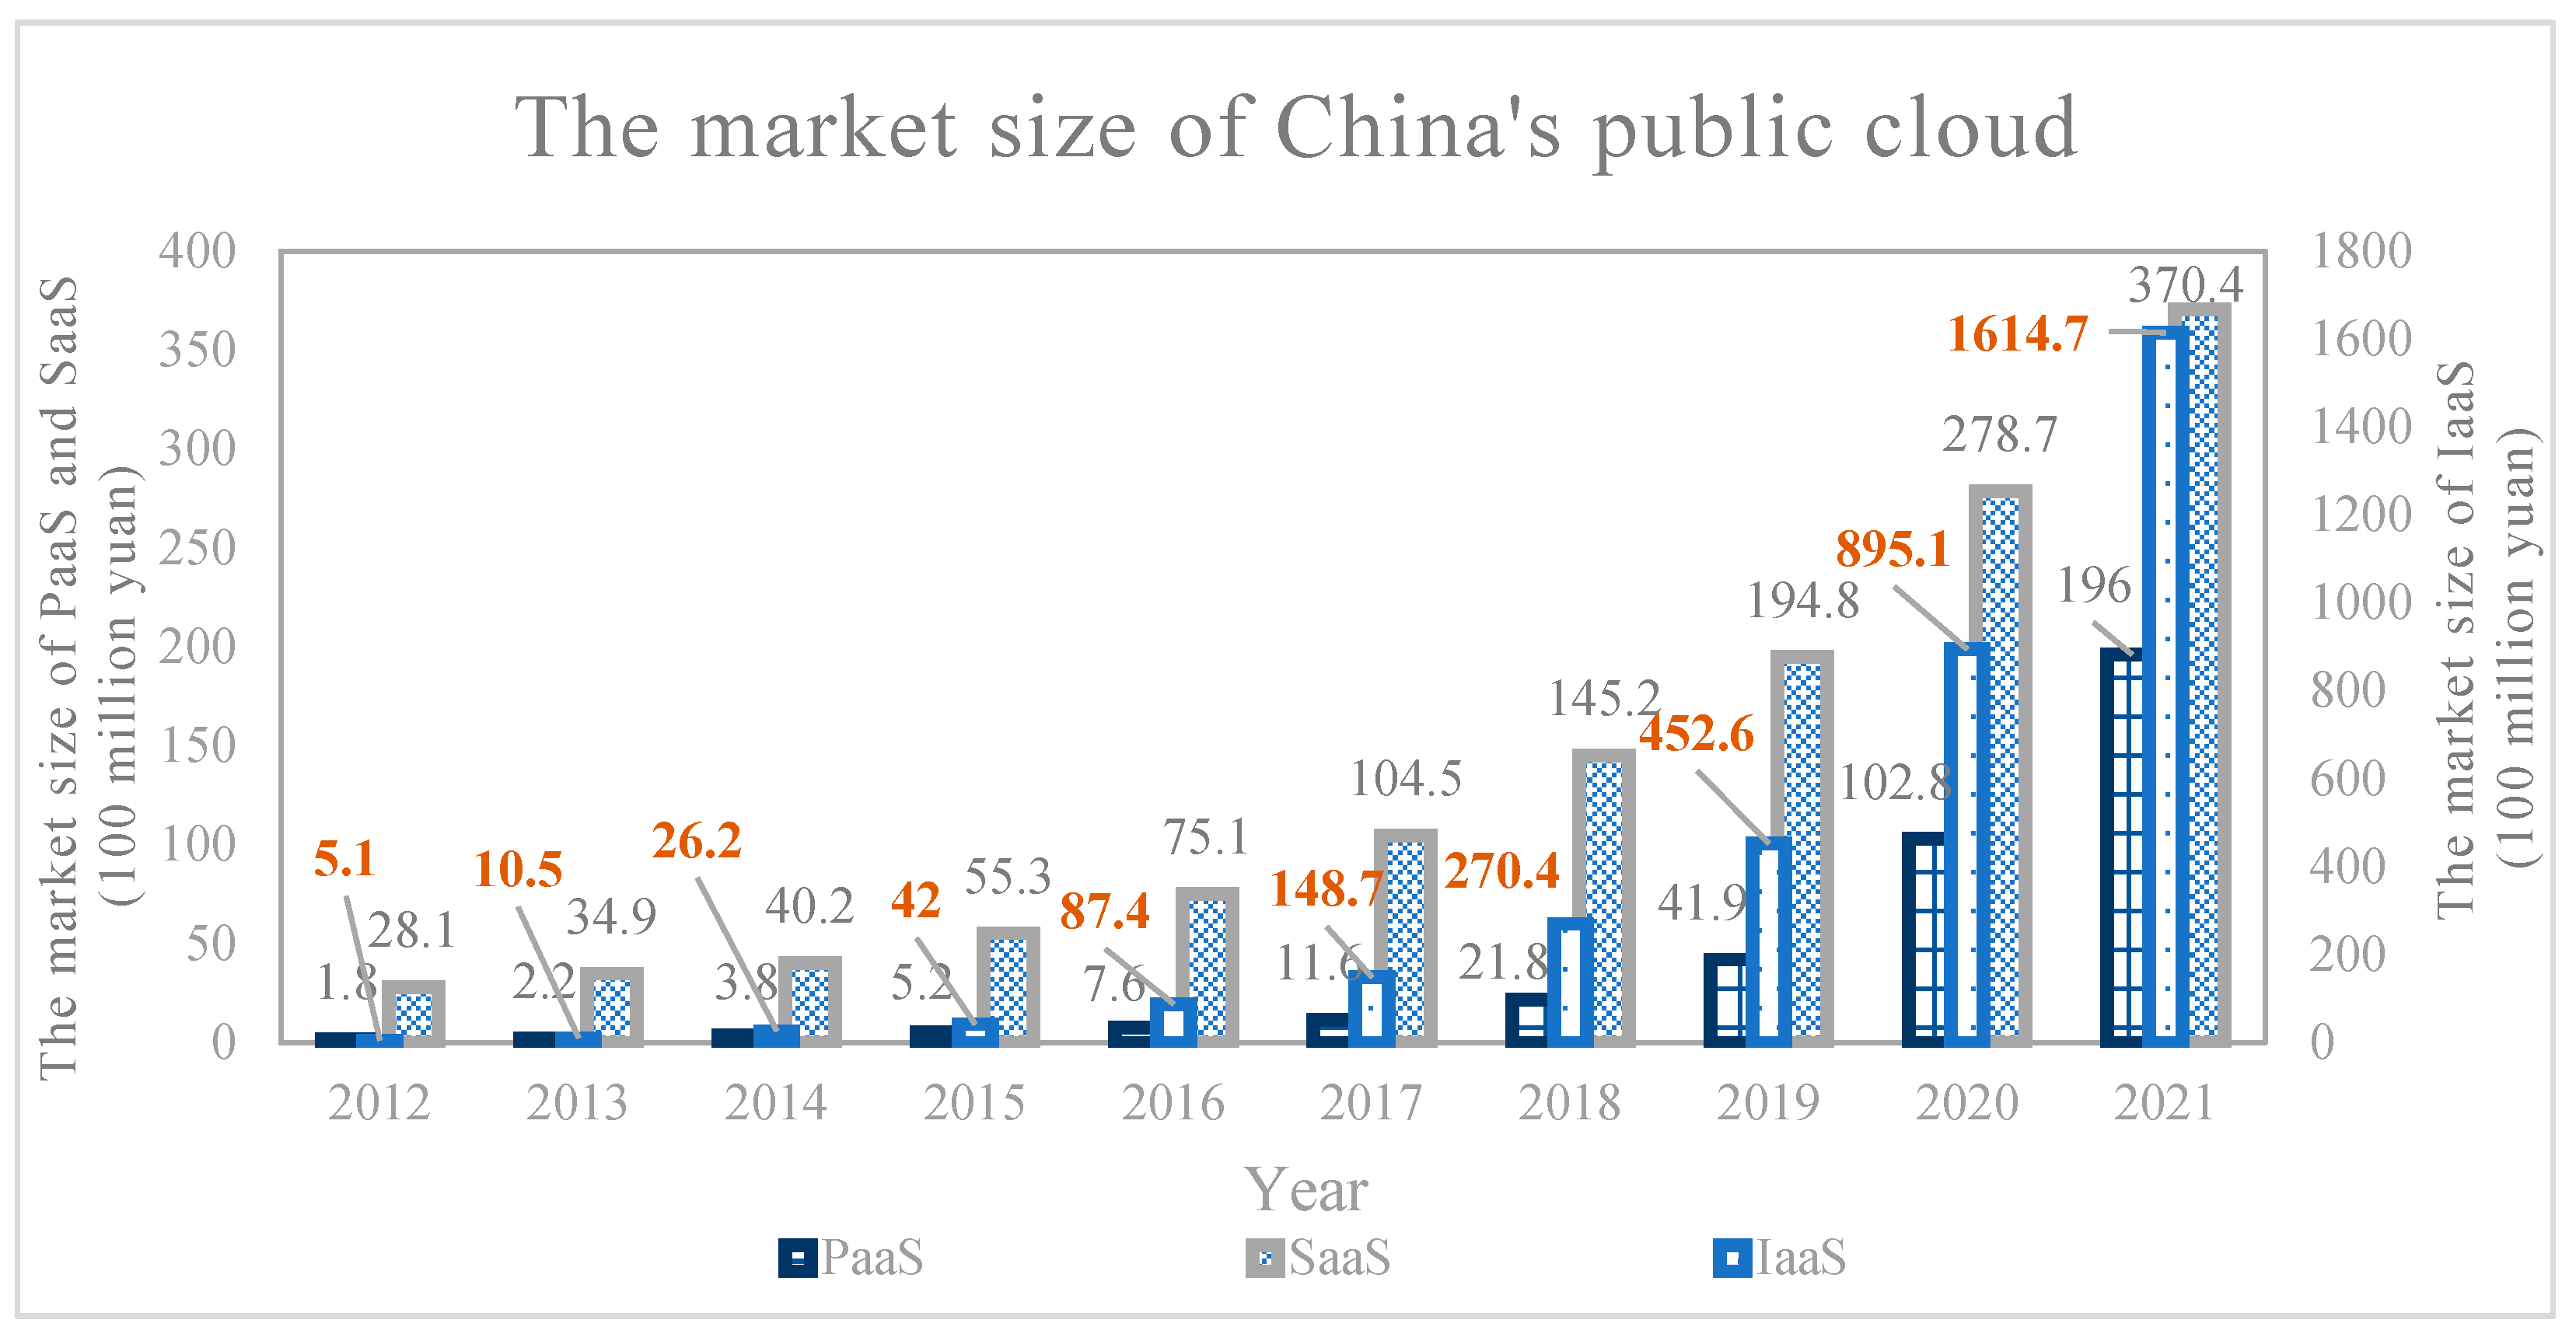
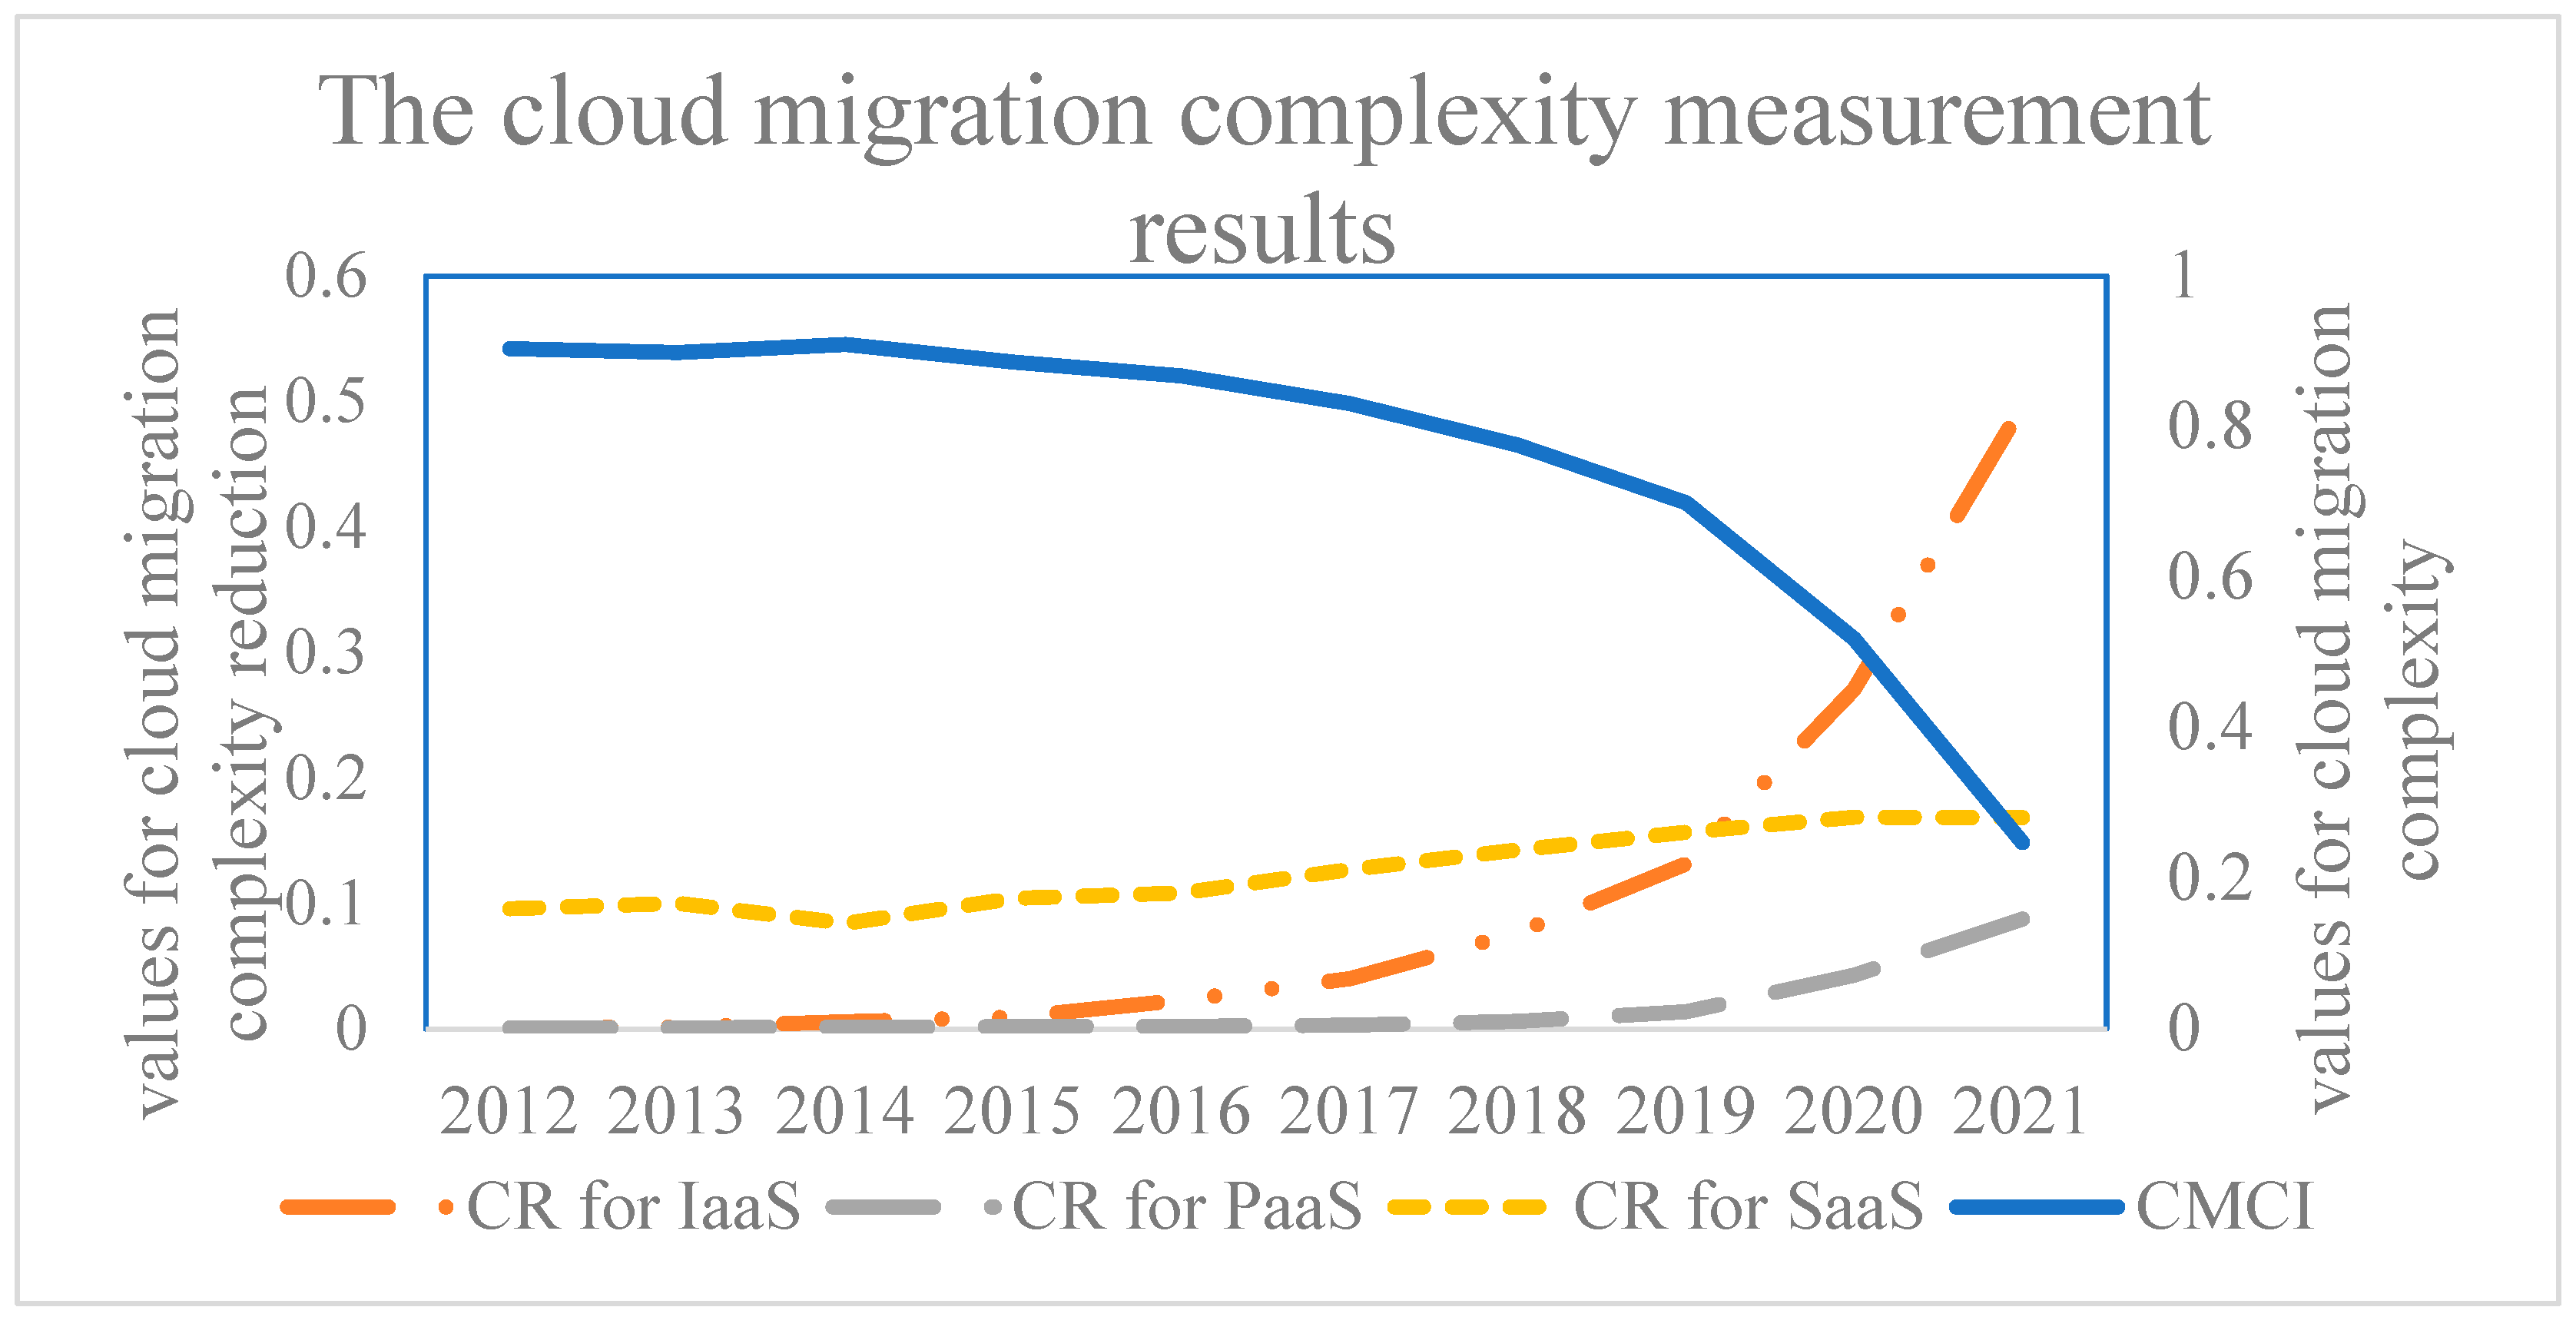
7.1. The Trend of Cloud Computing and Migration Complexity

This study measured the complexity of cloud migration and obtained the cloud migration complexity index (CMCI). Based on the measurements shown in Figure 14, several trends regarding cloud computing and migration complexity can be identified. Firstly, the complexity of cloud migration has been declining annually with the expansion of the cloud computing market. Secondly, compared to IaaS, both PaaS and SaaS exhibit significantly lower migration complexities. Moreover, while the market sizes of IaaS, PaaS, and SaaS in China are all expanding, their respective contributions to the reduction of cloud migration complexity present divergent trends. Specifically, the contributions from IaaS and PaaS have gradually increased year by year, whereas that of SaaS has declined. This trend could be attributed to the ongoing efforts of public cloud providers in China to innovate and introduce a more diverse array of products and features in the IaaS and PaaS segments. These observations are further supported by the recent growth rates of the market sizes of IaaS and PaaS, which clearly outpace that of SaaS. Simultaneously, despite PaaS’s market size in China being considerably smaller than those of IaaS and SaaS and its contribution to complexity reduction being not as significant, the growth rate it exhibits in both market size and contribution to complexity reduction cannot be overlooked.

7.2. Cloud Migration Complexity and Enterprise Digitization

Empirical studies reveal a significant negative correlation between cloud migration complexity and the digital transformation of Chinese enterprises. Firstly, the baseline estimation results in Table 4 indicate that the reduction in cloud migration complexity has a substantial positive impact on the degree of digitalization among Chinese enterprises, aligning with the expectations. Secondly, when examining the influence of cloud migration complexity on different types of enterprises, the results in Table 6 show that SMEs are more sensitive to cloud migration complexity in their digitalization efforts. Unlike large enterprises, which often have dedicated IT departments to manage cloud migration tasks, SMEs are constrained by cost limitations, making technical barriers a greater obstacle to their digital transformation journey.
The analysis of the impact of cloud migration complexity at different levels (IaaS, PaaS, SaaS) demonstrates that the reduction of complexity at each level significantly contributes to digitization of the enterprise. The results in Table 5 indicate that the most substantial impact is observed for the reduction in complexity related to SaaS migration, followed by PaaS. For many enterprises and employees responsible for cloud migration tasks, IaaS-based migration still demands special technical knowledge, operational skills, and experience. In contrast, PaaS and SaaS-based migration require lower technical expertise.
The estimated results of the impact of different cloud computing levels on SMEs and non-SMEs shown in Table 7 show that all three levels contribute significantly to promoting digitalization among SMEs. Notably, unlike the estimated results for non-SMEs, PaaS has the most profound impact on the digitization of SMEs, surpassing the impact of SaaS on SMEs. This discrepancy from the estimation results for all enterprises can be attributed to the cost considerations. For SMEs, adopting SaaS solutions can be costlier due to customization for specific business needs, resulting in higher expenses. Conversely, cloud computing providers share the R&D costs of general PaaS products among all users, making PaaS the most cost-effective and least complex option for SMEs to embrace the cloud.
Lastly, the robust regression results shown in Table 8 support the validity and reliability of the constructed enterprise cloud migration complexity index, confirming its effectiveness in measuring the impact of cloud migration complexity on digitalization.

8. Conclusions

This paper explored the critical role of cloud computing in enterprise digital transformation, especially from the perspective of cloud migration complexity. Based on the detailed investigation of cloud computing and enterprise data in China, this study revealed the significant role that cloud migration complexity plays in the process of enterprise digitalization. This study constructed business process model based on the non-cloud scenario and three cloud-based scenarios (IaaS, PaaS, SaaS), and measured their complexities after assigning the technical weight. Combining with the market data of the public cloud in China, the enterprise cloud migration complexity index (CMCI) was measured and used in the empirical research on the relationship between enterprise cloud migration complexity and enterprise digitalization. The empirical results validate the significant impact of cloud migration complexity on the degree of enterprise digitalization. Among the three levels of cloud computing, the complexity of SaaS level has the greatest impact on enterprise digitalization. In addition, compared with non-SMEs, the digitalization degree of SMEs is more affected by cloud migration complexity, among which, the complexity of PaaS has the greatest impact on the digitalization degree of SMEs.
Given the lack of technical departments and talent reserves in SMEs and their more likely encounter with technical thresholds in the process of digitalization, this study suggests that the government should formulate policies to further expand the PaaS market. Although the market scale of PaaS has been increasing in recent years in China, its overall market scale still has a considerable gap compared with IaaS and SaaS. PaaS, like IaaS, can provide enterprises with a general technology platform, but its technical complexity is much less for users. Cloud computing providers should launch more PaaS-based products, especially cloud-native products. Enterprises need to actively embrace cloud computing and give priority to using PaaS-based cloud computing products and functions. In this way, a better cloud migration solution can be found no matter in terms of technical cost or economic cost.
The limitations of this research lie in the fact that there is currently no fixed model or paradigm for business cloud migration. This paper constructs the complexity index based on a typical business deployment model, which introduces certain limitations. Future research could focus on developing a standardized business cloud migration paradigm, which will help to more accurately measure various obstacles that enterprises encounter in the process of cloud migration and potentially reduce the complexity of the cloud migration process.

Author Contributions

Conceptualization, W.W. and Q.Y.; methodology, W.W., C.Z. and Q.Y.; software, W.W.; validation, W.W. and C.Z.; formal analysis, W.W., C.Z. and Q.Y.; investigation, W.W.; resources, Q.Y.; data curation, W.W. and Q.Y.; writing—original draft preparation, W.W. and Q.Y.; writing—review and editing, Q.Y.; supervision, Q.Y.; funding acquisition, C.Z. and Q.Y. All authors have read and agreed to the published version of the manuscript.

Funding

This work was funded by the National Natural Science Foundation of China (No. 71903037), the Hubei Provincial Social Science Foundation (No. HBSKJJ20233228) and the Fundamental Research Funds for the Central Universities (No. 2722022EK079).

Institutional Review Board Statement

Not applicable.

Informed Consent Statement

Not applicable.

Data Availability Statement

Data are available on request.

Conflicts of Interest

The authors declare no conflicts of interest.

Appendix A

Table A1. Task TW assignment criteria for non-cloud model: specific items for knowledge, operations, and experience.
Task_idKnowledgeOperationsExperienceTW
1ICT infrastructureNoneBusiness management3
2ICT infrastructureNoneBudget management3
3Network engineering, power engineeringNoneNone3
4Network engineeringNoneNone2
5–10Operating systems, network engineeringOperating system commandsNone4
11Operating systems, DevOpsOperating system commands,
configure automation tool
None5
12–17Operating systems, DevOpsOperating system commands,
cross-server interaction
None6
18DevOps, database, SQLWriting and executing automation scripts, configuring master–slave replication, cross-server interactionNone7
19DevOps, web servicesWriting and executing automation scripts, cross-server interactionNone5
20DevOps, proxy servers, network engineeringWriting and executing automation scripts, cross-server interactionNone6
21Monitoring tools, operating systems, ICT infrastructureConfiguring specific monitoring targets, cross-server interactionIncident management7
Table A2. Task TW assignment criteria for IaaS model: specific items for knowledge, operations, and experience.
Task_idKnowledgeOperationsExperienceTW
1NoneNoneNone1
2NoneNoneNone1
3Network engineering, ICT infrastructure, operating systemsNoneCloud platform configuration4
4NoneNoneNone1
5Operating systems, network engineeringNoneCloud platform configuration4
6Operating systems, DevOpsOperating system commands,
configure automation tool
None5
7Operating systems, DevOpsOperating system commands,
cross-server interaction
None5
8NoneNoneCloud platform configuration2
9DevOps, database, SQLWriting and executing automation scripts, configuring master–slave replication, cross-server interactionNone7
10DevOps, web servicesWriting and executing automation scripts, cross-server interactionNone5
11Proxy servers, network engineeringNoneCloud platform configuration4
12Cloud monitoring and reporting, operating systems, ICT infrastructureNoneCloud platform configuration, incident management6
Table A3. Task TW assignment criteria for PaaS model: specific items for knowledge, operations, and experience.
Task_idKnowledgeOperationsExperienceTW
1NoneNoneNone1
2NoneNoneNone1
3NoneNoneNone1
4Web servicesNoneCloud platform configuration3
5NoneNoneNone1
6ICT infrastructure, databaseNoneCloud platform configuration4
7SQLNoneNone2
8NoneConfigure applicationNone2
9NoneNoneCloud platform configuration2
10Network engineeringNoneCloud platform configuration3
11Cloud monitoring and reportingNoneCloud platform configuration, incident management4
Table A4. Task TW assignment criteria for SaaS model: specific items for knowledge, operations, and experience.
Task_idKnowledgeOperationsExperienceTW
1NoneNoneNone1
2NoneNoneNone1
3Web servicesNoneNone2
4Business intelligenceNoneNone2
5NoneNoneCloud platform configuration2
6NoneNoneNone1

Appendix B

Table A5. Digitization-related keywords.
DimensionKeywords
Artificial intelligence technologyartificial intelligence, machine learning, deep learning, intelligent robot, natural language processing, cognitive computing, brain-like computing, intelligent data analysis, image interpretation, face recognition, speech recognition, biometric technology, automatic driving
Big data technologybig data, data mining, text mining, data visualization, business intelligence, semantic search, heterogeneous data
Security technologyauthentication, blockchain, multi-party security computing, differential privacy technology
Virtual reality technologyaugmented reality, mixed reality, virtual reality
Cloud computing technologycloud computing, stream computing, graph computing, memory computing, distributed computing, fusion architecture, hundred million concurrence, EB level storage, green computing
Internet of things technologythe Internet of things, smart wear, smart home, Internet connection, information physics system
Financial technologyinvestment decision support system, credit investigation, digital currency, Internet finance, digital finance, Fintech, financial technology, quantitative finance, open banking
Internet business modelsmobile Internet, industrial Internet, internet medical, E-commerce, B2B, B2C, C2B, C2C, O2O
Payment methodsmobile payment, third-party payment, NFC payment
Digital technology applicationssmart energy, smart agriculture, smart transportation, smart medical, smart customer service, smart culture and tourism, smart environmental protection, smart grid, smart marketing, digital marketing, unmanned retail, smart building

References

  1. Mithas, S.; Tafti, A.; Bardhan, I.; Goh, J.M. Information technology and firm profitability: Mechanisms and empirical evidence. Mis Q. 2012, 36, 205–224. [Google Scholar] [CrossRef]
  2. Verhoef, P.C.; Broekhuizen, T.; Bart, Y.; Bhattacharya, A.; Dong, J.Q.; Fabian, N.; Haenlein, M. Digital transformation: A multidisciplinary reflection and research agenda. J. Bus. Res. 2021, 122, 889–901. [Google Scholar] [CrossRef]
  3. Venters, W.; Whitley, E.A. A critical review of cloud computing: Researching desires and realities. J. Inf. Technol. 2012, 27, 179–197. [Google Scholar] [CrossRef]
  4. Mell, P.; Grance, T. The NIST Definition of Cloud Computing (Draft). NIST Spec. Publ. 2011, 800, 145. [Google Scholar]
  5. Bhardwaj, S.; Jain, L.; Jain, S. Cloud computing: A study of infrastructure as a service (IAAS). Int. J. Eng. Inf. Technol. 2010, 2, 60–63. [Google Scholar]
  6. Gill, S.S.; Tuli, S.; Xu, M.; Singh, I.; Singh, K.V.; Lindsay, D.; Tuli, S.; Smirnova, D.; Singh, M.; Jain, U. Transformative effects of IoT, Blockchain and Artificial Intelligence on cloud computing: Evolution, vision, trends and open challenges. Internet Things 2019, 8, 100118. [Google Scholar] [CrossRef]
  7. Beheshti-Atashgah, M.; Aref, M.R.; Barari, M.; Bayat, M. Security and privacy-preserving in e-health: A new framework for patient. Internet Things 2020, 12, 100290. [Google Scholar] [CrossRef]
  8. Sultan, N. Cloud computing for education: A new dawn? Int. J. Inf. Manag. 2010, 30, 109–116. [Google Scholar] [CrossRef]
  9. Low, C.; Chen, Y.; Wu, M. Understanding the determinants of cloud computing adoption. Ind. Manag. Data Syst. 2011, 111, 1006–1023. [Google Scholar] [CrossRef]
  10. Shuaib, M.; Samad, A.; Alam, S.; Siddiqui, S.T. Why adopting cloud is still a challenge?—A review on issues and challenges for cloud migration in organizations. Ambient Commun. Comput. Syst. RACCCS-2018 2019, 904, 387–399. [Google Scholar]
  11. Zhang, G.; Ravishankar, M.N. Exploring vendor capabilities in the cloud environment: A case study of Alibaba Cloud Computing. Inf. Manag. 2019, 56, 343–355. [Google Scholar] [CrossRef]
  12. Abolhassan, F. The drivers of digital transformation. In Why There’s No W. Around Cloud; Springer: Cham, Switzerland, 2017. [Google Scholar]
  13. Leimeister, S.; Böhm, M.; Riedl, C.; Krcmar, H. The Business Perspective of Cloud Computing: Actors, Roles and Value Networks. In Proceedings of the ECIS 2010 Proceedings, Pretoria, South Africa, 7–9 June 2010; Volume 56. [Google Scholar]
  14. Kwilinski, A.; Litvin, V.; Kamchatova, E.; Polusmiak, J.; Mironova, D. Information support of the entrepreneurship model complex with the application of cloud technologies. Int. J. Entrep. 2021, 25, 1–8. [Google Scholar]
  15. Mohammed, C.M.; Zeebaree, S.R.M. Sufficient comparison among cloud computing services: IaaS, PaaS, and SaaS: A review. Int. J. Sci. Bus. 2021, 5, 17–30. [Google Scholar]
  16. Surya, L. Software as a service in cloud computing. Int. J. Creat. Res. Thoughts (IJCRT) ISSN 2019, 7, 182–186. [Google Scholar]
  17. von Rosing, M.; White, S.; Cummins, F.; de Man, H. Business Process Model and Notation-BPMN. In The Complete Business Process Handbook; von Rosing, M., von Scheel, H., Scheer, A.-W., Eds.; Morgan Kaufmann: Burlington, MA, USA, 2014; pp. 433–457. [Google Scholar]
  18. Chinosi, M.; Trombetta, A. BPMN: An introduction to the standard. Comput. Stand. Interfaces 2012, 34, 124–134. [Google Scholar] [CrossRef]
  19. Michael Kavis, M.K. Architecting the Cloud Design Decisions for Cloud Computing Service Models; Wiley Online Library: Hoboken, NJ, USA, 2014; ISBN 1118617614. [Google Scholar]
  20. Buyya, R.; Srirama, S.N.; Casale, G.; Calheiros, R.; Simmhan, Y.; Varghese, B.; Gelenbe, E.; Javadi, B.; Vaquero, L.M.; Netto, M.A.S. A manifesto for future generation cloud computing: Research directions for the next decade. ACM Comput. Surv. 2018, 51, 1–38. [Google Scholar] [CrossRef]
  21. Ransome, J.W.R.J.F. Cloud Computing Implementation, Management, and Security; CRC Press: Boca Raton, FL, USA, 2010. [Google Scholar]
  22. Ullah, R.M.U.; Buckley, K.; Garvey, M.; Li, J. Cloud Computing Adoption in Enterprise: Challenges and Benefits. Int. J. Comput. Trends Technol. 2019, 67, 93–104. [Google Scholar] [CrossRef]
  23. da Silva, F.S.; Nascimento, M.H.R. Major Challenges Facing Cloud Migration. ITEGAM-JETIA 2020, 6, 59–65. [Google Scholar]
  24. Carcary, M.; Doherty, E.; Conway, G. The adoption of cloud computing by irish smes an exploratory study. Electron. J. Inf. Syst. Eval. 2014, 17, 3–14. [Google Scholar]
  25. Li, Z.; O’brien, L.; Zhang, H.; Cai, R. On a catalogue of metrics for evaluating commercial cloud services. In Proceedings of the 2012 ACM/IEEE 13th International Conference on Grid Computing (GRID’12), Beijing, China, 20–23 September 2012; IEEE Computer Society: Washington, DC, USA, 2012; pp. 164–173. [Google Scholar]
  26. Alkhalil, A.; Sahandi, R.; John, D. An exploration of the determinants for decision to migrate existing resources to cloud computing using an integrated TOE-DOI model. J. Cloud Comput. 2017, 6, 2. [Google Scholar] [CrossRef]
  27. Abdelkader, K.; Aki, R.; Yedder, S.; Arfa, R. Challenges and Factors Affecting Cloud Computing Adoption in Higher Technical Education Institutions in Libya. In Proceedings of the 2021 IEEE 1st International Maghreb Meeting of the Conference on Sciences and Techniques of Automatic Control and Computer Engineering MI-STA, Tripoli, Libya, 25–27 May 2021; pp. 310–315. [Google Scholar]
  28. Ali, O.; Shrestha, A.; Ghasemaghaei, M.; Beydoun, G. Assessment of complexity in cloud computing adoption: A case study of local governments in Australia. Inf. Syst. Front. 2021, 24, 595–617. [Google Scholar] [CrossRef]
  29. Dumas, M.; La Rosa, M.; Mendling, J.; Reijers, H.A. Fundamentals of Business Process Management; Springer: Berlin/Heidelberg, Germany, 2018; Volume 2. [Google Scholar]
  30. Bag, S.; Wood, L.C.; Mangla, S.K.; Luthra, S. Procurement 4.0 and its implications on business process performance in a circular economy. Resour. Conserv. Recycl. 2020, 152, 104502. [Google Scholar] [CrossRef]
  31. Beerepoot, I.; Di Ciccio, C.; Reijers, H.A.; Rinderle-Ma, S.; Bandara, W.; Burattin, A.; Calvanese, D.; Chen, T.; Cohen, I.; Depaire, B. The biggest business process management problems to solve before we die. Comput. Ind. 2023, 146, 103837. [Google Scholar] [CrossRef]
  32. Gruhn, V.; Laue, R. Adopting the cognitive complexity measure for business process models. In Proceedings of the 2006 5th IEEE International Conference on Cognitive Informatics, Beijing, China, 17–19 July 2006; Volume 1, pp. 236–241. [Google Scholar]
  33. Vanderfeesten, I.; Cardoso, J.; Mendling, J.; Reijers, H.A.; Van der Aalst, W. Quality metrics for business process models. BPM Work. Handb. 2007, 144, 179–190. [Google Scholar]
  34. Yaqin, M.A.; Sarno, R.; Rochimah, S. Measuring scalable business process model complexity based on basic control structure. Int. J. Intell. Eng. Syst. 2020, 13, 52–65. [Google Scholar] [CrossRef]
  35. Yaqin, M.A.; Sarno, R.; Fauzan, A.C. Scalability measurement of business process model using business processes similarity and complexity. In Proceedings of the 2017 4th International Conference on Electrical Engineering, Computer Science and Informatics (EECSI), Yogyakarta, Indonesia, 19–21 September 2017; pp. 1–7. [Google Scholar]
  36. Lăcătușu, M.; Ionita, A.D.; Anton, F.D.; Lăcătușu, F. Analysis of complexity and performance for automated deployment of a software environment into the cloud. Appl. Sci. 2022, 12, 4183. [Google Scholar] [CrossRef]
  37. Zhou, C.; Zhang, D.; Chen, D.; Liu, C. A Change-Sensitive Complexity Measurement for Business Process Models Based on Control Structure. Systems 2023, 11, 250. [Google Scholar] [CrossRef]
  38. Al Hadwer, A.; Tavana, M.; Gillis, D.; Rezania, D. A systematic review of organizational factors impacting cloud-based technology adoption using Technology-organization-environment framework. Internet Things 2021, 15, 100407. [Google Scholar] [CrossRef]
  39. Dillon, T.; Wu, C.; Chang, E. Cloud computing: Issues and challenges. In Proceedings of the 2010 24th IEEE International Conference on Advanced Information Networking and Applications, Perth, Australia, 20–23 April 2010; pp. 27–33. [Google Scholar]
  40. Rashid, A.; Chaturvedi, A. Cloud computing characteristics and services: A brief review. Int. J. Comput. Sci. Eng. 2019, 7, 421–426. [Google Scholar] [CrossRef]
  41. Bataev, A.V.; Rodionov, D.G.; Andreyeva, D.A. Analysis of world trends in the field of cloud technology. In Proceedings of the 2018 International Conference on Information Networking (ICOIN), Chiang Mai, Thailand, 10–12 January 2018; pp. 594–598. [Google Scholar]
  42. Kilcioglu, C.; Rao, J.M.; Kannan, A.; McAfee, R.P. Usage patterns and the economics of the public cloud. In Proceedings of the 26th International Conference on World Wide Web, Perth, Australia, 3–7 April 2017; pp. 83–91. [Google Scholar]
  43. Kraus, S.; Jones, P.; Kailer, N.; Weinmann, A.; Chaparro-Banegas, N.; Roig-Tierno, N. Digital transformation: An overview of the current state of the art of research. Sage Open 2021, 11, 21582440211047576. [Google Scholar] [CrossRef]
  44. Eller, R.; Alford, P.; Kallmünzer, A.; Peters, M. Antecedents, consequences, and challenges of small and medium-sized enterprise digitalization. J. Bus. Res. 2020, 112, 119–127. [Google Scholar] [CrossRef]
  45. Gunturu, N.M. A Framework for Successful Corporate Cloud Transformation. arXiv 2023, arXiv:2304.05333. [Google Scholar]
  46. Wang, C.; Zhang, M. The road to change: Broadband China strategy and enterprise digitization. PLoS ONE 2022, 17, e0269133. [Google Scholar] [CrossRef] [PubMed]
  47. Zhang, T.; Shi, Z.-Z.; Shi, Y.-R.; Chen, N.-J. Enterprise digital transformation and production efficiency: Mechanism analysis and empirical research. Econ. Res. Ekon. Istraživanja 2022, 35, 2781–2792. [Google Scholar]
  48. Cloud Computing White Paper. 2022. Available online: http://www.caict.ac.cn/kxyj/qwfb/bps/202207/P020220721643085625934.pdf (accessed on 16 July 2023).
  49. Alibaba Cloud. Best Practices for Deploying a Typical Business Website. 2020. Available online: https://resource.alibabacloud.com/bestpractice/detail.html?spm=a3c0i.7911826.6791778070.737.6d8d3870T3TW7B&bpId=2020082619340700001 (accessed on 16 July 2023).
  50. Somasekaram, P.; Calinescu, R.; Buyya, R. High-availability clusters: A taxonomy, survey, and future directions. J. Syst. Softw. 2022, 187, 111208. [Google Scholar] [CrossRef]
  51. Gholami, M.F.; Daneshgar, F.; Low, G.; Beydoun, G. Cloud migration process—A survey, evaluation framework, and open challenges. J. Syst. Softw. 2016, 120, 31–69. [Google Scholar]
  52. Aydin, H. A study of cloud computing adoption in universities as a guideline to cloud migration. Sage Open 2021, 11, 21582440211030280. [Google Scholar] [CrossRef]
  53. Eckerson, W.W. Performance Dashboards: Measuring, Monitoring, and Managing Your Business; John Wiley & Sons: Hoboken, NJ, USA, 2010. [Google Scholar]
  54. Faustino, J.; Adriano, D.; Amaro, R.; Pereira, R.; da Silva, M.M. DevOps benefits: A systematic literature review. Softw. Pract. Exp. 2022, 52, 1905–1926. [Google Scholar] [CrossRef]
  55. Benlian, A.; Hess, T.; Buxmann, P. Drivers of SaaS-adoption—An empirical study of different application types. Bus. Inf. Syst. Eng. 2009, 1, 357–369. [Google Scholar] [CrossRef]
  56. Cardoso, J. Business process control-flow complexity: Metric, evaluation, and validation. Int. J. Web Serv. Res. 2008, 5, 49–76. [Google Scholar] [CrossRef]
  57. Weyuker, E.J. Evaluating software complexity measures. IEEE Trans. Softw. Eng. 1988, 14, 1357–1365. [Google Scholar] [CrossRef]
  58. Chiarello, F.; Fantoni, G.; Hogarth, T.; Giordano, V.; Baltina, L.; Spada, I. Towards ESCO 4.0—Is the European classification of skills in line with Industry 4.0? A text mining approach. Technol. Forecast. Soc. Change 2021, 173, 121177. [Google Scholar] [CrossRef]
  59. Osborne, J. Notes on the use of data transformations. Pract. Assess. Res. Eval. 2002, 8, 6. [Google Scholar]
  60. Varian, H.R.; Farrell, J.; Shapiro, C. The Economics of Information Technology: An Introduction; Cambridge University Press: Cambridge, UK, 2004; ISBN 1139456725. [Google Scholar]
  61. Desmet, K.; Parente, S.L. Bigger is better: Market size, demand elasticity, and innovation. Int. Econ. Rev. 2010, 51, 319–333. [Google Scholar] [CrossRef]
  62. Reese, W. Nginx: The high-performance web server and reverse proxy. Linux J. 2008, 2008, 2. [Google Scholar]
  63. Kaushal, V.; Bala, A. Autonomic fault tolerance using haproxy in cloud environment. Int. J. Adv. Eng. Sci. Technol. 2011, 7, 54–59. [Google Scholar]
  64. Cloud Computing Development White Paper. 2018. Available online: http://www.caict.ac.cn/kxyj/qwfb/bps/201808/P020180813540725575770.pdf (accessed on 16 July 2023).
  65. Cloud Computing White Paper. 2016. Available online: http://www.caict.ac.cn/kxyj/qwfb/bps/201804/P020160831394946370040.pdf (accessed on 16 July 2023).
  66. China Digital Economy Development White Paper. 2017. Available online: http://www.caict.ac.cn/kxyj/qwfb/bps/201804/P020170713408029202449.pdf (accessed on 17 July 2024).
  67. China Digital Economy Development Report. 2022. Available online: http://www.caict.ac.cn/kxyj/qwfb/bps/202207/P020220729609949023295.pdf (accessed on 17 July 2024).
  68. Gonçalves, C.A.; de Souza Messias, C.O.; Soares, J.L.; Peixoto, M.M.d.C.L. Adoption of Cloud Computing in the organizations: A bibliometric analysis of this technology within a digital transformation context. Rev. Adm. UFSM 2023, 16, e1. [Google Scholar] [CrossRef]
  69. Lambropoulos, G.; Mitropoulos, S.; Douligeris, C. A Review on Cloud Computing services, concerns, and security risk awareness in the context of Digital Transformation. In Proceedings of the 2021 6th South-East Europe Design Automation, Computer Engineering, Computer Networks and Social Media Conference (SEEDA-CECNSM), Preveza, Greece, 24–26 September 2021; pp. 1–6. [Google Scholar]
  70. Wulf, F.; Lindner, T.; Strahringer, S.; Westner, M. IaaS, PaaS, or SaaS? The Why of Cloud Computing Delivery Model Selection: Vignettes on the Post-Adoption of Cloud Computing. In Proceedings of the 54th Hawaii International Conference on System Sciences, Kauai, HI, USA, 5 January 2021; pp. 6285–6294. [Google Scholar]
  71. Srivastava, P.; Khan, R. A review paper on cloud computing. Int. J. Adv. Res. Comput. Sci. Softw. Eng. 2018, 8, 17–20. [Google Scholar] [CrossRef]
  72. Yaseen, H.; Al-Adwan, A.S.; Nofal, M.; Hmoud, H.; Abujassar, R.S. Factors Influencing Cloud Computing Adoption Among SMEs: The Jordanian Context. Inf. Dev. 2023, 39, 317–332. [Google Scholar] [CrossRef]
Figure 1. Cloud service model deployment level.
Jtaer 19 00109 g001
Figure 2. Standard deployment model.
Jtaer 19 00109 g002
Figure 3. BPMN for business deployment based on non-cloud.
Jtaer 19 00109 g003
Figure 4. BPMN for business deployment based on IaaS.
Jtaer 19 00109 g004
Figure 5. BPMN for business deployment based on PaaS.
Jtaer 19 00109 g005
Figure 6. BPMN for business deployment based on SaaS.
Jtaer 19 00109 g006
Figure 7. BPMN for business deployment based on non-cloud after splitting.
Jtaer 19 00109 g007
Figure 8. BPMN for business deployment based on IaaS after splitting.
Jtaer 19 00109 g008
Figure 9. BPMN for business deployment based on non-cloud after assignment. Each task is labeled with a task-id, with the criteria for its TW assignment detailed in Table A1 of Appendix A.
Jtaer 19 00109 g009
Figure 10. BPMN for business deployment based on IaaS after assignment. Each task is labeled with a task-id, with the criteria for its TW assignment detailed in Table A2 of Appendix A.
Jtaer 19 00109 g010
Figure 11. BPMN for business deployment based on PaaS after assignment. Each task is labeled with a task-id, with the criteria for its TW assignment detailed in Table A3 of Appendix A.
Jtaer 19 00109 g011
Figure 12. BPMN for business deployment based on SaaS after assignment. Each task is labeled with a task-id, with the criteria for its TW assignment detailed in Table A4 of Appendix A.
Jtaer 19 00109 g012
Figure 13. Conversion of tasks after assignment TW to general task.
Jtaer 19 00109 g013
Figure 14. The market size of China’s public cloud. Data source: Cloud Computing White Paper 2016, Cloud Computing Development White Paper 2018, Cloud Computing White Paper 2022.
Jtaer 19 00109 g014
Figure 15. The cloud migration complexity index measurement results.
Jtaer 19 00109 g015
Table 1. Measure results of relative complexity based on cloud cloud-based scenarios.
Cloud Computing LevelRC (Relative Complexity of Cloud Migration)
Infrastructure as a Service (IaaS)0.329
Platform as a Service (PaaS)0.0259
Software as a Service (SaaS)0.0099
Table 2. Variable description.
Variable TypeVariable NameVariablesDescription
Dependent VariableEnterprise’s Digitalization LeveldigIndicator constructed in this study
Core Independent VariablesCloud Migration Complexity Index (before/after classification)cmci/cmci_tecIndicator constructed in this study
Complexity Reduction Indicator of IaaS (before/after classification)icr/icr_techIndicator constructed in this study
Complexity Reduction Indicator of PaaS (before/after classification)pcr/pcr_tecIndicator constructed in this study
Complexity Reduction Indicator of SaaS (before/after classification)scr/scr_tecIndicator constructed in this study
Control VariablesDigital Background of Senior ExecutivesmdbIf any executive in the listed company has a digital background, then it is 1; otherwise, 0
Equity ConcentrationscrShareholding ratio of the largest shareholder (%)
Net Profit Rate of Total AssetsroaNet profit/total assets
Return on EquityroeNet profit/net assets
Asset–Liability RatiolevTotal liabilities/total assets
Asset Structureast(Net fixed assets + net inventory)/total assets
Intangible Asset rateiarNet intangible assets/total assets
Investment Expenditure RateinvtCash paid for purchasing fixed assets, intangible assets, and other long-term assets/total assets
Total Asset Growth RatetagTotal asset growth rate
Total Operating Cost Growth rategcostTotal operating cost growth rate
Logarithm of Per Capita GDP at the Prefecture-Level Citygdpln(Per capita regional GDP)
Table 3. Descriptive statistics.
VariableObsMeanStd. Dev.MinMax
dig30,705 13.42833.7730589
cmci30,705 0.7760.1460.4850.913
cmci_tech30,705 0.7080.2260.2480.909
icd30,705 0.0750.0930.0000.269
pcd30,705 0.0200.0280.0010.081
scd30,705 0.1290.0300.0820.165
icd_tech30,705 0.1390.1710.0000.497
pcd_tech30,705 0.0210.0300.0010.088
scd_tech30,705 0.1320.0300.0840.169
lnngdp25,813 2.4410.0452.2062.569
tag30,704 0.2130.810−0.97247.927
roa30,705 0.0380.699−30.688108.366
roe30,602 0.0402.807−186.557281.989
lev30,705 0.4361.073−0.195178.346
ast29,958 0.3470.1780.0000.962
iar30,705 0.0460.0610.0000.938
mdb30,705 0.1000.3000.0001.000
invt30,671 0.0480.0480.0000.642
gcostr30,692 0.1920.494−0.7364.574
SMEs30,7050.2530.4350.0001.000
Table 4. Baseline regression.
(1)(2)(3)(4)
BaselineBaselineIVIV
DigDigDigDig
cmci−22.24 *** −22.71 ***
(−17.02) (−17.05)
cmci_tech −13.79 *** −14.62 ***
(−16.84) [−17.04]
_cons31.01 ***23.60 ***
(20.37)(17.46)
Control VariablesYESYESYESYES
Kleibergen–Paap rk LM statistic 2794.52815.9
P-val for Kleibergen–Paap rk LM statistic 0.000.00
Cragg-Donald Wald F statistic 13,878,136.76,124,746.7
N29,31929,31929,31929,319
r2_a0.7350.7350.05000.0481
Note: t statistics in parentheses, z statistics in square brackets, *** indicates significant at the 1% level of significance; controls include all variables presented in Table 2; the estimations are all clustering robust standard errors for clustering at the firm level. Individual effect is controlled.
Table 5. The effect of complexity reduction in indifferent levels of cloud computing.
(1)(2)(3)(4)(5)(6)
DigDigDigDigDigDig
icr35.83 ***
(17.03)
icr_tech 19.44 ***
(17.03)
pcr 119.8 ***
(17.01)
pcr_tech 111.3 ***
(17.01)
scr 128.7 ***
(17.12)
scr_tech 125.6 ***
(17.12)
Control VariablesYESYESYESYESYESYES
Kleibergen–Paap rk LM statistic2855.12855.12924.12924.12399.02399.0
P-val for Kleibergen–Paap rk LM statistic0.0000.0000.0000.0000.0000.000
Cragg-Donald Wald F statistic1,839,546.41,839,546.4475,381.2475,381.291,694.991,694.9
N29,31929,31929,31929,31929,31929,319
r2_a0.04440.04440.03590.03590.07090.0709
Note: t statistics in parentheses, *** indicates significant at the 1% level of significance; controls include all variables presented in Table 2; the estimations are all clustering robust standard errors for clustering at the firm level. Individual effect is controlled.
Table 6. Separate estimations for SMEs and non-SMEs.
(1)(2)(3)(4)
DigDigDigDig
cmci−23.32 ***−22.32 ***
(−6.86)(−16.26)
cmci_tech −15.02 ***−14.36 ***
(−6.86)(−16.26)
Control VariablesYESYESYESYES
Kleibergen–Paap rk LM statistic696.32116.3700.92133.0
P-val for Kleibergen–Paap rk LM statistic0.0000.0000.0000.000
Cragg–Donald Wald F statistic3,835,989.09,652,778.51,634,202.84,303,845.2
N762921,690762921,690
r2_a0.05080.05260.04920.0506
Note: t statistics in parentheses, *** indicates significant at the 1% level of significance; controls include all variables presented in Table 2; the estimations are all clustering robust standard errors for clustering at the firm level. Individual effect is controlled.
Table 7. The complexity reduction indicators of IaaS, PaaS, and SaaS levels of cloud computing.
(1)(2)(3)(4)(5)(6)
DigDigDigDigDigDig
icr36.86 ***35.16 ***
(6.86)(16.25)
pcr 165.9 ***117.4 ***
(7.74)(16.22)
scr 132.0 ***137.5 ***
(6.97)(16.74)
Control VariablesYESYESYESYESYESYES
Kleibergen–Paap rk LM statistic709.22163.6688.82216.3606.91771.6
P-val for Kleibergen–Paap rk LM statistic0.0000.0000.0000.0000.0000.000
Cragg–Donald Wald F statistic470,933.01,319,177.239,359.4349,791.423,980.2229,300.0
N762921,690762921,690762921,690
r2_a0.04590.04660.03110.03760.07050.0743
Note: t statistics in parentheses, *** indicates significant at the 1% level of significance; controls include all variables presented in Table 2; the estimations are all clustering robust standard errors for clustering at the firm level. Individual effect is controlled.
Table 8. The complexity reduction indicators of IaaS, PaaS, and SaaS levels of cloud computing before classification.
(1)(2)(3)(4)(5)(6)
DigDigDigDigDigDig
icr_tech19.99 ***19.07 ***
(6.86)(16.25)
pcr_tech 154.3 ***109.1 ***
(7.74)(16.22)
scr_tech 127.7 ***134.2 ***
(6.89)(16.74)
Control variablesYESYESYESYESYESYES
Kleibergen–Paap rk LM statistic709.22163.6688.82216.3607.31771.6
P-val for Kleibergen–Paap rk LM statistic0.0000.0000.0000.0000.0000.000
Cragg–Donald Wald F statistic470,933.01,319,177.239,359.4349,791.422,691.4229,300.0
N762921,690762921,690762921,690
r2_a0.04590.04660.03110.03760.07040.0743
Note: t statistics in parentheses, *** indicates significant at the 1% level of significance; controls include all variables presented in Table 2; the estimations are all clustering robust standard errors for clustering at the firm level. Individual effect is controlled.
Disclaimer/Publisher’s Note: The statements, opinions and data contained in all publications are solely those of the individual author(s) and contributor(s) and not of MDPI and/or the editor(s). MDPI and/or the editor(s) disclaim responsibility for any injury to people or property resulting from any ideas, methods, instructions or products referred to in the content.

