Article

The Next-Generation Shopper: A Study of Generation-Z Perceptions of AI in Online Shopping

by
Ovidiu-Iulian Bunea
1,
Răzvan-Andrei Corboș
1,
Sorina Ioana Mișu
1,*,
Monica Triculescu
1 and
Andreea Trifu
2
1
Department of Management, Faculty of Management, Bucharest University of Economic Studies, 010374 Bucharest, Romania
2
Department of Business Management, CUNEF University, 28040 Madrid, Spain
*
Author to whom correspondence should be addressed.
J. Theor. Appl. Electron. Commer. Res. 2024, 19(4), 2605-2629; https://doi.org/10.3390/jtaer19040125
Submission received: 21 August 2024 / Revised: 25 September 2024 / Accepted: 26 September 2024 / Published: 30 September 2024

Abstract

:
This study explores the impact of artificial intelligence (AI) tools on the purchase intentions of members of Generation Z (Gen Z) in online shopping, using an adapted technology acceptance model (TAM). It incorporates exposure to AI, usage of AI, and knowledge about AI, alongside the existing TAM parameters of perceived usefulness of AI (PUAI) and perceived ease-of-use of AI (PEUAI). A 38-item questionnaire was distributed, yielding data from 1128 Gen Z respondents. Partial least squares structural equation modeling (PLS-SEM) and importance–performance analysis (IPA) were applied to examine the hypothesized relationships. The study identified significant direct effects of exposure, use, and knowledge on PUAI and PEUAI, and that these effects affected consumers’ purchase intentions. Indirect effects analysis revealed that PUAI and PEUAI mediate between AI exposure, use, knowledge, and purchase intentions, suggesting that greater understanding of and familiarity with AI enhance the propensity to engage in AI-powered online transactions. The ease of integrating AI into daily life and perceived AI utility enhance purchase intentions. The study offers insights for online retailers leveraging AI technologies in an effort to enhance consumer purchase experiences, emphasizing the potential of AI to positively influence choices while enhancing trust, familiarity, and the overall user experience.

1. Introduction

Online shopping has become a mainstream method for purchasing goods and services, with consumers from all demographics increasingly relying on the Internet for their shopping needs [1,2]. This trend has steadily grown, with global online retail sales expected to surpass USD 6.3 trillion in 2024 [3]. More recently, the retail landscape has transformed significantly with the integration of artificial intelligence (AI) technologies, which have become a key driver of innovation in the industry [4,5]. AI enables retailers to predict consumer preferences, offer personalized product recommendations, and optimize logistics and customer service through advanced data analysis. AI tools like chatbots and personalized shopping assistants enhance convenience and customization, making the shopping experience more tailored and efficient [6,7,8]. These innovations enable consumers to enjoy a shopping experience that is convenient, time-saving, and highly tailored to their individual preferences and needs. As AI continues to evolve, its role in aligning consumer expectations with the online shopping experience grows, promising a bright future for retail in the digital era [9].
However, not all customers engage with AI-powered online shopping solutions in the same way, and Generation Z (those born from the mid-1990s to the early 2010s) stands out as a key consumer group with distinct behaviors. Gen Z is known for its digital fluency and frequent online shopping [10]. The academic literature and significant amounts of professional attention are increasingly focused on understanding this generation, given its members’ emergence as a pivotal market segment [11,12]. As “always-on purchasers”, they have unique preferences and expectations, particularly in AI-enhanced shopping environments. Given their influence and distinct patterns, further research is needed to understand how they perceive and accept these technological advancements [10,11,13]. Further research is needed to understand their unique preferences and engagement with these technologies.
When examining technological advancements and their adoption, the technology acceptance model (TAM), introduced by Davis [14], provides a solid theoretical foundation for analyzing these trends. Numerous studies have indicated its validity in explaining technology acceptance [15], and the numbers support this claim [16]. However, Generation Z’s unique position as a generation inherently familiar with technology may alter traditional TAM dynamics, with the suggestion that their lower levels of resistance to AI technologies could influence their perceptions in a manner distinct from older generations.
The TAM suggests that two fundamental perceptions drive user acceptance and utilization of new technologies: perceived usefulness (PU) and perceived ease-of-use (PEOU). Given their comfort with technology, Generation Z may have heightened expectations for how AI can streamline and optimize their online shopping activities. As digital natives, they are likely to expect intuitive technology interfaces, seamless navigation, and AI integration that enhances rather than complicates the shopping experience. This study explores how these unique expectations shape Gen Z’s acceptance of AI in online shopping, offering fresh insights into the TAM’s application in this specific demographic.
In this context, businesses must recognize the diverse levels of exposure, knowledge, and use of AI technologies among Gen Z consumers [17,18]. In doing so, they can tailor their technological offerings to better align with the expectations and comfort levels of this key demographic, ultimately influencing how these customers perceive the usefulness and ease of AI in their shopping experience. A customized approach is crucial for fostering positive user experiences leading to higher engagement and adoption rates [19].
Taking everything into consideration, in the realm of online shopping, these constructs can provide insightful perspectives on how Gen Z customers perceive and interact with AI features. The TAM is particularly useful because it can help determine whether these technologies will be accepted and how they can be improved to meet the expectations of this demographic; it has already proved its strength in predicting behavior in different circumstances [20]. Therefore, we aim to answer the following research questions:
RQ1: To what degree do varying levels of exposure, usage, and knowledge contribute to the perceived usefulness and ease-of-use of AI solutions in online shopping for Gen Z consumers?
RQ2: How do perceived usefulness and ease-of-use impact the purchase intentions of Gen Z consumers?
This paper explores Gen Z’s perceptions of AI in online shopping using the TAM framework to determine the underlying factors that influence their acceptance and usage of these technologies. The research aims to deepen understanding of AI’s role in retail and offer guidance to retailers on creating user-friendly platforms. Key recommendations include simplifying navigation, enhancing search functions, and making shopping more interactive to reduce purchase barriers for Gen Z.
The remainder of this paper is structured as follows. First, it explores the theoretical background and engages in hypothesis development. Next, the research methodology is described, including data collection and analysis based on a sample of 1128 individuals. Then, it outlines the research methodology, including data collection and analysis from the sample of 1128 individuals. The findings are discussed in terms of their academic contributions and practical implications for engaging Generation Z with AI in a retail context. Lastly, the paper suggests areas for future research to further understand AI’s role in online shopping.

2. Theoretical Background

2.1. Gen Z’s Online Shopping Behavior

Understanding consumer behavior is a major priority in both academic research and managerial decision-making. Gaining insights into consumers’ actions and motivations is among the highest of concerns for managers [21]. Gen Z is the latest cohort of adult consumers and the first generation in history to be entirely shaped by the digital age [22]. This distinctive upbringing has forged a unique set of behaviors, preferences, and expectations [23]. To effectively engage with this demographic, retailers and marketers must understand and adapt to these unique characteristics.
Previous studies indicate that Gen Z has been at the forefront of the shift toward online shopping, a trend also accelerated by the COVID-19 pandemic [24,25]. With constant access to the Internet from a young age, these consumers are digital natives who are comfortable researching products, comparing prices, and making purchases online [26]. Numerous consumer-trend analyses and consulting reports reveal that a significant majority of Gen Z shoppers prefer to buy through online channels and exhibit distinctive consumer behavior patterns [27,28]. In response, a growing body of literature is emerging aimed at understanding the peculiarities of consumer behavior [22,23,29,30,31].
In this sense, technology plays a central role in Gen Z shopping experiences, extending beyond the mere facilitation of online purchases. This generation expects a seamless integration of shopping channels and personalized recommendations based on AI-driven algorithms. Personalization, in particular, is highly valued by Gen Z consumers [12]. Similarly, they expect brands to understand their individual preferences and tailor the shopping experience accordingly, from personalized product recommendations to customized marketing messages [12,22]. They want brands to recognize them as valued customers and understand their unique needs by providing personalized product suggestions, marketing messages, and shopping experiences. This desire for personalization extends beyond mere product recommendations to encompass all aspects of the consumer journey, including personalized promotions, targeted advertisements, and even personalized shopping interfaces [22,32]. The increased demand for personalization pushes retailers to leverage data analytics and AI technologies to create shopping experiences which are more personalized and engaging [33]. By leveraging such technologies, retailers can deliver content and recommendations that resonate deeply with Gen Z consumers, fostering a sense of understanding and connection crucial for building brand loyalty in this demographic.
All this evidence indicates that technology is not merely a facilitator but a central component of the Gen Z shopping experience. The shopping behavior of Gen Z reflects the complex interplay of technology and the desire for personalization and convenience [12]. These preferences and expectations are shaping the future of retail, pushing brands to innovate in how they engage with consumers [29].
Understanding Gen Z’s shopping behavior is crucial for marketers and retailers aiming to connect with this influential demographic [30]. As their purchasing power continues to grow, their behaviors, preferences, and values will increasingly dictate the evolution of retail landscapes worldwide. Effectively engaging with Gen Z demands a multifaceted approach. By aligning with the priorities and preferences of Gen Z, brands can build lasting relationships with this key demographic, ensuring these brands’ relevance and success in a rapidly changing retail environment.
As the first generation to grow up entirely in the digital age, Gen Z presents unique challenges and opportunities for retailers. Consequently, to capture the attention and loyalty of Gen Z consumers, retailers must adapt to these evolving trends, and a deeper understanding of the preferences of these customers is required. For these reasons, further research is needed to fully comprehend the factors affecting their online purchase intentions.

2.2. Technology Acceptance Model in Online Shopping

The TAM is one of the tools most widely used by professionals and scholars in their quest to understand consumers’ behavior and their interaction with information systems. As a survey of the literature shows, the TAM is the main theoretical framework used by professionals worldwide, and possesses a reliability hard to dismiss. The base model is simple and uses two main elements, PU and PEOU, as predictors of consumers’ technology adoption. As illustrated by [14], PU reflects the extent to which a potential user assumes that certain applications can increase performance, while PEOU is defined by the degree to which the potential consumer expects to effortlessly control the system. Over the years, numerous researchers have incorporated their intentions into the TAM framework, bringing additional scenarios into the original model in line with the development of technology; these range from early attempts to understand online shopping behavior [34,35] to exploring the impact of AI elements such as facial recognition technology and the metaverse [6,36,37,38]. Even though there are voices that outline the limitations of the TAM [39], including claims of limited practical application, this model has proved to be effective in explaining the acceptance of AI tools [40].
AI is a technology capable of emulating human intelligence and performing various tasks that require cognitive abilities. It can also enhance the online shopping experience for consumers by providing personalized recommendations, chatbots, virtual assistants, and other features. According to Bhagat et al. [41], AI exerts a positive impact on consumer purchase intention in e-retailing, which is defined as the probability of a consumer buying a product or service online. The authors used a technology-based model to examine the factors affecting consumer buying intentions, including PU, PEOU, perceived enjoyment, trust, and attitude toward e-retailing. Their findings revealed that AI influences consumer buying behavior and increases their purchase intent, suggesting that AI can create a competitive advantage for e-retailers and improve customer satisfaction and loyalty.
While online shopping has become a convenient and favored means of purchasing products and services that has grown in popularity, notably during the COVID-19 pandemic, it also poses challenges for consumers, such as information overload, lack of trust, and low engagement. AI, however, can help overcome these challenges by providing personalized and interactive features, such as product recommendations, chatbots, voice assistants (VAs), and augmented reality. According to Nagy and Hajdu [42], AI can influence consumer acceptance and usage of online shopping, which, in turn, can affect the consumers’ intention to buy. The authors found that AI has a positive impact on consumer acceptance and use of online shopping, as well as on their intention to purchase.
Liang et al. [43] examined consumer attitudes and purchase intentions toward the Echo Look, an AI device designed to help consumers choose outfits and take selfies. The authors found that PU, PEOU, and performance risk were significant predictors of consumers’ attitudes toward AI, and that these attitudes positively influenced their purchase intentions. The authors also suggested that AI can create a unique and memorable consumer experience that can increase purchasing intent and loyalty. Qin et al. [44] explored the differences in the effects of three different types of online customer service (AI customer service, manual customer service, and human–machine collaboration customer service) on customer purchase intention, using service encounter theory and superposition theory. They found that perceived service quality mediated the relationship between online customer service and customer purchase intention, and that product type moderated this relationship. These studies suggest that AI can enhance online shopping by providing personalized and interactive features, but also highlight the importance of considering consumer perceptions, preferences, and needs when designing and implementing AI in this context.
Furthermore, when analyzing AI in online shopping studies, a significant portion of the recent literature has focused on the intersection between AI and TAM. As Mogaji et al. [38] indicated, TAM analysis has been useful for researchers in assessing consumer acceptance of AI technologies.
As one example, Nagy and Hajdu [42] used a TAM to study consumer acceptance of AI in online shopping, revealing that trust and PU are key factors influencing attitudes and behavioral intentions. The study suggests that improving these aspects can enhance customer acceptance of AI-powered web stores, underscoring the relevance of the TAM in the context of AI integration in online retail.
Finally, some recent studies have challenged the relevance of the TAM in the fast-changing technological environment [38,45,46]. However, their findings also demonstrate the potential for extending the TAM in the context of AI technologies.

3. Hypotheses Development

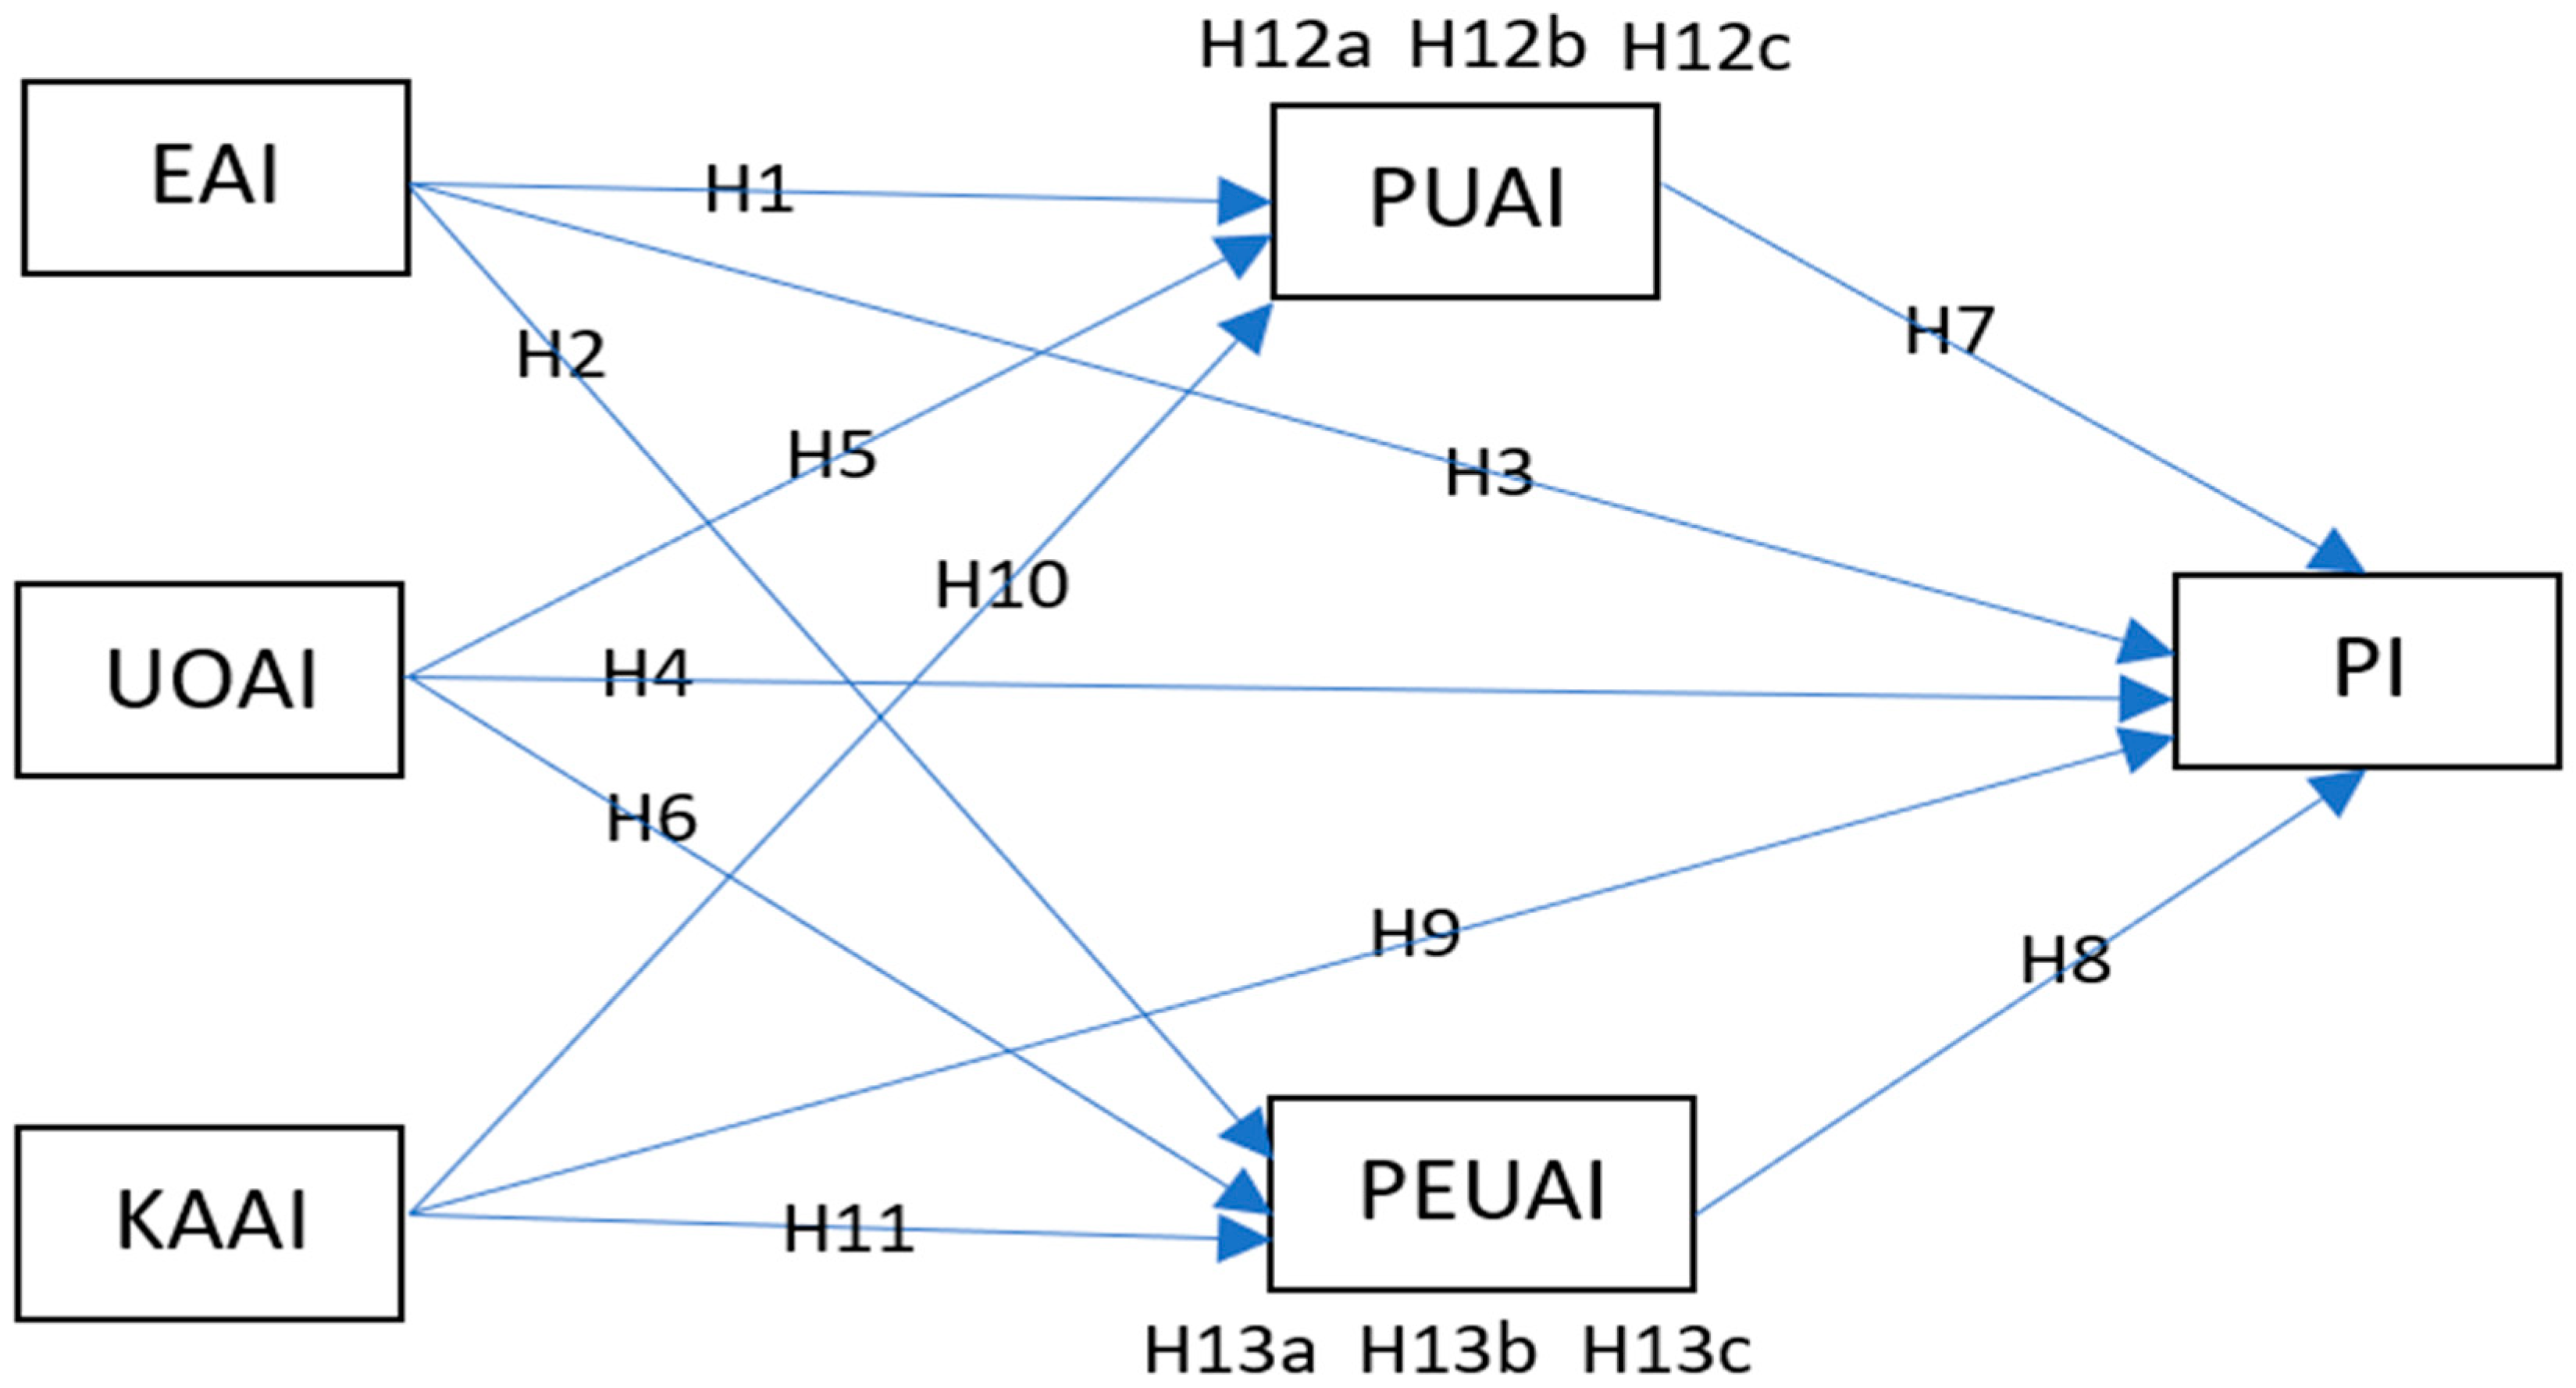
3.1. Modified TAM for AI in Online Shopping

A TAM offers a basis for explaining consumers’ decisions to adopt and use information technology. To illustrate the use of online shopping technology, we modified the original model by incorporating additional constructs, such as exposure to AI (EAI), the UOAI, and knowledge about AI (KAAI).
Given that technology can generate personalized recommendations by processing customers’ past purchases [5], the literature also suggests that EAI can increase the familiarity with, trust of, and acceptance of AI applications. For example, Jenneboer et al. [17] found that EAI chatbots increased consumer trust and satisfaction with the chatbot service. Similarly, Deveau et al. [21] found that exposure to VAs with AI enhanced consumers’ perceptions of usefulness, ease-of-use, and enjoyment of the technology. Therefore, it is reasonable to assume that people with greater EAI in their daily lives will have a more positive perception of the use of AI in sales and marketing processes, as they will be more familiar with its benefits and capabilities. Thus, we hypothesize the following:
Hypothesis 1 (H1). 
The level of exposure to AI is expected to have a significant positive impact on Gen Z consumers’ perceived usefulness of AI in the context of AI-powered online shopping.
Hypothesis 2 (H2). 
The level of exposure to AI is expected to have a significant positive impact on Gen Z consumers’ perceived ease-of-use of AI in the context of AI-powered online shopping.

3.2. EAI and Purchase Intentions

AI represents a technology with the potential to deliver more precise, tailored, and enjoyable services to online consumers. Recent years have seen a notable surge in EAI, particularly within the online shopping sector. EAI encompasses the use of AI tools such as chatbots, recommendation systems, and virtual assistants to enrich the online shopping experience for consumers. Research indicates that EAI can exert a positive influence on the purchase intentions of younger demographics, a value indicating their inclination to make online purchases.
In their bibliometric study and review of the literature on AI in online shopping, Bawack et al. [19] found that AI can increase the consumer-perceived value by augmenting consumers’ perceptions of utility, enjoyment, and trust. Numerous investigations have explored how different facets of AI impact consumers’ purchase intentions across diverse domains, including e-retailing, marketing, and investment. These studies have harnessed various theoretical frameworks and empirical methodologies to scrutinize the effects of AI on consumers’ perceived value, satisfaction, trust, and behavior. A recurring theme in these studies is the affirmative impact of EAI on consumers’ purchase intentions, achieved through the enhancement of the purchases’ perceived utility and hedonic value, and derived from the precision, insights, and interactive experiences offered by AI technology [41,47,48]. Consequently, we hypothesize the following:
Hypothesis 3 (H3). 
The level of exposure to AI is expected to have a significant positive impact on Gen Z consumers’ purchase intentions in the context of AI-powered online shopping.

3.3. Current Use of AI Technologies (UOAI)

Works in the literature suggest that the current use of AI technologies can affect consumers’ intentions to adopt new AI applications. For example, Aiolfi [49] found that the current use of smart-home devices increased the intention to use smart speakers for online shopping. Another study [18] found that the current use of mobile apps with AI features increased the intention to use mobile apps with VAs. Therefore, it is reasonable to assume that people who currently use AI technologies in everyday life will have a higher level of intention to purchase products or services that use AI in sales processes, as they will be more comfortable and familiar with AI.
Furthermore, in a paper published by Brill et al. [50] it was anticipated that the perceived trust factor would positively moderate the connection between confirming expectations and customer satisfaction. This research corroborated the determination that when perceived trust is higher, the link between customer satisfaction and the confirmation of expectations becomes stronger. Thus, we draw the following hypotheses:
Hypothesis 4 (H4). 
The level of use of AI in Gen Z consumers’ daily lives is expected to positively impact their purchase intentions in the context of AI-powered online shopping.
Hypothesis 5 (H5). 
The level of use of AI in Gen Z consumers’ daily lives is expected to positively impact their perceived usefulness of AI in the context of AI-powered online shopping.
Hypothesis 6 (H6). 
The level of use of AI in Gen Z consumers’ daily lives is expected to positively impact their perceived ease-of-use of AI in the context of AI-powered online shopping.

3.4. Positive Perception of AI

Some works in the literature suggest that a positive perception of AI can affect consumer purchase intention for products or services that use AI. For example, Nicolescu and Tudorache [51] found that a positive perception of AI chatbots increased consumer purchase intention for products recommended by chatbots. Yin and Qiu [48] found that a positive perception of AI VAs increased levels of consumer purchase intention for products searched by VAs. Campbell et al. [52] suggested that implementing AI in marketing and sales is a revolutionary step; for marketing managers, it would signify an entire process of rethinking capabilities, strategies, and the transformation involved in the customer interaction process. Furthermore, the positive perception of AI usefulness is enhanced by positive previous online shopping experiences, wherein customers, aided by AI-based digital technology, perceived the goods offered as being of high quality and therefore finalized the purchase process [53].
Hence, it is reasonable to assume that individuals with a positive perception of AI in the context of sales will have higher levels of purchase intention for products or services that use AI, as they will be more satisfied and confident with the AI service.
Additionally, PEUAI plays a key role in influencing people’s purchase intentions. For example, Yeo et al. [53] focused on Instagrammers’ purchase intentions and found that intuitive experiences provided through intelligent recognition and search, intelligent suggestions, and virtual customer-care agents facilitated customers’ decision-making processes as to their purchases.
In a broader approach, Hyun et al. [54] showed that the PEOU and PU of social networks shape consumers’ intentions to use social shopping. In a previous study targeting users of social networks and mobile applications, Fedorko et al. [55] demonstrated that consumers’ positive PEOU and PU of these tools positively impacted online business sales. Based on the discussed literature, we hypothesize:
Hypothesis 7 (H7). 
The perceived usefulness of AI is expected to have a positive impact on Gen Z consumers’ purchase intentions in the context of AI-powered online shopping.
Hypothesis 8 (H8). 
The perceived ease-of-use of AI is expected to have a positive impact on Gen Z consumers’ purchase intentions in the context of AI-powered online shopping.

3.5. Knowledge about AI (KAAI)

The literature suggests that knowledge about AI can affect consumers’ intentions to purchase products or services that use AI. For example, Malhotra and Ramalingam [56] found that knowledge of AI increased levels of consumer purchase intention for products with anthropomorphic features, while Yin and Qiu [48] found that knowledge of AI increased levels of purchase intention for products with intelligent features. In addition, the literature suggests that knowledge about AI can affect consumers’ attitudes and behaviors toward AI applications. For example, Chen et al. [57] found that consumers’ knowledge about AI influenced their PU, PEOU, perceived risk, and perceived enjoyment of AI in online shopping. Yen and Chiang [58] found that consumers’ knowledge of AI influenced their trust and the perceived intelligence and perceived anthropomorphism of AI chatbots.
Davis [59] stated that PU reflects a consumer’s viewpoint regarding the resulting behavior. This behavior is influenced by their attitude, a determination which draws on theories from social psychology, notably the theory of planned behavior. Using the Engel–Kollat–Blackwell (EKB) theory and electronic word of mouth, Yeo et al. [53] published a study showing the impact of AI on Instagrammers’ purchase decisions and concluded by extending the EKB model to encompass consumers’ buying choices influenced by the impact of AI on Instagram within the context of fashion retail. Moreover, this investigation substantiated the model’s effectiveness in analyzing fashion purchase decisions by exploring the consequences of AI through Instagram. Furthermore, the study made a valuable contribution to the limited body of research on the utilization of social commerce in the decision-making process, with a particular focus on the EKB model. It reshaped the scholarly discourse, proposing that social commerce plays a pivotal role in shaping consumers’ purchasing decisions, especially in terms of information search and need recognition. Therefore, it is reasonable to assume that people with higher levels of knowledge about AI will have a higher purchase intention for products or services that use AI in sales, as they will be more interested in and curious about the features and functions of AI. Therefore, we hypothesize the following:
Hypothesis 9 (H9). 
The level of AI knowledge is expected to have a positive impact on Gen Z consumers’ purchase intention in the context of AI-powered online shopping.
Hypothesis 10 (H10). 
The level of AI knowledge is expected to have a positive impact on Gen Z consumers’ perceived usefulness of AI in the context of AI-powered online shopping.
Hypothesis 11 (H11). 
The level of AI knowledge is expected to have a positive impact on Gen Z consumers’ perceived ease-of-use of AI in the context of AI-powered online shopping.

3.6. Impact of AI on Purchase Intention

In the context of consumers, Moriuchi [60] evaluated the impact of perceived simplicity and perceived utility on consumer engagement and loyalty when employing AI technology facilitators such as VAs. The findings indicate that consumers’ subjective norms (SUB) regarding Internet usage significantly impact the perceived ease-of-use and perceived usefulness of VAs. Notably, a distinction emerges when comparing transactional and non-transactional activities. For the former, SUB has an insignificant relationship with engagement, and this relationship is influenced by localization. Moreover, for both transactional and non-transactional activities, consumer engagement via VA technology partially mediates the connection between PU and loyalty.
Our review of the literature suggests that the level of use of AI can mediate the relationship between perceptions and purchase intentions. For example, Zhang and Wang [61] found that the level of smart-speaker usage mediated the relationship between PU and the behavioral intention to use smart speakers for online shopping. Bhagat et al. [41] found that the level of use of mobile apps mediated the relationship between PEOU and the behavioral intention to use mobile apps with VAs. Therefore, it is reasonable to infer that the level of AI use mediates the relationship between perception of AI use in sales and marketing processes and youth purchase intention, as the more the youthful consumer uses AI, the more likely they are to purchase products or services that use AI.
Several studies have examined the impact of AI on consumers’ online purchase intentions using different theoretical models and constructs. For example, Yin and Qiu [48] used a perceived-value model to analyze how the online shopping AI experience influences consumer purchase intention, as mediated by perceived utility value and perceived hedonic value. Bhagat et al. [41] used a technology-based model to explore how trust, SUB, and awareness mediate the effect of perception of AI use in e-retailing on purchase intention. Malhotra and Ramalingam [56] used a perceived anthropomorphism model to investigate how perceptions of intelligence and animacy mediate the effect of perceived anthropomorphism in AI on purchase intention. These studies suggest that AI technology can enhance consumers’ online shopping experience and behavior but also highlight the need for further research on the role of consumers’ level of AI knowledge and exposure, as well as their perception of AI use in sales and marketing processes. Based on the previously discussed literature review, we propose the following hypotheses:
Hypothesis 12 (H12). 
The relationships between the (a) level of use of AI, (b) level of AI knowledge, and (c) level of AI exposure and the purchase intention are mediated by Gen Z consumers’ perceived usefulness of AI in the context of AI-powered online shopping.
Hypothesis 13 (H13). 
The relationships between the (a) level of use of AI, (b) level of AI knowledge, and (c) level of AI exposure and the purchase intention are mediated by Gen Z consumers’ perceived ease-of-use of AI in the context of AI-powered online shopping.
In addition to the works in the literature reviewed above, Table 1 presents an overview of the theoretical frameworks used by other relevant studies in the fields researched by the current paper and highlights the contribution of the current study.
Following the literature review, we constructed the conceptual framework shown in Figure 1.

4. Methodology

4.1. Purpose and Objectives

This study aims to determine whether there is an interaction between AI and buyers’ purchase intentions. To achieve this goal, quantitative research was conducted utilizing a questionnaire comprising 32 questions related to the research topic, with a Likert scale ranging from 1 to 5, and six questions related to demographic data, giving a total of 38 questions. The estimated response time for each participant was approximately 10 min.

4.2. Procedure and Sampling

An important element in our research involved establishing the questions for the questionnaire. Drawing on an extensive review of the literature, we identified seven main areas of questioning. The first area targets the level of EAI, while the second area aims to better understand the respondent’s level of knowledge about AI. The third area evaluates respondents’ level of use of AI. The fourth part contains questions on the perception of the usefulness of AI in sales and marketing based on the TAM model, and the fifth section examines perceptions of the ease-of-use of AI in sales and marketing. The final part of the questionnaire is dedicated to demographic information.
To confirm the participants’ understanding of AI and its relevance to the study, we included the following introductory statement in the questionnaire: “Artificial intelligence (AI) refers to the ability of machines to imitate intelligent human behavior and specifically refers to the ‘cognitive’ functions we associate with the human mind, including problem-solving and learning. AI in sales and marketing is the use of advanced technologies that can mimic human intelligence and perform tasks that normally require human reasoning and creativity. AI can help companies improve their marketing and sales strategies through data analysis, content generation, customer engagement, and performance optimization. For example, AI can create chatbots that can communicate with customers, AI can deliver targeted ads that match customer interests, AI can produce engaging and relevant content for different platforms, AI can identify and prioritize leads, and also provide personalized recommendations and feedback. Through this survey, we want to know how you perceive the use of AI in online shopping and how it affects your intention to buy”.
The questionnaire was created in Google Forms and participants were invited to respond through digital channels, especially social media platforms (Facebook, Instagram, and WhatsApp). Additionally, the survey link was shared with university groups and relevant online communities frequented by Gen Z consumers. The questionnaire was open between October and December 2023, during which time 1128 people responded to the questions raised. All participants were informed of the study’s objectives, and their consent was obtained before beginning the questionnaire.
The target population for this study consisted of Generation Z (Gen Z) consumers, defined as individuals born between the mid-1990s and early 2010s, who engage in online shopping and are likely to have experience with AI technologies. A convenience sampling technique was employed to recruit participants due to the ease of access to this demographic through digital platforms. The sample size was designed to capture a broad range of Gen Z consumers who are active online shoppers, with a particular focus on those who have interacted with AI-powered tools in an online shopping context.

4.3. Measures

All items in the questionnaire were measured on a Likert scale ranging from 1 to 5, where 1 means “strongly disagree” and 5 means “strongly agree”. Table 2 explains the research variables.

4.4. Data Analysis Approach

In this investigation, we employed partial-least-squares structural equation modeling (PLS-SEM) as our primary analytical tool. Recognized for its versatility, PLS-SEM facilitates the simultaneous examination of multiple relationships within sets of observed variables, proving especially adept at handling intricate models featuring multiple mediators and accommodating both formative and reflective constructs [64]. For the implementation of PLS-SEM, we utilized SmartPLS version 4.0.9.6. Moreover, we incorporated importance–performance analysis (IPA) [65], specifically for the PI target construct, both at the indicator and construct levels.

4.5. Common Method Bias

Research can be susceptible to common method bias, especially when the same individual provides data for both dependent and independent variables in a single survey. This can potentially exaggerate the correlation between two constructs [66]. To mitigate this, we implemented procedural remedies suggested by MacKenzie and Podsakoff [67]. These included ensuring unambiguous item wording and separating dependent and independent variables.
To minimize the impact of social desirability bias, we assured participants of their anonymity and encouraged them to respond honestly, emphasizing that there were no correct or incorrect answers. We also employed Harman’s single-factor test as a post-hoc statistical measure. A factor analysis revealed that the first factor accounted for 27% of the variance, well below the 50% threshold [68], indicating that common method bias is unlikely to significantly affect this study.
Due to the known limitations of Harman’s test [69], we used an additional statistical method to detect common method bias. Hair et al. [70] recommended identifying variance inflation factors (VIFs) and assessing multicollinearity during the path analysis estimation in PLS-SEM. Following this advice, we found that all VIF values were below 5, indicating that common method bias is not a significant concern in our study.

5. Results

Table 3 displays the demographic composition of the sample population, providing insights into the participants’ educational qualifications, average age, gender representation, and residential locations. Notable trends include a majority holding bachelor’s degrees and a higher proportion of females, with the sample also predominantly listing urban residence.
Of the 1128 respondents, 55.1% are graduates of bachelor’s degree programs and 41% graduated high school and are currently enrolled in bachelor’s degree programs, while 3.5% attained a master’s degree, and 0.4% a PhD. This data indicates that a majority of the respondents are currently enrolled in a higher education program, either a bachelor’s or a master’s degree program.
The average age of the respondents is 21.85 years, which suggests they qualify as part of Gen Z.
In terms of gender representation, the respondents identified as 63.3% female, and 34.8% male, with 1.1% opting not to respond to this question, and 0.8% identifying as non-binary. Concerning their environment of residence, 70.4% of respondents reported residing in urban settings, with 29.6% indicating they lived in rural areas.
When asked about the kinds of products/services they tended to buy most frequently using sales-related AI tools, when faced with multiple-choice selection, 55.1% of the respondents chose beauty products/services, 47.6% technological products/services, 30.1% entertainment products/services, 22.8% educational products/services, 21% food products/services, and 18.9% transport products/services.

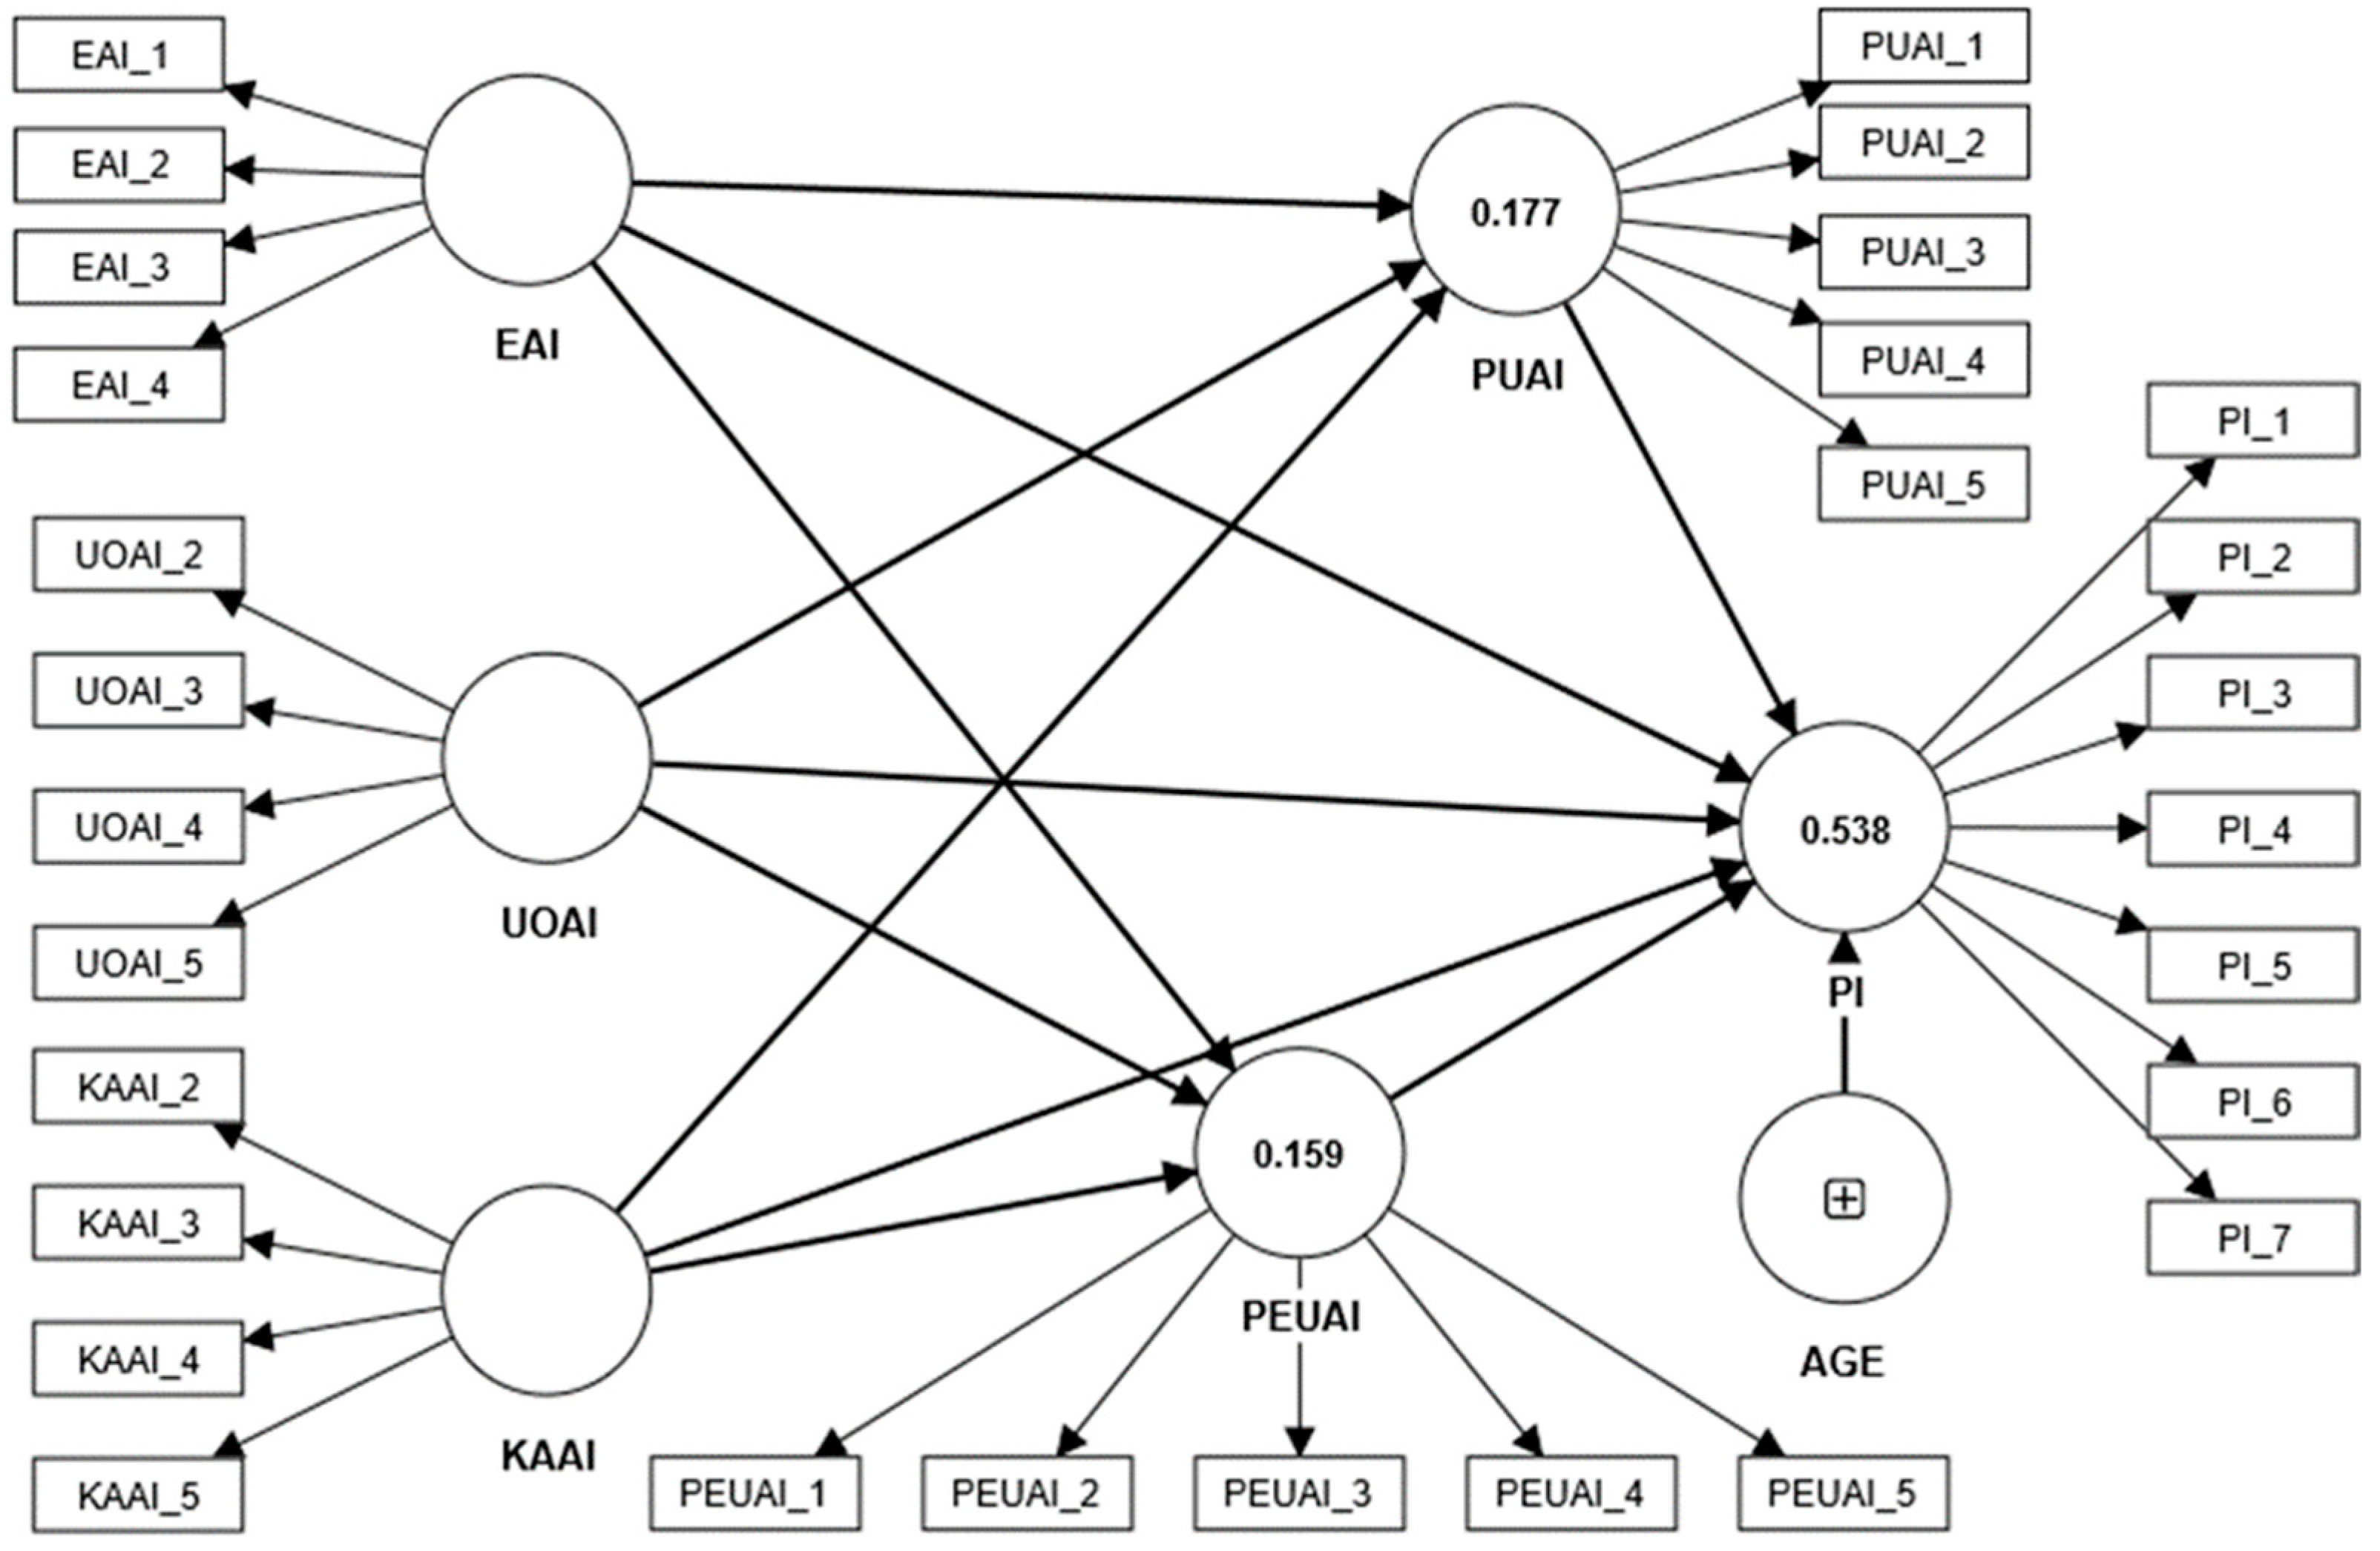
5.1. Model Evaluation

Table 4 presents an overview of the construct reliability and validity of the indicators associated with our research. The loadings quantify the strength of the relationship between the indicators and their respective constructs, with all exceeding the 0.7 threshold for good indicator reliability [71].
For each construct, key measures such as Cronbach’s alpha (α), rho_a, rho_c, and average variance extracted (AVE) are provided. Cronbach’s alpha values above 0.7 signify good reliability [72], a criterion met by all constructs in the table. Similarly, composite reliability measures (rho_a and rho_c) exceeding 0.7 indicate good reliability across all constructs.
AVE, a measure of convergent validity, is deemed satisfactory if it is 0.5 or higher [72]. The table reveals that all constructs exceed this threshold, confirming good convergent validity. Therefore, the indicators demonstrate strong relationships with their respective constructs, ensuring the reliability and validity of the model.
Moreover, the VIF values, ranging from 1.036 to 3.468, are well below the threshold of 5 [73], further reinforcing the reliability of the indicators and their relationships with their respective constructs.
It is noteworthy that three indicators (KAAI_1, UOAI_1, EAI_5) were excluded from the analysis due to low loadings. This decision ensures the robustness of the model by removing indicators with weaker relationships with their constructs.
Table 5 provides insights into discriminant validity assessment for the constructs involved in the study. The table includes two key metrics: the heterotrait–monotrait ratio of correlations (HTMT) ratio and the Fornell–Larcker criterion. As suggested by Hair et al. [70], a widely accepted threshold for the HTMT ratio is 0.85, which distinguishes between discriminant-valid and non-valid latent variable pairs. In our analysis, all HTMT values in the table fall below this threshold, signifying robust discriminant validity among the constructs.
The Fornell–Larcker criterion involves comparing the square root of the AVE by a construct with correlations with other constructs. Examining the diagonal values in the Fornell–Larcker criterion section of the table, which represent the square root of the AVE for each construct, we find that these values consistently exceed the off-diagonal values in the corresponding rows and columns. This observation aligns with the criterion’s expectation and reinforces the notion of good discriminant validity among the constructs [74].
As depicted in Figure 2, the R-square coefficients show that all the predictors of PUAI, namely, EAI, UOAI, and KAAI, contribute, accounting for 17.7% of its variance (R-square = 0.177). Further, all the predictors of PI, namely, EAI, UOAI, KAAI, PUAI, and PEUAI, jointly contribute 53.8% of its variance (R-square = 0.538). Finally, all the predictors of PEUAI, namely, EAI, UOAI, and KAAI, contribute 15.9% of its variance (R-square = 0.159).
Furthermore, the efficacy of the structural model in predicting the dependent variable is demonstrated by the statistical significance of all path coefficients, emphasizing the robustness of the relationships within the model. Moreover, all R-squared values were found to be statistically significant, as shown by the p-values in Table 6. However, some proportion of variance remains unexplained, which means that other factors also play a role in shaping the studied constructs.

5.2. Research Hypotheses Evaluation

As per the results presented in Table 7, all the hypotheses were supported. EAI was found to have a positive influence on PUAI and PEUAI, as well as on PI, with beta coefficients of 0.174, 0.131, and 0.217, respectively (all p < 0.001). The UOAI was also found to positively influence PI, PUAI, and PEUAI, with beta coefficients of 0.323, 0.252, and 0.242, respectively (all p < 0.001). Furthermore, a positive perception of AI’s usefulness and PEOU were found to have a positive impact on PI, with beta coefficients of 0.246 and 0.399, respectively (both p < 0.001). Lastly, higher levels of KAAI were associated with higher PI, PUAI, and PEUAI, with beta coefficients of 0.105, 0.150, and 0.127, respectively (all p < 0.01). These findings provide strong support for the proposed hypotheses, indicating significant relationships between exposure, use, and knowledge of AI and perceptions of its usefulness and ease-of-use, as well as purchase intentions.
As indicated in Table 8, the results support all the hypotheses regarding the indirect effects. The relationship between UOAI, KAAI, EAI, and PI is mediated by both PUAI and PEUAI in sales and marketing processes. For instance, the direct effect of UOAI on PI and the indirect effect through PUAI were both significant, with beta coefficients of 0.323 and 0.043, respectively (both p < 0.001), indicating a complementary (partial) mediation. Similar patterns were observed for KAAI and EAI. These findings suggest that both the PU and the PEOU of AI play a significant role in mediating the relationship between the level of AI use, knowledge, exposure, and purchase intention.

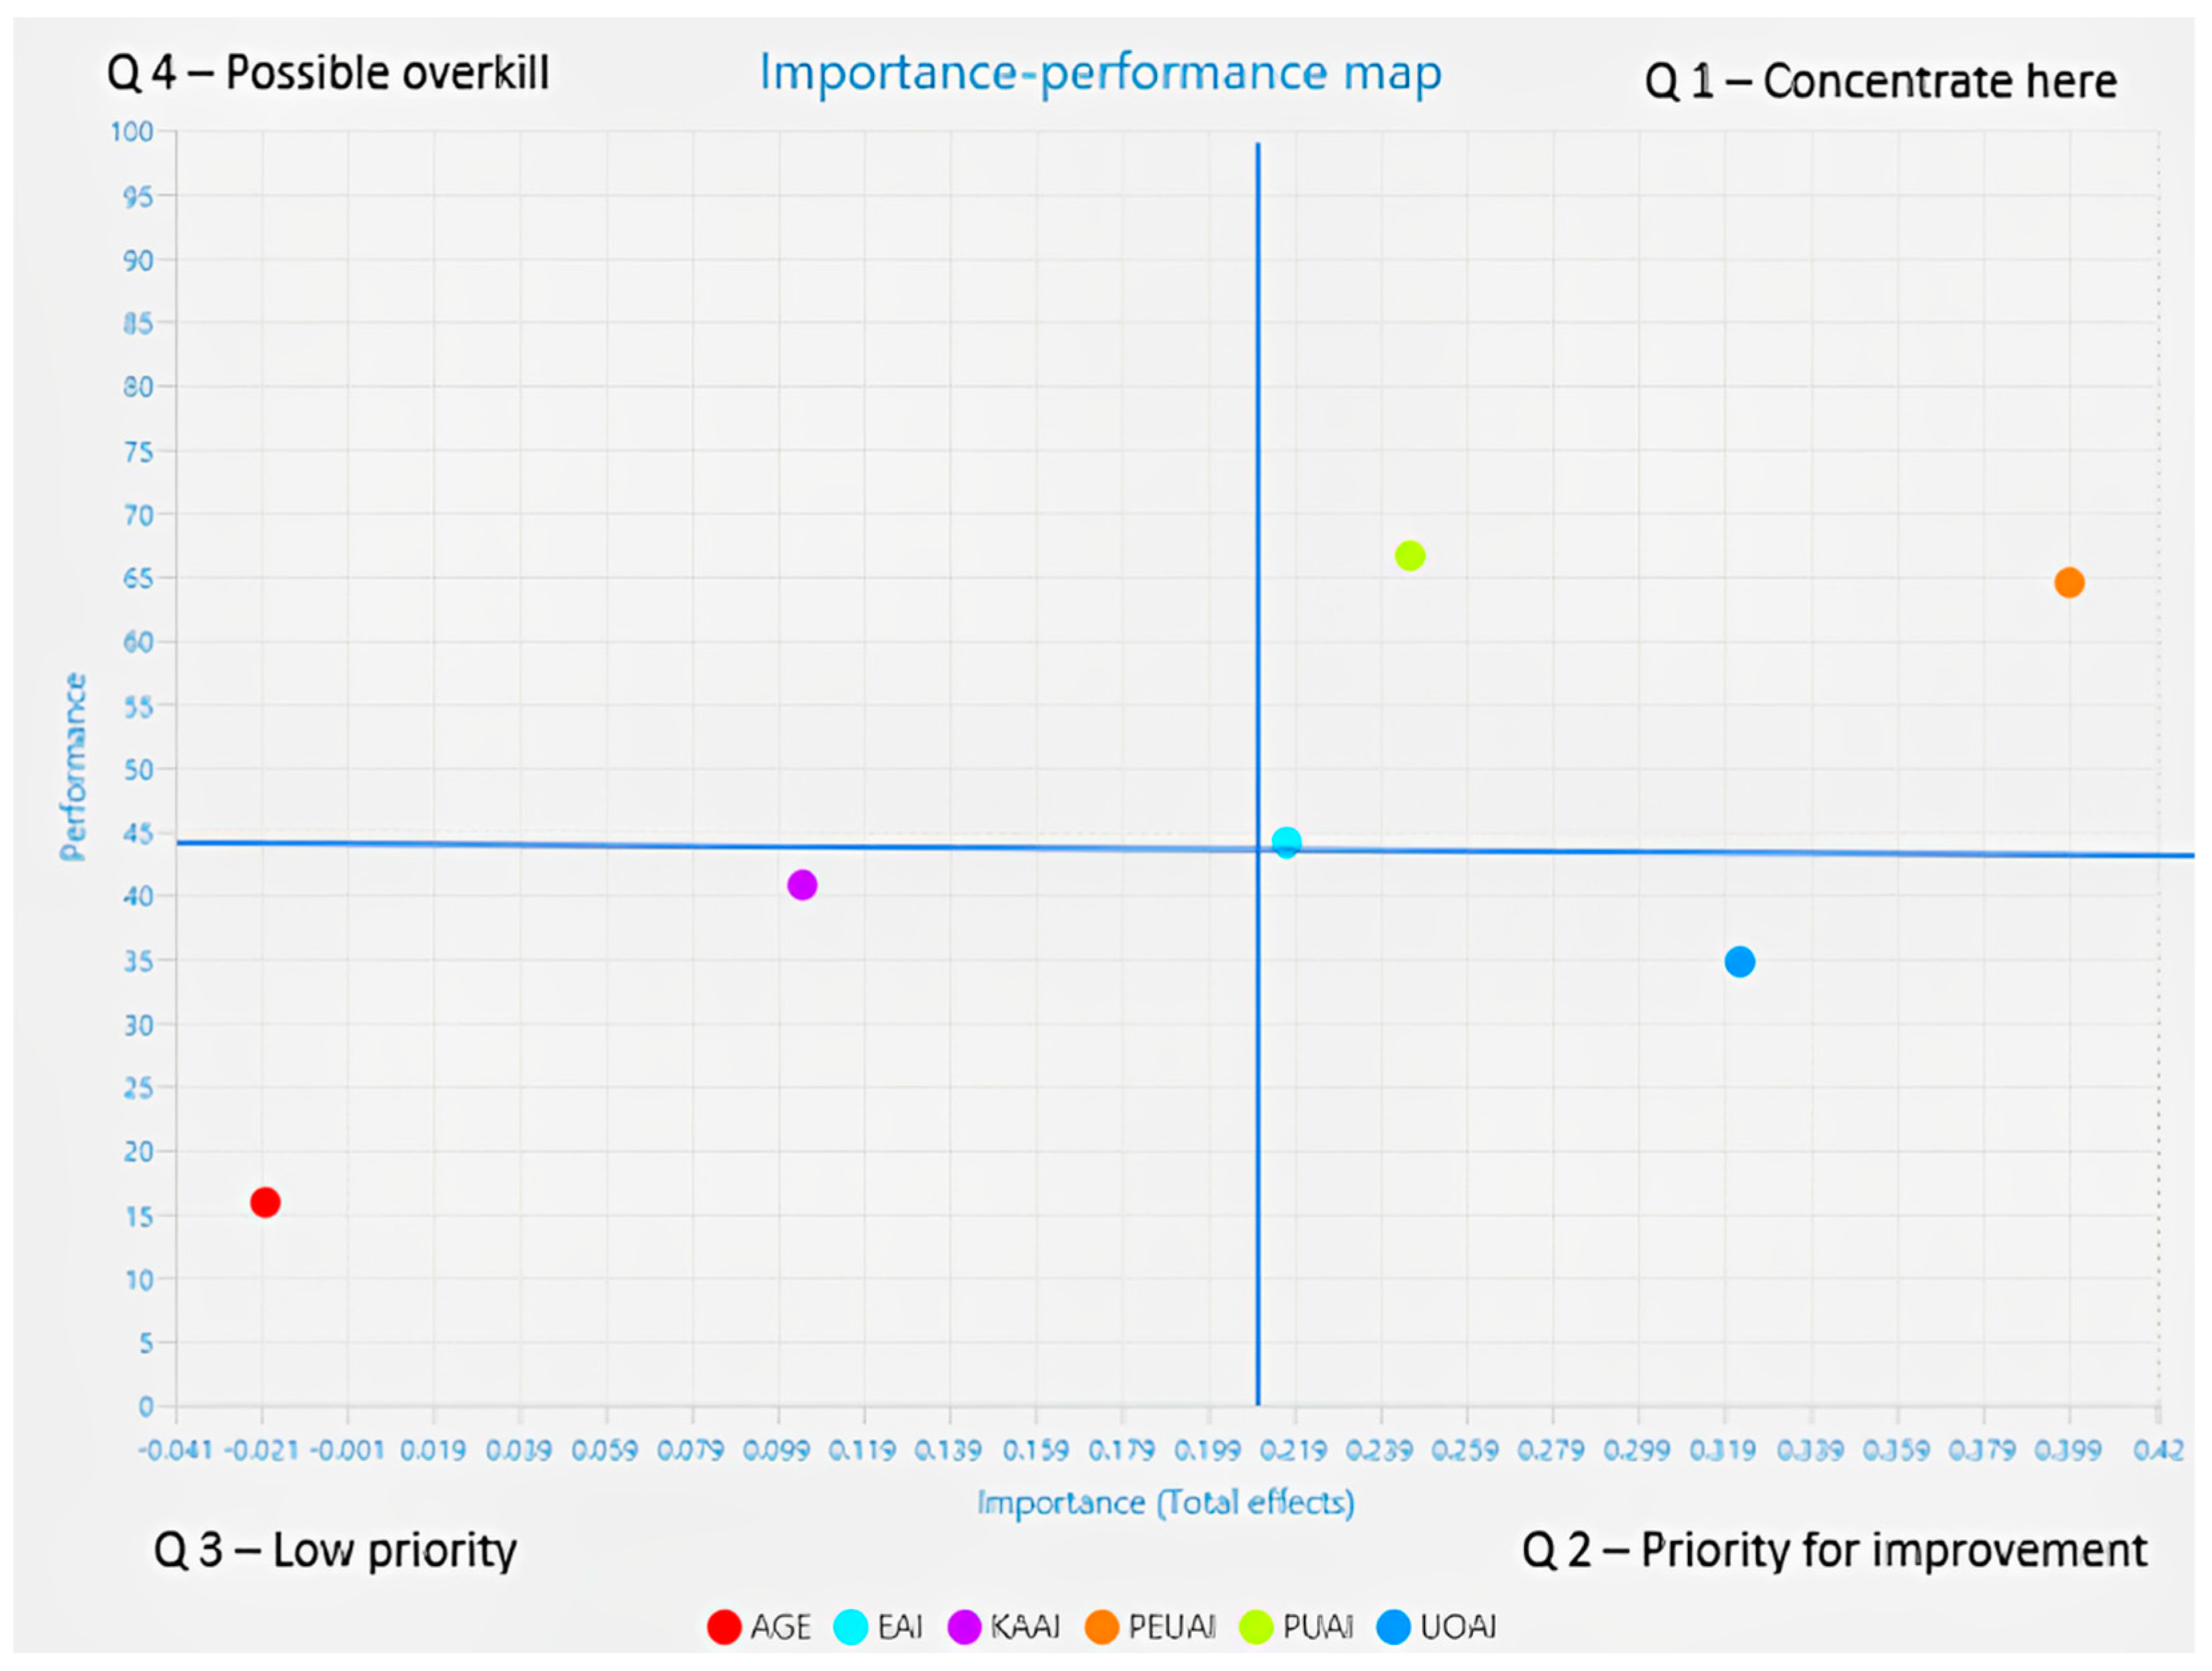
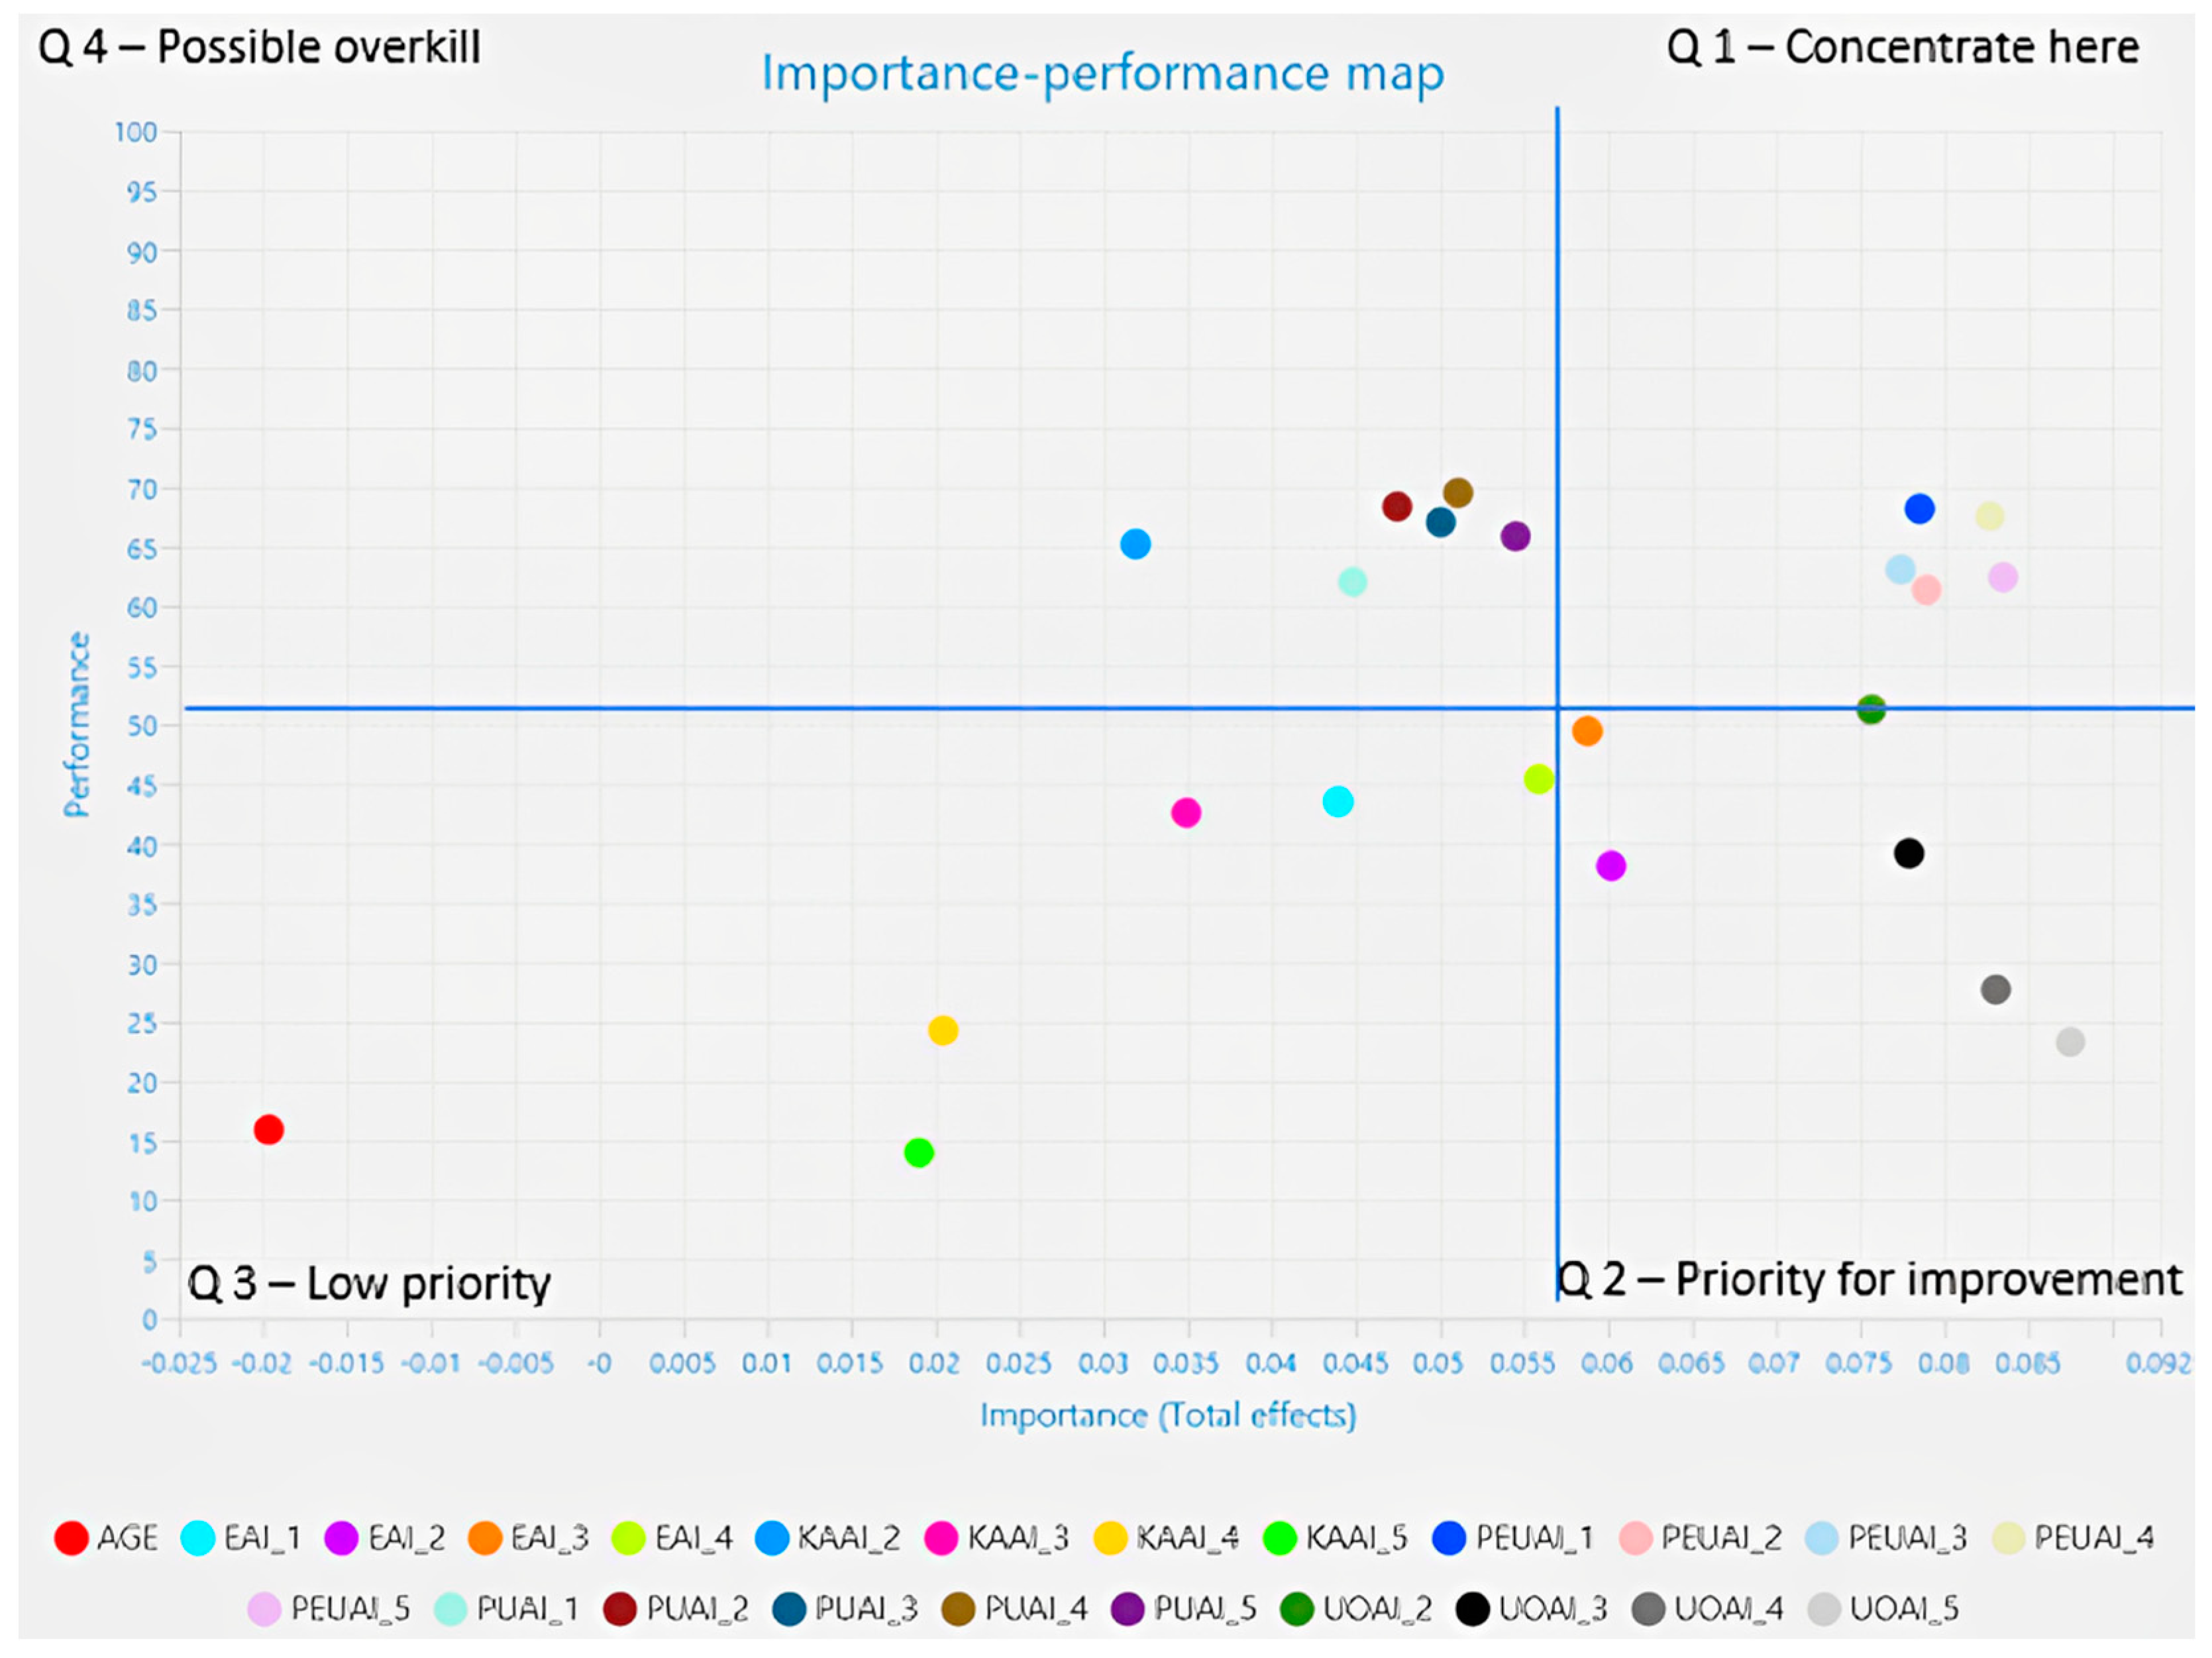
5.3. Importance–Performance Analysis (IPA)

Figure 3 presents the IPA for the PI target construct at the construct level. The IPA is divided into four quadrants: Q1 (Concentrate here), Q2 (Priority for improvement), Q3 (Low priority), and Q4 (Possible overkill). Each represents a different combination of importance and performance levels. Five variables are plotted on the IPA: Age, EAI, KAI, PEUAI, and PUAI. The quadrants are delimited using the mean of performance (44.451) and mean of importance (0.211667) reported in the importance–performance map analysis (IPMA) results at the construct level. The results show that UOAI holds high importance and could potentially be leveraged even more effectively. EAI, PEUAI, and PUAI are important and perform well. Age and KAAI are of low priority.
Figure 4 displays the IPA map for the PI target construct at the indicator level. The results show that the highest performing indicators are EAI_2, UOAI_3, UOAI_4, and UOAI_5 (Q2), as well as UOAI_2, EAI_3, PEUAI_1, PEUAI_2, PEUAI_3, PEUAI_4, and PEUAI_5 (Q1). Table 9 provides the details for all the indicators. From these results, we may assume that to enhance purchase intention, companies should prioritize the improvement of applications that use AI to perform specific tasks and allow voice recognition and personalized recommendations for their users (EAI_2). Moreover, the level of AI technology usage proves to be important for stimulating purchase intention. Therefore, companies should also consider stimulating users to frequently use VAs and in-app recommendations (UOAI_3), making them feel that they can integrate AI into their daily activities (UOAI_2), and encouraging them to consider it essential for day-to-day use (UOAI_3).
The most important and well-performing indicators concern experimenting with AI technologies to better understand how they work (EAI_3) and assessing their PEOU. Therefore, the focus should continue to be on the ease-of-use of AI in online shops (PEUAI_1), while providing alternative products/services to reduce cognitive effort (PEUAI_2) and suggesting different products/services (PEUAI_3). Additionally, the ease-of-use of AI-aided online shops and shopping apps (PEUAI_4), combined with the simplicity of acquiring the necessary skills to use them (PEUAI_5), are very important and well-performing indicators for purchase intention.

6. Discussion and Conclusions

6.1. Discussion

This study and the testing of its hypotheses were motivated by the rapid evolution of AI. The study endeavored to analyze the interplay between AI applications in sales and marketing and their influence on consumer purchase intentions.
In synthesizing the research insights, our study employs a robust methodology that combines the refined analysis capabilities of PLS-SEM and IPA. This enabled an intricate parsing of the relationships between the multiple observed variables, offering a multilayered understanding of the impact of AI on consumer behavior.
Within the investigative scope of the study, IPA highlights the intricacies of the relationships between various factors associated with AI and their impact on purchase intention within the domain of sales and marketing. It provides a framework from which to derive strategic implications based on the distribution of variables across the IPA quadrants.
Within Figure 3, Quadrant 1 (Q1) contains the variables PUAI and PEUAI, and reflects an alignment wherein both PU and PEUAI exhibit high importance and performance in sales and marketing. This indicates that current methodologies and implementations of AI in these areas are well-received and regarded as effective by the users. Further development and reinforcement in these areas may thus enhance consumer engagement and satisfaction.
The presence of UOAI and EAI along the boundary between Quadrant 1 (Q1) and Quadrant 2 (Q2) indicates a notable but less profound alignment between perceived importance and performance. This suggests that, while AI use and exposure are recognized as valuable constructs influencing purchase intention, there is potential for improvement in their practical application or consumer engagement levels. This presents an opportunity for strategic initiatives aimed at bolstering consumer experiences and integrating AI functionalities more deeply into consumer interactions.
Quadrant 3 (Q3), which contains Age and KAAI, is an area of lower priority in which the variables are ranked lower as to perceived importance and performance, compared to those in Q1. The presence of Age as a variable suggests that demographic factors are less critical in influencing PI toward AI inclusion in sales and marketing. However, despite its lower performance and importance ratings, KAAI suggests the potential need for educational-enrichment programs to elevate the levels of general understanding and knowledge of AI.
Quadrant 4 (Q4) contains no variables from this study, indicating that none of the variables are perceived as low in both importance and performance.
The current dynamics suggest a consensus on the benefits of AI, with room for growth in user adoption and exposure. The less salient influence of age-related demographics and AI knowledge levels highlights the need to re-evaluate target segments and the diffusion of AI knowledge to enhance overall understanding and receptivity to AI-driven solutions.
The overarching implication from the IPA is a strategic bifurcation, emphasizing the need to consolidate areas where AI is thriving while also enhancing user familiarity and engagement with AI functionality to build a stronger AI-accustomed consumer base. This dual approach can inform future efforts aimed at ensuring that the AI-driven transformation in sales and marketing continues to align with evolving consumer paradigms.
Moreover, the current investigation’s application of IPA on the items included in this research highlights critical areas where the implementation of AI in sales and marketing intersects with consumer purchase intentions. The distinct quadrant placement of each item within the IPA matrix reveals varied implications for strategic focus.
The placement of indicators within Quadrant 2 (Q2) signifies a discrepancy, in that high importance is met with suboptimal performance. For instance, EAI_2 (I have installed and used AI applications to do specific tasks, such as voice recognition or personalized recommendations), despite its evident importance, has a suboptimal performance score of 38.121. This gap implies a crucial opportunity for improvement, suggesting that while consumers recognize the significance of these AI functionalities, improvement is needed relative to their implementation or the user experience.
Similarly, UOAI_3 (I use AI technologies frequently, such as VAs or AI recommendations in apps), UOAI_4 (I depend on AI technologies in a variety of situations and integrate them into my daily activities), and UOAI_5 (I use AI technologies extensively and consider them essential to my daily functioning), while regarded as impactful, show a need for progress, as highlighted by their modest performance scores of 39.162, 27.704, and 23.293, respectively.
Conversely, the indicators situated in Quadrant 1 (Q1) represent the optimal case of high importance and high performance. PEUAI_1 (I see the use of AI in sales and marketing as innovative and beneficial), PEUAI_2 (I believe AI can bring significant improvements to sales and marketing strategies), PEUAI_3 (I see AI as an effective tool for personalizing offers and customer experiences), PEUAI_4 (I believe that the use of AI can help increase efficiency in sales and marketing), and PEUAI_5 (In general, I have a positive perception of the use of AI in sales and marketing) all have performance scores above 60, indicating that consumers perceive these areas as both effective and favorable.
EAI_3 (I have explored and experimented with AI technologies to understand how they work) and UOAI_2 (I use AI applications to make my life easier, but not regularly) also lie within this quadrant, highlighting that while consumers show an inclination towards engaging with AI, consistent usage patterns are not yet firmly established.
Abstracting from the IPA, there is a clear imperative to galvanize AI applications where their performance lags behind the attributed importance. This misalignment calls for increased efforts to refine AI user experiences and integrate AI more seamlessly into consumers’ daily lives. Simultaneously, where AI’s application is both valued and well-received, the required strategy is one of maintenance and advancement, ensuring that AI’s positive reception is leveraged to cement and expand market presence.
In sum, the findings signal the need for a dual-pronged strategy in which attention is directed towards enhancing the efficacy of AI in critical yet underperforming areas, while also sustaining and enhancing areas in which its utility is perceived and realized to be beneficial. This will require a dynamic and responsive approach to consumer feedback, ensuring alignment with emergent consumer expectations and the continuous evolution of AI technologies.

6.2. Theoretical Implications

Through the thorough research we have performed, we were able to identify key theoretical findings in the previous analyses of our colleagues that helped us better bridge the gaps in knowledge. By addressing these issues, our scope was able to offer a more nuanced understanding of how AI affects consumer behavior and purchase intention, both of them being key concepts in marketing strategies and business decisions.
First of all, Smith et al. [35] elucidated the role of cultural determinants within online shopping behaviors, revealing disparities in the robustness of the TAM across varied cultural landscapes. While our study does not directly analyze culture, it implicitly recognizes the TAM’s multidimensionality and cultural sensitivity by incorporating a range of demographic items that capture cultural nuances indirectly.
Additionally, Fayad and Paper [34] advocated for an augmented TAM, suggesting that the inclusion of process and outcome satisfaction, alongside consumer expectations and actual online shopping utilization, would yield a sharper understanding of user behavior. Our research complements this stance by exploring how the integration of AI within sales processes correlates with actual purchase intentions and aligns with process satisfaction parameters.
Furthermore, Fedorko et al. [55] proposed a modified version of the TAM that considers modern technological constructs, emphasizing the need for classic models to evolve with technological advancements. While our study focuses on the influence of AI, it reinforces the idea that emerging technologies must be embedded into the ongoing evolution of theoretical behavioral models.
Liang et al. [43] focused on consumer receptivity to AI technology, identifying PU, PEOU, and performance risk as crucial elements shaping attitudes and subsequent purchase inclinations. Our study extends beyond individual device acceptance to more broadly examine the utilitarian impact of AI across diverse sales and marketing contexts, encapsulating performance risk considerations through pragmatic applications of AI.
Moreover, Yin and Qiu [48] adopted the SOR paradigm, breaking AI-enhanced online shopping experiences down into three salient dimensions, positing this division as instrumental in gauging consumers’ perceived utility and hedonic satisfaction. This aligns with the goal of our study to reveal how exposure to and utilization of AI technologies—which can represent Yin and Qiu’s utility and hedonic dimensions—affect purchase intentions.
Last, but not least, Bhagat et al. [41] explored the intricacies of AI integration in e-retailing and its effects on consumer purchasing propensities. Our study complements this inquiry, albeit through quantitative analysis using PLS-SEM and IPA methodologies. While Bhagat et al. examined constructs such as faith and consciousness in AI acceptance, the measurements in our study interact with these constructs beneath the surface of articulated hypotheses and observed indicators.
To sum up, this study provides several unique contributions to the existing body of knowledge in technology acceptance and consumer behavior. It expands the TAM by integrating constructs such as PU and PEOU, specifically in the context of AI applications in sales and marketing. This enhances our understanding of how these elements shape consumer purchase intentions.
Additionally, the study underscores the significance of user perceptions in the acceptance and use of AI technologies, as evidenced by the positive influence of AI exposure on PU and PEOU. It validates the mediating role of both PU and PEOU in the relationships between AI exposure, usage, and knowledge, and purchase intentions, providing empirical support for the theory that user perceptions are pivotal in mediating the impacts of technology exposure and usage on behavioral outcomes. This particular finding represents a key piece of information because it shows the importance of user perception in translating AI related experiences into behavioral outcomes. Keeping in mind that the TAM suggests that PU and PEOU heavily influence technology adoption, our study reinforces the fact that these two factors mediate the influence of external variables, such as exposure to AI or knowledge about AI, hence adding a new dimension to the model.
Moreover, the study reveals that increased AI knowledge positively affects PU and PEOU, subsequently boosting purchase intentions, and highlighting the need to bridge user knowledge gaps to promote wider acceptance and adoption of AI technologies.
In conclusion, our research highlights the crucial mediating roles played by PU and PEOU in shaping the Gen Z purchase intention, which can furthermore pave the way to more culturally sensitive and adaptive technology-based acceptance models. Having in mind these theoretical contributions, the managerial implications of our findings furthermore offer significant guidance for managers and business owners who aim to leverage AI technologies to influence consumer behavior.

6.3. Managerial Implications

The study’s findings offer valuable insights for sales and marketing managers and practitioners, especially those utilizing AI technologies to enhance consumer engagement and drive purchase intentions. To capitalize on these insights, businesses are advised to prioritize AI applications that deliver tangible consumer benefits, such as personalized recommendations and voice recognition functionalities, which have been demonstrated to positively influence PU and PEOU, thereby driving purchase intentions.
The study also highlights the need for businesses to recognize the varying levels of AI exposure, usage, and knowledge among their target audience. This suggests that a one-size-fits-all approach may not be effective. For consumers with limited experience or knowledge of AI, businesses should focus on educational efforts to build trust and familiarity relative to AI’s advantages in online shopping [75]. These efforts could include clear explanations of AI features, tutorials, or even educational campaigns that demonstrate benefits such as more efficient shopping experiences or better product matches. For more advanced users, companies can enhance the shopping experience by introducing more sophisticated AI features, such as predictive analytics or personalized, real-time shopping assistants. Additionally, targeted promotions and communications tailored to each consumer’s level of AI familiarity can help reduce resistance and foster greater acceptance of these technologies. This could help reduce any mistrust or resistance toward AI, particularly for consumers with lower exposure.
Managers are encouraged to take a proactive approach in optimizing the user experience by aligning AI applications with consumer preferences as identified through the IPA [41]. Refining existing AI functionalities is key in order to meet the diverse needs of users [76]. This includes simplifying user interfaces, improving the accessibility of AI-powered features, and ensuring a seamless shopping experience that enhances overall satisfaction and purchase intentions. Since both PUAI and perceived ease-of-use (PEUAI) significantly impact PI, retailers should invest in AI tools that are intuitive and clearly beneficial to consumers [33]. Offering features like personalized recommendations, seamless navigation, and simplified checkout processes can increase the perceived value of AI and directly enhance purchase intentions.
Given the study’s demonstration of complementary mediation effects between PU and PEOU, businesses should adopt a holistic strategy that addresses both of these factors to maximize their impact on consumer behavior. Balancing efforts to enhance both the practical value and user-friendliness of AI tools will ensure a stronger influence on purchasing decisions [75]. Furthermore, companies that integrate these insights into their strategic planning and decision-making processes will be better positioned to harness AI’s full potential, driving sales and improving customer satisfaction in an increasingly competitive digital marketplace.

6.4. Study Limitations and Future Research Directions

While this study provides valuable insights and makes a significant contribution to the field, it is important to acknowledge that no research is without limitations. These limitations offer opportunities for further exploration, allowing future research to expand upon and deepen the findings of this study.
One of the key limitations of this study is its reliance on self-reported behavior, which may introduce biases or inaccuracies due to subjective reporting. To enhance the validity and robustness of future research, alternative methodologies could be employed. For example, incorporating observational methods or tracking actual user interactions with AI applications would provide more objective data [77].
Moreover, future research could explore how individual differences such as personality traits and cognitive styles influence the PU and PEOU of AI technologies. Longitudinal studies could offer insights into the dynamic interplay between evolving AI functionalities and user exposure [78]. Extending the research to different cultural contexts could ascertain the universality of the observed relationships [79,80].
Future research should also investigate the unexplained variances observed in this study by exploring additional factors that may influence Gen Z’s purchase intentions on AI-powered online shopping platforms. For instance, examining the role of consumer trust in AI, particularly the question of how trust is established and maintained through transparent AI systems, could provide deeper insights into its effects on purchase behavior [81]. Moreover, comparing the effectiveness of different AI applications—such as chatbots, recommendation algorithms, or augmented reality tools—could help identify which technologies most effectively drive consumer engagement and satisfaction.
Finally, future studies could explore the ethical considerations surrounding AI, particularly in relation to privacy, data security, and algorithmic transparency [81]. As AI continues to play a larger role in online retail, understanding how these ethical factors influence consumer perceptions and purchase intentions will be crucial for businesses aiming to build trust and foster long-term customer relationships.

Author Contributions

Conceptualization, O.-I.B. and R.-A.C.; methodology, O.-I.B.; software, O.-I.B.; validation, O.-I.B. and A.T.; formal analysis, O.-I.B.; investigation, S.I.M. and M.T.; resources, S.I.M., M.T., R.-A.C. and A.T.; data curation, S.I.M. and M.T.; writing—original draft preparation, O.-I.B., S.I.M., M.T. and A.T.; writing—review and editing, R.-A.C. and A.T.; visualization, A.T.; supervision, O.-I.B.; project administration, O.-I.B. All authors have read and agreed to the published version of the manuscript.

Funding

This research received no external funding.

Institutional Review Board Statement

Ethical review and approval were waived for this study as our institutions do not have an Institutional Review Board. We affirm that the study was conducted according to the guidelines of the Declaration of Helsinki.

Informed Consent Statement

Informed consent was obtained from all subjects involved in the study.

Data Availability Statement

The raw data supporting the conclusions of this article will be made available by the authors on request.

Conflicts of Interest

The authors declare no conflicts of interest.

References

  1. Dolega, L.; Rowe, F.; Branagan, E. Going Digital? The Impact of Social Media Marketing on Retail Website Traffic, Orders and Sales. J. Retail. Consum. Serv. 2021, 60, 102501. [Google Scholar] [CrossRef]
  2. Yilmaz, Z. Ranking Online Shopping Websites by Considering the Criteria Weights. J. Bus. Res. 2022, 144, 497–512. [Google Scholar] [CrossRef]
  3. Statista. Retail E-Commerce Sales Worldwide from 2014 to 2027; Statista Inc.: Hamburg, Germany, 2023. [Google Scholar]
  4. Faqih, K.M.S. Internet Shopping in the COVID-19 Era: Investigating the Role of Perceived Risk, Anxiety, Gender, Culture, and Trust in the Consumers’ Purchasing Behavior from a Developing Country Context. Technol. Soc. 2022, 70, 101992. [Google Scholar] [CrossRef]
  5. Ameen, N.; Tarhini, A.; Reppel, A.; Anand, A. Customer Experiences in the Age of Artificial Intelligence. Comput. Human. Behav. 2021, 114, 106548. [Google Scholar] [CrossRef] [PubMed]
  6. Kautish, P.; Purohit, S.; Filieri, R.; Dwivedi, Y.K. Examining the Role of Consumer Motivations to Use Voice Assistants for Fashion Shopping: The Mediating Role of Awe Experience and EWOM. Technol. Forecast. Soc. Chang. 2023, 190, 122407. [Google Scholar] [CrossRef]
  7. Alimamy, S.; Gnoth, J. I Want It My Way! The Effect of Perceptions of Personalization through Augmented Reality and Online Shopping on Customer Intentions to Co-Create Value. Comput. Human. Behav. 2022, 128, 107105. [Google Scholar] [CrossRef]
  8. Fu, J.; Mouakket, S.; Sun, Y. The Role of Chatbots’ Human-like Characteristics in Online Shopping. Electron. Commer. Res. Appl. 2023, 61, 101304. [Google Scholar] [CrossRef]
  9. Guha, A.; Grewal, D.; Kopalle, P.K.; Haenlein, M.; Schneider, M.J.; Jung, H.; Moustafa, R.; Hegde, D.R.; Hawkins, G. How Artificial Intelligence Will Affect the Future of Retailing. J. Retail. 2021, 97, 28–41. [Google Scholar] [CrossRef]
  10. Ameen, N.; Hosany, S.; Taheri, B. Generation Z’s Psychology and New-age Technologies: Implications for Future Research. Psychol. Mark. 2023, 40, 2029–2040. [Google Scholar] [CrossRef]
  11. Insider Intelligence. Guide to Gen Z: What Matters to This Generation and What It Means for Marketers; Insider Intelligence Inc.: New York, NY, USA, 2024. [Google Scholar]
  12. Guo, W.; Luo, Q. Investigating the Impact of Intelligent Personal Assistants on the Purchase Intentions of Generation Z Consumers: The Moderating Role of Brand Credibility. J. Retail. Consum. Serv. 2023, 73, 103353. [Google Scholar] [CrossRef]
  13. Rahilly, L.; Finneman, B.; Spagnuolo, E. Meet Generation Z: Shaping the Future of Shopping; McKinsey & Company: New York, NY, USA, 2020. [Google Scholar]
  14. Davis, F.D. Perceived Usefulness, Perceived Ease of Use, and User Acceptance of Information Technology. MIS Q. 1989, 13, 319. [Google Scholar] [CrossRef]
  15. Granić, A. Technology Acceptance and Adoption in Education. In Handbook of Open, Distance and Digital Education; Springer: Singapore, 2022; pp. 1–15. [Google Scholar] [CrossRef]
  16. Rosli, M.S.; Saleh, N.S.; Ali, A.M.; Abu Bakar, S.; Mohd Tahir, L. A Systematic Review of the Technology Acceptance Model for the Sustainability of Higher Education during the COVID-19 Pandemic and Identified Research Gaps. Sustainability 2022, 17, 11389. [Google Scholar] [CrossRef]
  17. Jenneboer, L.; Herrando, C.; Constantinides, E. The Impact of Chatbots on Customer Loyalty: A Systematic Literature Review. J. Theor. Appl. Electron. Commer. Res. 2022, 17, 212–229. [Google Scholar] [CrossRef]
  18. Paschen, J.; Kietzmann, J.; Kietzmann, T.C. Artificial Intelligence (AI) and Its Implications for Market Knowledge in B2B Marketing. J. Bus. Ind. Mark. 2019, 34, 1410–1419. [Google Scholar] [CrossRef]
  19. Bawack, R.E.; Wamba, S.F.; Carillo, K.D.A.; Akter, S. Artificial Intelligence in E-Commerce: A Bibliometric Study and Literature Review. Electron. Mark. 2022, 32, 297–338. [Google Scholar] [CrossRef]
  20. Marikyan, D.; Papagiannidis, S. Technology Acceptance Model: A Review; TheoryHub Book: Newcastle upon Tyne, UK, 2023. [Google Scholar]
  21. Deveau, R.; Joseph Griffin, S.; Reis, S. AI-Powered Marketing and Sales Reach New Heights with Generative AI; McKinsey & Company: New York, NY, USA, 2023. [Google Scholar]
  22. Priporas, C.-V.; Stylos, N.; Fotiadis, A.K. Generation Z Consumers’ Expectations of Interactions in Smart Retailing: A Future Agenda. Comput. Human. Behav. 2017, 77, 374–381. [Google Scholar] [CrossRef]
  23. Goldring, D.; Azab, C. New Rules of Social Media Shopping: Personality Differences of U.S. Gen Z versus Gen X Market Mavens. J. Consum. Behav. 2021, 20, 884–897. [Google Scholar] [CrossRef]
  24. Eger, L.; Komárková, L.; Egerová, D.; Mičík, M. The Effect of COVID-19 on Consumer Shopping Behaviour: Generational Cohort Perspective. J. Retail. Consum. Serv. 2021, 61, 102542. [Google Scholar] [CrossRef]
  25. Kim, W.B.; Xie, J.; Choo, H.J. Role of Perceived Benefits of Online Shopping Festival in Vietnam: Differences between Millennials and Generation Z. J. Retail. Consum. Serv. 2023, 75, 103530. [Google Scholar] [CrossRef]
  26. Thangavel, P.; Pathak, P.; Chandra, B. Consumer Decision-Making Style of Gen Z: A Generational Cohort Analysis. Glob. Bus. Rev. 2022, 23, 710–728. [Google Scholar] [CrossRef]
  27. IBM Institute of Business value & National Retail Federation. What Do Gen Z Shoppers Really Want; IBM Corporation: Armonk, NY, USA; National Retail Federation: Washington, DC, USA, 2018. [Google Scholar]
  28. McKinsey & Company. What Is Gen Z? McKinsey & Company: New York, NY, USA, 2023. [Google Scholar]
  29. Le, T.-M.H.; Ngoc, B.M. Consumption-Related Social Media Peer Communication and Online Shopping Intention among Gen Z Consumers: A Moderated-Serial Mediation Model. Comput. Human. Behav. 2024, 153, 108100. [Google Scholar] [CrossRef]
  30. Pop, R.-A.; Hlédik, E.; Dabija, D.-C. Predicting Consumers’ Purchase Intention through Fast Fashion Mobile Apps: The Mediating Role of Attitude and the Moderating Role of COVID-19. Technol. Forecast. Soc. Chang. 2023, 186, 122111. [Google Scholar] [CrossRef]
  31. Liu, H.; Liu, W.; Yoganathan, V.; Osburg, V.-S. COVID-19 Information Overload and Generation Z’s Social Media Discontinuance Intention during the Pandemic Lockdown. Technol. Forecast. Soc. Chang. 2021, 166, 120600. [Google Scholar] [CrossRef] [PubMed]
  32. Ng, S.I.; Ho, J.A.; Lim, X.J.; Chong, K.L.; Latiff, K. Mirror, Mirror on the Wall, Are We Ready for Gen-Z in Marketplace? A Study of Smart Retailing Technology in Malaysia. Young Consum. 2021, 22, 68–89. [Google Scholar] [CrossRef]
  33. Hoyer, W.D.; Kroschke, M.; Schmitt, B.; Kraume, K.; Shankar, V. Transforming the Customer Experience Through New Technologies. J. Interact. Mark. 2020, 51, 57–71. [Google Scholar] [CrossRef]
  34. Fayad, R.; Paper, D. The Technology Acceptance Model E-Commerce Extension: A Conceptual Framework. Procedia Econ. Financ. 2015, 26, 1000–1006. [Google Scholar] [CrossRef]
  35. Smith, R.; Deitz, G.; Royne, M.B.; Hansen, J.D.; Grünhagen, M.; Witte, C. Cross-Cultural Examination of Online Shopping Behavior: A Comparison of Norway, Germany, and the United States. J. Bus. Res. 2013, 66, 328–335. [Google Scholar] [CrossRef]
  36. Al-Adwan, A.S.; Li, N.; Al-Adwan, A.; Abbasi, G.A.; Albelbisi, N.A.; Habibi, A. Extending the Technology Acceptance Model (TAM) to Predict University Students’ Intentions to Use Metaverse-Based Learning Platforms. Educ. Inf. Technol. 2023, 28, 15381–15413. [Google Scholar] [CrossRef]
  37. Boo, H.C.; Chua, B.-L. An Integrative Model of Facial Recognition Check-in Technology Adoption Intention: The Perspective of Hotel Guests in Singapore. Int. J. Contemp. Hosp. Manag. 2022, 34, 4052–4079. [Google Scholar] [CrossRef]
  38. Mogaji, E.; Viglia, G.; Srivastava, P.; Dwivedi, Y.K. Is It the End of the Technology Acceptance Model in the Era of Generative Artificial Intelligence? Int. J. Contemp. Hosp. Manag. 2024, 36, 3324–3339. [Google Scholar] [CrossRef]
  39. Ajibade, P. Technology Acceptance Model Limitations and Criticisms: Exploring the Practical Applications and Use in Technology-Related Studies, Mixed-Method, and Qualitative Researches. Libr. Philos. Pract. 2018, 9, 1–13. [Google Scholar]
  40. Araújo, T.; Casais, B. Customer Acceptance of Shopping-Assistant Chatbots. In Marketing and Smart Technologies: Proceedings of ICMarkTech 2019, Maia, Portugal, 27–29 November 2019; Springer: Singapore, 2020; pp. 278–287. [Google Scholar] [CrossRef]
  41. Bhagat, R.; Chauhan, V.; Bhagat, P. Investigating the Impact of Artificial Intelligence on Consumer’s Purchase Intention in e-Retailing. Foresight 2023, 25, 249–263. [Google Scholar] [CrossRef]
  42. Nagy, S.; Hajdu, N. Consumer Acceptance of the Use of Artificial Intelligence in Online Shopping: Evidence From Hungary. Amfiteatru Econ. 2021, 23, 155. [Google Scholar] [CrossRef]
  43. Liang, Y.; Lee, S.-H.; Workman, J.E. Implementation of Artificial Intelligence in Fashion: Are Consumers Ready? Cloth. Text. Res. J. 2020, 38, 3–18. [Google Scholar] [CrossRef]
  44. Qin, M.; Zhu, W.; Zhao, S.; Zhao, Y. Is Artificial Intelligence Better than Manpower? The Effects of Different Types of Online Customer Services on Customer Purchase Intentions. Sustainability 2022, 14, 3974. [Google Scholar] [CrossRef]
  45. Chi, O.H.; Chi, C.G.; Gursoy, D.; Nunkoo, R. Customers’ Acceptance of Artificially Intelligent Service Robots: The Influence of Trust and Culture. Int. J. Inf. Manag. 2023, 70, 102623. [Google Scholar] [CrossRef]
  46. Gursoy, D.; Chi, O.H.; Lu, L.; Nunkoo, R. Consumers Acceptance of Artificially Intelligent (AI) Device Use in Service Delivery. Int. J. Inf. Manag. 2019, 49, 157–169. [Google Scholar] [CrossRef]
  47. Lee, C.T.; Pan, L.-Y.; Hsieh, S.H. Artificial Intelligent Chatbots as Brand Promoters: A Two-Stage Structural Equation Modeling-Artificial Neural Network Approach. Internet Res. 2022, 32, 1329–1356. [Google Scholar] [CrossRef]
  48. Yin, J.; Qiu, X. AI Technology and Online Purchase Intention: Structural Equation Model Based on Perceived Value. Sustainability 2021, 13, 5671. [Google Scholar] [CrossRef]
  49. Aiolfi, S. How Shopping Habits Change with Artificial Intelligence: Smart Speakers’ Usage Intention. Int. J. Retail Distrib. Manag. 2023, 51, 1288–1312. [Google Scholar] [CrossRef]
  50. Brill, T.M.; Munoz, L.; Miller, R.J. Siri, Alexa, and Other Digital Assistants: A Study of Customer Satisfaction with Artificial Intelligence Applications. J. Mark. Manag. 2019, 35, 1401–1436. [Google Scholar] [CrossRef]
  51. Nicolescu, L.; Tudorache, M.T. Human-Computer Interaction in Customer Service: The Experience with AI Chatbots—A Systematic Literature Review. Electronics 2022, 11, 1579. [Google Scholar] [CrossRef]
  52. Campbell, C.; Sands, S.; Ferraro, C.; Tsao, H.-Y.J.; Mavrommatis, A. From Data to Action: How Marketers Can Leverage AI. Bus. Horiz. 2020, 63, 227–243. [Google Scholar] [CrossRef]
  53. Yeo, S.F.; Tan, C.L.; Kumar, A.; Tan, K.H.; Wong, J.K. Investigating the Impact of AI-Powered Technologies on Instagrammers’ Purchase Decisions in Digitalization Era–A Study of the Fashion and Apparel Industry. Technol. Forecast. Soc. Chang. 2022, 177, 121551. [Google Scholar] [CrossRef]
  54. Hyun, H.; Thavisay, T.; Lee, S.H. Enhancing the Role of Flow Experience in Social Media Usage and Its Impact on Shopping. J. Retail. Consum. Serv. 2022, 65, 102492. [Google Scholar] [CrossRef]
  55. Fedorko, I.; Bacik, R.; Gavurova, B. Technology Acceptance Model in E-Commerce Segment. Manag. Mark. 2018, 13, 1242–1256. [Google Scholar] [CrossRef]
  56. Malhotra, G.; Ramalingam, M. Perceived Anthropomorphism and Purchase Intention Using Artificial Intelligence Technology: Examining the Moderated Effect of Trust. J. Enterp. Inf. Manag. 2023. [Google Scholar] [CrossRef]
  57. Chen, H.; Chan-Olmsted, S.; Kim, J.; Mayor Sanabria, I. Consumers’ Perception on Artificial Intelligence Applications in Marketing Communication. Qual. Mark. Res. An Int. J. 2022, 25, 125–142. [Google Scholar] [CrossRef]
  58. Yen, C.; Chiang, M.-C. Trust Me, If You Can: A Study on the Factors That Influence Consumers’ Purchase Intention Triggered by Chatbots Based on Brain Image Evidence and Self-Reported Assessments. Behav. Inf. Technol. 2021, 40, 1177–1194. [Google Scholar] [CrossRef]
  59. Davis, F.D. User Acceptance of Information Technology: System Characteristics, User Perceptions and Behavioral Impacts. Int. J. Man. Mach. Stud. 1993, 38, 475–487. [Google Scholar] [CrossRef]
  60. Moriuchi, E. Okay, Google!: An Empirical Study on Voice Assistants on Consumer Engagement and Loyalty. Psychol. Mark. 2019, 36, 489–501. [Google Scholar] [CrossRef]
  61. Zhang, Y.; Wang, S. The Influence of Anthropomorphic Appearance of Artificial Intelligence Products on Consumer Behavior and Brand Evaluation under Different Product Types. J. Retail. Consum. Serv. 2023, 74, 103432. [Google Scholar] [CrossRef]
  62. Ahmed, Z.; Asghar, M.M.; Malik, M.N.; Nawaz, K. Moving towards a Sustainable Environment: The Dynamic Linkage between Natural Resources, Human Capital, Urbanization, Economic Growth, and Ecological Footprint in China. Resour. Policy 2020, 67, 101677. [Google Scholar] [CrossRef]
  63. Chen, I.S.; Fellenz, M.R. Personal Resources and Personal Demands for Work Engagement: Evidence from Employees in the Service Industry. Int. J. Hosp. Manag. 2020, 90, 102600. [Google Scholar] [CrossRef]
  64. Ringle, C.M.; Wende, S.; Becker, J.-M. SmartPLS 4.SmartPLS. GmbH: Oststeinbek, Germany, 2022; Available online: https://www.smartpls.com (accessed on 7 January 2024).
  65. Ringle, C.M.; Sarstedt, M. Gain More Insight from Your PLS-SEM Results. Ind. Manag. Data Syst. 2016, 116, 1865–1886. [Google Scholar] [CrossRef]
  66. Podsakoff, P.M.; MacKenzie, S.B.; Podsakoff, N.P. Sources of Method Bias in Social Science Research and Recommendations on How to Control It. Annu. Rev. Psychol. 2012, 63, 539–569. [Google Scholar] [CrossRef]
  67. MacKenzie, S.B.; Podsakoff, P.M. Common Method Bias in Marketing: Causes, Mechanisms, and Procedural Remedies. J. Retail. 2012, 88, 542–555. [Google Scholar] [CrossRef]
  68. Fuller, C.M.; Simmering, M.J.; Atinc, G.; Atinc, Y.; Babin, B.J. Common Methods Variance Detection in Business Research. J. Bus. Res. 2016, 69, 3192–3198. [Google Scholar] [CrossRef]
  69. Podsakoff, P.M.; MacKenzie, S.B.; Lee, J.-Y.; Podsakoff, N.P. Common Method Biases in Behavioral Research: A Critical Review of the Literature and Recommended Remedies. J. Appl. Psychol. 2003, 88, 879–903. [Google Scholar] [CrossRef] [PubMed]
  70. Hair, J.F.; Hult, G.T.M.; Ringle, C.M.; Sarstedt, M. A Primer on Partial Least Squares Structural Equation Modeling (PLS-SEM), 3rd ed.; Sage: Thousand Oaks, CA, USA, 2022. [Google Scholar]
  71. Sarstedt, M.; Ringle, C.M.; Hair, J.F. Partial Least Squares Structural Equation Modeling. In Handbook of Market Research; Springer International Publishing: Cham, Switzerland, 2021; pp. 1–47. [Google Scholar] [CrossRef]
  72. Hair, J.F.; Sarstedt, M.; Ringle, C.M.; Gudergan, S.S. Advanced Issues in Partial Least Squares Structural Equation Modeling (PLS-SEM), 2nd ed.; Sage: Thousand Oaks, CA, USA, 2024. [Google Scholar]
  73. Hair, J.F.; Risher, J.J.; Sarstedt, M.; Ringle, C.M. When to Use and How to Report the Results of PLS-SEM. Eur. Bus. Rev. 2019, 31, 2–24. [Google Scholar] [CrossRef]
  74. Henseler, J.; Ringle, C.M.; Sarstedt, M. A New Criterion for Assessing Discriminant Validity in Variance-Based Structural Equation Modeling. J. Acad. Mark. Sci. 2015, 43, 115–135. [Google Scholar] [CrossRef]
  75. Puntoni, S.; Reczek, R.W.; Giesler, M.; Botti, S. Consumers and Artificial Intelligence: An Experiential Perspective. J. Mark. 2021, 85, 131–151. [Google Scholar] [CrossRef]
  76. Gao, Y.; Liu, H. Artificial Intelligence-Enabled Personalization in Interactive Marketing: A Customer Journey Perspective. J. Res. Interact. Mark. 2023, 17, 663–680. [Google Scholar] [CrossRef]
  77. Modi, N.; Singh, J. Understanding Online Consumer Behavior at E-Commerce Portals Using Eye-Gaze Tracking. Int. J. Hum. Comput. Interact. 2023, 39, 721–742. [Google Scholar] [CrossRef]
  78. Hu, P.; Lu, Y.; Wang, B. Experiencing Power over AI: The Fit Effect of Perceived Power and Desire for Power on Consumers’ Choice for Voice Shopping. Comput. Human. Behav. 2022, 128, 107091. [Google Scholar] [CrossRef]
  79. de Boissieu, E.; Baudier, P. The Perceived Credibility of Human-like Social Robots: Virtual Influencers in a Luxury and Multicultural Context. J. Organ. Chang. Manag. 2023, 36, 1163–1179. [Google Scholar] [CrossRef]
  80. Raiu, C.; Mina-Raiu, L. Who Runs Public Administration? A Longitudinal Study of Technocratic Ministerial Appointments in Post-Communist Romania (1991–2021). Transylv. Rev. Adm. Sci. 2023, 19, 109–127. [Google Scholar] [CrossRef]
  81. Chan-Olmsted, S.; Chen, H.; Kim, H.J. In Smartness We Trust: Consumer Experience, Smart Device Personalization and Privacy Balance. J. Consum. Mark. 2024, 41, 597–609. [Google Scholar] [CrossRef]
Figure 1. Conceptual framework.
Jtaer 19 00125 g001
Figure 2. The structural model.
Jtaer 19 00125 g002
Figure 3. IPA for the PI target construct (construct level) Note: The quadrants are delimited using the mean of performance (44.451) and mean of importance (0.211667) reported in the IPMA results table at the construct level.
Jtaer 19 00125 g003
Figure 4. IPA for the PI target construct (indicator level).
Jtaer 19 00125 g004
Table 1. Literature review.
ReferenceContextPredictor Variables Theoretical Framework
[35]Consumer perception and usage of online shopping platforms—the role of cultural differencesBehavioral intentionTAM
[34]E-commerceProcess satisfaction, outcome satisfaction, expectations, and e-commerce useTAM (extended version)
[55]Consumer visiting behavior on online shopping websitesModern technologies (social networks, mobile apps, contextual advertising), intention to revisitTAM (extended version)
[43]Consumer acceptance of fashion-based AIPerceived riskTAM
[42]Consumer adoption and utilization of AI-powered web-shops-TAM
[48]Consumer experiences with AI technology on online shopping platformsPerceived utility value and perceived hedonic valueStimulus–organism-response (SOR)
[41]Consumer purchase intention towards e-retailingFaith, subjective norms, and consciousness-
[54]Consumer behavior in the context of social networking sites used for shoppingFlow experience, shopping intention, social identity, group norm, social influenceFlow theory and TAM
[53]Effects of AI-based digital technology experiences on Instagrammers’ fashion apparel purchase decisionsPerceived electronic word of mouth, perceived emotional value, perceived quality, perceived risk, and perceived priceEKB theory (Engel–Kollat–Blackwell)
[36]University students’ intentions to use metaverse-based learning platformsPersonal innovativeness in IT, perceived enjoyment, perceived cyber-risk, self-efficacyTAM (extended version)
[56]Consumer purchase intention through artificial
intelligence (AI)
Perceived anthropomorphismMedia-richness theory
Current studyOnline shopping, AIExposure to AI, use of AI, knowledge about AITAM
Table 2. Research variables.
Variable and AbbreviationItemsReferences
Level of exposure to AI (EAI)EAI_1 (I have used voice assistants like Siri or Google Assistant in my daily activities)
EAI_2 (I have installed and used AI applications to do specific tasks, such as voice recognition or personalized recommendations)
EAI_3 (I have explored and experimented with AI technologies to understand how they work)
EAI_4 (I have interacted with chatbots or virtual assistants in the online purchase process)
EAI_5 (I have developed or contributed to projects involving the direct use of AI technologies)
[5,17,19]
Level of knowledge about AI (KAAI)KAAI_1 (I consider myself very uninformed about what artificial intelligence means)
KAAI_2 (I know some basics about AI, but I have a lot to learn)
KAAI_3 (I have an average knowledge of artificial intelligence and can explain the basic concepts)
KAAI_4 (I have advanced knowledge of AI and a thorough understanding of how it works)
KAAI_5 (I consider myself an expert in artificial intelligence and can discuss advanced aspects and specific applications)
[56,62]
Level of use of AI (UOAI)UOAI_1 (I only use AI technologies in rare situations and for basic tasks)
UOAI_2 (I use AI applications to make my life easier, but not regularly)
UOAI_3 (I use AI technologies frequently, such as voice assistants or AI recommendations in apps)
UOAI_4 (I depend on AI technologies in a variety of situations and integrate them into my daily activities)
UOAI_5 (I use AI technologies extensively and consider them essential to my daily functioning)
[18,41,48,49,51,53]
Perceived usefulness of AI in sales and marketing (PUAI)PUAI_1 (I see the use of AI in sales and marketing as innovative and beneficial)
PUAI_2 (I believe AI can bring significant improvements to online shopping strategies)
PUAI_3 (I see AI as an effective tool for personalizing offers and customer experiences)
PUAI_4 (I believe that the use of AI can help increase efficiency in online shopping)
PUAI_5 (In general, I have a positive perception of the use of AI in online shopping)
[21,42,43,52]
Perceived ease-of-use of AI in sales and marketing (PEUAI)PEUAI_1 (AI-powered shopping apps and online stores are easy to use)
PEUAI_2 (When AI provides alternatives, shopping doesn’t require significant mental effort)
PEUAI_3 (AI simplifies shopping by suggesting products to me)
PEUAI_4 (I find it simple to understand how to use AI-optimized shopping apps and online stores)
PEUAI_5 (Developing skills in using AI-powered shopping apps and online stores is simple)
[43,60,61]
Behavioral intention of use of AI in sales and marketing (PI)PI_1 (I am willing to buy products or services that use AI in sales in the near future)
PI_2 (I consider recommending other people to buy products or services that use AI in sales)
PI_3 (I would consider buying a product or service that benefits from AI technologies in the sales process)
PI_4 (I tend to visit online shopping sites that use AI in sales)
PI_5 (Mostly, I end up buying products from online stores that have AI-based technology)
PI_6 (I am willing to spend more on purchases through online stores that are powered by AI technology)
PI_7 (I plan to visit online stores and use shopping apps that are powered by AI more often)
[19,42,44,47,50,58,63]
Table 3. Sample structure.
EducationAge (Average)GenderLocation
Bachelor’s Degree (55.1%)21.85 yearsMale (34.8%)Urban (70.4%)
High School Diploma (41.0%)Female (63.3%)Rural (29.6%)
Master’s Degree (3.5%)Non-binary (0.8%)
Doctorate (0.4%)Rather not say (1.1%)
Table 4. Indicators and construct reliability.
IndicatorsConstructLoadingsVIF
EAI_1Level of exposure to AI (Artificial Intelligence) (EAI) (α = 0.726; rho_a = 0.734; rho_c = 0.829; AVE = 0.549)0.9211.368
EAI_21.0871.627
EAI_30.9671.419
EAI_41.0031.285
KAAI_2Level of knowledge about AI (Artificial Intelligence) (KAAI) (α = 0.740; rho_a = 0.771; rho_c = 0.723; AVE = 0.503)0.8301.036
KAAI_31.3241.305
KAAI_40.9622.210
KAAI_50.7271.927
PEUAI_1Perception of ease-of-use of AI in online shopping (PEUAI) (α = 0.868; rho_a = 0.868; rho_c = 0.904; AVE = 0.654)0.9961.936
PEUAI_20.9921.966
PEUAI_31.0321.997
PEUAI_41.0392.333
PEUAI_50.9421.884
PI_1Intention to purchase products/services that use AI in online shopping (PI) (α = 0.908; rho_a = 0.912; rho_c = 0.927; AVE = 0.644)0.9732.475
PI_21.0712.934
PI_30.9852.507
PI_41.0202.316
PI_50.9922.497
PI_60.9372.163
PI_71.0072.469
PUAI_1Perception of the usefulness of AI in online shopping (PUAI) (α = 0.923; rho_a = 0.925; rho_c = 0.942; AVE = 0.764)0.9822.197
PUAI_21.0183.260
PUAI_30.9943.116
PUAI_40.9843.468
PUAI_51.0192.692
UOAI_2The level of use of AI (Artificial Intelligence) (UOAI) (α = 0.721; rho_a = 0.723; rho_c = 0.831; AVE = 0.557)0.7731.084
UOAI_31.0911.501
UOAI_41.0972.194
UOAI_51.0232.103
Note: α = Cronbach’s alpha; AVE = average variance extracted; VIF = variance inflation factor.
Table 5. Discriminant validity assessment.
ConstructsHTMT Ratio
EAIKAAIPEUAIPIPUAIUOAI
EAI
KAAI0.521
PEUAI0.3960.264
PI0.5350.3480.724
PUAI0.4140.2770.7080.653
UOAI0.7990.6440.4620.5870.461
ConstructsFornell–Larcker Criterion
EAIKAAIPEUAIPIPUAIUOAI
EAI0.741
KAAI0.3520.634
PEUAI0.3180.2520.809
PI0.4350.2890.6480.802
PUAI0.3470.2670.6340.6070.874
UOAI0.5760.4150.3650.4720.3760.747
Table 6. The predictive power of the model.
ConstructR-Squarep-ValueQ-SquareUnexplained Variance
PEUAI0.1590.0000.9550.841
PI0.5380.0000.9410.462
PUAI0.1770.0000.9500.823
Note: R-square—coefficient of determination; p-value—statistical significance; Q—SquareBlindfolding-based cross-validated redundancy measure. Unexplained variances indicate potential influences of other variables not included in this model.
Table 7. Direct effects.
HypothesesRelationshipsBeta Coef.SDEffect SizeDecision
H1EAI -> PUAI0.174 ***0.0320.025Supported
H2EAI -> PEUAI0.131 ***0.0330.010Supported
H3EAI -> PI0.217 ***0.0320.023Supported
H4UOAI -> PI0.323 ***0.0350.031Supported
H5UOAI -> PUAI0.252 ***0.0390.039Supported
H6UOAI -> PEUAI0.242 ***0.0360.042Supported
H7PUAI -> PI0.246 ***0.0290.081Supported
H8PEUAI -> PI0.399 ***0.0320.182Supported
H9KAAI -> PI0.105 **0.0400.002Supported
H10KAAI -> PUAI0.150 **0.0480.012Supported
H11KAAI -> PEUAI0.127 **0.0490.010Supported
Note: *** p < 0.001; ** p < 0.01. SD—standard deviation.
Table 8. Indirect effects.
HypothesesRelationshipsBeta Coef.SDBCCIDecisionType of Mediation
LowerUpper
H12aUOAI -> PI (de)0.323 ***0.035 Complementary (Partial mediation)
UOAI -> PUAI -> PI (ie)0.043 ***0.0100.0410.088Supported
H12bKAAI -> PI (de)0.105 **0.040 Complementary (Partial mediation)
KAAI -> PUAI -> PI (ie)0.037 **0.0130.0130.064Supported
H12cEAI -> PI (de)0.217 ***0.032 Complementary (Partial mediation)
EAI -> PUAI -> PI (ie)0.043 ***0.0100.0260.065Supported
H13aUOAI -> PI (de)0.323 ***0.035 Complementary (Partial mediation)
UOAI -> PEUAI -> PI (ie)0.097 ***0.0160.0660.131Supported
H13bKAAI -> PI (de)0.105 **0.040 Complementary (Partial mediation)
KAAI -> PEUAI -> PI (ie)0.051 *0.0200.0110.090Supported
H13cEAI -> PI (de)0.217 ***0.032 Complementary (Partial mediation)
EAI -> PEUAI -> PI (ie)0.043 ***0.0100.0260.080Supported
Note: *** p < 0.001; ** p < 0.01; * p < 0.05. Abbreviations: de—direct effect; ie—indirect effect; SD—standard deviation; BCCI—bias-corrected confidence interval.
Table 9. IPA for the PI target construct (indicator level).
IndicatorImportancePerformanceIPA Quadrant
EAI_10.04443.506Q3
EAI_20.06038.121Q2
EAI_30.05849.446Q1
EAI_40.05645.412Q3
KAAI_20.03265.204Q4
KAAI_30.03542.598Q3
KAAI_40.02024.246Q3
KAAI_50.01913.985Q3
PEUAI_10.07868.174Q1
PEUAI_20.07961.348Q1
PEUAI_30.07763.076Q1
PEUAI_40.08267.531Q1
PEUAI_50.08362.411Q1
PUAI_10.04462.035Q4
PUAI_20.04768.351Q4
PUAI_30.05067.043Q4
PUAI_40.05169.504Q4
PUAI_50.05465.847Q4
UOAI_20.07551.263Q1
UOAI_30.07839.162Q2
UOAI_40.08327.704Q2
UOAI_50.08723.293Q2
Note: The quadrants are delimited using the mean of performance (49.355) and mean of importance (0.055304) reported in the IPMA results table at the indicator level. Q1 and Q2 cells were colored in green and orange to emphasize the most important indicators.
Disclaimer/Publisher’s Note: The statements, opinions and data contained in all publications are solely those of the individual author(s) and contributor(s) and not of MDPI and/or the editor(s). MDPI and/or the editor(s) disclaim responsibility for any injury to people or property resulting from any ideas, methods, instructions or products referred to in the content.

