

Measuring Customer Experience in AI Contexts: A Scale Development


Abstract
:1. Introduction
2. Literature Review and Theoretical Background
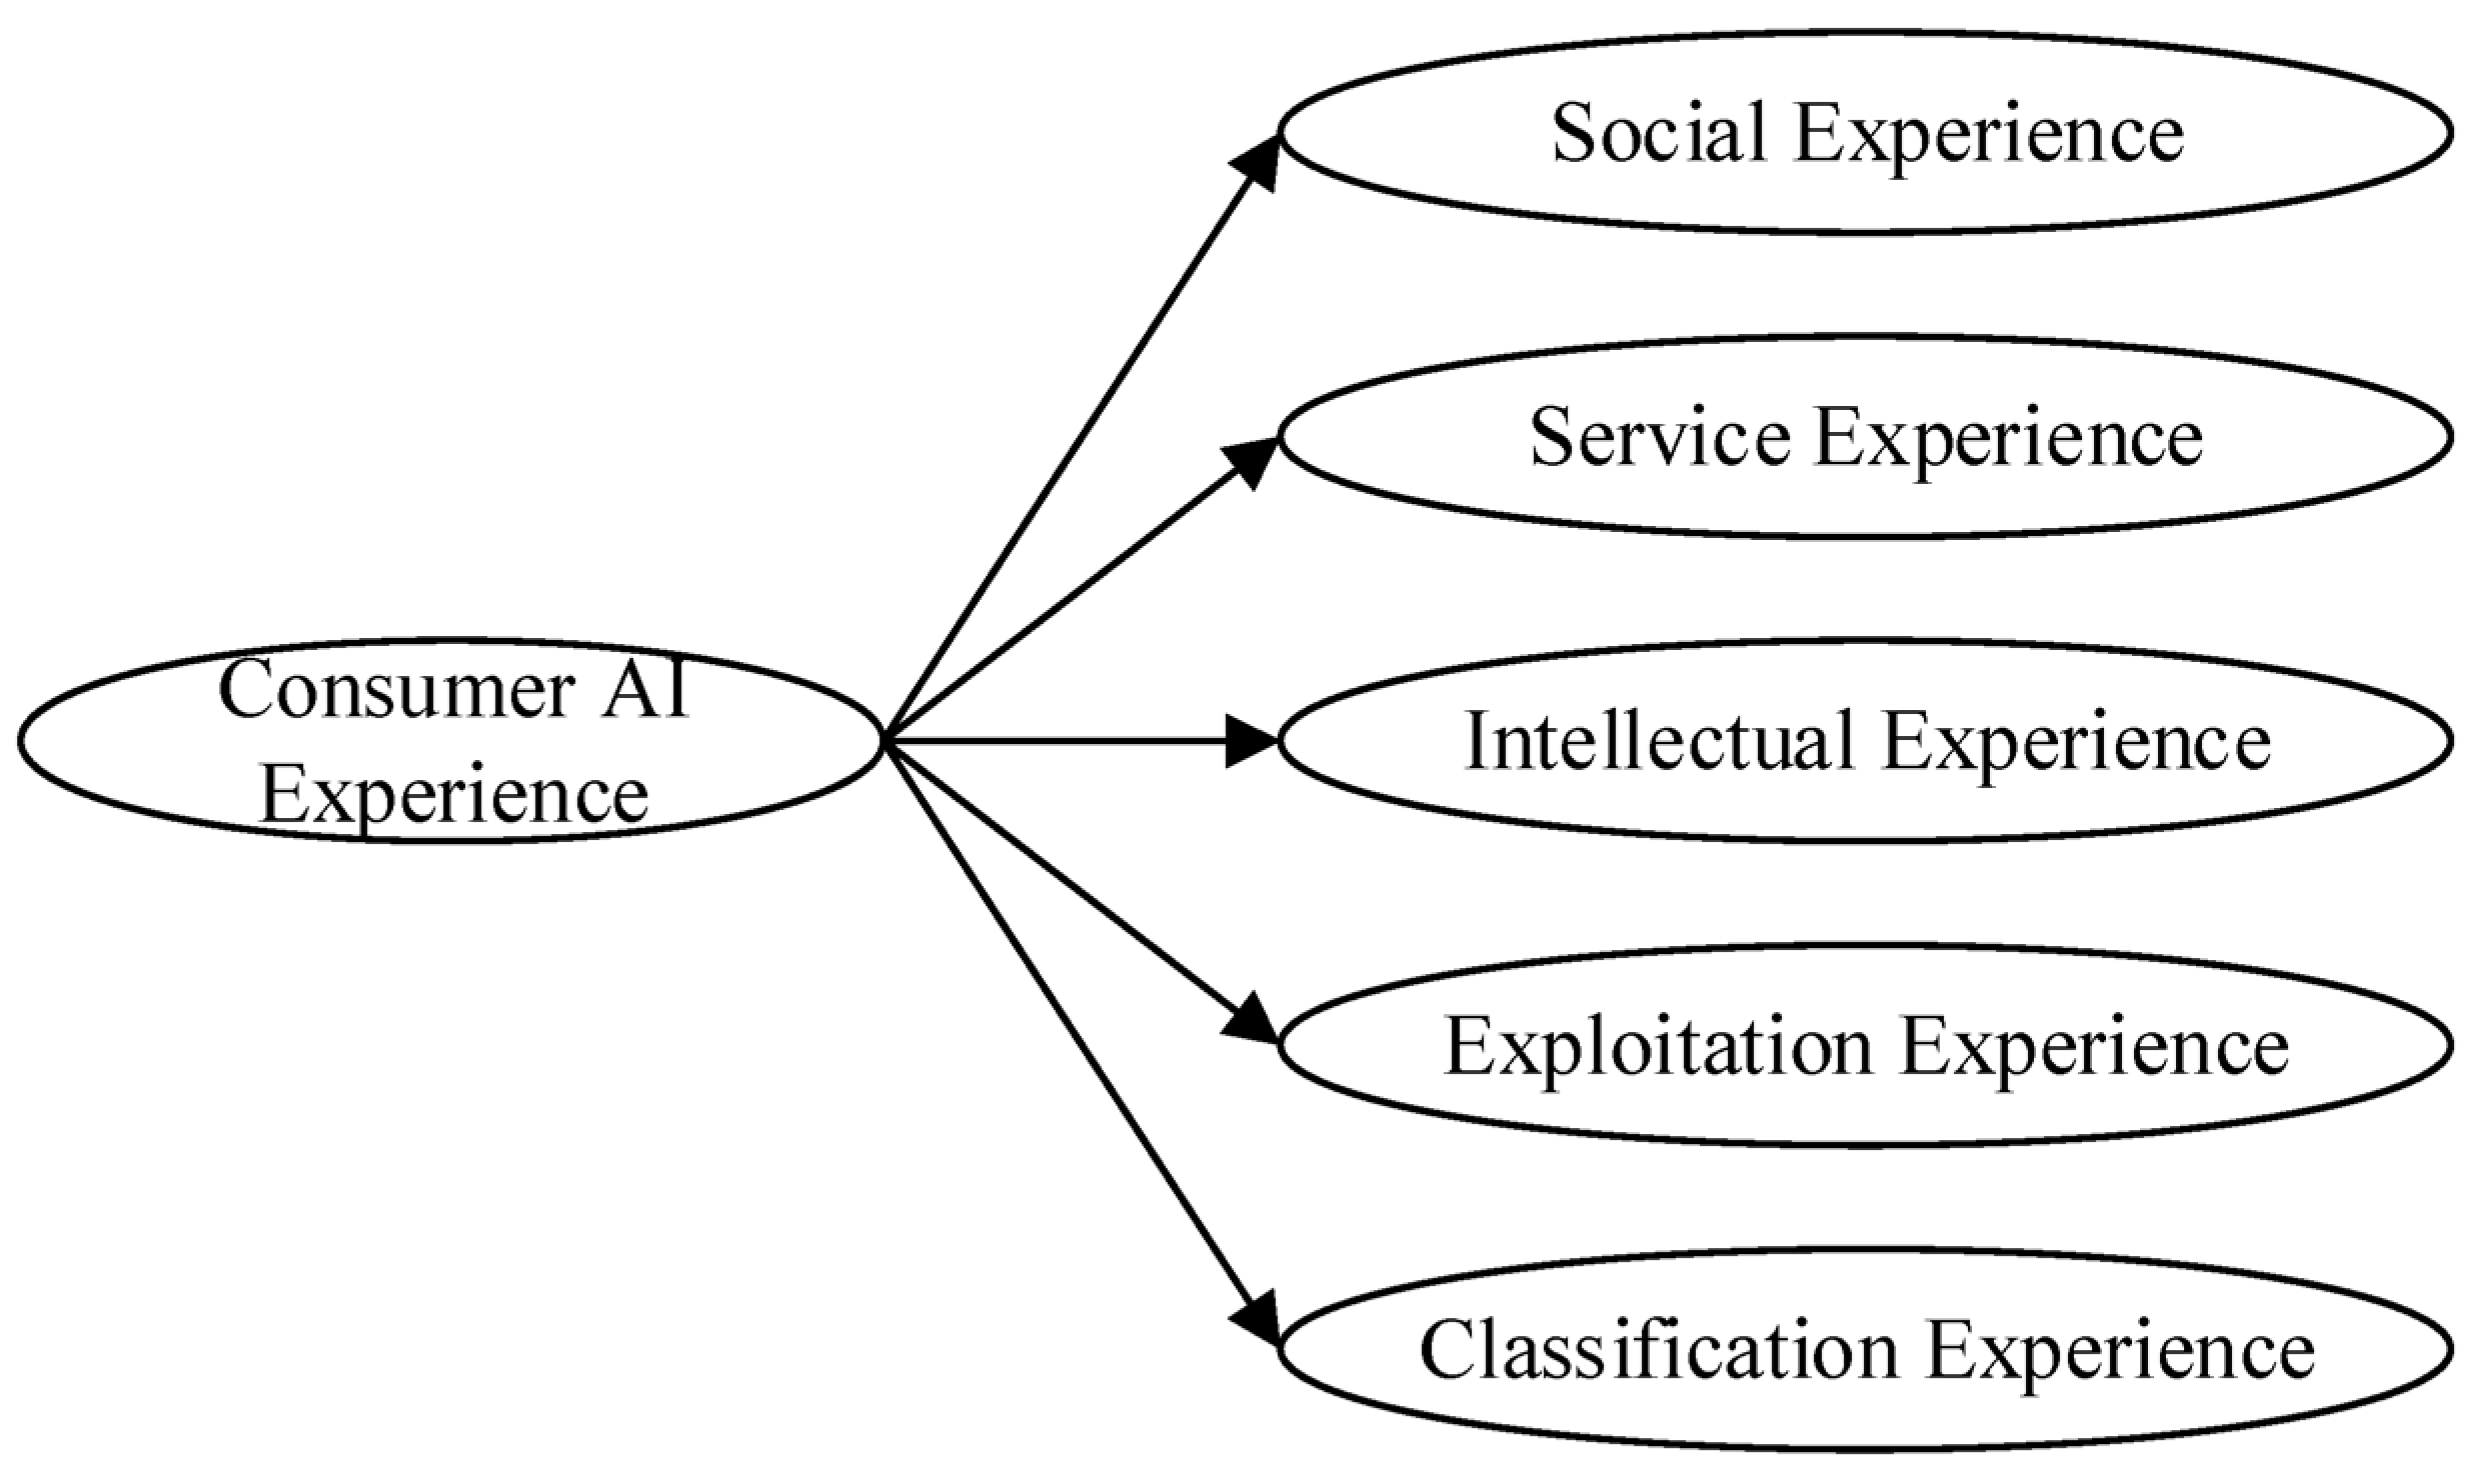
2.1. Customer AI Experience
2.1.1. The Connotation and Measurement of the Customer AI Experience
2.1.2. Formation Mechanism of Customer AI Experience
2.2. Technology Acceptance Model and Innovation Diffusion Theory
2.2.1. Technology Acceptance Model
2.2.2. Innovation Diffusion Theory
2.3. Customer Engagement
3. Study 1: Development and Validation of Customer AI Experience Scale
3.1. Initial Construction of Customer AI Experience Scale
3.1.1. Interview Study
3.1.2. Coding Process
- (1)
- Open Coding
- (2)
- Selective Coding
3.1.3. Item Generation
3.2. Data Analysis
3.2.1. Data Collection
3.2.2. Exploratory Factor Analysis
3.2.3. Confirmatory Factor Analysis
3.3. Prediction Testing of Customer AI Experience Structure
4. Study 2: Mechanisms of Customer AI Experience Formation Based on Digital Interaction Platforms
4.1. Research Design and Data Collection
4.1.1. Research Design
4.1.2. Research Methodology
4.2. Data Coding and Analysis
4.2.1. Open Coding
4.2.2. Axial Coding
4.2.3. Selective Coding
4.3. Circular Model Construction
5. Study 3: Mechanisms of Customer AI Experience on Customer Engagement Behavior in Digital Interaction Platforms
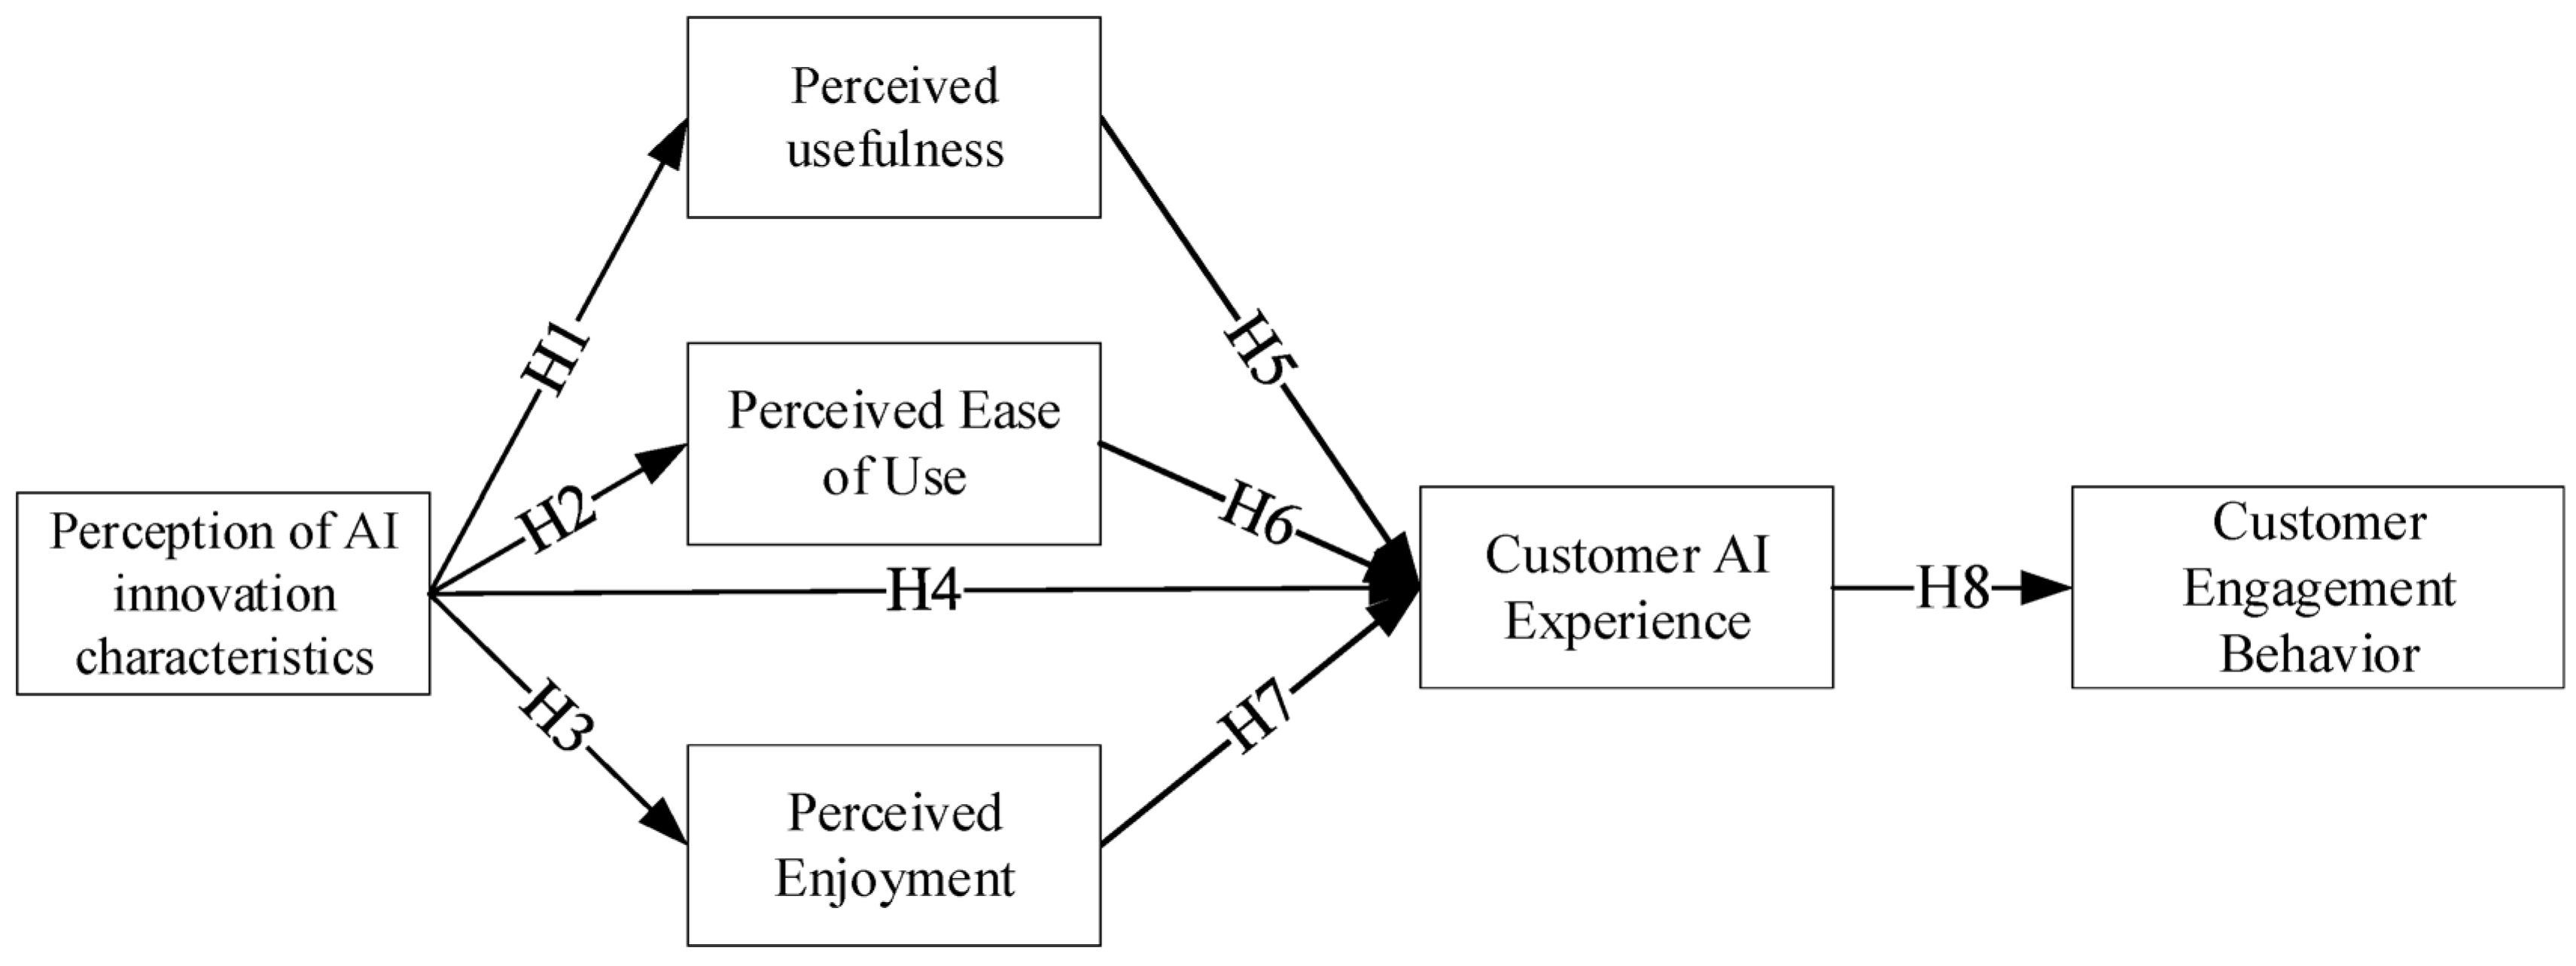
5.1. Theoretical Model and Research Hypotheses
5.2. Data Analysis and Hypothesis Testing
5.2.1. Source of Scale Items
5.2.2. Data Collection and Descriptive Statistics
5.2.3. Test of Common Method Bias
5.2.4. Reliability and Validity Testing
5.3. Data Processing
5.3.1. Descriptive Statistics and Correlation Analysis Between Variables
5.3.2. Mediation Analysis
6. Discussion
6.1. Theoretical Contributions
6.2. Managerial Insights
6.3. Research Limitations and Future Prospects
Author Contributions
Funding
Institutional Review Board Statement
Informed Consent Statement
Data Availability Statement
Conflicts of Interest
Appendix A. Interview Outline for Study 2

| Questions | Content |
|---|---|
| Basic Q | Gender, age, marital status, education level, occupation. |
| Introduction Q |
|
| |
| |
| Core Q | Instruction: The following questions will focus on your experience with these two services. Please answer based on your experiences with each service separately. |
| |
| |
| |
| |
| |
| |
|
References
- Lim, W.M.; Kumar, S.; Pandey, N.; Rasul, T.; Gaur, V. From direct marketing to interactive marketing: A retrospective review of the Journal of Research in Interactive Marketing. J. Res. Interact. Mark. 2022, 17, 232–256. [Google Scholar] [CrossRef]
- Wang, C.L. Editorial–What is an interactive marketing perspective and what are emerging research areas? J. Res. Interact. Mark. 2024, 18, 161–165. [Google Scholar] [CrossRef]
- Nangpiire, C.; Silva, J.; Alves, H. Customer engagement and value co-creation/destruction: The internal fostering and hindering factors and actors in the tourist/hotel experience. J. Res. Interact. Mark. 2022, 16, 173–188. [Google Scholar] [CrossRef]
- Sheth, J.N. Post-pandemic marketing: When the peripheral becomes the core. J. Res. Interact. Mark. 2022, 16, 37–44. [Google Scholar] [CrossRef]
- Zimmermann, R.; Mora, D.; Cirqueira, D.; Helfert, M.; Bezbradica, M.; Werth, D.; Weitzl, W.J.; Riedl, R.; Auinger, A. Enhancing brick-and-mortar store shopping experience with an augmented reality shopping assistant application using personalized recommendations and explainable artificial intelligence. J. Res. Interact. Mark. 2023, 17, 273–298. [Google Scholar] [CrossRef]
- Gao, L.; Li, G.; Tsai, F.; Gao, C.; Zhu, M.; Qu, X. The impact of artificial intelligence stimuli on customer engagement and value co-creation: The moderating role of customer ability readiness. J. Res. Interact. Mark. 2023, 17, 317–333. [Google Scholar] [CrossRef]
- Peltier, J.W.; Dahl, A.J.; Schibrowsky, J.A. Artificial intelligence in interactive marketing: A conceptual framework and research agenda. J. Res. Interact. Mark. 2024, 18, 54–90. [Google Scholar] [CrossRef]
- Yim, A.; Cui, A.P.; Walsh, M. The role of cuteness on consumer attachment to artificial intelligence agents. J. Res. Interact. Mark. 2024, 18, 127–141. [Google Scholar] [CrossRef]
- Gao, Y.; Liu, H. Artificial intelligence-enabled personalization in interactive marketing: A customer journey perspective. J. Res. Interact. Mark. 2023, 17, 663–680. [Google Scholar] [CrossRef]
- Hoyer, W.D.; Kroschke, M.; Schmitt, B.; Kraume, K.; Shankar, V. Transforming the Customer Experience Through New Technologies. J. Interact. Mark. 2020, 51, 57–71. [Google Scholar] [CrossRef]
- Verhoef, P.C.; Lemon, K.N.; Parasuraman, A.; Roggeveen, A.; Tsiros, M.; Schlesinger, L.A. Customer experience creation: Determinants, dynamics and management strategies. J. Retail. 2009, 85, 31–41. [Google Scholar] [CrossRef]
- Puntoni, S.; Reczek, R.W.; Giesler, M.; Botti, S. Consumers and Artificial Intelligence: An Experiential Perspective. J. Mark. 2021, 85, 131–151. [Google Scholar] [CrossRef]
- Schmitt, B.H. Experiential Marketing. J. Mark. Manag. 1999, 15, 53–67. [Google Scholar] [CrossRef]
- Becker, L.C.; Jaakkola, E. Customer Experience: Fundamental Premises and Implications for Research. J. Acad. Mark. Sci. 2020, 48, 630–648. [Google Scholar] [CrossRef]
- Agrawal, A.; Joshua, S.; Avi, G. Prediction Machines: The Simple Economics of Artificial Intelligence; Harvard Business Review Press: Boston, MA, USA, 2018. [Google Scholar]
- Ameen, N.; Tarhini, A.; Reppel, A.; Anand, A. Customer experiences in the age of artificial intelligence. Comput. Hum. Behav. 2020, 114, 106548. [Google Scholar] [CrossRef]
- Roy, S.K.; Singh, G.; Hope, M.; Nguyen, B.; Harrigan, P. The Rise of Smart Consumers: Role of Smart Servicescape and Smart Consumer Experience Co-creation. J. Mark. Manag. 2019, 35, 1–34. [Google Scholar] [CrossRef]
- Jin, E.; Eastin, M.S. Birds of a feather flock together: Matched personality effects of product recommendation chatbots and users. J. Res. Interact. Mark. 2023, 17, 416–433. [Google Scholar] [CrossRef]
- Zhao, F.; Wu, Z. Research on the Formation Process of User Experience on E-commerce Shopping Websites. Sci. Technol. Innov. Her. 2017, 14, 98–102. [Google Scholar]
- De Keyser, A.; Lemon, K.N.; Klaus, P.; Keiningham, T.L.A. Framework for Understanding and Managing the Customer Experience. Mark. Sci. Inst. Work. Pap. Ser. 2015, 85, 15–121. [Google Scholar]
- Schallehn, H.; Seuring, S.; Strähle, J.; Freise, M. Defining the antecedents of experience co-creation as applied to alternative consumption models. J. Serv. Manag. 2019, 30, 209–251. [Google Scholar] [CrossRef]
- Liu, J.; Sun, X. What Determines Users’ Complete Experience of a Product? Adv. Psychol. Sci. 2011, 19, 94–106. [Google Scholar]
- Wang, S. Research on the Formation Mechanism of Consumer Experience with Artificial Intelligence Products; Jiangxi University of Finance and Economics: Nanchang, China, 2021. [Google Scholar]
- Davis, F.D. Perceived usefulness perceived ease of use, and acceptance of information technology. MIS Q. 1989, 13, 319–340. [Google Scholar] [CrossRef]
- Venkatesh, V.; Morris, M.G.; Davis, G.B.; Davis, F.D. User acceptance of information technology: Toward a unified view. Mis Q. 2003, 27, 425–478. [Google Scholar] [CrossRef]
- Yousafzai, S.Y.; Foxall, G.R.; Pallister, J.D. Technology acceptance: A meta-analysis of the TAM. J. Model. Manag. 2007, 2, 251–280. [Google Scholar] [CrossRef]
- Childers, T.L.; Carr, C.L.; Peck, J.; Carson, S. Hedonic and Utilitarian Motivations for Online Retail Shopping Behavior. J. Retail. 2001, 77, 511–535. [Google Scholar] [CrossRef]
- Liu, Y.; Liu, Y. The Impact of Consumer Innovativeness on Mobile Shopping Intentions: Based on the Perspective of the Extended Technology Acceptance Model. China Bus. Mark. 2015, 29, 102–108. [Google Scholar]
- Rogers, E.M.; Shoemarker, F.F. Communication of Innovations: A Cross-Cultural Approach, 2nd ed.; The Free Press: New York, NY, USA, 1971. [Google Scholar]
- Moore, G.C.; Benbasat, I. Development of an Instrument to Measure the Perceptions of Adopting an Information Technology Innovation. Informs 1991, 2, 192–222. [Google Scholar] [CrossRef]
- Chen, Y.H.; Keng, C.J.; Chen, Y.L. How interaction experience enhances customer engagement in smart speaker devices? The moderation of gendered voice and product smartness. J. Res. Interact. Mark. 2022, 16, 403–419. [Google Scholar] [CrossRef]
- Fathy, D.; Elsharnouby, M.H.; AbouAish, E. Fans behave as buyers? Assimilate fan-based and team-based drivers of fan engagement. J. Res. Interact. Mark. 2022, 16, 329–345. [Google Scholar] [CrossRef]
- Ji, C.; Mieiro, S.; Huang, G. How social media advertising features influence consumption and sharing intentions: The mediation of customer engagement. J. Res. Interact. Mark. 2022, 16, 137–153. [Google Scholar] [CrossRef]
- Samarah, T.; Bayram, P.; Aljuhmani, H.Y.; Elrehail, H. The role of brand interactivity and involvement in driving social media consumer brand engagement and brand loyalty: The mediating effect of brand trust. J. Res. Interact. Mark. 2022, 16, 648–664. [Google Scholar] [CrossRef]
- Sussman, K.L.; Bright, L.F.; Wilcox, G.B. Digital consumer engagement: Examining the impact of native advertising exposure in a social network. J. Res. Interact. Mark. 2023, 17, 544–561. [Google Scholar] [CrossRef]
- Tong, S.C.; Chan FF, Y. Strategies to drive interactivity and digital engagement: A practitioners’ perspective. J. Res. Interact. Mark. 2023, 17, 901–920. [Google Scholar] [CrossRef]
- Carù, A.; Cova, B. Revisiting consumption experience: A more humble but complete view of the concept. Mark. Theory 2003, 267–286. [Google Scholar] [CrossRef]
- Pansari, A.; Kumar, V. Customer engagement: The construct, antecedents, and consequences. J. Acad. Mark. Sci. 2017, 45, 1–18. [Google Scholar] [CrossRef]
- Kumar, V.; Aksoy, L.; Donkers, B.; Venkatesan, R.; Wiesel, T.; Tillmanns, S. Undervalued or overvalued customers: Capturing total customer engagement value. J. Serv. Res. 2010, 13, 297–310. [Google Scholar] [CrossRef]
- Brakus, J.J.; Schmitt, B.H.; Zarantonello, L. Brand Experience: What Is It? How Is It Measured? Does It Affect Loyalty? J. Mark. 2009, 73, 52–68. [Google Scholar] [CrossRef]
- Zhang, Z.; Bian, Y. Brand Experience: Concept, Dimensions, and Scale Construction. Stat. Decis. 2011, 10, 177–179. [Google Scholar]
- Shan, J.; Cui, C. A Study on the Inverted U-Shaped Relationship Between Online Accessibility of Luxury Goods and Purchase Intention. Nankai Bus. Rev. 2020, 23, 51–63. [Google Scholar]
- Homburg, C.; Wieseke, J.; Bornemann, T. Implementing the Marketing Concept at the Employee–Customer Interface: The Role of Customer Need Knowledge. J. Mark. 2009, 73, 64–81. [Google Scholar]
- Ruvio, A.; Bagozzi, R.P.; Hult, G.T.M.; Spreng, R. Consumer Arrogance and Word-of-Mouth. J. Acad. Mark. Sci. 2020, 48, 1116–1137. [Google Scholar] [CrossRef]
- Botti, S.; Iyengar, S.S. The Dark Side of Choice: When Choice Impairs Social Welfare. J. Public Policy Mark. 2006, 25, 24–38. [Google Scholar] [CrossRef]
- Summers, C.A.; Smith, R.W.; Reczek, R.W. An Audience of One: Behaviorally Targeted Ads as Implied Social Labels. J. Consum. Res. 2016, 43, 156–178. [Google Scholar] [CrossRef]
- Reed, I.; Americus, M.R.; Forehand Stefano, P.; Luk, W. Identity-Based Consumer Behavior. Int. J. Res. Mark. 2012, 29, 310–321. [Google Scholar] [CrossRef]
- Cacioppo, J.T.; Richard, E.P. The Need for Cognition. J. Personal. Soc. Psychol. 1982, 42, 116–131. [Google Scholar] [CrossRef]
- Chandler, J.; Lusch, R. Service Systems: A Broadened Framework and Research Agenda on Value Propositions, Engagement, and Service Experience. J. Serv. Res. 2015, 18, 6–22. [Google Scholar] [CrossRef]
- Derrick, W.; Justin, K.; Christie, N.; Ed, D. What to Do on Spring Break? The Role of Predicted, On-Line, and Remembered Experience in Future Choice. Psychol. Sci. 2003, 14, 520–524. [Google Scholar]
- Zhang, N.; Guo, X.; Chen, G. IDT-TAM integrated model for IT adoption. Tsinghua Sci. Technol. 2008, 13, 306–311. [Google Scholar] [CrossRef]
- Mclean, G.; Al-Nabhani, K.; Wilson, A. Developing a Mobile Applications Customer Experience Model (MACE)- Implications for Retailers. J. Bus. Res. 2018, 85, 325–336. [Google Scholar] [CrossRef]
- Yang, Y. Research on the Impact Path of User Satisfaction with Intelligent Customer Service Based on the TAM Model; Hangzhou Normal University: Hangzhou, China, 2020. [Google Scholar]
- Kim, E.; Drumwright, M. Engaging consumers and building relationships in social media: How social relatedness influences intrinsic vs. extrinsic consumer motivation. Comput. Hum. Behav. 2016, 63, 970–979. [Google Scholar] [CrossRef]
- Faiola, A.; Newlon, C.; Pfaff, M.; Smyslova, O. Correlating the effects of flow and telepresence in virtual worlds: Enhancing our understanding of user behaviour in game-based learning. Comput. Hum. Behav. 2013, 29, 1113–1121. [Google Scholar] [CrossRef]
- Hoffman, D.L.; Novak, T.P. Flow online: Lessons learned and future prospects. J. Interact. Mark. 2009, 23, 23–34. [Google Scholar] [CrossRef]
- Kumar, V.; Rajan, B.; Gupta, S.; Pozza, I.D. Customer engagement in service. J. Acad. Mark. Sci. 2019, 47, 138–160. [Google Scholar] [CrossRef]

| Core Concept | Specific Dimensions | Source |
|---|---|---|
| AI-supported customer experience | Hedonic experience (memorable, entertaining, thrilling, and comfort) and cognitive experience (respectable, popular, secure, and aesthetic) | Ameen et al. (2020) |
| Intelligent experience co-creation | Hedonic experience, cognitive experience, social and personal experience, and pragmatic economic experience | Roy et al. (2019) |
| Technology service experience | Reliability, assurance, empathy, and responsiveness | Prentice and Nguyen (2020) |
| Online customer experience | Informativeness (cognitive), entertainment (emotional), sociality, and sensory appeal | Bleier et al. (2019) |
| Customer AI experience | Data capture experience, classification experience, delegation experience, and social experience | Puntoni et al. (2021) |
| Data capture experience, classification experience, authorization experience, social experience, and anthropomorphic experience | Wang et al. (2024) | |
| Intelligent customer experience | Relative advantage and perceived interactivity | Ren Lina (2021) |
| Interview Topic | Questions | Purpose |
|---|---|---|
| Introduction via Shopping Apps |
| To inquire about the use of shopping apps by the interviewee |
| Customer AI Experience Dimension (Personalized Recommendations Context) |
| To understand the customer AI experience in the context of personalized recommendations: whether there is and what it entails |
| Customer AI Experience Dimension (Intelligent Customer Service Context) |
| To understand the customer AI experience in the context of intelligent customer service: whether it exists and what it involves |
| Basic Information |
| Gather basic demographic information about the interviewee |
| Main Categories | Subcategories | Examples of Corresponding Initial Open Coding Concepts |
|---|---|---|
| Social Experience | Problem Solving | 8-4 Able to quickly propose solutions to problems 14-6 Helps consumers quickly resolve issues |
| Communication | 1-9 Smart customer service is polite, patient, and effective in communication 11-11 Responses are timely | |
| Humanized Communication | 1-1 The experience with smart recommended products is user-friendly 11-6 Recommendations are really user-friendly | |
| Service Experience | Accurate Prediction of Preferences | 1-2 Products recommended after big data analysis match personal needs 11-2 Meets preferences and focus points |
| Convenience and Time-Saving | 1-3 It brings great convenience 1-4 Saves more time 10-2 Saves search time | |
| Provides Multiple Choices | 5-11 Recommendations are diverse 5-3 Allows comparison and more choices | |
| Intellectual Experience | Enhancing Consumer Capability | 2-6 Use personalized recommendation patterns to buy more cost-effective products 6-5 Commission smart customer service for product prediction |
| Triggering Exploration and Thinking | 2-7 Consciously stay on the recommendation page 4-4 Search for other items on a whim | |
| Exploitation Experience | Using Consumer Information | 3-8 Collect consumer data for recommendations 12-4 Collect personal information through purchase records |
| Intruding Consumer Privacy | 5-7 Exposing consumer privacy 12-3 Feeling life is being monitored 12-6 Feeling eavesdropped | |
| Classification Experience | Accurate Prediction of Consumption Ability | 10-7 Recommended products are similar to what I usually buy 11-5 Recommended products are reasonably priced |
| Recommended Products Align with Self-Identity | 1-6 The types of recommended products match my preferences 10-8 Recommended products match my style |
|
|
|
|
|
|
|
|
|
|
|
|
|
|
|
|
|
|
|
|
|
|
|
|
|
|
| Demographic Variable | Variable Value | Frequency | Percentage |
|---|---|---|---|
| Gender | Male | 107 | 46.5% |
| Female | 123 | 53.5% | |
| Age | 0~20 | 6 | 2.6% |
| 21~30 | 130 | 56.5% | |
| 31~40 | 89 | 38.7% | |
| 41~50 | 5 | 2.2% | |
| Occupation | Student | 40 | 17.4% |
| Ordinary employee | 112 | 48.7% | |
| Middle and senior management | 74 | 32.2% | |
| Other | 4 | 1.7% | |
| Education | Bachelor’s degree | 178 | 77.4% |
| Master’s degree | 29 | 12.6% | |
| Doctorate | 1 | 0.4% | |
| High school/Technical school and below | 3 | 1.3% | |
| Associate degree | 19 | 8.3% |
| Original Code | Item | Component | ||||
|---|---|---|---|---|---|---|
| 1 | 2 | 3 | 4 | 5 | ||
| CAE24 | I believe AI chatbots can handle complex problems | 0.729 | ||||
| CAE22 | I find communication with AI chatbots smooth | 0.719 | ||||
| CAE25 | I think AI chatbots are personable | 0.707 | ||||
| CAE26 | I feel confident in the effectiveness of AI chatbots | 0.668 | ||||
| CAE11 | AI recommendations accurately predict my consumption preferences | 0.654 | ||||
| CAE2 | AI recommendations have saved me time and effort | 0.635 | ||||
| CAE3 | AI recommendations have given me a variety of choices | 0.593 | ||||
| CAE17 | Using AI recommendations makes me want to explore further | 0.691 | ||||
| CAE16 | AI recommendations stimulate my curiosity and problem-solving abilities | 0.690 | ||||
| CAE18 | Through long-term use and reflection, I understand AI recommendation patterns and utilize them | 0.640 | ||||
| CAE21 | I delegate tasks to AI chatbots, which have some autonomy in decision-making (e.g., suggesting bundle options) | 0.639 | ||||
| CAE19 | I delegate tasks to AI chatbots that I could have done myself | 0.507 | ||||
| CAE7 | I feel that AI recommendations invade my privacy | 0.826 | ||||
| CAE6 | I perceive AI recommendations as exploiting my information | 0.789 | ||||
| CAE8 | AI recommendations listen to my conversations | 0.759 | ||||
| CAE12 | AI recommendations accurately predict my spending power | 0.760 | ||||
| CAE14 | I think AI recommendations of personalized products align well with my identity | 0.718 | ||||
| Explained Cumulative Variance (%): | 15.625 | 29.359 | 42.119 | 54.578 | 66.059 | |
| Demographic Variable | Variable Value | Frequency | Percentage (%) |
|---|---|---|---|
| Gender | Male | 95 | 35.2 |
| Female | 175 | 64.8 | |
| Age | 0~20 | 6 | 2.2 |
| 21~30 | 136 | 50.4 | |
| 31~40 | 113 | 41.9 | |
| 41~50 | 11 | 4 | |
| 51~60 | 4 | 1.5 | |
| Occupation | Student | 29 | 10.7 |
| Ordinary employee | 137 | 50.7 | |
| Middle and senior management | 95 | 35.2 | |
| Other | 9 | 3.4 | |
| Education | Bachelor’s degree | 188 | 69.6 |
| Master’s degree | 39 | 14.4 | |
| Doctorate | 3 | 1.1 | |
| High school/Technical school and below | 12 | 4.5 | |
| Associate degree | 28 | 10.4 |
| Fit Indices | X2/df | RMSEA | GFI | CFI | IFI | NFI | AGFI | PNFI | PGFI |
|---|---|---|---|---|---|---|---|---|---|
| 5 factors, 17 items | 2.783 | 0.081 | 0.877 | 0.903 | 0.904 | 0.858 | 0.827 | 0.688 | 0.625 |
| 5 factors, 14 items | 2.245 | 0.074 | 0.929 | 0.954 | 0.955 | 0.922 | 0.889 | 0.64 | 0.679 |
| Factor | Factor Naming | Items | Original IDs |
|---|---|---|---|
| F1 | Social Experience | I find it easy to communicate with AI chatbots | CAE22 |
| I believe AI chatbots can solve complex problems | CAE24 | ||
| I think AI chatbots are personable | CAE25 | ||
| I trust AI chatbots to handle tasks | CAE26 | ||
| F2 | Service Experience | AI personalized recommendations save me time and effort | CAE2 |
| AI personalized recommendations provide me with various choices | CAE3 | ||
| F3 | Intellectual Experience | AI recommendations spark my curiosity and improve problem-solving | CAE16 |
| Using AI recommendations makes me want to explore and study them | CAE17 | ||
| Through long-term use and reflection, I grasp AI recommendation patterns and utilize them | CAE18 | ||
| F4 | Exploitation Experience | I feel AI personalized recommendations are using my information | CAE6 |
| I believe AI personalized recommendations pry into my information | CAE7 | ||
| AI personalized recommendations listen in on my conversations | CAE8 | ||
| F5 | Classification Experience | I believe AI personalized recommendations can accurately predict my spending habits | CAE12 |
| I think AI recommends personalized products that fit my identity | CAE14 |
| Variable | Service Experience | Exploitation Experience | Classification Experience | Intellectual Experience | Social Experience |
|---|---|---|---|---|---|
| Service Experience | 0.695 | ||||
| Exploitation Experience | 0.465 *** | 0.857 | |||
| Classification Experience | 0.249 *** | 0.491 *** | 0.730 | ||
| Intellectual Experience | 0.464 *** | 0.658 *** | 0.395 *** | 0.756 | |
| Social Experience | 0.413 *** | 0.751 *** | 0.334 *** | 0.629 *** | 0.741 |
| Code | Gender | Age | Occupation | Education | User Age (Based on Preferred Platform) |
|---|---|---|---|---|---|
| 1201 | Male | 20 | Student | Bachelor’s | 2 years (Pinduoduo) |
| 2102 | Female | 27 | Kindergarten Teacher | Bachelor’s | 5–6 years (Taobao) |
| 2203 | Female | 16 | Student | High School | 3 years (Taobao) |
| 2204 | Female | 23 | Student | Master’s | 5–6 years (Taobao) |
| 2205 | Female | 26 | Student | Master’s | 7 years (Taobao) |
| 2306 | Female | 27 | Public Servant | Bachelor’s | 7 years (Taobao) |
| 1107 | Male | 25 | Internet Industry Professional | Bachelor’s | 3 years (Taobao) |
| 1108 | Male | 26 | Railway Worker | Associate Degree | Nearly 10 years (Taobao) |
| 2209 | Female | 25 | Student | Master’s | 7 years (Taobao) |
| 2310 | Female | 26 | Public Servant | Bachelor’s | 8 years (Taobao) |
| 2211 | Female | 29 | Student | Doctorate | Nearly 10 years (Taobao) |
| 2212 | Female | 22 | Student | Bachelor’s | 4 years (Taobao) |
| 2113 | Female | 25 | Foreign Trade Worker | Associate Degree | 5 years (Taobao) |
| 2114 | Female | 26 | Middle School Teacher | Bachelor’s | 9 years (Taobao) |
| 1115 | Male | 26 | High School Teacher | Bachelor’s | 7 years (JD.com) |
| 1116 | Male | 25 | E-commerce | Bachelor’s | 7 years (Taobao) |
| 1117 | Male | 27 | Sales | Bachelor’s | 6–7 years (Taobao) |
| 1118 | Male | 27 | Sales | Bachelor’s | 3 years (JD.com) |
| 1219 | Male | 25 | Student | Master’s | 6 years (JD.com) |
| 2120 | Female | 29 | State Grid | Master’s | 10 years (Taobao) |
| 2221 | Female | 32 | Student | Doctorate | 5 years (Pinduoduo) |
| 1222 | Male | 30 | Student | Master’s | 9 years (Taobao) |
| 1123 | Male | 35 | Administrative Assistant | Master’s | 9 years (Taobao) |
| 1124 | Male | 41 | Service Worker | High School | 9 years (Taobao) |
| Original Text Data and Corresponding Code | Initial Concept | Sub-Category |
|---|---|---|
| Based on my understanding of the technology used in this feature, I believe using it for recommendations and AI customer service should bring me convenience (1201). I also know it serves merely as an auxiliary means, and my expectations of it are not high. That’s my perspective (1107). | Knowledge of AI Technology (SK21) | Subjective Knowledge (SK2) |
| I think intelligent recommendation is essentially deduced from big data, based on my previous shopping and browsing records, to predict which products I might need, and then push them through the system (2209). | AI service knowledge (SK22) |
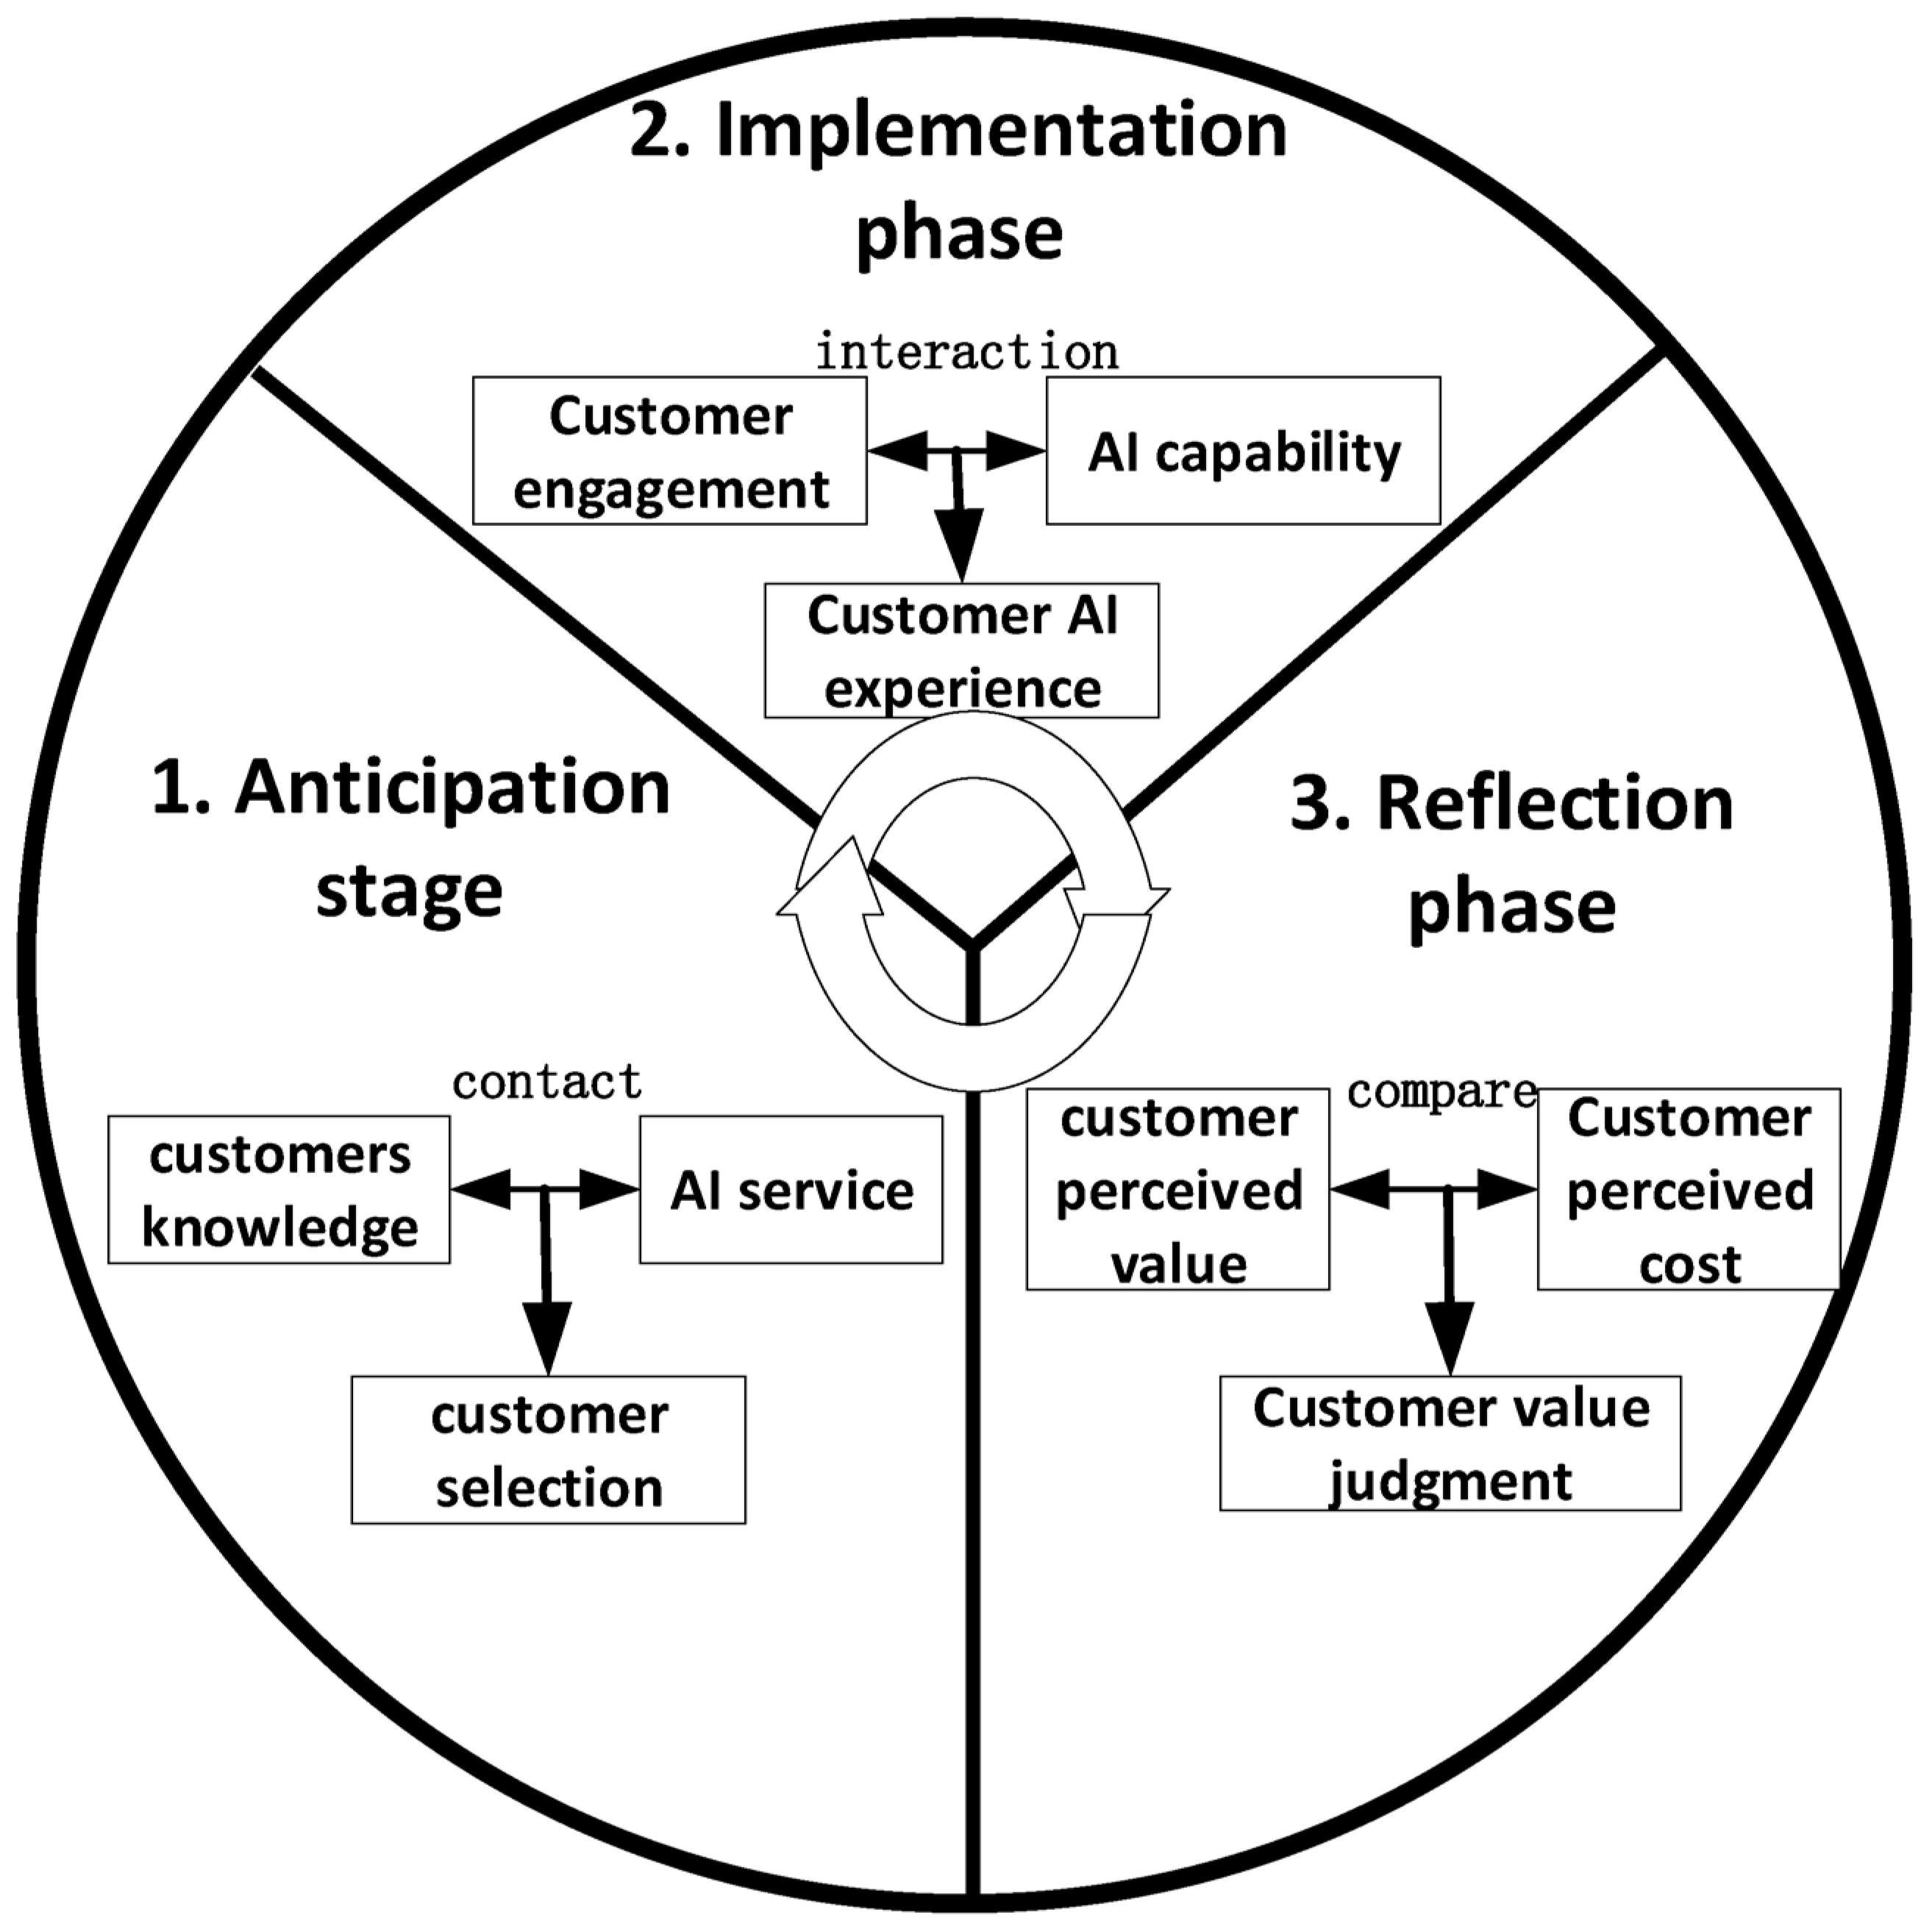
| Core Category | Sub-Category | Category Connotation | |
|---|---|---|---|
| Customer Knowledge (CK1) | Past Experience (PE1) | After the customer AI experience event ends, people store the acquired information in memory. | |
| Subjective Knowledge (SK2) | The sum of product category information and related skills stored in customer memory, reflecting the subjective perception of the level of understanding of the service itself. | ||
| Usage Contact (UC2) | Initial Contact (IC3) | Initial practical use of products or services by customers, including services supporting such usage. | |
| Long-term Contact (LC4) | Long-term practical use of products or services by customers, including services supporting such usage. | ||
| AI Services (AIS3) | Personalized Recommendations (PR5) | Based on customer-related information to extract preference characteristics, recommending products, services, or other information that customers might be interested in. | |
| Intelligent Customer Service (ICS6) | Non-human customer service systems developed and iterated based on AI technology, providing efficient problem-solving communication to customers. | ||
| Customer Choice (CC4) | Habitual Choice (HC7) | Psychological tendency to repeat past behaviors. | |
| Incidental Choice (AC8) | Psychological tendency to consciously attempt new behaviors. | ||
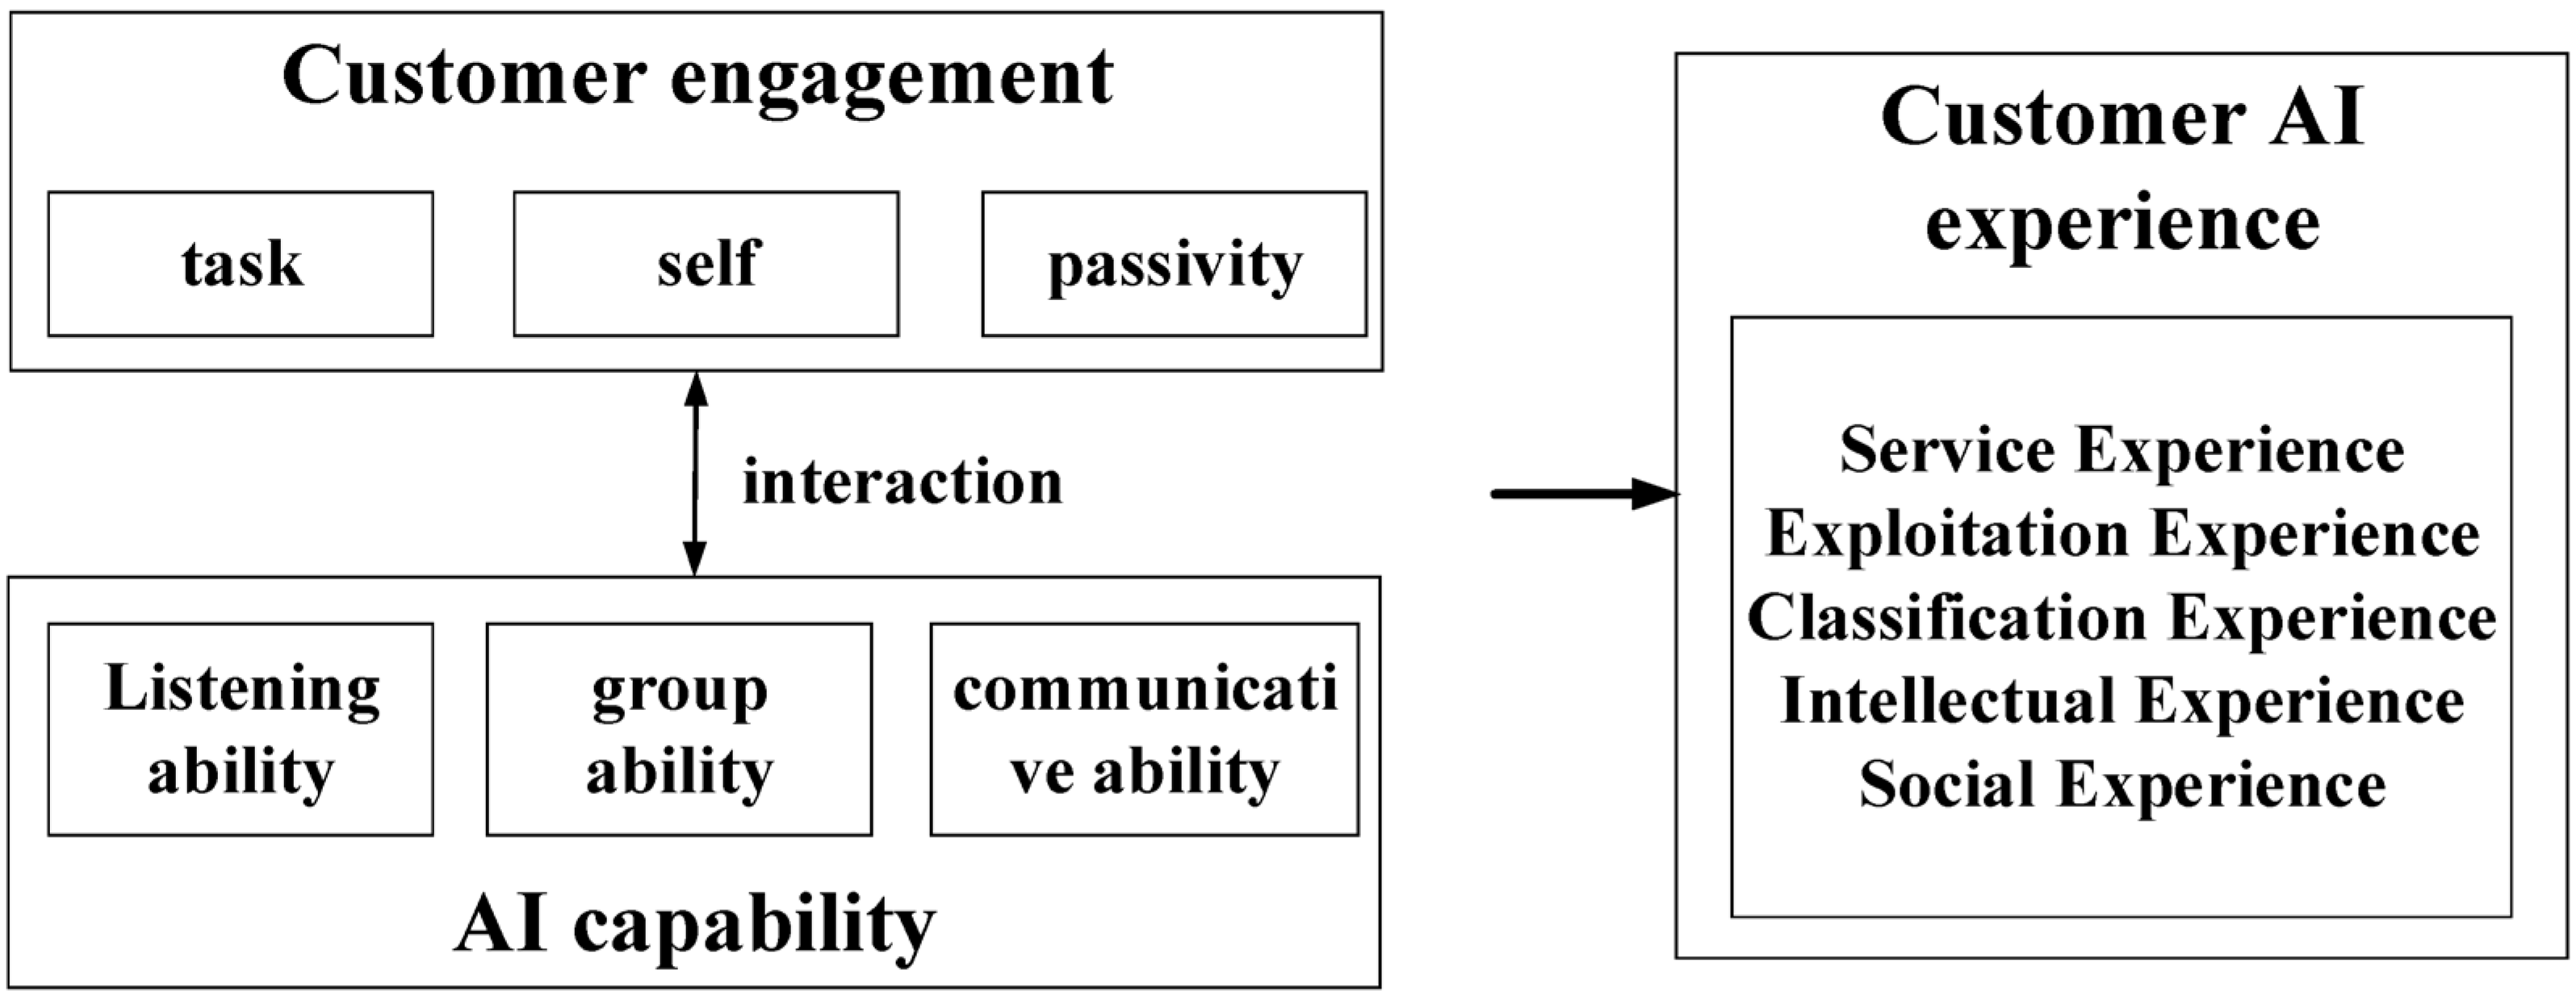
| Customer Engagement (CE5) | Self-Engagement (SE9) | Utilizing AI services to fulfill personal psychological needs. | |
| Task Engagement (TE10) | Utilizing AI services to achieve goals and solve problems. | ||
| Passive Engagement (PE11) | Customers cannot refuse or avoid AI services. | ||
| Interaction (IA6) | Short-term Interaction (SI12) | Real-time customer-AI interaction based on short-term/temporary behavioral data. | |
| Long-term Interaction (LI13) | Dynamic and coordinated customer-AI interaction based on long-term behavioral data. | ||
| AI Capabilities (AIC7) | Listening Capability (AC14) | AI gathers data about consumers and their living environments. | |
| Classification Capability (CP15) | AI analyzes and predicts customer needs and categorizes service pushes to customers. | ||
| Communication Capability (AP16) | AI’s ability to engage in interactive communication. | ||
| Customer AI Experience (CAIX8) | Service Experience (SX17) | Based on AI’s listening capability, customers perceive themselves as being served by AI. | |
| Exploitation Experience (UX18) | Based on AI’s listening capability, customers perceive themselves as being utilized by AI. | ||
| Classification Experience (CX19) | Customers receive AI’s personalized predictive experiences based on AI’s prediction capability. | ||
| Intellectual Experience (IX20) | Thinking experience generated by customer learning ability interacting with AI services. | ||
| Social Experience (CX21) | Experience of interaction and communication with AI partners based on AI’s communication capability. | ||
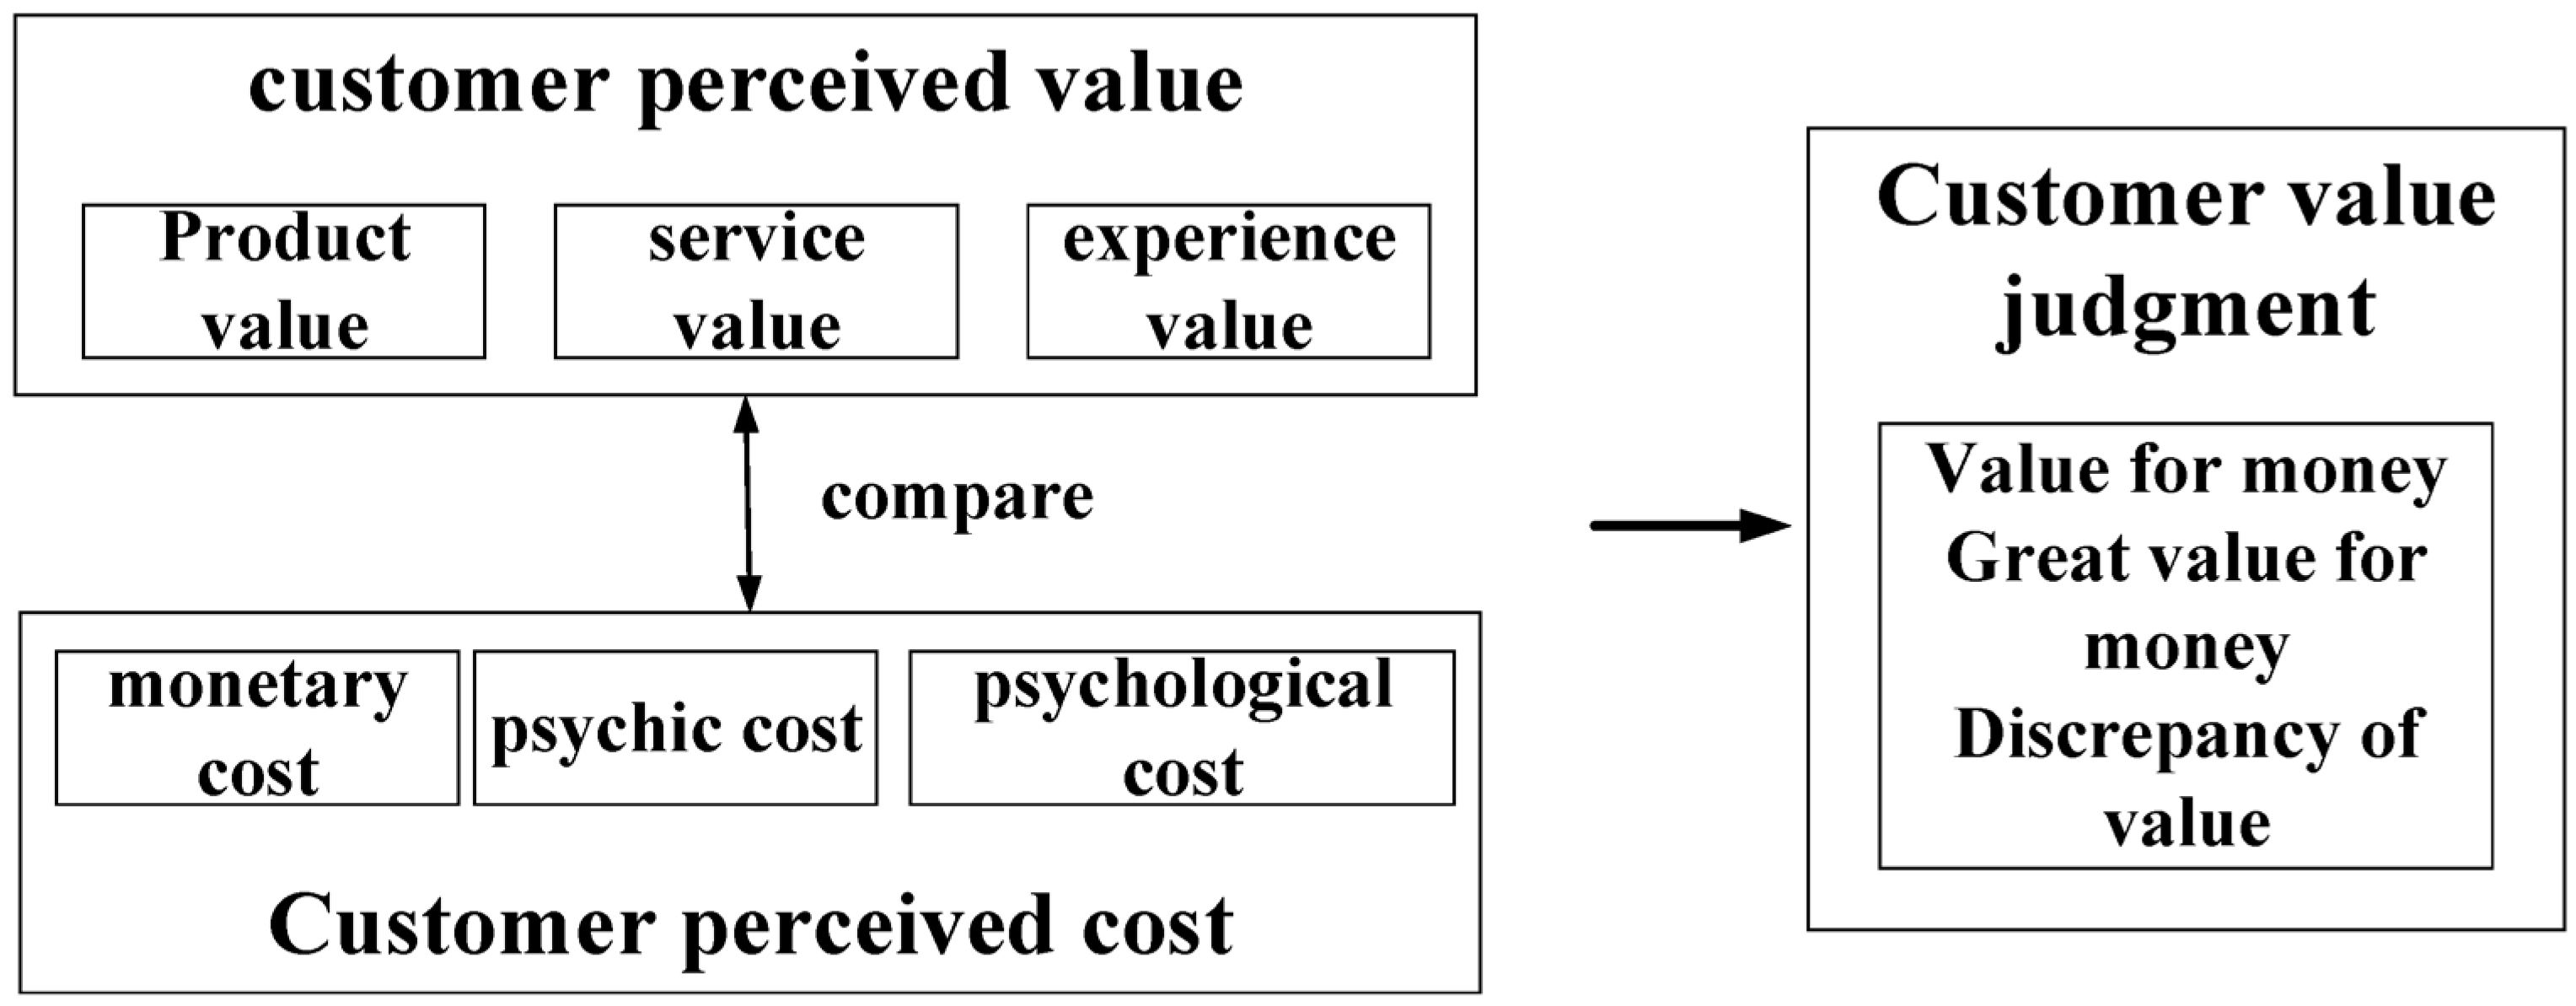
| Customer Perceived Value (CPV9) | Product Value (PV22) | Value perceived and obtained by customers from the product itself provided by AI services. | |
| Service Value (SV23) | Intangible value perceived and obtained by customers from enterprises throughout their interaction with AI services. | ||
| Experience Value (XV24) | Value perceived by customers from products or services provided by AI services derived from inner feelings. | ||
| Comparison (CP10) | Comparison (CP25) | Customers balance benefits and sacrifices related to AI experience. | |
| Customer Perceived Cost (CPC11) | Monetary Cost (MC26) | Cost incurred by customers for purchasing products recommended by AI services. | |
| Energy Cost (EC27) | Total time and mental cost incurred by customers during interaction with AI services. | ||
| Psychological Cost (PC28) | Psychological “unhappiness” felt by customers during interaction with AI services. | ||
| Customer Value Judgment (CVJ12) | Value for Money (VM29) | Customers consider the value provided by AI services equals the cost they incurred. | |
| Value Exceeding Money (CE30) | Customers consider the value provided by AI services exceeds the cost they incurred. | ||
| Value Not Meeting Money (NCE31) | Customers consider the value provided by AI services is less than the cost they incurred. | ||
| Variable | Measurement Items | Literature Source |
|---|---|---|
| Perceived AI Innovation Characteristics |
| (Moore and Benbasat, 1991; Venkatesh et al., 2003) |
| Perceived Usefulness |
| (Davis, 1989) |
| Perceived Ease of Use |
| |
| Perceived Enjoyment |
| (Liu and Liu, 2015) |
| Customer AI Experience |
| Developed in this study |
| Customer Engagement Behavior |
| (Kim and Drumwright M, 2016; Wu et al., 2019) |
| Demographic Variable | Variable Value | Frequency | Percentage% |
|---|---|---|---|
| Gender | Male | 118 | 39.3 |
| Female | 182 | 60.6 | |
| Age | 0~20 | 13 | 4.3 |
| 21~30 | 145 | 48.4 | |
| 31~40 | 102 | 43 | |
| 41~50 | 28 | 9.3 | |
| 51~60 | 12 | 4 | |
| Occupation | Student | 45 | 15 |
| Private enterprises | 131 | 43.7 | |
| State-owned enterprises | 74 | 24.7 | |
| Foreign-funded enterprises | 23 | 7.7 | |
| Government-affiliated agencies | 16 | 5.3 | |
| Civil servants | 11 | 3.6 | |
| Education | Bachelor’s degree | 222 | 74 |
| Master’s degree | 46 | 15.4 | |
| Doctorate | 4 | 1.3 | |
| High school/Technical school and below | 27 | 9 | |
| Junior high school | 1 | 0.3 |
| Scale | M | SD | 1 | 2 | 3 | 4 | 5 | 6 |
|---|---|---|---|---|---|---|---|---|
| Perceived AI Innovation Features | 5.8902 | 0.61309 | 1 | |||||
| Perceived Utility | 5.9802 | 0.81338 | 0.662 ** | 1 | ||||
| Perceived Usability | 5.8608 | 0.79716 | 0.756 ** | 0.741 ** | 1 | |||
| Perceived Enjoyment | 5.8832 | 0.81251 | 0.729 ** | 0.744 ** | 0.713 ** | 1 | ||
| Customer AI Experience | 5.391 | 0.80007 | 0.652 ** | 0.735 ** | 0.740 ** | 0.683 ** | 1 | |
| Customer Engagement Behavior | 5.6881 | 0.86262 | 0.654 ** | 0.718 ** | 0.706 ** | 0.743 ** | 0.801 ** | 1 |
| Variable | Perceived Usefulness | Perceived Ease of Use | Perceived Enjoyment | Customer AI Experience | Customer Engagement Behavior | |||
|---|---|---|---|---|---|---|---|---|
| Model | M1 | M2 | M3 | M4 | M5 | M6 | M7 | M8 |
| Gender | −0.01 | −0.01 | −0.03 | −0.07 | −0.06 | −0.06 | −0.04 | 0.04 |
| Age | 0.04 | 0.00 | −0.03 | 0.07 | 0.05 | 0.08 | 0.10 * | 0.00 |
| Education | −0.03 | −0.08 * | −0.09 * | −0.06 | −0.04 | 0.00 | 0.00 | 0.06 |
| Occupation | 0.02 | 0.06 | −0.01 | 0.11 * | 0.09 * | 0.06 | 0.11 * | 0.04 |
| Perceived AI Innovation | 0.66 *** | 0.76 *** | 0.73 *** | 0.64 *** | ||||
| Perceived Usefulness | 0.72 *** | |||||||
| Perceived Ease of Use | 0.72 *** | |||||||
| Perceived Enjoyment | 0.68 *** | |||||||
| Customer AI Experience | 0.79 *** | |||||||
| R2 | 0.44 | 0.58 | 0.54 | 0.43 | 0.54 | 0.54 | 0.48 | 0.62 |
| F | 46.39 *** | 81.93 *** | 69.67 *** | 45.89 *** | 68.58 *** | 70.79 *** | 55.01 *** | 100.09 *** |
| Path | Effect Value | Boot Std. Error | Boot Lower CI | Boot Upper CI | Relative Mediation Effect |
|---|---|---|---|---|---|
| Total Direct Effect | 0.749 | 0.095 | 0.557 | 0.929 | 88% |
| Perception of AI Innovation → Perception of Usefulness → Customer AI Experience | 0.275 | 0.065 | 0.146 | 0.400 | 32% |
| Perception of AI Innovation → Perception of Usability → Customer AI Experience | 0.332 | 0.082 | 0.180 | 0.498 | 39% |
| Perception of AI Innovation → Perception of Entertainment → Customer AI Experience | 0.142 | 0.059 | 0.031 | 0.263 | 17% |
| Chain Mediation | Effect Value | Boot Std. Error | Boot Lower CI | Boot Upper CI |
|---|---|---|---|---|
| Chain Mediation Effect 1 | 0.265 | 0.054 | 0.163 | 0.376 |
| Chain Mediation Effect 2 | 0.354 | 0.071 | 0.224 | 0.501 |
| Chain Mediation Effect 3 | 0.240 | 0.058 | 0.133 | 0.365 |
| Perception of AI Innovation → Customer AI Experience → Customer Involvement Behavior | 0.224 | 0.044 | 0.144 | 0.314 |
Disclaimer/Publisher’s Note: The statements, opinions and data contained in all publications are solely those of the individual author(s) and contributor(s) and not of MDPI and/or the editor(s). MDPI and/or the editor(s) disclaim responsibility for any injury to people or property resulting from any ideas, methods, instructions or products referred to in the content. |
© 2025 by the authors. Licensee MDPI, Basel, Switzerland. This article is an open access article distributed under the terms and conditions of the Creative Commons Attribution (CC BY) license (https://creativecommons.org/licenses/by/4.0/).
Share and Cite
Li, C.; Hao, R.; Li, N.; Zhang, C. Measuring Customer Experience in AI Contexts: A Scale Development. J. Theor. Appl. Electron. Commer. Res. 2025, 20, 31. https://doi.org/10.3390/jtaer20010031
Li C, Hao R, Li N, Zhang C. Measuring Customer Experience in AI Contexts: A Scale Development. Journal of Theoretical and Applied Electronic Commerce Research. 2025; 20(1):31. https://doi.org/10.3390/jtaer20010031
Chicago/Turabian StyleLi, Chunqing, Riyan Hao, Ning Li, and Chenlu Zhang. 2025. "Measuring Customer Experience in AI Contexts: A Scale Development" Journal of Theoretical and Applied Electronic Commerce Research 20, no. 1: 31. https://doi.org/10.3390/jtaer20010031
APA StyleLi, C., Hao, R., Li, N., & Zhang, C. (2025). Measuring Customer Experience in AI Contexts: A Scale Development. Journal of Theoretical and Applied Electronic Commerce Research, 20(1), 31. https://doi.org/10.3390/jtaer20010031