Article

Most Significant Impact on Consumer Engagement: An Analytical Framework for the Multimodal Content of Short Video Advertisements

1
Zhangjiagang Campus, Jiangsu University of Science and Technology, Zhangjiagang 215600, China
2
College of Information and Management, Wuhan University, Wuhan 430072, China
*
Author to whom correspondence should be addressed.
J. Theor. Appl. Electron. Commer. Res. 2025, 20(2), 54; https://doi.org/10.3390/jtaer20020054
Submission received: 13 January 2025 / Revised: 17 March 2025 / Accepted: 20 March 2025 / Published: 24 March 2025

Abstract

:
The increasing popularity of short videos has presented sellers with fresh opportunities to craft video advertisements that incorporate diverse modal information, with each modality potentially having a different influence on consumer engagement. Understanding which information is most important in attracting consumers can provide theoretical support to researchers. However, the dimensionality of the multimodal features of short video advertisements is often higher than the available data, posing specific difficulties in data analysis. Therefore, designing a multimodal analysis framework is needed to comprehensively extract and reduce the dimensionality of the different modal features of short video advertisements, thus analyzing which modal features are more important for consumer engagement. In this study, we chose TikTok as the research subject, and employed deep learning and machine learning techniques to extract features from short video advertisements, encompassing visual, acoustic, title, and speech text features. Subsequently, we introduced a method based on mixed-regularization sparse representation to select variables. Ultimately, we utilized multiblock partial least squares regression to regress the selected variables alongside additional scalar variables to calculate the block importance. The empirical analysis results indicate that visual and speech text features are the key factors influencing consumer engagement, providing theoretical support for subsequent research and offering practical insights for marketers.

1. Introduction

The rise of Web 2.0 ushered in the golden age of short videos. Short video platforms incorporate advertising elements into entertainment-oriented short videos and recommend them to potentially interested consumers based on targeted recommendation algorithms, giving them a natural advantage in traffic aggregation [1]. This “advertising + short video platform” business model has also been widely adopted by platforms such as TikTok, Kwai, and YouTube. According to a report by QuestMobile [2], as of December 2024, TikTok’s deduplicated active user base reached 978 million, far exceeding that of other short video platforms. This vast user base provides TikTok with immense market potential. Advertisers, brands, and influencers alike can find a large number of potential consumers or viewers on this platform. This market potential helps attract more business collaborations, driving TikTok’s commercialization and profitable growth.
On short video platforms, users can customize their short videos with color filters, video editing tools, background music, and subtitles, easily enabling self-expression [3]. Influencers, based on their personal brands, gather followers with similar interests. When the number of followers accumulates to a certain level, they begin to monetize through short video advertisements or live streaming sales [4]. Short videos are essentially social media that combine audiovisual elements. For influencers, one of the greatest challenges lies in attracting as many consumers as possible by posting engaging content [5]. This aspect has also garnered attention from the academic community.
Therefore, researchers have begun to extract features from various modalities of short videos to explore the antecedents that influence consumer engagement, interaction, and purchasing behaviors. For example, Wei et al. [6] extracted consumers’ perceived warmth and competence traits from the comment texts and title texts of short videos and found a significant impact on consumer engagement. Xiao et al. [7] extracted multimodal features from the speech text, audio signals, and visual signals of short videos and similarly discovered the influence of these features on consumer engagement behavior. However, it seems that there is no framework available to quantitatively inform researchers which modal features are the key factors influencing consumer engagement in short video advertisements.
Essentially, short videos are social media platforms that integrate audiovisual elements and contain various modal data [8]. It is necessary to identify which modal features are the key factors influencing consumer engagement, providing theoretical support for researchers studying short videos and optimization suggestions for short video marketing. Lu et al. [9] made a preliminary exploration of this problem. They extracted visual, acoustic, and title features from short videos through quantitative methods and found that title and visual features are important factors influencing user engagement in short videos. However, they overlooked the importance of speech text features. Furthermore, their research only focused on short entertainment videos, and whether the multimodality of short video advertisements exhibited consistency remains to be further explored.
With the aim of resolving this issue, this study designs a multimodal analysis framework that extracts multiple modal features from short video advertisements, optimizes variable selection methods based on regularization representations, and performs multiblock regression to analyze which features are more significant for consumer engagement. As shown in Figure 1, we designed a multimodal data analysis framework to investigate the impact of short video advertising content attributes on consumer engagement. Firstly, VGG16+LSTM [10,11], Fourier transform, and Word2Vec [12] were used to extract the visual, acoustic, and title text features of short video advertisements, respectively. Using the Baidu API, the audio was converted to speech text, and the speech text features were retrieved using the BERT model [13]. The different modalities of features were grouped together as different blocks. Subsequently, given that some blocks had extremely large dimensions, a mixed-regularized sparse representation-based method was proposed to select features for these blocks independently. Finally, the chosen multimodal features and consumer engagement indicator variables were regressed using the multiblock partial least squares (MBPLS) method [14], and the block importance (BIP) is utilized to compare various data patterns and calculate the actual contribution of each block to the prediction of consumer engagement.

2. Related Work

2.1. Short Video Advertising

The content of short video advertising is typically more condensed than that of regular adverts, catering to users’ fragmented and fast-paced viewing patterns. They are frequently presented in imaginative and engaging ways, which better grabs viewers’ attention and piques their interest. As a result, short videos are more popular and possess a larger user base. The vast user base of short video platforms provides ample opportunities for sellers to promote their products [15]. This marketing strategy is known as short video business, and the short videos containing product promotions are considered short video advertisements [16]. Several platforms can be used to edit short videos. For example, TikTok has powerful editing and customization functions that sellers can use to market their products with an exciting style to attract consumers. Consumers can interact with sellers by liking, commenting, collecting, sharing videos, and purchasing their preferred products through the “little yellow car” link. Unlike traditional video advertising, short videos effectively reach consumers during various fragmented moments, shaping the product brand image and inciting consumer purchasing intent through repeated playbacks [17].
Current research primarily focuses on influencers and the content attributes of short videos. For influencers, Zhang and Zhang [18] discovered that both the presentation style and sales approach of influencers in short video advertisements could significantly influence consumers’ neural engagement. Haq and Chiu [19] found that the positive image of influencers could be transferred to the platform and product image, thereby influencing consumers’ intention of online engagement as well as their emotional, cognitive, and social behaviors. Tan et al. [20] extracted images of doctors from short videos and found that the image features were significantly correlated with the behavior of the viewers’ engagement, and the doctor with formal uniforms or videos taken in the study room or at home on the white wall would receive more engagement.
In terms of short video content attributes, Chen et al. [21] reported that the duration, title, dialogue cycle, and content type of short videos released by the health sector in China would affect the level of user engagement. Using the text mining method, Xiao et al. [16] found that the performance expectation, entertainment, contact strength, and sales approaches of short video advertisements significantly correlated with consumer engagement, and product type had moderate effects. Zhang et al. [22] reported that the combination of audio features in short videos could enhance user engagement. Through the study of content matching, information association, story, and emotion of short videos, Dong et al. [23] found that the content features of short videos markedly affected consumer engagement, and the release time of videos had moderation effects between short video emotion and consumer engagement.
Essentially, short video advertisements contain multiple modes of content, including visual, acoustic, and speech text. Visual content refers to all components that make up a short video and convey information and feelings through visual elements, such as images, colors, lighting effects, etc. Acoustic content mainly refers to sound elements in short videos that affect viewers’ auditory perception, including human voices, music, and sound effects. Speech text content mainly refers to the written content presented through speech in short videos, which can directly convey information and express emotions, working together with the video images to create the complete content and atmosphere of the short video. Title content is a brief and concise text description set for the video to summarize or attract viewers to click and watch, which can affect the video’s exposure, click-through rate, and viewers’ first impression. In order to provide researchers with a theoretical basis for selecting the content modalities and to offer influencers advice on creating engaging video content, it is necessary to further explore which factors are the key influencers in short video marketing.

2.2. Consumer Engagement Behaviors

Consumer engagement behaviors refer to the various actions and decision-making processes exhibited by consumers during the purchase, use, and evaluation of products or services [6,7,8]. It serves as a pivotal metric for assessing the effectiveness of corporate activities, particularly drawing significant attention in the field of relationship marketing [16]. This behavior stems from consumers’ intrinsic motivations, encompassing word-of-mouth promotion, recommendations, assistance to others, posting reviews, and even legal actions [24]. It embodies the depth of consumers’ connections with services, products, brands, and events, serving as the cornerstone of brand relationship building and reflecting consumers’ cognitive, emotional, and behavioral responses towards brands [6,25].
In the realm of short videos, consumer engagement centers around three key dimensions: emotional connection, cognitive processing, and specific behaviors [6,16,23], with behavioral engagement (likes, comments, collects, and shares) being particularly crucial [7]. This is attributed to three reasons: firstly, the behavioral engagement indicators on short video platforms are intuitive and susceptible to the bandwagon effect, becoming vital benchmarks for evaluating video quality [26]; secondly, videos with high engagement can garner more exposure through the platform’s traffic allocation mechanism, directly impacting sales [6]; and thirdly, behavioral engagement is an external manifestation of consumers’ emotional and cognitive investments, with high-quality video content prompting greater behavioral engagement [7,27]. Furthermore, behavioral engagement also mirrors consumers’ evaluations, feedback, and suggestions regarding brand services [7]. Specifically, likes signify emotional identification and social identity, comments reflect opinions, emotional feedback, and social interaction [28], collects cater to content preferences and review needs [6], while shares underscore recognition, recommendation, and social interaction demands, embodying trust in the platform [7]. Understanding these behavioral patterns holds practical significance for short video marketing strategies.

2.3. Multimodal Content Analysis

The multimodal content analysis model involves various aspects, including the understanding and generation of multiple modalities such as images, videos, audio, and text. Researchers typically use machine learning and deep learning algorithms to predict patterns based on specific modal features or explore the impact of multimodal content on consumer behavior using regression models. In terms of pattern prediction, Fu et al. [29] extracted multimodal features from short video advertisements and designed a time series prediction model using a hierarchical attention model and customized LSTM, predicting advertisement sales effectively. Guo et al. [30] extracted shared, unique, and conflicting information from multimodal features, using a hierarchical multitask classification module to capture dependencies, accurately predicting consumer responses. Yang et al. [31] calculated engagement and product heat maps based on video dimensions, length, and product image matching, deriving a score that captures product engagement within the video.
In terms of consumer behavior, Xiao et al. [7] extracted emotional features from speech text, energy features from audio signals, and color perception features from video signals in short video advertisements, discovering through regression models the significant impact of these multimodal features on consumer engagement behavior. Wang et al. [32] found that human voiceovers in short video advertisements can reduce consumer cognitive load and enhance purchase intention compared to AI voiceovers. Additionally, they discovered that human voiceovers are preferred without subtitles, while the difference diminishes with subtitles. Lu et al. [9] extracted deep features of acoustics, vision, and titles from various entertainment-type short videos using deep learning methods, finding the importance of titles and visual features in consumer engagement behavior.
These studies typically select several different modal features to explore specific issues. However, the basis for selecting different modal features lacks objective evidence. Although Lu et al. [9] conducted a preliminary exploration of the importance of multimodal features in entertainment-type short videos, they overlooked the crucial speech text feature in short videos. Furthermore, the consistency of the importance of these multimodal features in the context of short video advertisements remains to be further explored. Therefore, this study aims to extract visual, speech text, title, acoustic, and scalar features from short video advertisements, design multimodal analysis algorithms, and to explore the key features that influence consumer engagement behavior.

2.4. Multimodal Features and Variable Screening Methods

Different modes affect the user’s choice in a multimodal system, and multimodal analysis often involves high-dimensional features of these modes. Feature extraction becomes crucial when dealing with numerous variables [33]. In the current research, the three multimodal features in short videos that researchers are typically most concerned with are visual, textual, and acoustic features.
Regarding visual features, researchers typically rely on machine learning and deep learning techniques to capture images from video frames and compute the visual features of the video based on these images. For example, Xiao et al. [7] used OpenCV to extract color features from each frame of the entire short video, calculating the overall color features of the video by averaging color values. However, this approach ignores the issue of varying lengths in short videos. Lu et al. [9] further confirmed the importance of the first 10 s of short video advertisements and proposed using the ResNeXt-50 model to extract video frame features on a second-by-second basis, which exhibits high efficiency in batch and systematic processing of video data. Additionally, there are more complex image feature extraction methods. Yu et al. [34] used the quantum evolution method to extract the inner image features based on the quantum evolution method. Tian and Wang [35] utilized a quantum kernel clustering method to test the image marginal features, which showed evident feature distribution and sound consistency.
Regarding textual features, natural language processing has made great strides. For example, Lu et al. [9] successfully extracted deep features from short video titles using the Word2Vec method. In fact, if the training sample is large enough, the traditional Word2Vec method can effectively extract word vectors for vocabulary modeling [12]. However, Word2Vec is a method based on word vectors and has limited understanding of sentence semantics. Therefore, researchers have proposed large language models such as ERNIE [36] and BERT [13], which can learn a significant amount of prior language knowledge through pre-training. This significantly enhances the effectiveness of semantic extraction and, therefore, they are also widely applied in the extraction of deep features for empirical research [9,37].
Regarding acoustic features, researchers typically rely on the Fourier transform to extract features such as the spectral centroid, spectral variance, spectrum bandwidth, zero-crossing rate, and RMS (Root Mean Square) energy [7,9]. These features often carry different implications and can typically provide a good explanation for a particular aspect of the audio. For instance, spectral variance can indicate the degree of audio diversity, spectral centroid can represent the characteristics of pitch, and zero-crossing rate can reflect the level of audio fluctuation frequency [7]. Furthermore, there are also hybrid feature extraction methods. Hu and Flaxman [38] used deep neural networks LSTM [10] and an initial model to extract text features and image features, respectively. Gallo et al. [39] encoded the text through the convolution, maximum pooling, and complete connection layers. Then, they drew the extracted text features on the image to enhance the image information.
Short videos have multimodal attributes, which result in higher dimensions of extracted features compared to the sample number. Selecting the variables of the extracted short video features is necessary. The feature selection process aims to reduce the dimensions of the feature space by screening a subset of the original feature space, which can effectively reduce the dimensions of the feature space [40]. Many studies have emphasized the importance of feature selection and its optimization process [41,42,43,44]. As a result, Zhao and Liu [41] proposed a spectral feature selection that measured feature correlation and developed feature selection based on the correlation by constructing spectral maps. Li et al. [42] used non-negative spectrum analysis in non-negative discriminative feature selection to obtain more accurate cluster labels and guide the feature selection process. Shi et al. [43] proposed a robust spectral feature selection method that utilized a stable partial learning method and spectral regression to build graphs and process the learned errors. Zhang et al. [44] suggested an optimization method incorporating space reduction and local filter search techniques based on average mutual information and feature redundancy to tackle the feature selection problem through global exploration capabilities.

3. Materials and Methods

3.1. Data Collection and Pre-Processing

Nelson [45] classified products into search products and experience products based on the ability of consumers to assess the products before making a purchase. Search products can be quickly evaluated by comparing product qualities, while experience products can only be assessed by physically seeing, smelling, touching, or using them [46].
In this study, food (such as snacks, beverages, light refreshments, bread, noodles, and so on) is used to represent experience products, and digital products (such as portable chargers, mobile phone accessories, speakers, headphones, and so on) are used to represent search products. According to Xiao et al. [16], consumer engagement metrics stabilize when short videos are posted for over 30 days. Therefore, we selected short video advertisements posted over 30 days to maintain the variables’ validity. From January to May 2023, we gathered 906 short video advertisements related to food and digital products from data analysis websites for short videos and live broadcasts (https://dy.huitun.com (accessed on 1 July 2024)). After excluding invalid and missing data, we collected 501 in the food category and 405 in the digital product category. For each video, the collected information includes the video title, video publishing time, video duration, likes, comments, collects, shares, author fan numbers, and product price.
Then we used the web crawler tool Python (version 3.7) to crawl these 906 short video advertisements through video links and extracted the features through machine learning and deep learning methods. As shown in Table 1, the extracted features include the title, speech text, acoustic, visual, and scalar. Scalar features include the duration, speech speed, title length, published time, and product price of short video advertisements. The likes, comments, collects, and shares of short video advertisements are combined as the indicator variables of consumer engagement. In order to ensure that our method is properly tested and to avoid errors caused by the sample distribution problem, we evaluated the statistical distribution of consumer engagement indicator variables. As shown in Table 2, the skewness and kurtosis of the indicator variables exceed the acceptable range of normal distribution (skewness > 3; kurtosis > 7), indicating excessive dispersion of the dataset. Therefore, in this study, we use the logarithm of indicator variables for analysis. Furthermore, in our later writing, likes, comments, collects, and shares stand for In (likes), In (comments), In (collects), and In (shares), respectively.

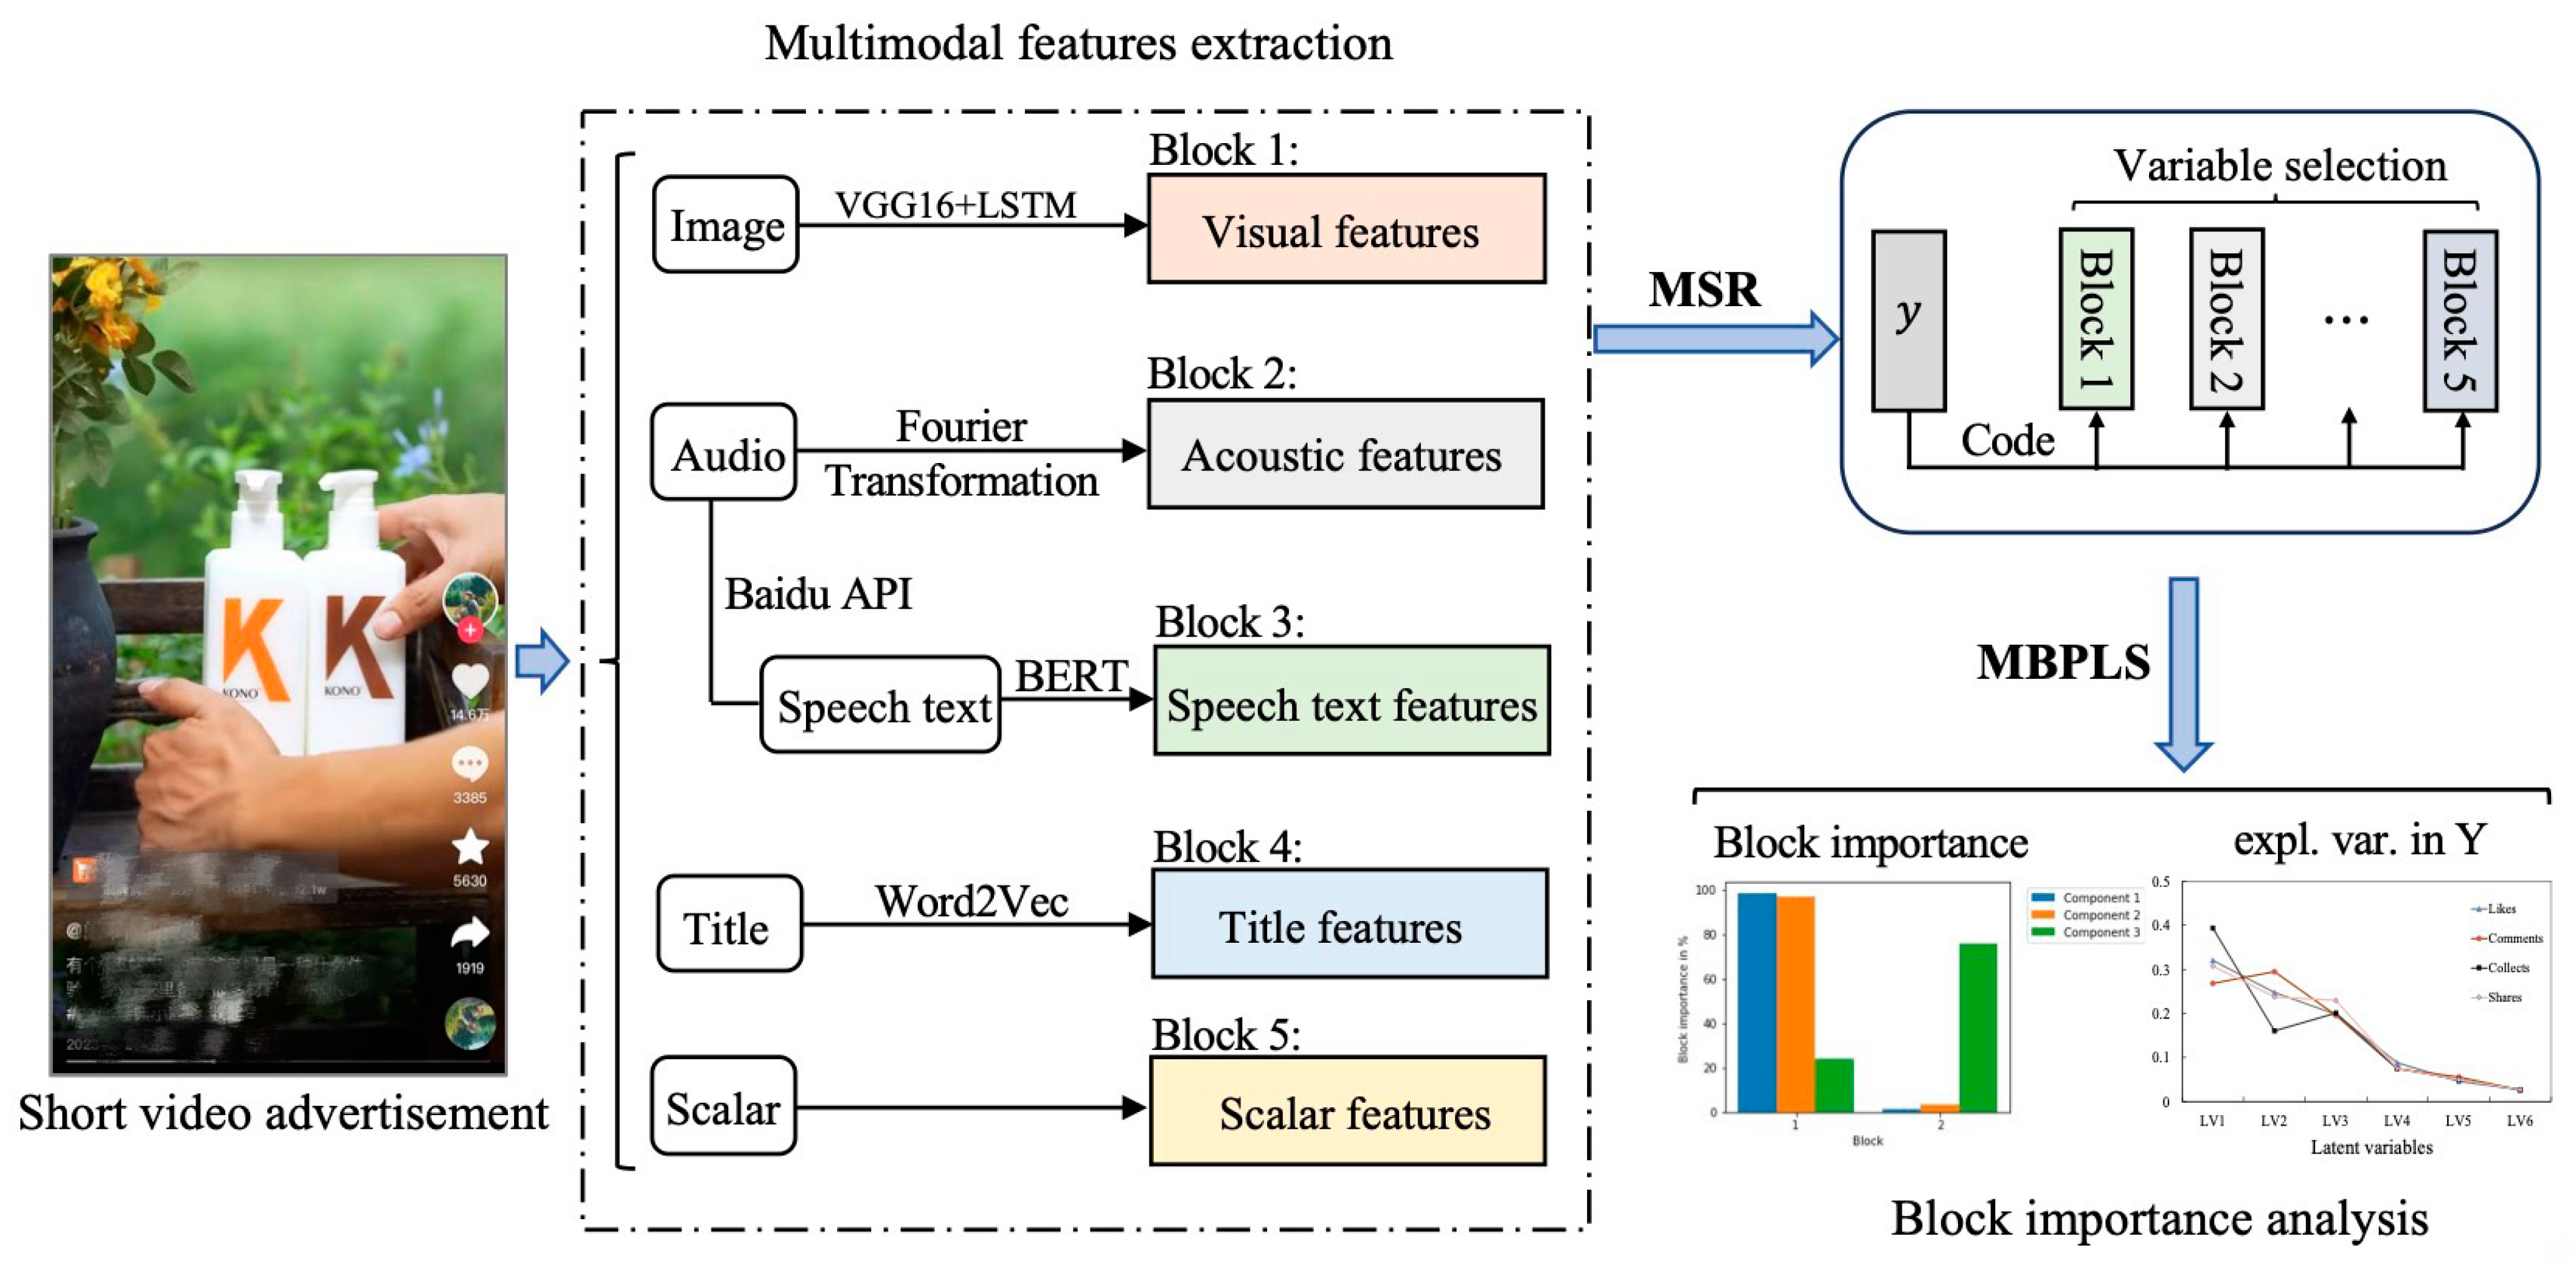
3.2. Feature Extraction

Short video advertisements can be analyzed by extracting features, which encompasses identifying visual, speech text, acoustic, title, and scalar elements, and examining these components to understand their contributions to the advertisements’ overall message and impact on consumers.
Visual feature extraction: Ouzir et al. [47] conducted an analysis of consumers’ electroencephalogram (EEG) while they watched short video advertisements and found that consumers’ perception of changes within each second of the short video frames was not significant, allowing for the analysis of consumers’ cognitive processes on a second-by-second basis. Furthermore, they discovered that consumers’ brains only need a few seconds to process the visual features on social media. Xiao et al. [7] indicated that in short videos, consumers typically use only a very short amount of time to judge their interest in the current content and to decide whether to continue watching. This point was also supported by Lu et al. [8], who demonstrated that the visual content within the first 10 s of a short video is a crucial factor influencing consumer engagement.
Based on their research, our study captured the first ten seconds of the short video advertisement by second, using a pre-trained network, visual geometry group 16 (VGG16) [11], to extract the features of each image into a 4096-dimensional vector. Considering that after extracting visual features using VGG16, we needed to further extract temporal sequence features using LSTM, we excluded the three hidden layers of VGG16 in order to avoid the influence of task-specific information that they might introduce on the feature extraction process. Given the continuous nature and strong temporal continuity of short videos, we employed the LSTM model to extract the time-series features from these 10 images, which generated a 1280-dimensional vector to represent the visual features of the short video. The basic structure of LSTM consists of four main components: the input gate, the forget gate, the output gate, and the memory cell. LSTM is a special type of recurrent neural network that excels in processing time-series data and can handle long-term dependency issues with high performance. The playback of short videos was a continuous process with temporal solid continuity. The LSTM model was used to extract the time-series features of these 10 images. Finally, a 1280-dimensional vector was generated to represent the visual features of the short video.
Speech text feature extraction: The Baidu API was used to convert the speech to text for each short video advertisement. Since speech text is usually concise and contains strong logic, most short videos have speech text of less than 512 characters. The content at the beginning of the short video plays a crucial role in determining whether the viewer continues to watch it. The Bert model [13] was used to extract features of the first 512 characters of each speech text. Specifically, the official pre-trained model of Google, Bertbase Chinese, was selected to train the speech text. The features of speech text were characterized through the first unique marker “[CLS]” vector of the pre-training model, which encoded the semantics of the entire sentence.
Title feature extraction: The title of each article in a corpus of 162,000 Chinese articles was downloaded as training data using the Python package Jieba. The titles were then segmented, stop words were removed, and lexical representations of each title were obtained for word vector training. The corpus’s XML files were converted to text files, and the text files underwent pre-processing that simplified stopword removal and traditional Chinese word segmentation to prepare the data for training. Then, the Chinese word vectors were trained using the Word2Vec algorithm in the Python package Gensim. Finally, each word of the titles was transformed into a 100-dimensional vector, and the average of all word vectors for each title was used to represent the title feature.
Acoustic feature extraction: The Python Librosa analyzed acoustic signals in frames using the Fourier transform. A set of acoustic features was extracted using the zero-crossing rate, spectral centroid, spectrum roll-off, RMS energy, spectrum bandwidth, chromaticity frequency, and Mayer frequency cepstrum coefficient. Extracting various features from each frame of an acoustic signal is possible. These features include the zero-crossing rate, spectral center, spectrum attenuation, RMS energy, spectral bandwidth, and chromaticity frequency. Moreover, the Mel frequency cepstrum coefficient, a small set of 20 coefficients, can also be extracted. As a result, 26-dimensional features can be extracted from each frame of the acoustic signal.
Scalar feature extraction: The duration, speech speed, title length, gap time, and product price of each short video advertisement were used as scalar features.
This study used five features from short video advertisements, including scalar, speech text, title, acoustic, and visual features, for multimodal analysis. Each short video divided the scalar, speech text, title, acoustic, and visual features into five blocks, resulting in a 2179-dimensional vector comprising all blocks.

3.3. Method

3.3.1. Mixed-Regularization Sparse Representation-Based Method

The l 2 norm is unsuitable for variable screening, and the l 1 norm can eliminate numerous highly correlated variables. Therefore, we have devised a mixed-regularization sparse representation (MSR) method to refine the l 1 -regularization-based variable screening approach. This innovative method integrates the l 1 and l 2 norms, thereby enabling us to preserve crucial, highly correlated variables and bolster the overall stability of the screening process. Before discussing the MSR method, we first specify some symbols: for vectors a = ( a 1 , a 2 , , a p ) T , the l 1 and l 2 norms of a are a 1 = a 1 + a 2 + + a p and a 2 = ( a 1 2 + a 2 2 + + a p 2 ) 1 / 2 , respectively, where a i represents the absolute value of a i , and the superscript T represents the transposition of a matrix or vector.
For the data X = ( X 1 , X 2 , , X p ) R n × p and y = ( y 1 , y 2 , , y n ) T R n × 1 , where n is the data number, and p is the feature number. The core of the MSR method is to find a weight vector w = ( w 1 , w 2 , , w p ) T R p × 1 to combine the independent variable X to allow the distance between X and y be closer. This process indicates that MSR must find the weight vector w ~ that minimizes the right side of (1).
w ~ = a r g m i n w { y X w 2 2 + λ ( ρ w 1 + ( 1 ρ ) w 2 2 ) }
where λ is the penalty coefficient; ρ is the mixed parameter with the value in [0, 1].
Due to the fact that in solving the minimum value of Equation (1), the absolute value is not differentiable, we use the coordinate descent method [48] to solve this optimization problem. For Equation (1), we rewrite each element of w as an independent variable to Equation (2), then the optimization problem is transformed to solve for the minimum value of f w .
f w = f w 1 , w 2 , , w p = y X w 2 2 + λ ( ρ w 1 + ( 1 ρ ) w 2 2
Considering that f w is a differentiable convex function, the local minimum value of f w is the global minimum value. Therefore, we sequentially find the partial derivative of w i ( i = 1,2 , , p ), calculate the minimum value of the univariate linear equation, and conduct a descent calculation to obtain the global minimum value of f w . The t -th ( t = 1,2 , . . , N ) iteration process is shown in (3):
w 1 ( t ) = a r g m i n w 1 f ( w 1 , w 2 t 1 , w 3 t 1 , , w p ( t 1 ) ) w 2 ( t ) = a r g m i n w 2 f ( w 1 t , w 2 , w 3 t 1 , , w p ( t 1 ) ) w p ( t ) = a r g m i n w p f ( w 1 ( t ) , w 2 ( t ) , , w p 1 ( t ) , w p )
The values of w i + 1 to w p in f w are all taken from the ( t 1 ) -th iteration, and the values of w 1 to w i 1 are all taken from the t -th iteration. The goal is to determine the current minimum value of the parameter w i of the t -th iteration. All values of w are updated in every iteration. When the value of the iteration error w t w t 1 1 is less than the given threshold, we consider the descent to be convergent, where w t and w t 1 are computed in the t -th and the ( t 1 ) -th iteration, respectively. When the descent is convergent, w ~ is estimated by w ( t ) . Then, f w ~ is the minimum value of (2). The independent variables corresponding to elements of w ~ with a value of 0 will be removed, thus achieving the effect of variable selection. The iterative process is shown in Algorithm 1.
Algorithm 1. Coordinate descent method
Input: Given a starting point w 0 R p × 1
Repeat
      for t = 1, 2,…, p do
           for i = 1, 2,…, N do
                             w i ( t ) = a r g m i n w i f ( w 1 t , , w i 1 t , w i , w i + 1 t 1 , , w p ( t 1 ) )
           end
       end
Until convergence
Output: w i ( t ) when convergence

3.3.2. Multiblock Partial Least Squares

The multiblock partial least squares (MBPLS) method can be used in data with a large number of variables and blocks [49]. In MBPLS, different blocks are processed in parallel to fit the regression model with the dependent variable [50]. The results of the calculation can be used for interpretation and prediction. These include the block weight, load, and score, as well as the super weight and super score. Therefore, MBPLS’s suitable block scaling can offers better explanations than the standard partial least squares method, as it can store all variables in a single block [51]. Super-weights indicate the relative importance of blocks, facilitating an explanation of noteworthy blocks and dominating variables influencing them. The proportional relevance of the variables in the block depends on their numerical values because super-weights in MBPLS are generated using block scores.
In the partial least squares (PLS) method, for each potential variable (LV) number, the predicted block X i and the response variable y are decomposed into the following equations:
X i = t i p i T + E i
y = u q T + F
where i = 1,2 , M ; M is the number of blocks; t i and u is the score vector; p i and q is the load vector, E i , and F is the residual error. The initial score vector u extracted from the response variable y is in all blocks X i for each LV number. This process is used to regress the assigned variable weights to w i . Then, w i and X i are multiplied to obtain a block score t i . All t i are combined to obtain the superblock B = t 1 , t 2 , , t M . According to (5), the super weight w t and super Score t t are obtained as follows:
w t = B u u T u = [ w t 1 , w t n , w t M ]
t t = B w t w t T w t
In (5), w t i corresponds to the weight of variables in the block i . When the LV number of each block is the same, t t will be equal to the score in regular PLS, making MBPLS perform quantitative predictions like PLS. The significant benefit of MBPLS is that it improves the model’s interpretability since the relative importance of blocks is determined by w t , which creates a better explanation of the blocks of interest and their dominant factors. However, w t depends on the numerical value of the variable in the block. Moreover, blocks with larger values may not contribute more to the MBPLS model, as certain variables may not provide predictive information. In addition to w t , a more plausible explanation and prediction result might arise by assigning each block a weight that represents its contribution to the model.

4. Results

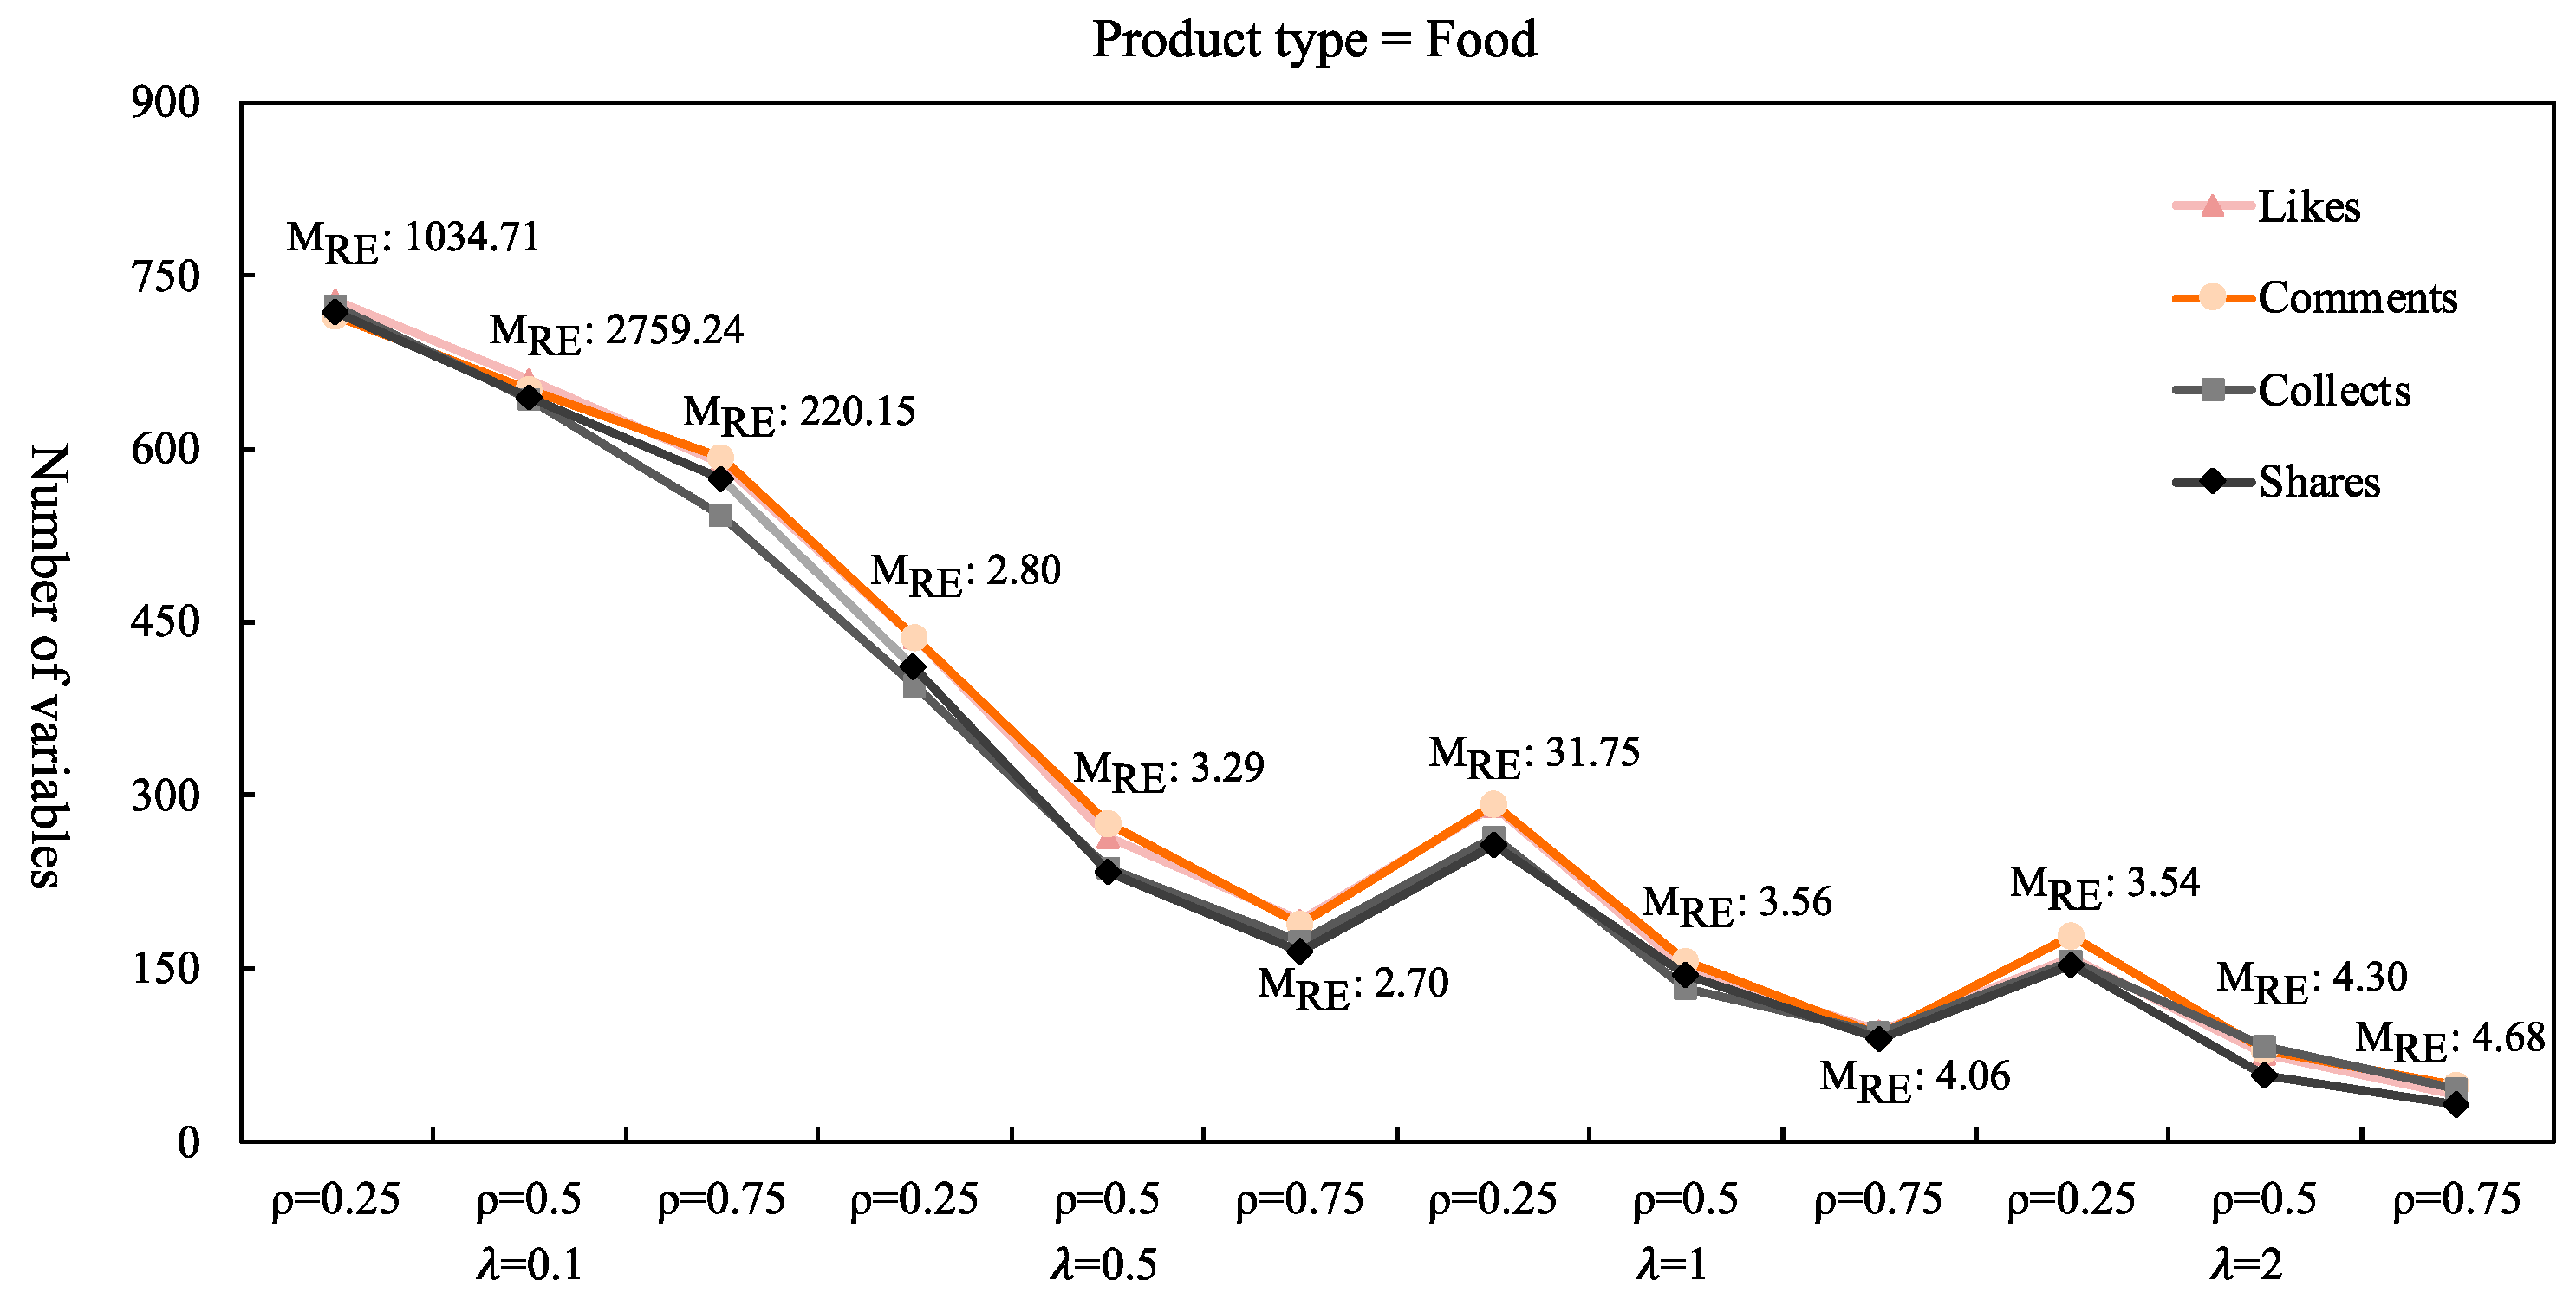
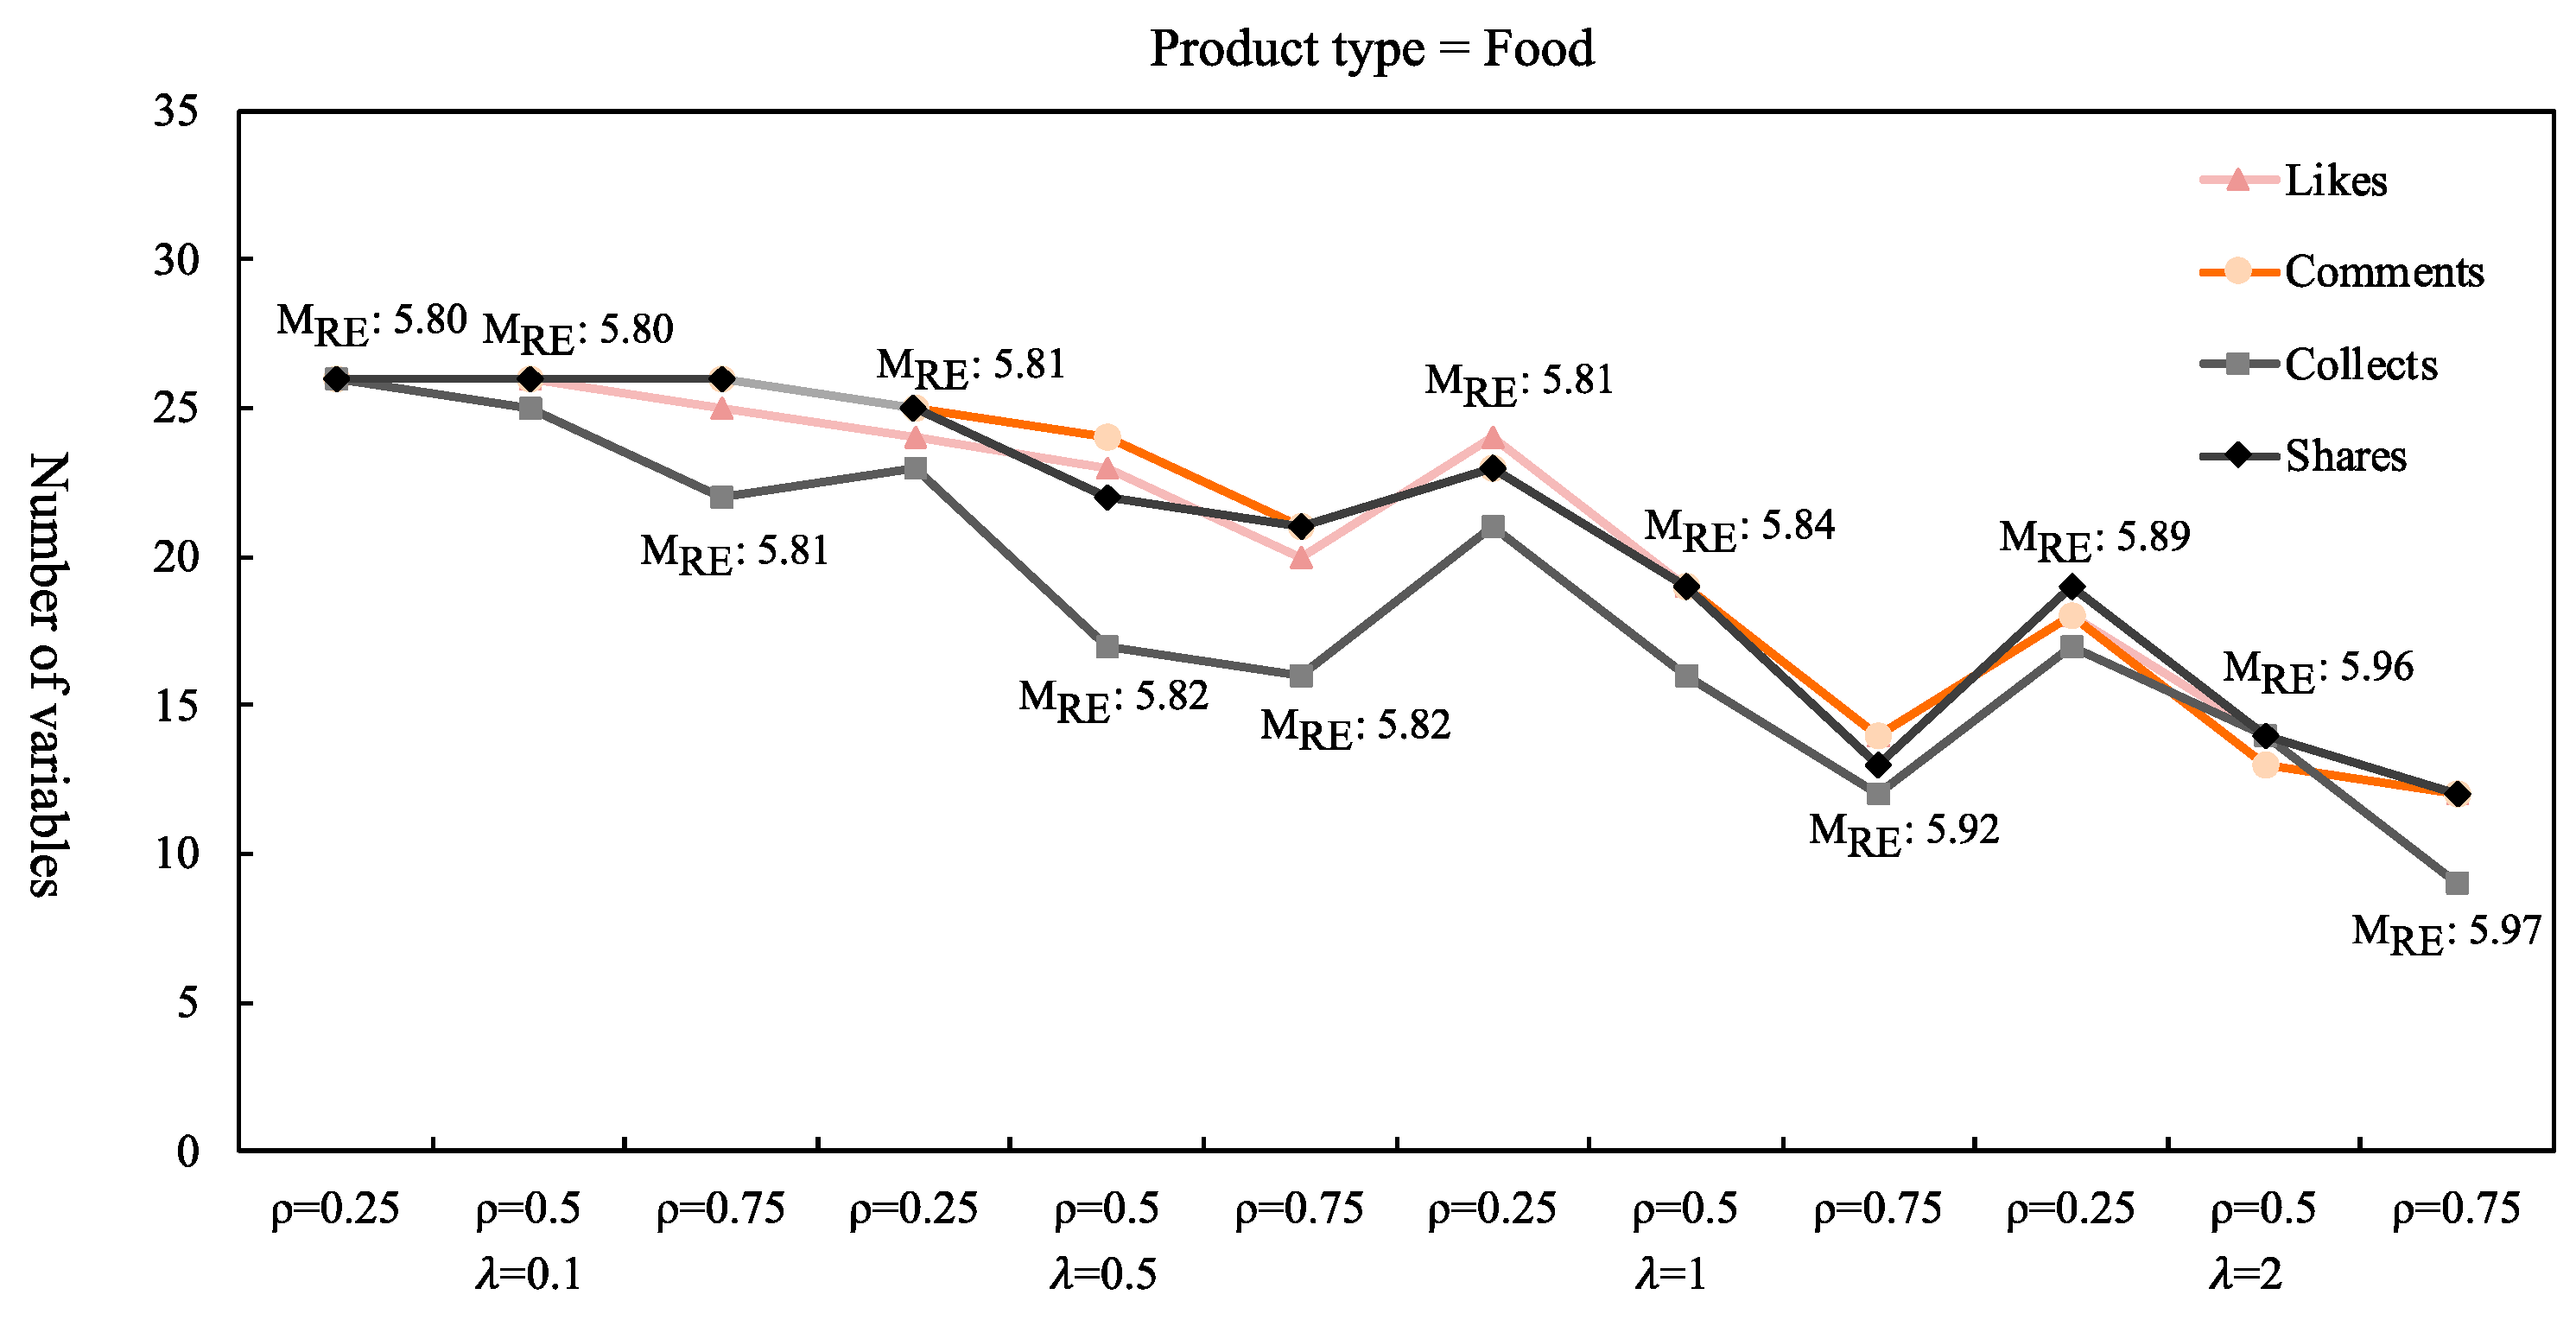
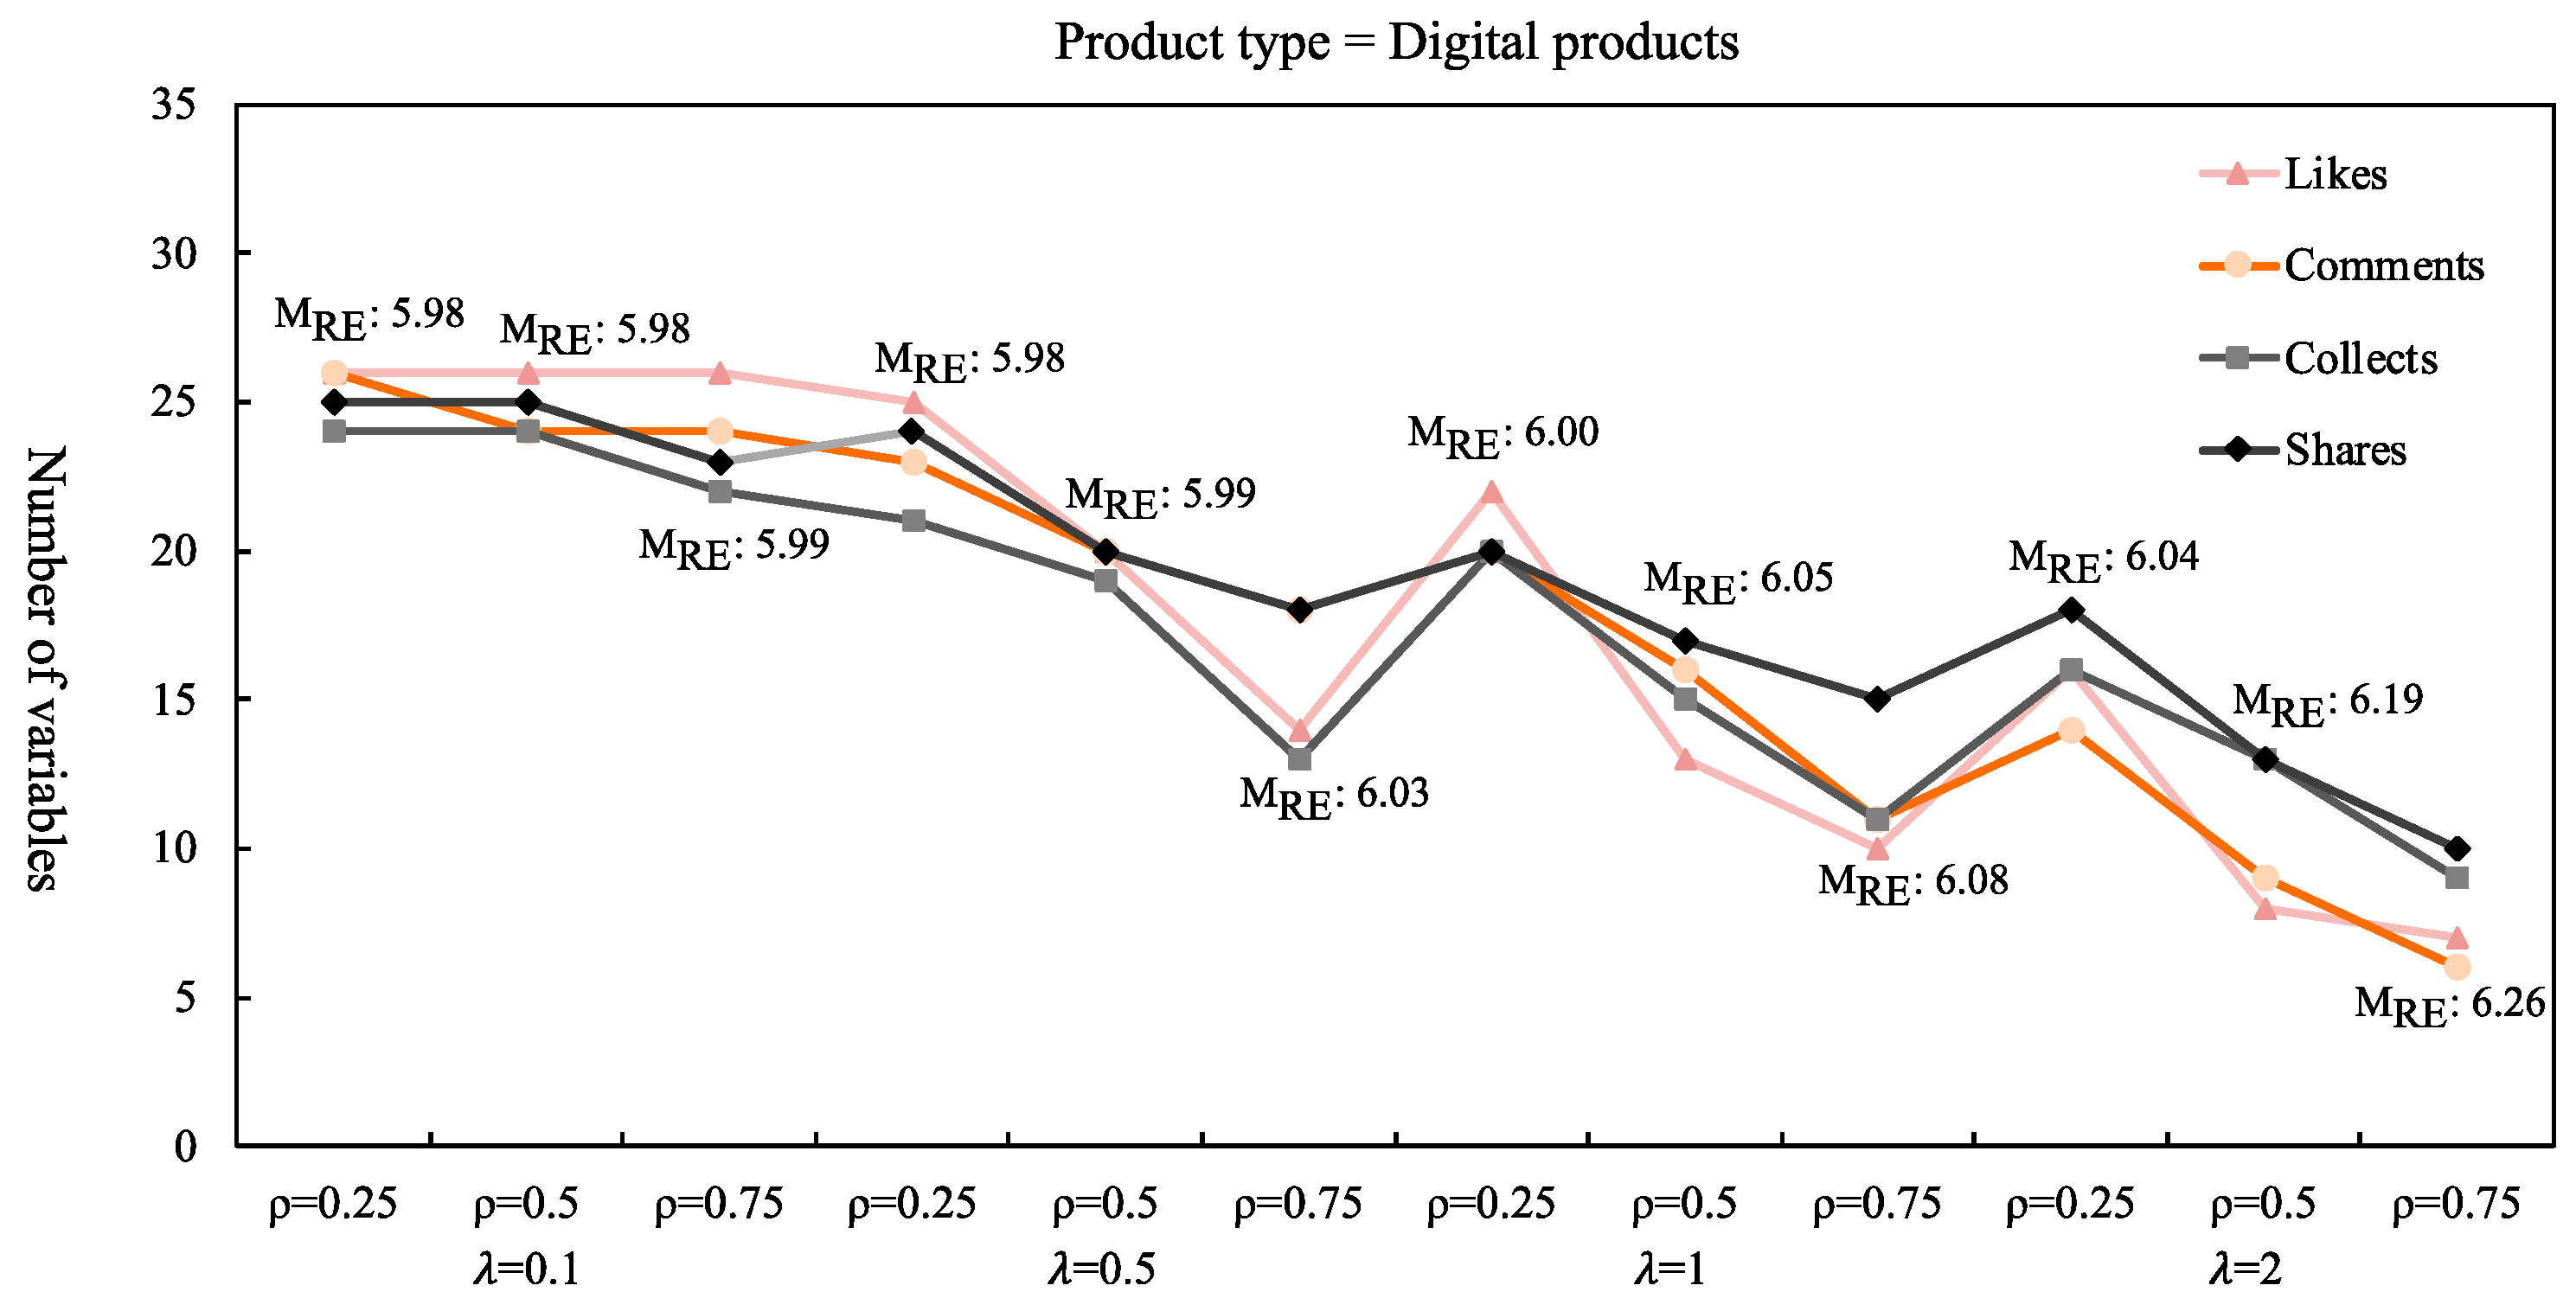
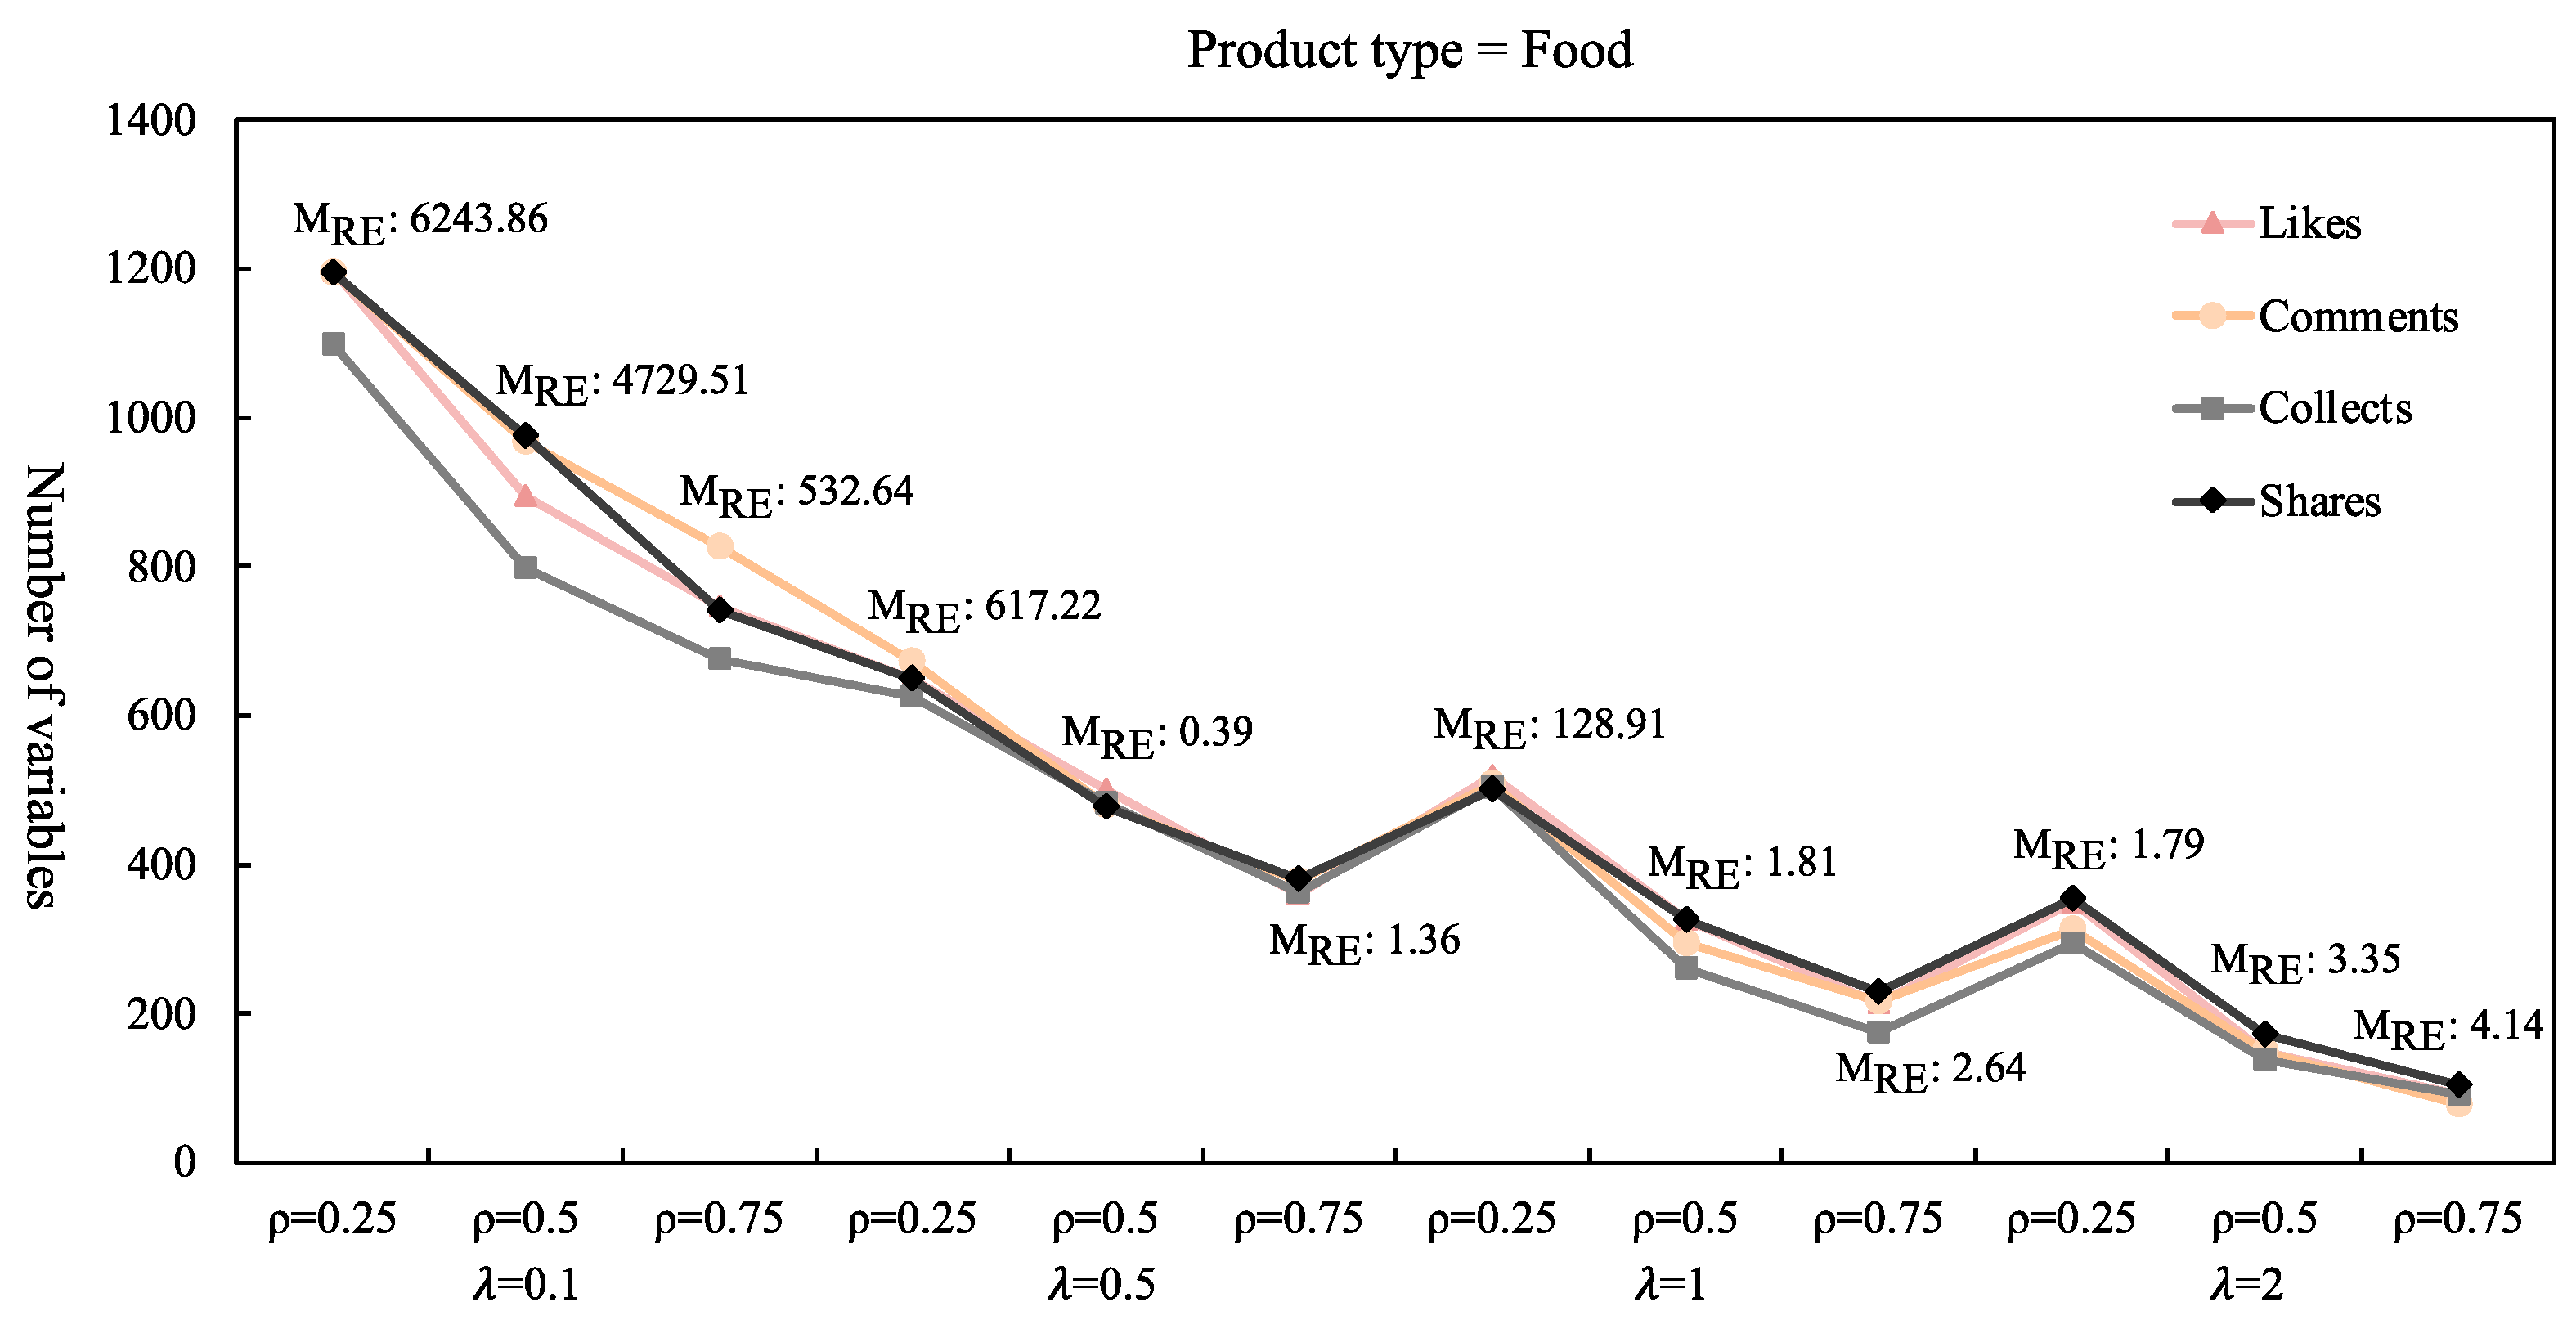
4.1. The Result of MSR

In order to investigate whether the proposed variable screening method can effectively achieve the goal of variable screening, we tested the variable screening results of the MSR method under different values of the penalty coefficient and the mixed parameters. We evaluated the magnitude of the independent variable’s representative error (RE) value in relation to the consumer engagement indicator variables. The penalty coefficient λ can increase the sparsity of the MSR method. Therefore, we suggest λ take values at [0.1, 2]. If λ is too small, MSR cannot achieve the variable screening. If λ is too large, MSR will eliminate too many variables. Therefore, the parameter ρ for mixing is meant to combine the regularized representations of l 1 and l 2 . When testing the MSR method, we only considered the values of ρ at 0.25, 0.5, and 0.75. Considering that the dimensions of scalar features are too small (only 5 variables), we only performed variable selection on visual, speech text, title, and acoustic features.
Specifically, we considered the variables of these four modalities as four blocks and applied the MSR method to perform variable selection for each block individually. The results of visual feature variable selection for food and digital products short video advertisements under different parameters are shown in Figure 2 and Figure 3. As λ increases, more variables are removed. For the same λ , the larger ρ is, the more variables are removed, and this trend remains consistent for each consumer engagement indicator variable for food and digital products. Therefore, we calculated the mean RE ( M R E ) value of these four consumer engagement indicator variables under each set of parameters λ and ρ . To avoid excessively eliminating variables, we selected the value of ( λ , ρ ) as the final parameter setting when the ER values no longer decrease significantly as ( λ , ρ ) increases. For food short video advertisements, when ( λ , ρ ) = (0.5, 0.5), M R E value significantly decreases to 0.39, and no longer changes significantly with the increases of ( λ , ρ ). For digital product short video advertisements, when ( λ , ρ ) = (0.5, 0.75), M R E value significantly decreases to 1.50, and no longer changes significantly with the increases of ( λ , ρ ). At this point, the variable dimensions for both types of products were reduced by at least 60%, so we selected these two sets of ( λ , ρ ) as the visual features.
The process of selecting parameters for variable selection of speech text, title, and acoustic features is similar. We have included the results of these features under different parameter selections in the Figure A1, Figure A2, Figure A3, Figure A4, Figure A5 and Figure A6. Finally, the selected parameters for different consumer engagement indicator variables of food and digital products are shown in Table 3, and the reserved variables are listed in Table 4. The variable selection process of MSR involved selecting parameters ( λ , ρ ) to optimize the representative error of the features corresponding to different consumer engagement indicators across various blocks. Consequently, the choice of parameters ( λ , ρ ) varies under different product types and consumer engagement indicators, leading to differences in the number of variables retained. However, regardless of the number of variables retained, their representative error for the dependent variable is below 5 (representing a significant reduction in relative error compared to when no variable selection is performed). This indicates that after MSR screening, the retained variables from different blocks maintain a consistent level of representativeness for consumer engagement indicators. In subsequent BIM analysis, this ensures a high degree of robustness.
To verify the results of the MSR method, we compared the variable screening results of the MSR method with random forest regression (RFR), t-distributed stochastic neighbor embedding (t-SNE), principal component analysis (PCA), and correlation analysis (CA) methods. Table 5 presents the regression results using the MSR method, comparison method, and unscreened variables. After applying the variable screening of MSR, the two short videos showed significant improvements in the evaluation indicators R, MSE (Mean Absolute Error), and MAE (Mean Squared Error) of consumer engagement regression compared to unfiltered variables. The R value is the correlation coefficient between predicted values and actual values. The closer the R value is to 1, the better the predictive capability of the model. MAE measures the average difference between predicted values and actual values, with a smaller value indicating more accurate predictions by the model, and it can be directly compared with the actual dimension of the data. MSE measures the average of squared prediction errors, with a smaller value indicating more accurate predictions by the model, and it is suitable for situations where prediction errors are relatively large.
Results showed that the MSR method had significantly higher R values for the regression evaluation indicators of consumer engagement variables than for the other variable screening methods, with little difference in MSE and MAE. These results suggest that the MSR method is better than the comparison method.

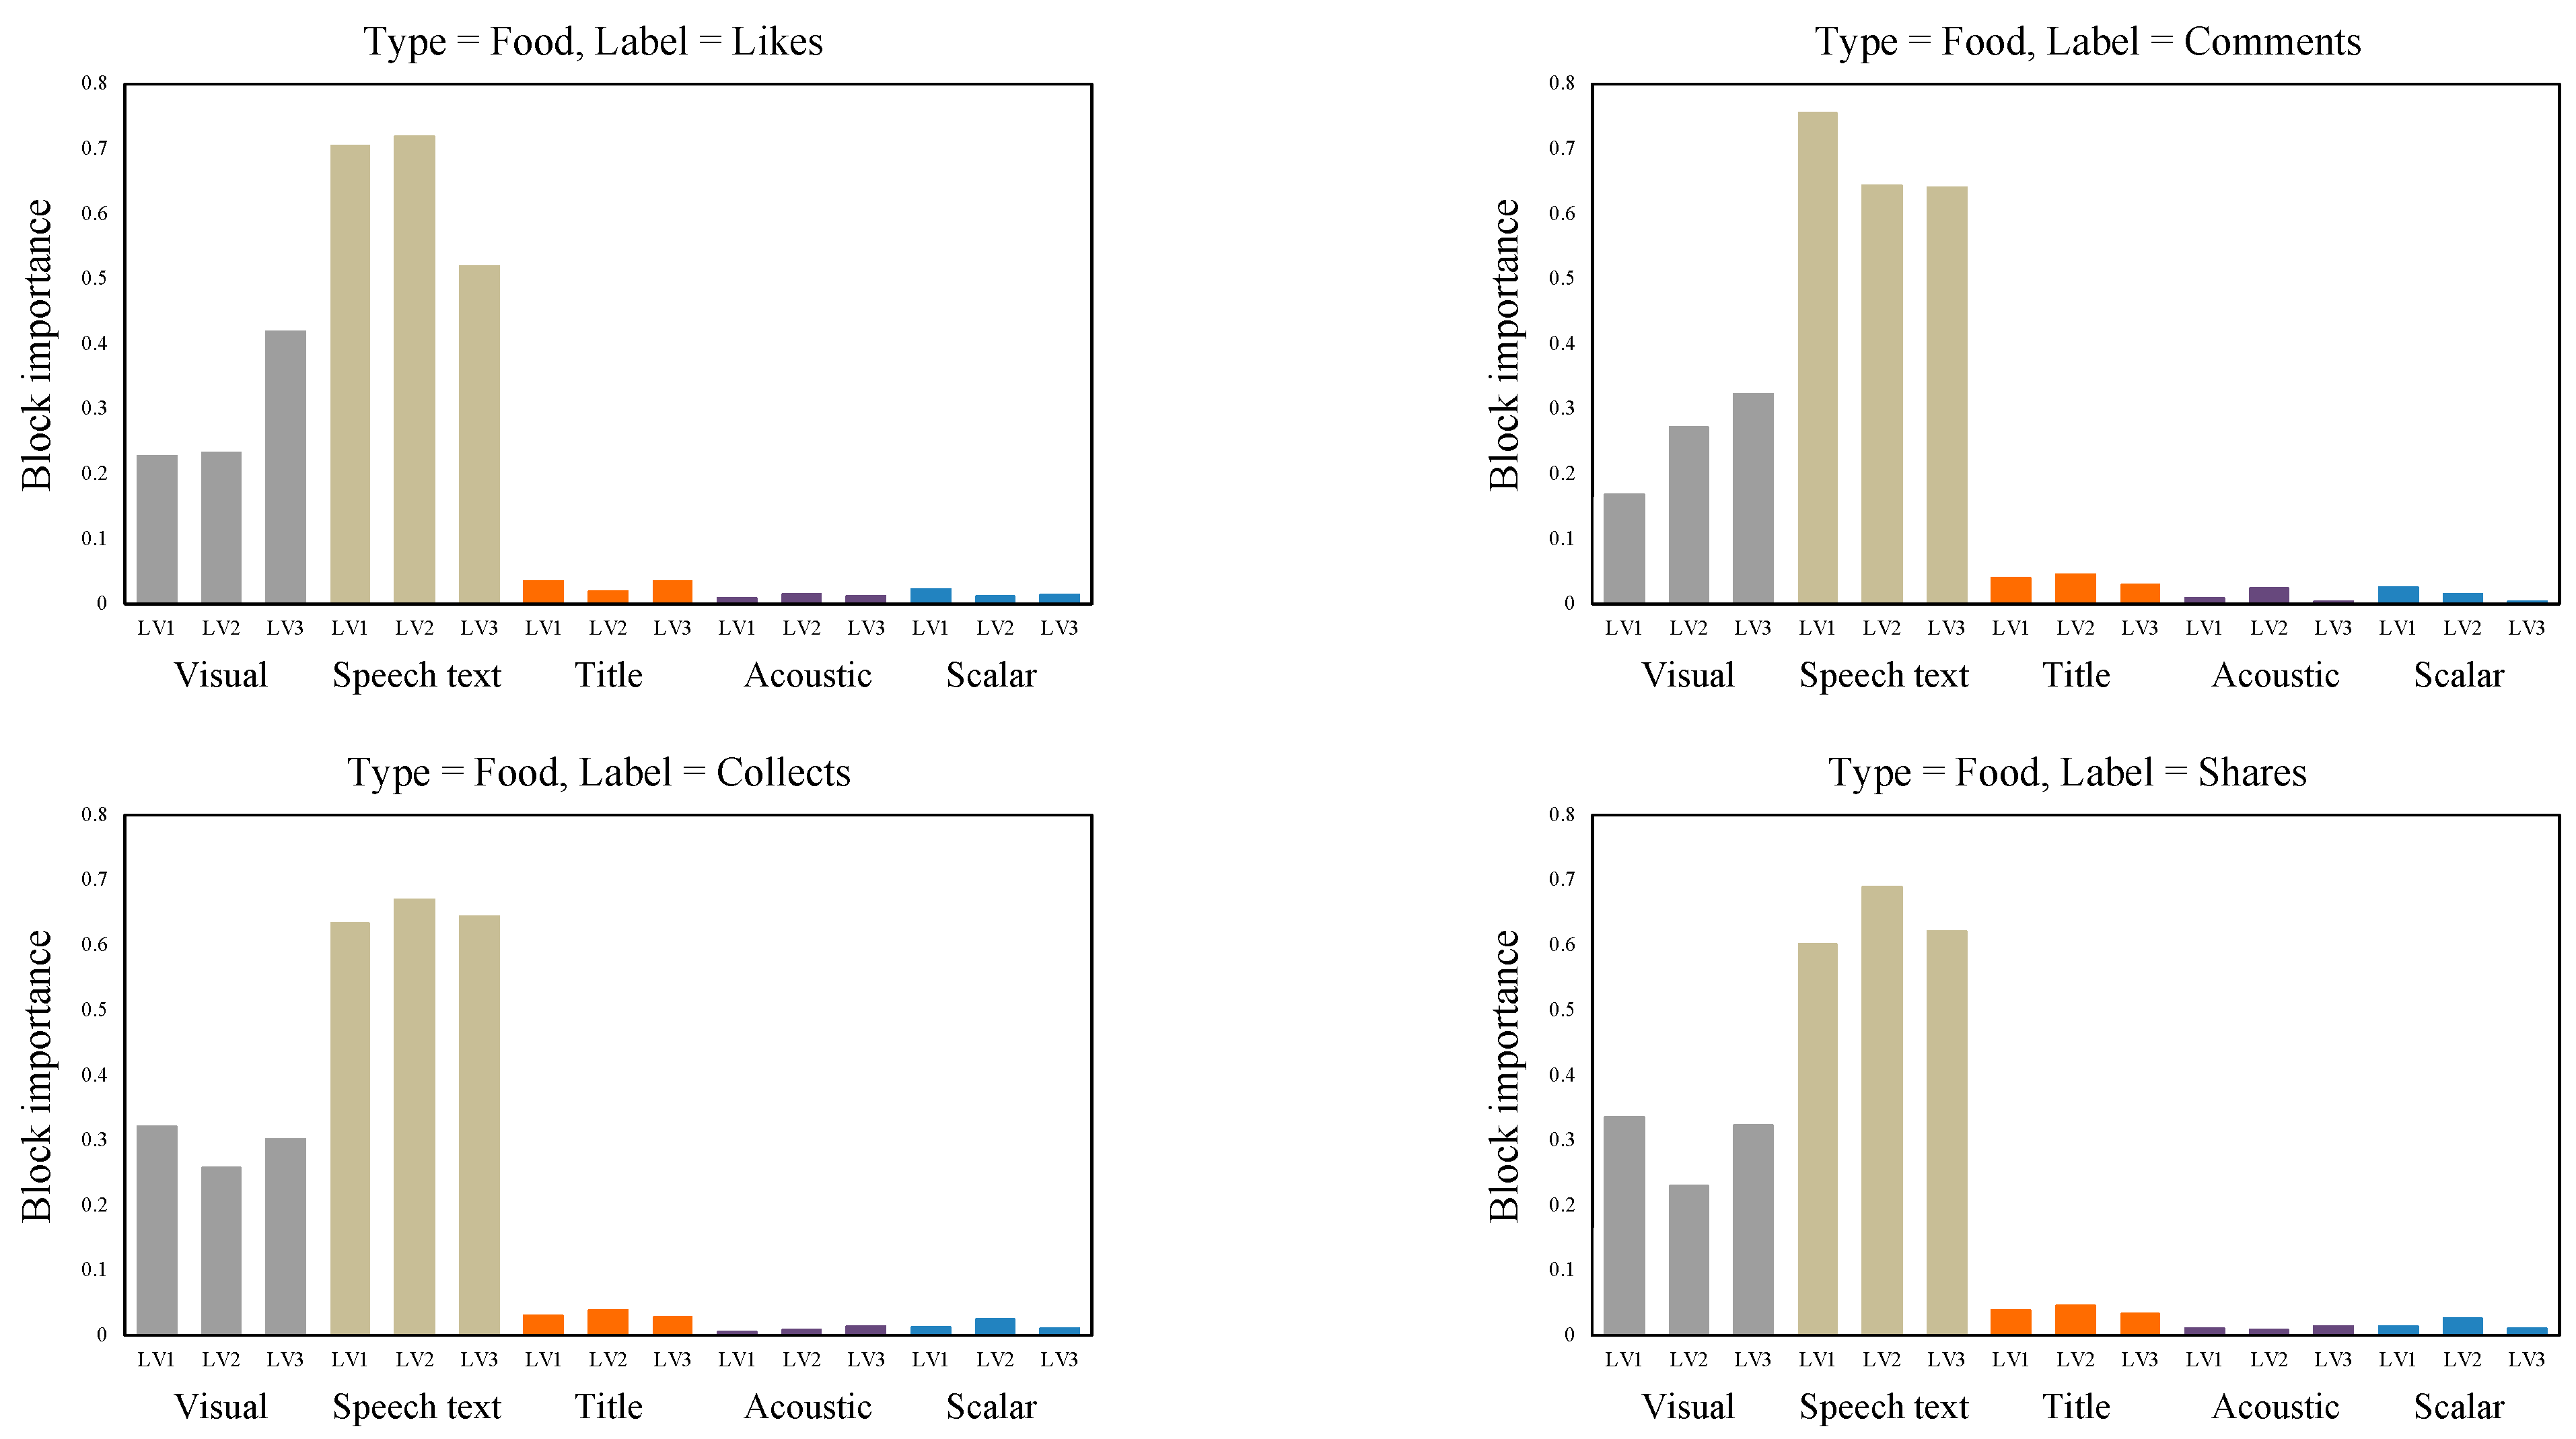
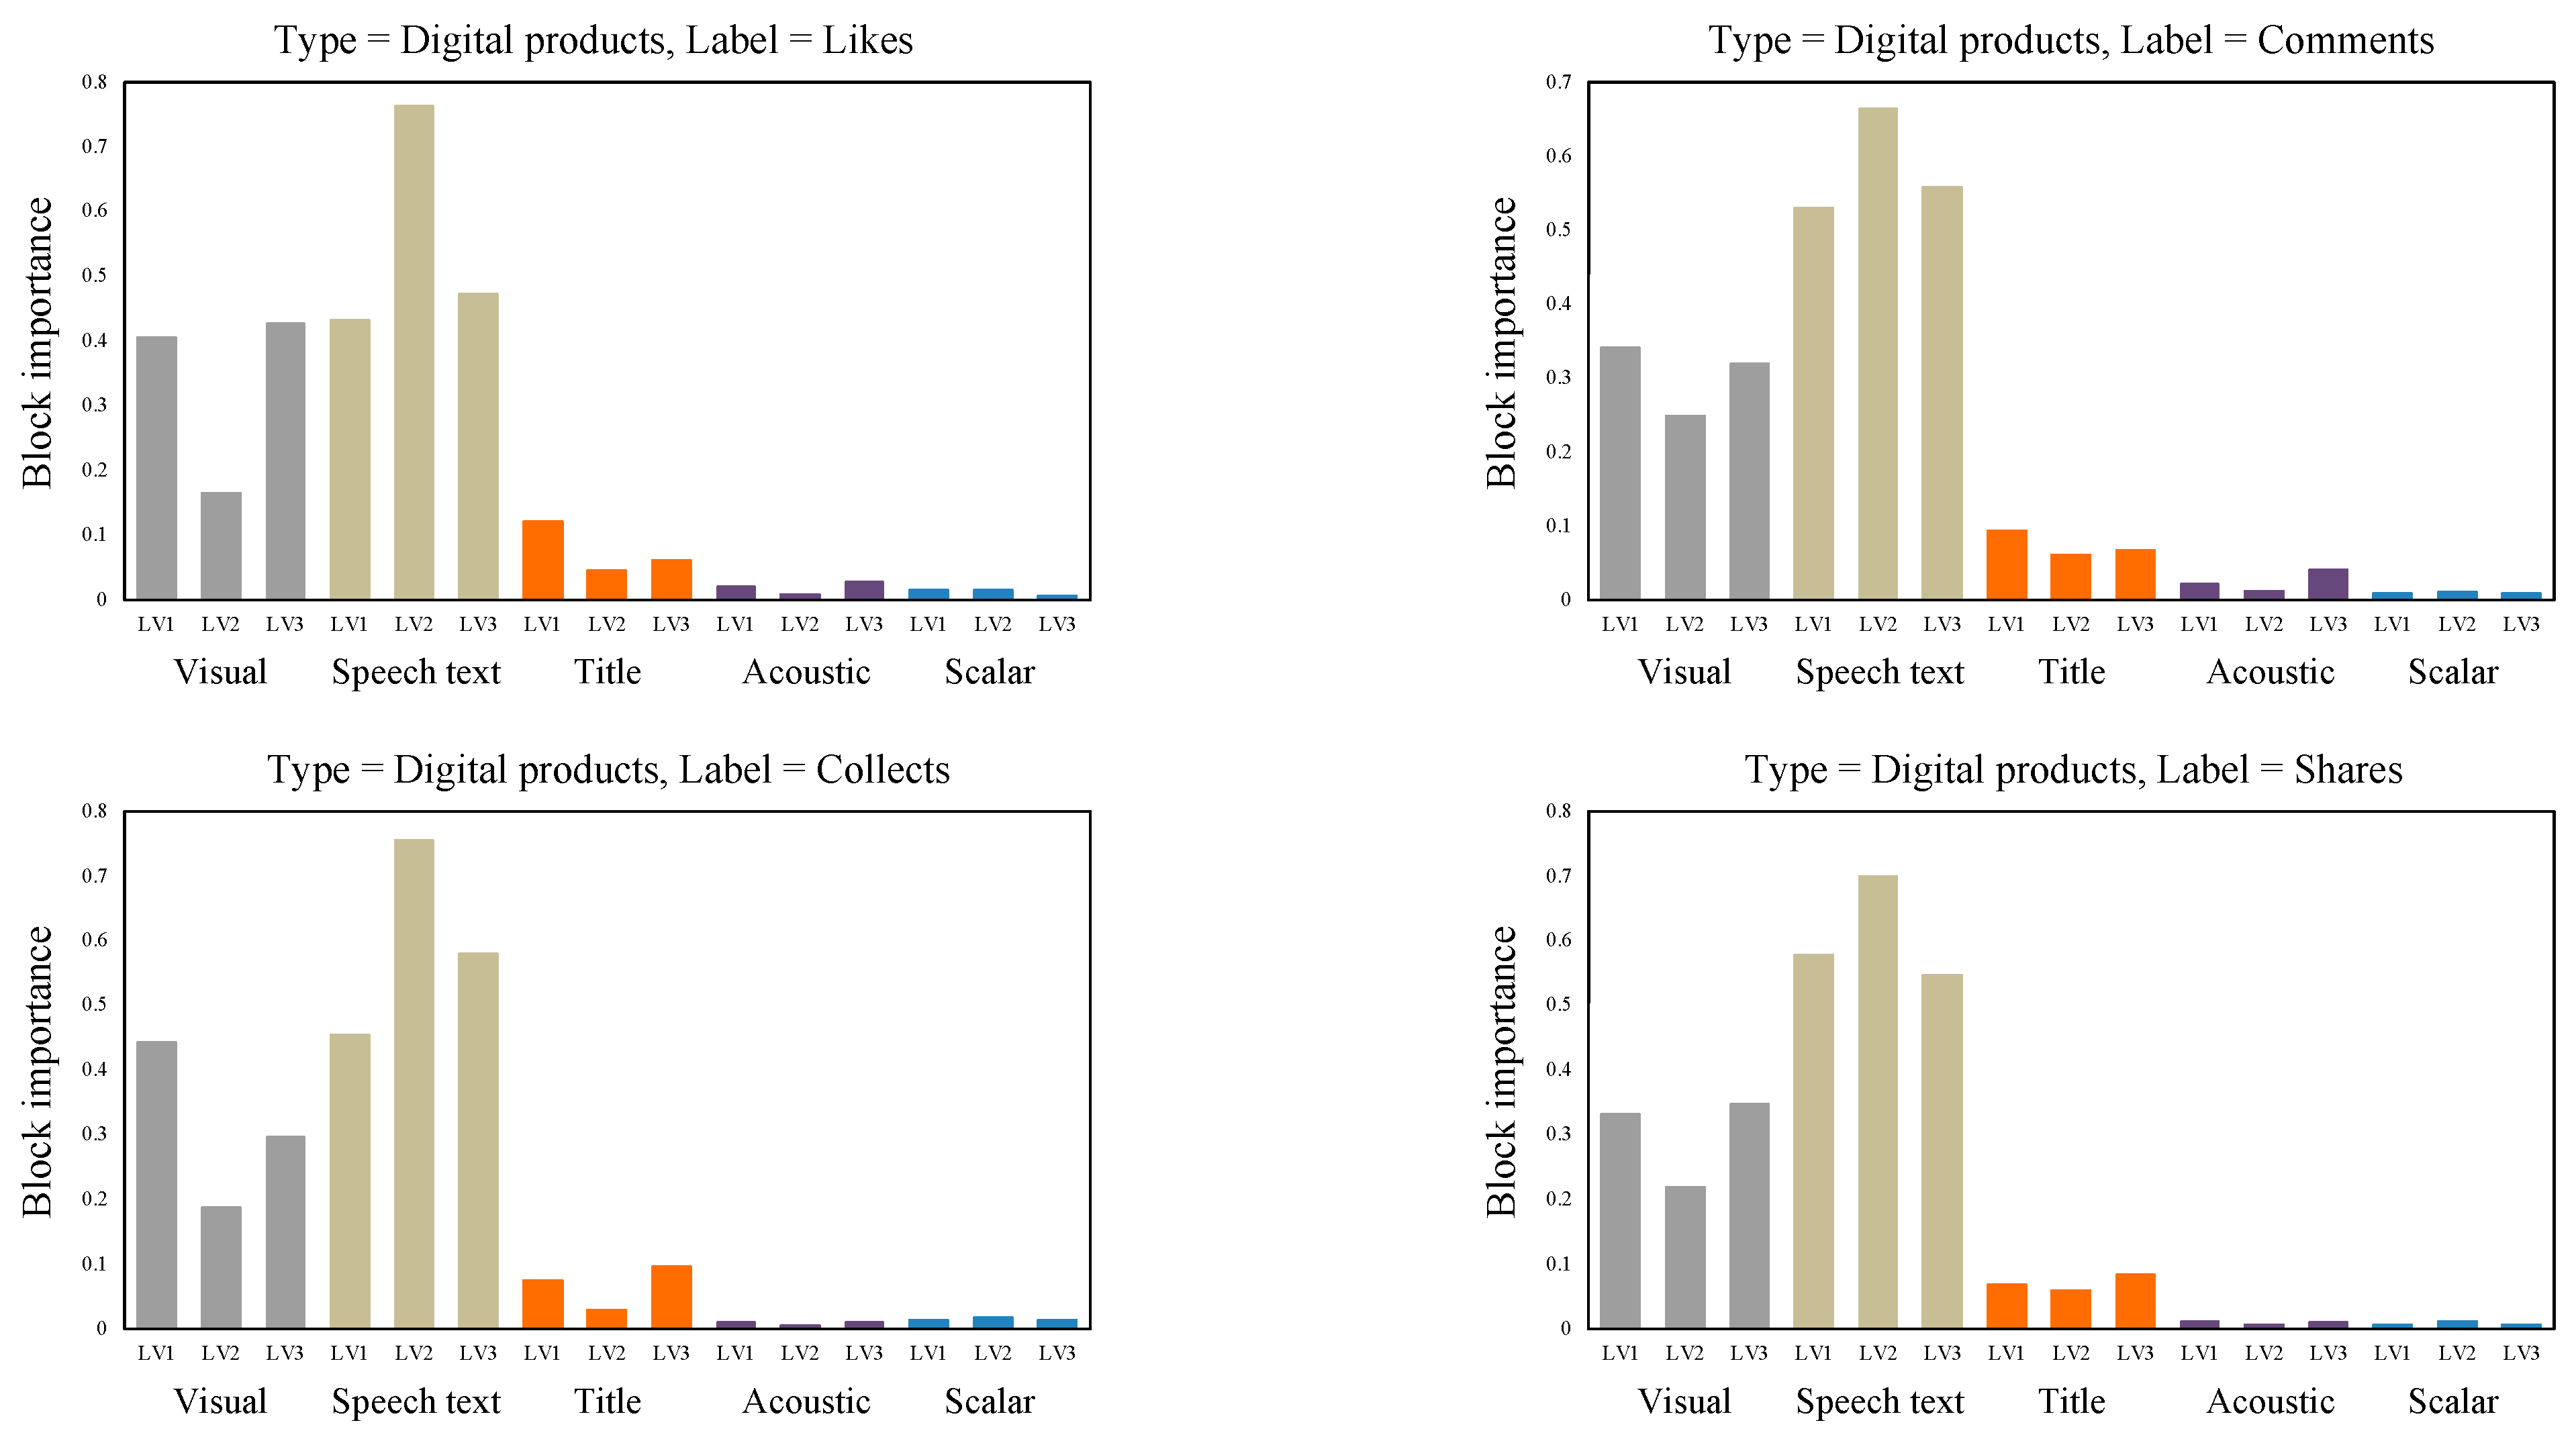
4.2. The Result of MBPLS

Figure 4 shows the explained variance of consumer engagement indicators in each latent variable (LV). The statistical principle of MBPLS in capturing the variability information of data is similar to that of principal component analysis (PCA). The higher the ranking of LVs, the better they can explain the variance generated by consumer engagement indicators. Based on the attenuation situation shown in Figure 4, when LV exceeds 3, the value of the interpretive variance is less than 0.1. Thus, we reserve the first three LVs for further analysis.
In the analysis of short video advertising variables, we focused on the importance of individual consumer engagement indicators. Figure 5 and Figure 6 show the block importance (BIP) values of the three LVs for food and digital products. As shown in Figure 5 and Figure 6, the speech text features and visual features of the two types of videos are the most important. However, the importance of speech text features and visual features to food is slightly higher than that to digital products. This may be because, in short video advertisements, visual appeal and descriptive language can directly convey the characteristics of food, whereas the functions and features of digital products require more detailed demonstrations and explanations, and consumers often rely on more information to evaluate digital products [16]. Indeed, the cognitive processes consumers undergo when perceiving these two product types diverge, and numerous studies have confirmed the moderating effect of product type in short video advertisements [16,18]. Nevertheless, this particular aspect does not constitute the primary focus of our study.
Due to the fact that we control the gap time of videos to be greater than 50 days, the proportion of scalar features in BIP is very small, which indirectly verifies the rationality of our handling of control variables. Compared to food, the importance of digital product titles for consumer engagement is higher, and the importance of acoustic features for comments is also higher. Furthermore, the BIP of speech text features is greater than that of visual features in each label of consumer engagement indicator variables, indicating that in short video advertisements, hearing is more important than vision.

5. Discussion

The primary goal of this study was to identify the key factors influencing consumer engagement in short video advertisements for experience and search products. To this end, we designed a multimodal analysis framework that extracts visual, speech text, acoustic, title, and scalar features from short video advertisements through machine learning and deep learning methods. Considering that the extracted feature dimensions were too high, we proposed the MSR method to optimize the problem of l 1 -regularization in variable selection. The MSR method reduced the computational complexity and improved the accuracy of the model through high-performance dimensionality reduction. To intuitively display the importance of different features, we visualized the results of the block importance analysis using the MBPLS regression model.
In order to better fit the MBPLS regression model, when using the MSR method, we designed a parameter selection rule that aims to retain more important variables while keeping the representation error as low as possible, and we kept around 40% of the variables in each block. In addition, when using l 1 -regularization to screen variables, the features with high dimensionality in visual and speech text variables, l 1 -regularization almost removed all variables under each consumer engagement indicator. Therefore, the result of l 1 -regularization was not listed in the comparison method, displayed in Table 4. Our MSR method solved the problem of l 1 -regularization in ultra-high-dimensional feature screening. Our method yields better results than random forest regression, decision tree regression, principal component analysis, and correlation analysis, demonstrating its robustness further.
Our study found that speech text and visual features were the key factors influencing consumer engagement behaviors. In short video advertisements, the speech text conveys core product information, such as features, advantages, and promotional content, clearly and accurately, helping consumers quickly understand and reduces misunderstandings. At the same time, by telling stories, citing data, and asking questions, the speech text enhances the persuasiveness of the advertisement, making consumers more likely to generate purchase intentions [52]. On the other hand, the visual features of short video advertisements can capture consumers’ attention immediately. This visual impact helps the advertisement stand out among numerous pieces of information, increasing its exposure rate and memorability. Furthermore, visual features can also touch consumers’ emotions, enhancing the persuasiveness and appeal of the advertisement [7,20]. Content-related research in the field of short video marketing should prioritize extracting information from these two features, which can increase the persuasiveness of the research results.
We also found that, although not as important as the speech text and visual features, title features are more significant than acoustic features. In short video advertisements, the title is often a brief summary of the video content, helping users quickly understand the theme and main points of the video [6]. This aids consumers in judging whether the video aligns with their interests and needs. However, our study merely ranks the importance of multimodal features in short video advertisements and provides a theoretical basis for related research. Features that rank lower are merely relatively less important. In fact, according to the findings of Xiao et al. [7], acoustic features such as zero-crossing rate and spectral centroid have a significant impact on consumer engagement behavior. Our results suggest that relevant researchers should prioritize visual and speech text features in short video advertisements.
Lu et al. [8] analyzed consumer engagement in short videos, emphasizing the significance of visual and title features. However, they ignored the speech text features. Because multimedia relies heavily on audiovisual elements, the significance of speech text features in short videos cannot be ignored. In fact, our results confirm that speech text features are significantly more important for consumer engagement than title features. On the other hand, for acoustic features, we added spectral bandwidth and RMS energy based on the research by Lu et al. [8]. These two indicators can effectively measure the effective frequency range and acoustic energy of the spectrum. Although some important acoustic features have been added, they are generally far less significant than speech text and visual features as a whole.
Furthermore, in contrast to the conclusion of Lu et al. [8] on entertaining short videos, our results showed that visual and speech text are significantly more important for consumer engagement in short video advertisements for search and experience products. These findings provide new insights into the multimodal analysis of short videos. Additionally, title features were more important than acoustic and scalar features, which might be attributed to viewers’ propensity to peruse short videos with a more hedonistic and leisurely mindset, paying closer attention to the audio and visual content of the advertisements.

5.1. Theoretical Implications

This study has several theoretical implications.
Firstly, this study offers a fresh perspective on short video advertisements by analyzing them through a multimodal lens, thereby enriching the existing literature on social media advertising. While prior research on short videos has primarily centered around social and commercial attributes, leveraging scalar features, unstructured text data, or questionnaires, multimodality research has largely been confined to sentiment analysis and classification tasks in specific scenarios and datasets [53]. Notably, there is a dearth of studies exploring the multimodal features of short video advertisements. Our work stands as the first to quantitatively identify the crucial factors that drive consumer engagement in short video advertisements from a multimodal perspective, providing valuable theoretical insights to researchers and contributing to the broader understanding of social media advertising.
Secondly, based on the content attributes of short video advertisements, this study considers product types, analyzes experience and search products, respectively, and explores the impact of visual features, speech text features, acoustic features, and title features on consumer engagement. Results show that visual features and speech text features are the most important, and the conclusions for the two product types are consistent. Subsequent research can focus on these two points. From this perspective, this work has made a certain contribution to consumer engagement behavior.
Finally, this study can address the challenges of processing multi-dimensional patterns in social media. From the perspective of short video advertising content, the short videos posted by influencers encompass both textual data (speech transcripts and headline text data) aimed at attracting consumers and non-textual data (visual and auditory data) [54]. Our data analysis method can reduce the dimensionality of various modal features and explore the relationship between multimodal features and consumer engagement. Our multimodal analysis framework is also applicable to the study of user behavior in other social media contexts. Specifically, our framework comprehensively extracts multiple modal features of short video advertisements, and the proposed dimensionality reduction method requires less computation and exhibits higher computational efficiency. In the study of patterns in social media, it is suitable for classification and regression tasks.

5.2. Practical Implications

From a marketing perspective, this study has practical significance for both short video sellers and platform operations. Short video advertisements are information streams based on an audiovisual stimulus, recommended by consumer preferences. When releasing short video advertisements, sellers should consider video display, text introduction, tone/music, title, length, speaking speed, etc. Our results show that whether it is search products or experience products, the speech text and visual features of advertisements are the most important. Since short video users typically make judgments about their preference for the current content in extremely short periods of time [7], sellers need to capture the consumer’s attention through visual and speech text elements at the beginning of short video advertisements. When the consumers have aroused interest at the beginning of the short video, they are more likely to engage with likes, comments, collects, and shares. Although title features are not as important as visual and speech text features, they are also more important than acoustic and scalar features. On the TikTok platform, titles are partially obscured due to length and so, sellers should keep video titles brief.
For platform operations, our multimodal analysis framework extracts four different types of short video features. For the extracted high-dimension features, we propose the MSR method to screen variables and use the regression model MBPLS to achieve BIP analysis of blocks. Short video platforms analyze users’ habits of watching short videos and label them according to their interests. At the same time, the labels of each uploaded video are also calculated, and then the tags of the video are mapped to users with the same tags [1]. Technically speaking, the map methods are based on the deep features of short videos. Our work can provide a certain reference for the platform. Our feature extraction is quite extensive and can supply positioning suggestions based on big data algorithms, which can promote short video marketing.

6. Conclusions and Future Work

The aim of this study was to delve into the intricate relationship between the multimodal features of short video advertisements and their impact on consumer engagement. The multimodal analysis results indicate that visual and speech text features are the key factors influencing consumer engagement, providing theoretical support for subsequent research. To the best of our knowledge, the features extracted in our analysis represent the most comprehensive set currently available for short video advertisements. To gain insights into the significance of various features, we leverage MBPLS as a regression model. This approach enables us to assess the influence of different types of features on consumer engagement through the calculation of BIP values. By employing variable screening and multiblock regression analysis, our framework uncovers the criticality of different blocks within the multimodal feature set.
This study has several limitations, including potential future research directions. Firstly, our text features only consider speech text and titles, whereas short videos actually contain other forms of text (e.g., subtitles, on-screen text). However, these forms of text appear less frequently in short video advertisements. Future research could collect more data on short video advertisements to explore the importance of these forms of text. Secondly, according to our results, the speech text and visual features of short video advertisements have the most important impact on consumer engagement. Our work has only considered the deep features, which are essentially a black box. Further refining of interpretable speech text and visual features is worth exploring, such as calculating the creativity, narrative, color complexity, and psychological factors of short video advertisements [55]. Thirdly, although the MSP and MBPLS methods in our framework perform well in data analysis, this process can be further refined, such as considering the continuity of short videos and studying the influencing factors of consumer engagement in short video advertisements through time series analysis methods, which may lead to new discoveries.

Author Contributions

Conceptualization, Z.Z. and L.Z.; methodology, Z.Z.; software, Z.Z.; validation, Z.Z.; formal analysis, Z.Z.; investigation, Z.Z. and L.Z.; resources, Z.Z. and L.Z.; data curation, Z.Z.; writing—original draft preparation, Z.Z.; writing—review and editing, L.Z.; visualization, Z.Z.; supervision, L.Z.; project administration, Z.Z.; funding acquisition, Z.Z. All authors have read and agreed to the published version of the manuscript.

Funding

This research was funded by the National Natural Science Foundation of China (Grant No. 71874126) awarded to Liyi Zhang.

Institutional Review Board Statement

Not applicable.

Informed Consent Statement

Not applicable.

Data Availability Statement

Data are available on request from the first author.

Conflicts of Interest

The authors declare no conflicts of interest.

Appendix A

Figure A1. Speech text feature screening results of food.
Jtaer 20 00054 g0a1
Figure A2. Speech text feature screening results of digital products.
Jtaer 20 00054 g0a2
Figure A3. Title feature screening results of food.
Jtaer 20 00054 g0a3
Figure A4. Title feature screening results of digital products.
Jtaer 20 00054 g0a4
Figure A5. Acoustic feature screening results of food.
Jtaer 20 00054 g0a5
Figure A6. Acoustic feature screening results of digital products.
Jtaer 20 00054 g0a6

References

  1. Yuan, L.; Xia, H.; Ye, Q. The effect of advertising strategies on a short video platform: Evidence from TikTok. Ind. Manag. Data Syst. 2022, 122, 1956–1974. [Google Scholar] [CrossRef]
  2. QuestMobile. Internet Advertising Semi-Annual Report in 2021. 2024. Available online: https://www.questmobile.com.cn/research/report-new/169 (accessed on 1 July 2024).
  3. Li, W.; Jiang, M.; Zhan, W. Why advertise on short video platforms? optimizing online advertising using advertisement quality. J. Theor. Appl. Electron. Commer. Res. 2022, 17, 1057–1074. [Google Scholar] [CrossRef]
  4. Molinillo, S.; Anaya-sánchez, R.; Liébana-cabanillas, F. Computers in human behavior analyzing the effect of social support and community factors on customer engagement and its impact on loyalty behaviors toward social commerce websites. Comput. Hum. Behav. 2019, 108, 105980. [Google Scholar]
  5. Pansari, A.; Kumar, V. Customer engagement: The construct, antecedents, and consequences. J. Acad. Market. Sci. 2017, 45, 294–311. [Google Scholar]
  6. Wei, Z.; Zhang, M.; Qiao, T. Effect of personal branding stereotypes on user engagement on short video platforms. J. Retail. Consum. Serv. 2022, 69, 103121. [Google Scholar]
  7. Xiao, Q.; Huang, W.; Qu, L.; Li, X. The impact of multimodal information features of short sales videos on consumer engagement behavior: A multi-method approach. J. Retail. Consum. Serv. 2025, 82, 104136. [Google Scholar]
  8. Lu, Y.; Duan, Y. Online content-based sequential recommendation considering multimodal contrastive representation and dynamic preferences. Neural Comput. Appl. 2024, 36, 7085–7103. [Google Scholar]
  9. Lu, S.; Yu, M.; Wang, H. What matters for short videos’ user engagement: A multiblock model with variable screening. Expert Syst. Appl. 2023, 218, 119452. [Google Scholar]
  10. Hochreiter, S.; Schmidhuber, J. Long short-term memory. Neural Comput. 1997, 9, 1735–1780. [Google Scholar] [CrossRef]
  11. Simonyan, K.; Zisserman, A. Very deep convolutional networks for large-scale image recognition. arXiv 2014, arXiv:1409.1556. [Google Scholar]
  12. Peters, M.E.; Neumann, M.; Iyyer, M.; Gardner, M.; Zettlemoyer, L. Deep contextualized word representations. arXiv 2018, arXiv:1802.05365. [Google Scholar]
  13. Devlin, J.; Chang, M.; Lee, K.; Toutanova, K. Bert: Pre-training of deep bidirectional transformers for language understanding. arXiv 2018, arXiv:1810.04805. [Google Scholar]
  14. Westerhuis, J.A.; Kourti, T.; MacGregor, J.F. Analysis of multiblock and hierarchical PCA and PLS models. J. Chemometr. 1998, 12, 301–321. [Google Scholar] [CrossRef]
  15. Putri, N.; Prasetya, Y.; Handayani, P.W.; Fitriani, H. TikTok shop: How trust and privacy influence generation Z’s purchasing behaviors. Cogent Soc. Sci. 2024, 10, 2292759. [Google Scholar] [CrossRef]
  16. Xiao, L.; Li, X.; Zhang, Y. Exploring the factors influencing consumer engagement behavior regarding short-form video advertising: A big data perspective. J. Retail. Consum. Serv. 2023, 70, 103170. [Google Scholar]
  17. Jiang, W.; Chen, H. Can short videos work? The effects of use and gratification and social presence on purchase intention: Examining the mediating role of digital dependency. J. Theor. Appl. Electron. Commer. Res. 2025, 20, 5. [Google Scholar] [CrossRef]
  18. Zhang, Z.; Zhang, L. How do online celebrities attract consumers? An EEG study on consumers’ neural engagement in short video advertising. Electron. Commer. Res. 2025, 1–27. [Google Scholar] [CrossRef]
  19. Haq, M.D.; Chiu, C.M. Boosting online user engagement with short video endorsement content on TikTok via the image transfer mechanism. Electron. Commer. Res. Appl. 2024, 64, 101379. [Google Scholar]
  20. Tan, Y.; Geng, S.; Chen, L.; Wu, L. How doctor image features engage health science short video viewers? Investigating the age and gender bias. Ind. Manag. Data Syst. 2023, 123, 2319–2348. [Google Scholar] [CrossRef]
  21. Chen, Q.; Min, C.; Zhang, W.; Ma, X.; Evans, R. Factors driving citizen engagement with government TikTok accounts during the covid-19 pandemic: Model development and analysis. J. Med. Internet Res. 2021, 23, e21463. [Google Scholar] [CrossRef]
  22. Zhang, C.; Zheng, H.; Wang, Q. Driving factors and moderating effects behind citizen engagement with mobile short-form videos. IEEE Access 2022, 10, 40999–41009. [Google Scholar]
  23. Dong, X.; Liu, H.; Xi, N.; Liao, J.; Yang, Z. Short video marketing: What, when and how short-branded videos facilitate consumer engagement. Internet Res. 2024, 34, 1104–1128. [Google Scholar]
  24. Van, D.J.; Lemon, K.N.; Mittal, V.; Nass, S.; Pick, D.; Pirner, P.; Verhoef, P.C. Customer engagement behavior: Theoretical foundations and research directions. J. Serv. Res. 2010, 13, 253–266. [Google Scholar]
  25. Islam, J.U.; Hollebeek, L.D.; Rahman, Z.; Khan, I.; Rasool, A. Customer engagement in the service context: An empirical investigation of the construct, its antecedents and consequences. J. Retail. Consum. Serv. 2019, 50, 277–285. [Google Scholar] [CrossRef]
  26. Fei, M.; Tan, H.; Peng, X.; Wang, Q.; Wang, L. Promoting or attenuating? An eye-tracking study on the role of social cues in e-commerce livestreaming. Decis. Support Syst. 2021, 142, 113466. [Google Scholar] [CrossRef]
  27. Jaakkola, E.; Alexander, M. The role of customer engagement behavior in value co-creation: A service system perspective. J. Serv. Res. 2014, 17, 247–261. [Google Scholar]
  28. Labrecque, L.I.; Swani, K.; Stephen, A.T. The impact of pronoun choices on consumer engagement actions: Exploring top global brands’ social media communications. Psychol. Market. 2020, 37, 796–814. [Google Scholar]
  29. Fu, Z.; Wang, K.; Wang, J.; Zhu, Y. Predicting sales lift of influencer-generated short video advertisements: A ladder attention-based multimodal time series forecasting framework. In Proceedings of the Hawaii International Conference on System Sciences 2024, Honolulu, HI, USA, 3–7 January 2024; pp. 2843–2852. [Google Scholar]
  30. Guo, Y.; Ban, C.; Yang, J.; Goh, K.Y.; Liu, X.; Peng, X.; Li, X. Analyzing and predicting consumer response to short videos in e-commerce. ACM Trans. Manag. Inf. Syst. 2024, 15, 17. [Google Scholar]
  31. Yang, J.; Zhang, J.; Zhang, Y. Engagement that sells: Influencer video advertising on TikTok. Mark. Sci. 2024, 44, 247–267. [Google Scholar]
  32. Wang, X.; Zhang, Z.; Jiang, Q. The effectiveness of human vs. AI voice-over in short video advertisements: A cognitive load theory perspective. J. Retail. Consum. Serv. 2024, 81, 104005. [Google Scholar]
  33. Mukherjee, S.; Bala, P.K. Detecting sarcasm in customer tweets: An NLP based approach. Ind. Manag. Data Syst. 2017, 117, 1109–1126. [Google Scholar]
  34. Yu, F.; Liu, Y. A sparse feature extraction method based on improved quantum evolutionary algorith. Trans. Beijing Inst. Technol. 2020, 40, 512–518. (In Chinese) [Google Scholar]
  35. Tian, Y.; Wang, H. Image edge feature extraction research based on quantum kernel clustering algorithm. Acta Metrol. Sin. 2016, 37, 582–586. (In Chinese) [Google Scholar]
  36. Sun, Y.; Wang, S.; Li, Y.; Feng, S.; Wu, H. ERNIE: Enhanced Representation through Knowledge Integration. arXiv 2019, arXiv:1904.09223. [Google Scholar]
  37. Hsieh, Y.H.; Zeng, X. Sentiment analysis: An ERNIE-BiLSTM approach to bullet screen comments. Sensors 2022, 22, 5233. [Google Scholar] [CrossRef]
  38. Hu, A.; Flaxman, S.R. Multimodal sentiment analysis to explore the structure of emotions. In Proceedings of the 24th ACM SIGKDD International Conference on Knowledge Discovery & Data Mining, London, UK, 19–23 August 2018; pp. 350–358. [Google Scholar]
  39. Gallo, I.; Calefati, A.; Nawaz, S.; Janjua, M.K. Image and encoded text fusion for multimodal classification. In Proceedings of the 2018 IEEE Digital Image Computing: Techniques and Applications (DICTA), Canberra, Australia, 10–13 December 2018; pp. 1–7. [Google Scholar]
  40. Zhang, X.; Liu, J.; Cole, M.; Belkin, N. Predicting users’ domain knowledge in information retrieval using multiple regression analysis of search behaviors. J. Assoc. Inf. Sci. Technol. 2015, 66, 980–1000. [Google Scholar]
  41. Zhao, Z.; Liu, H. Spectral feature selection for supervised and unsupervised learning. In Proceedings of the 24th International Conference on Machine Learning, Corvalis, OR, USA, 20–24 June 2007; pp. 1151–1157. [Google Scholar]
  42. Li, Z.; Yang, Y.; Liu, J.; Zhou, X.; Lu, H. Unsupervised feature selection using non-negative spectral analysis. In Proceedings of the AAAI Conference on Artificial Intelligence, Toronto, ON, Canada, 22–26 July 2012; pp. 1026–1032. [Google Scholar]
  43. Shi, L.; Du, L.; Shen, Y. Robust spectral learning for unsupervised feature selection. In Proceedings of the 2014 IEEE International Conference on Data Mining, Shenzhen, China, 14–17 December 2014; pp. 977–982. [Google Scholar]
  44. Zhang, Y.; Li, H.; Wang, Q.; Peng, C. A filter-based bare-bone particle swarm optimization algorithm for unsupervised feature selection. Appl. Intell. 2019, 49, 2889–2898. [Google Scholar]
  45. Nelson, P. Information and consumer behavior. J. Polit. Econ. 1970, 72, 311–329. [Google Scholar] [CrossRef]
  46. Jimenez, F.R.; Mendoza, N.A. Too popular to ignore: The influence of online reviews on purchase intentions of search and experience products. J. Interact. Mark. 2013, 27, 226–235. [Google Scholar]
  47. Ouzir, M.; Lamrani, H.C.; Bradley, R.L.; El-Moudden, I. Neuromarketing and decision-making: Classification of consumer preferences based on changes analysis in the EEG signal of brain regions. Biomed. Signal Process. Control 2024, 87, 105469. [Google Scholar]
  48. Wright, S.J. Coordinate descent algorithms. Math. Program. 2015, 151, 3–34. [Google Scholar] [CrossRef]
  49. Bougeard, S.; Qannari, E.M.; Lupo, C.; Hanafi, M. From multiblock partial least squares to multiblock redundancy analysis, a continuum approach. Informatica 2011, 22, 11–26. [Google Scholar] [CrossRef]
  50. Syeda, W.T.; Wannan, C.M.J.; Merritt, A.H.; Raghava, J.M.; Jayaram, M.; Velakoulis, D.; Kristensen, T.D.; Soldatos, R.F.; Tonissen, S.; Thomas, N.; et al. Cortico-cognition coupling in treatment resistant schizophrenia. NeuroImage Clin. 2022, 35, 103064. [Google Scholar] [CrossRef]
  51. Strani, L.; Vitale, R.; Tanzilli, D.; Bonacini, F.; Perolo, A.; Mantovani, E.; Ferrando, A.; Cocchi, M. A Multiblock approach to fuse process and near-infrared sensors for online prediction of polymer properties. Sensors 2022, 22, 1436. [Google Scholar] [CrossRef]
  52. Wang, X.; Lai, I.K.W.; Lu, Y.; Liu, X. Narrative or non-narrative? The effects of short video content structure on mental simulation and resort brand attitude. J. Hosp. Market. Manag. 2023, 32, 593–614. [Google Scholar] [CrossRef]
  53. Yu, X.; Zhang, Y.; Zhang, X. The short video usage motivation and behavior of middle-aged and old users. Libr. Hi Tech. 2024, 42, 624–641. [Google Scholar] [CrossRef]
  54. Erevelles, S.; Fukawa, N.; Swayne, L. Big data consumer analytics and the transformation of marketing. J. Bus. Res. 2016, 69, 897–904. [Google Scholar] [CrossRef]
  55. Vamsi, K.K.; Christian, H.; Brady, T.H. Standing out from the crowd: When and why color complexity in social media images increases user engagement. Int. J. Res. Mark. 2024, 41, 174–193. [Google Scholar]
Figure 1. The flowchart of our framework.
Jtaer 20 00054 g001
Figure 2. Visual feature screening results of food.
Jtaer 20 00054 g002
Figure 3. Visual feature screening results of digital products.
Jtaer 20 00054 g003
Figure 4. The explanatory variance for each LV of consumer engagement.
Jtaer 20 00054 g004
Figure 5. The BIP values of each block in food short video advertisements.
Jtaer 20 00054 g005
Figure 6. The BIP values of each block in digital products short video advertisements.
Jtaer 20 00054 g006
Table 1. Extracted features of short video advertisements.
Modality BlocksFeaturesItemDescriptionDimension
Block 1VisualBeginning imageFeatures of the first 10 s of a short video frame1280
Block 2AcousticZero-crossing rateThe rate of symbol change in acoustic signals1
Spectral centroidThe position of the spectral centroid1
Spectrum roll-offMeasurement of the shape of acoustic signals1
Chromaticity frequencyThe 12 different semitones or chromatics in music1
Spectral bandwidthThe effective range of the frequency spectrum1
RMS energyThe energy or intensity level of the sound signal within the selected time period1
MFCCReflecting the nonlinear perception features of the human ear to sound frequencies20
Block 3Speech textAuthor’s descriptionSpeech text of short video authors768
Block 4TitleVideo titleThe average value of word vectors of titles100
Block 5ScalarDurationNumber of seconds of a short video advertisement1
SpeedThe speed of voice playback1
Title lengthWord count of title1
Time gapThe released days of the short videos1
Product priceThe price of the products1
Table 2. Statistical distribution of consumer engagement.
StatisticLikesCommentsCollectsShares
Skewness6.1222.245.746.87
Kurtosis46.14542.5740.1967.81
Max1,069,000690,000266,000302,000
Min17515847
Mean44,581.633229.1311,023.748164.47
Std96,193.2526,367.0826,193.6720,462.20
Table 3. Parameter values of each feature.
Feature TypeParameter (Food)Parameter (Digital Products)
λ ρ λ ρ
visual0.50.50.50.75
speech text0.50.250.50.5
title0.50.750.50.5
acoustic10.750.50.75
Table 4. Number of variables retained by each block under different parameters.
Feature TypeFoodDigital Products
LikesCommentsCollectsSharesLikesCommentsCollectsShares
visual500479482477301270262310
speech text436436395410240228208233
title4850535858574859
acoustic1414121314181318
Table 5. Analysis of MBPLS model prediction results.
MethodIndexFoodDigital Products
LikesCommentsCollectsSharesLikesCommentsCollectsShares
MSRR0.6850.6160.7400.7120.7180.6150.6540.684
MAE0.1120.0870.0650.1040.0940.1050.1010.100
MSE0.0190.0120.0070.0170.0140.0170.0170.017
RFRR0.5930.5040.6220.6570.4590.3830.5400.532
MAE0.0870.0930.0730.0890.0980.0820.0760.085
MSE0.0120.0140.0090.0130.0150.0110.0090.012
t-SNER0.6520.5950.6110.6280.4540.3610.5130.531
MAE0.0850.0890.0730.0920.1030.0890.0880.089
MSE0.0110.0130.0100.0120.0150.0130.0120.013
PCAR0.5420.4600.5590.5540.2860.2270.3740.351
MAE0.0900.0940.0780.1020.1050.0790.0870.097
MSE0.0130.0150.0100.0150.0170.0110.0110.015
CAR0.5600.5070.5920.6260.0490.4640.5540.518
MAE0.0920.0900.0750.0930.0940.0750.0740.087
MSE0.0130.0140.0090.0140.0140.0090.0090.013
AllR0.4160.3370.5290.5890.3620.2970.2720.340
MAE0.1480.1130.0820.1180.1310.1270.1370.131
MSE0.0330.0200.0110.0220.0270.0280.0300.028
Disclaimer/Publisher’s Note: The statements, opinions and data contained in all publications are solely those of the individual author(s) and contributor(s) and not of MDPI and/or the editor(s). MDPI and/or the editor(s) disclaim responsibility for any injury to people or property resulting from any ideas, methods, instructions or products referred to in the content.

