
Evaluation of Environmental Naturalness: A Case Study in the Tietê-Jacaré Hydrographic Basin, São Paulo, Brazil

 ,
,  , ,
, ,  and
and 
Abstract
:1. Introduction
2. Materials and Methods
2.1. Study Area
2.2. Methodology
3. Results
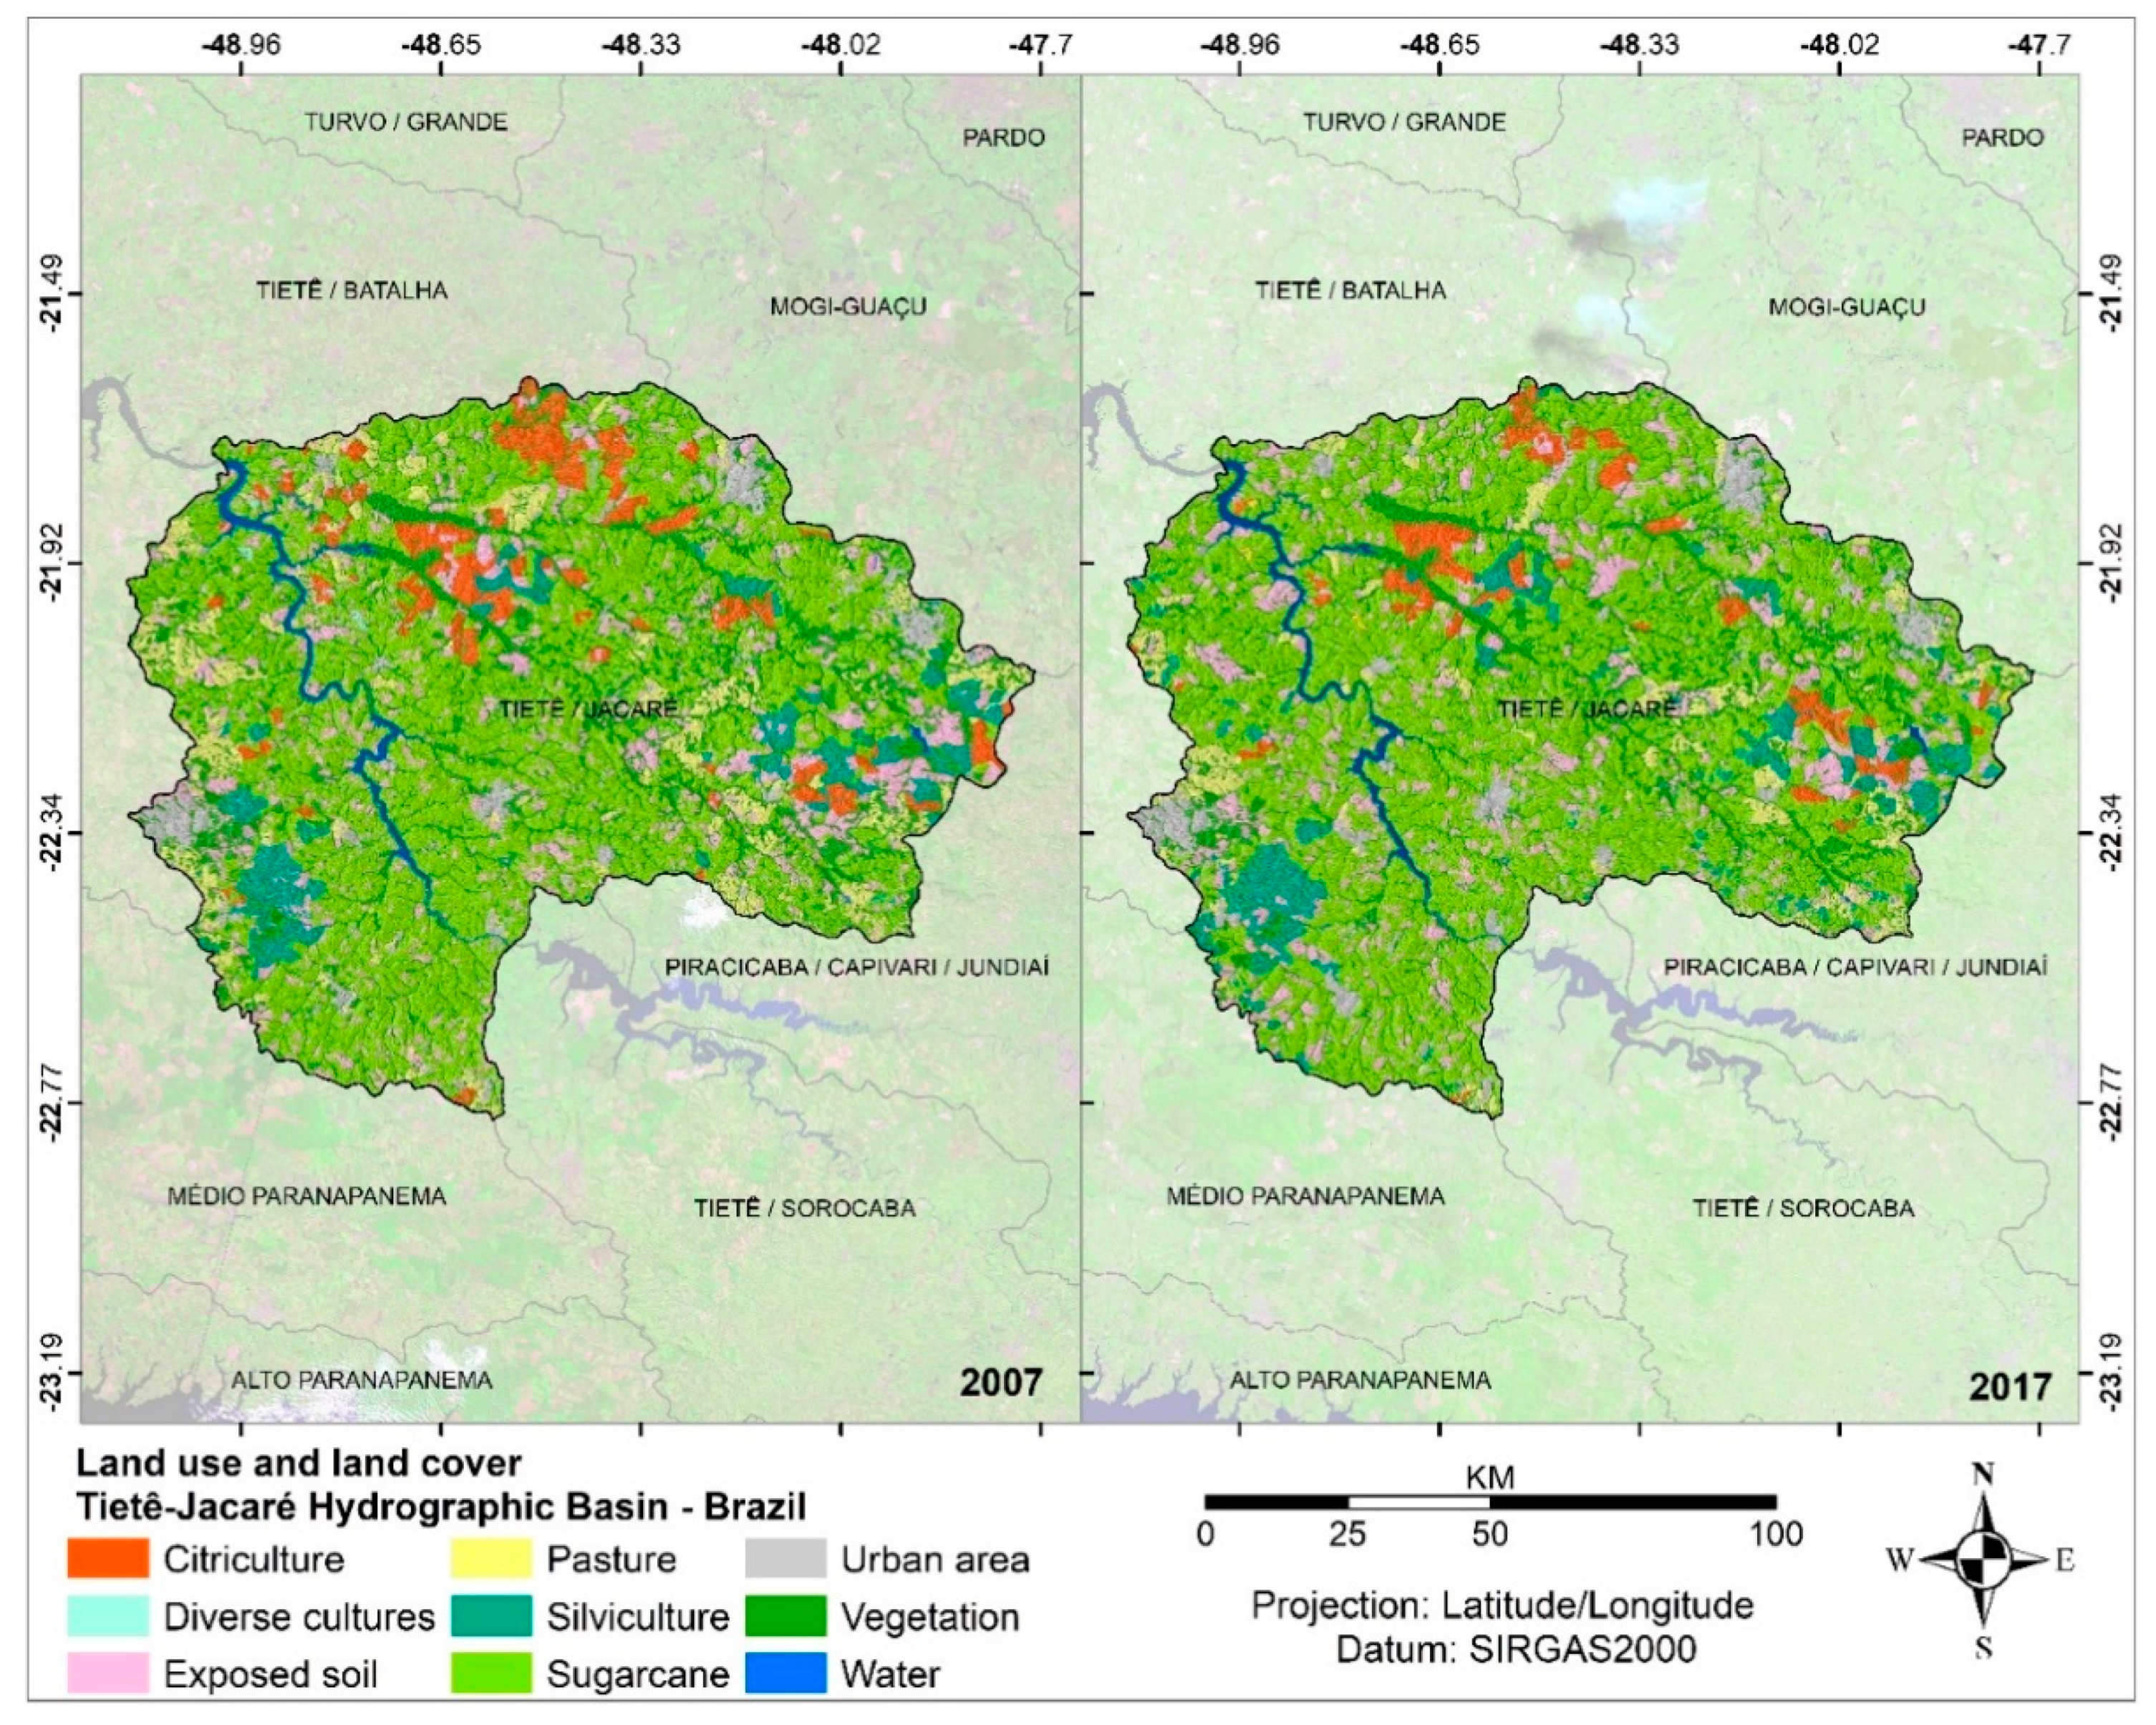
3.1. LULC Analysis
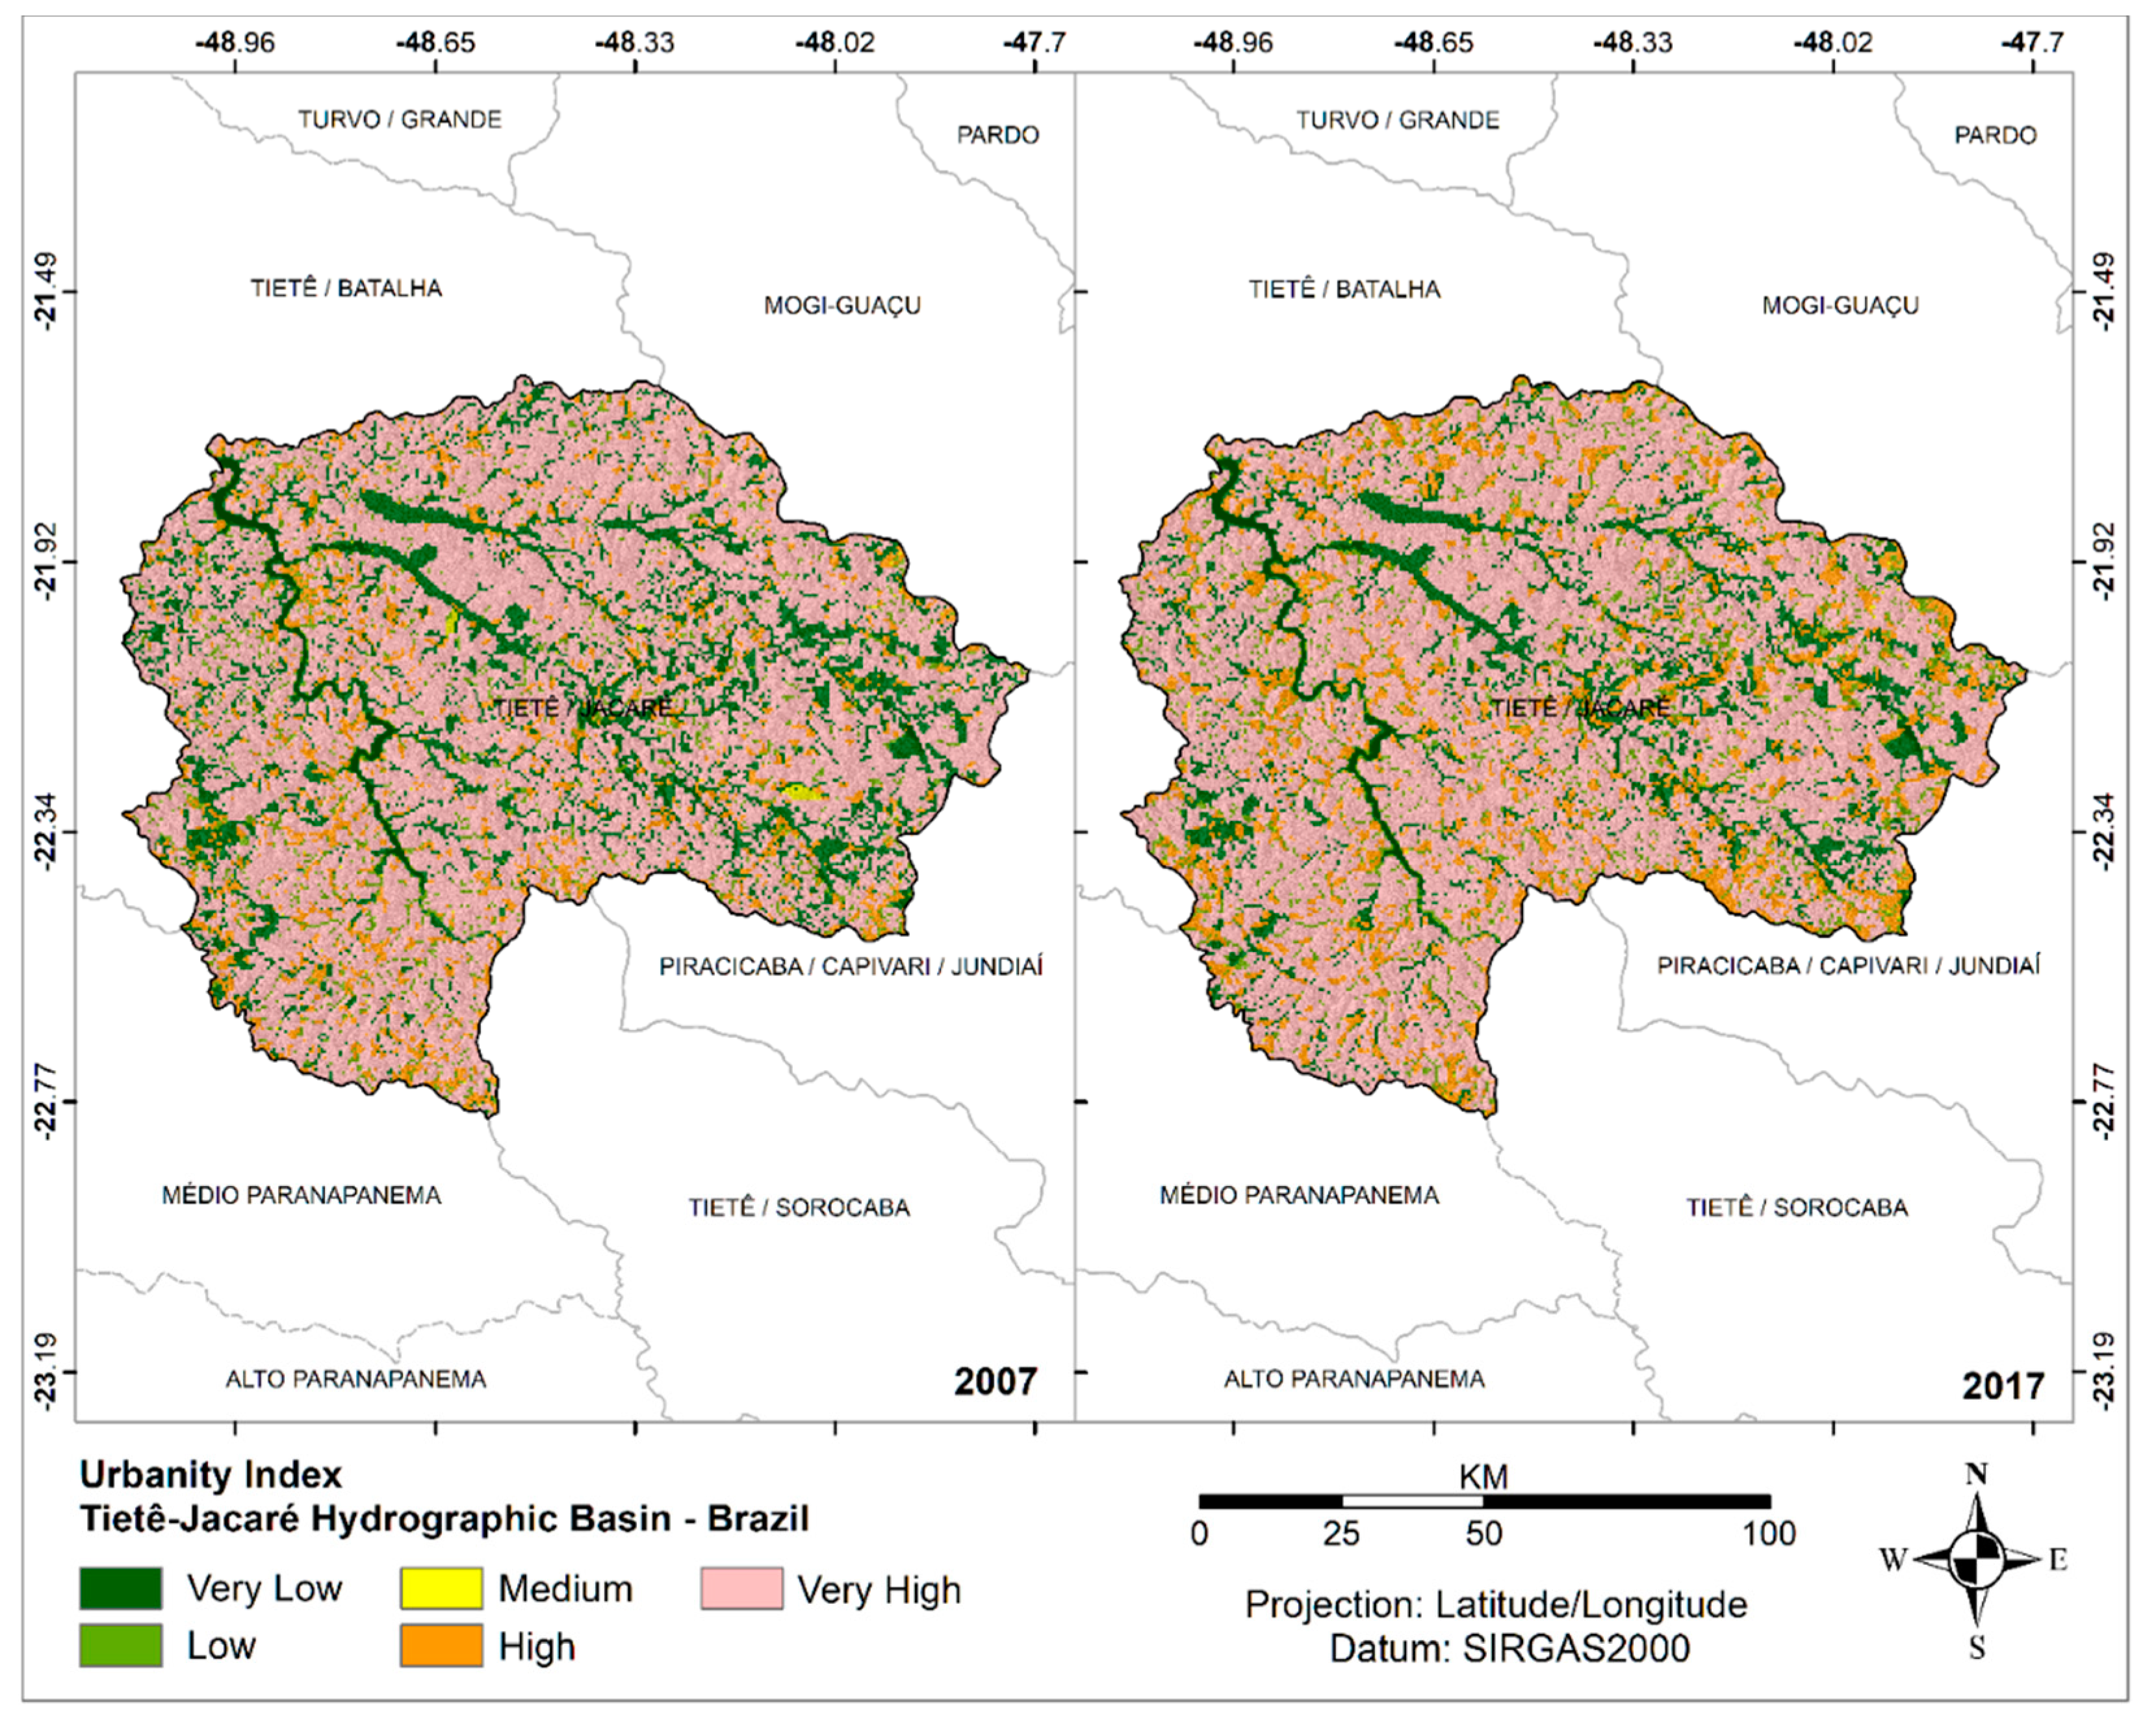
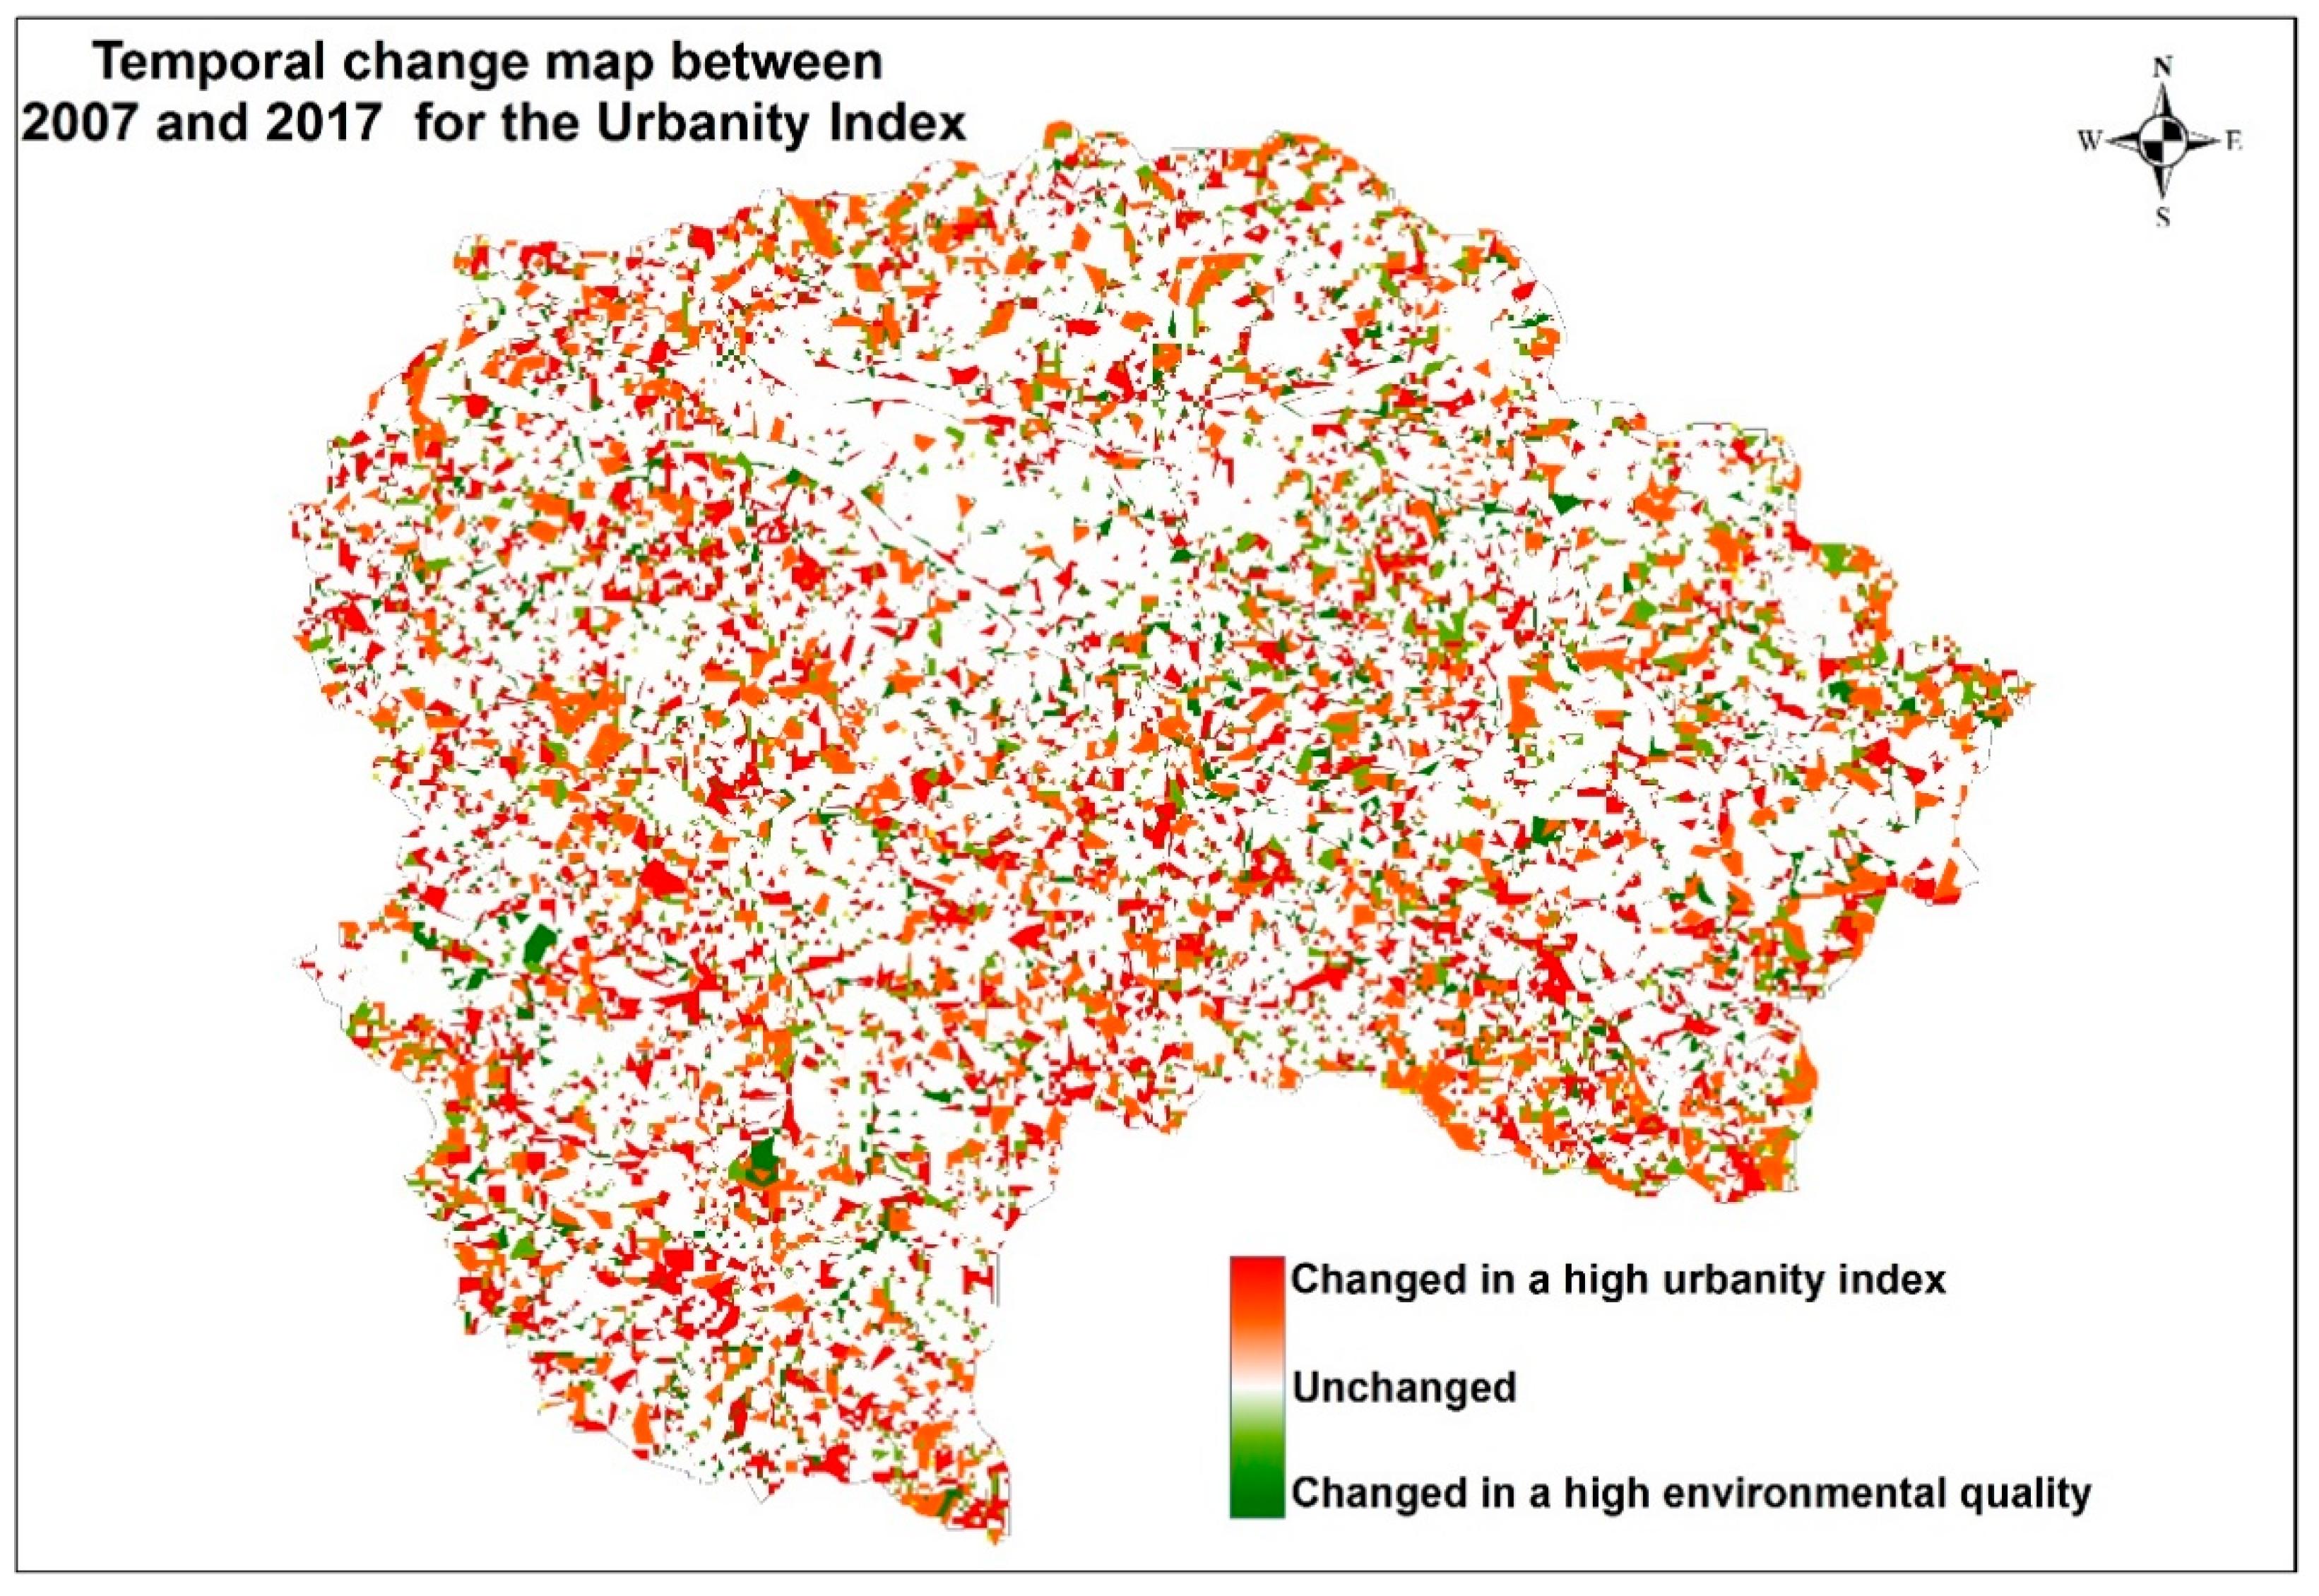
3.2. Urbanity Index Analysis
4. Discussion
5. Conclusions
Supplementary Materials
Author Contributions
Funding
Institutional Review Board Statement
Informed Consent Statement
Data Availability Statement
Conflicts of Interest
References
- Ridding, L.E.; Newton, A.C.; Redhead, J.W.; Watson, S.C.L.; Rowland, C.S.; Bullock, J.M. Modelling historical landscape changes. Landsc. Ecol. 2020, 35, 2695–2712. [Google Scholar] [CrossRef]
- Intergovernmental Painel on Climate Change. Climate Change 2007: Synthesis Report, 1st ed.; IPCC: Geneva, Switzerland, 2007; 976p. [Google Scholar]
- Marques, A.; Martins, I.S.; Kastner, T.; Plutzar, C.; Theurl, M.C.; Eisenmenger, N.; Huijbregts, M.A.J.; Wood, R.; Stadler, K.; Bruckner, M.; et al. Increasing impacts of land use on biodiversity and carbon sequestration driven by population and economic growth. Nat. Ecol. Evol. 2019, 3, 628–637. [Google Scholar] [CrossRef] [PubMed]
- Chaichi, N.; Daim, T.U. Landscape Analysis: Connected Lighting System. Innov. Technol. Knowl. Manag. 2018, 1, 45–65. [Google Scholar] [CrossRef]
- Song, X.-P.; Hansen, M.C.; Stehman, S.V.; Potapov, P.V.; Tyukavina, A.; Vermote, E.F.; Townshend, J.R. Global land change from 1982 to 2016. Nat. Cell Biol. 2018, 560, 639–643. [Google Scholar] [CrossRef]
- Weiberg, E.; Hughes, R.E.; Finné, M.; Bonnier, A.; Kaplan, J.O. Mediterranean land use systems from prehistory to antiquity: A case study from Peloponnese (Greece). J. Land Use Sci. 2019, 14, 1–20. [Google Scholar] [CrossRef] [Green Version]
- United Nations. UN Agenda 2030. Available online: https://sdgs.un.org/2030agenda (accessed on 26 October 2020).
- Gardner, R.H.; O’Neill, R.V. Pattern, process, and predictability: The use of neutral models for landscape analysis. In Quantitative Methods in Landscape Ecology: The Analyses and Interpretation of Landscape Heterogeneity, 1st ed.; Turner, G.M., Gardner, R.H., Eds.; Springer: New York, NY, USA, 1991; pp. 289–308. [Google Scholar]
- Van Zanten, B.T.; Van Berkel, D.B.; Meentemeyer, R.K.; Smith, J.W.; Tieskens, K.F.; Verburg, P.H. Continental-scale quantification of landscape values using social media data. Proc. Natl. Acad. Sci. USA 2016, 113, 12974–12979. [Google Scholar] [CrossRef] [Green Version]
- O’Neillr, R.V.; Krummel, J.R.; Gardner, R.H.; Sugihara, G.; Jackson, B.; DeAngelist, D.L.; Milne, B.T.; Turner, M.G.; Zygmunt, B.; Christensen, S.W.; et al. Indices of landscape pattern. Landsc. Ecol. 1988, 1, 153–162. [Google Scholar] [CrossRef]
- Wrbka, T.; Erb, K.-H.; Schulz, N.B.; Peterseil, J.; Hahn, C.; Haberl, H. Linking pattern and process in cultural landscapes. An empirical study based on spatially explicit indicators. Land Use Policy 2004, 21, 289–306. [Google Scholar] [CrossRef]
- Trevisan, D.P.; Moschini, L.E. Evaluation of landscape urbanity in Americana, São Paulo, Brazil. Int. J. Dev. Res. 2017, 7, 16177–16183. Available online: https://www.journalijdr.com/evaluation-landscape-urbanity-americana-s%C3%A3o-paulo-brazil (accessed on 10 January 2021).
- O’Sullivan, D.; Bergmann, L.; Thatcher, J.E. Spatiality, Maps, and Mathematics in Critical Human Geography: Toward a Repetition with Difference. Prof. Geogr. 2017, 70, 129–139. [Google Scholar] [CrossRef]
- Ritters, K.H.; O’Neil, R.V.; Hunsaker, C.T.; Wickham, J.D.; Yankee, D.H.; Timmins, S.P. A factor analysis of landscape pattern and structure metrics. Landsc. Ecol. 1995, 10, 23–39. [Google Scholar] [CrossRef]
- Baró, F.; Baggethun, E.G.; Haase, D. Ecosystem service bundles along the urban-rural gradient: Insights for landscape planning and management. Ecosyst. Serv. 2017, 24, 147–159. [Google Scholar] [CrossRef] [Green Version]
- Turner, M.G. Spatial simulation of landscape changes in Georgia: A comparison of 3 transition models. Landsc. Ecol. 1987, 1, 29–36. [Google Scholar] [CrossRef]
- Gustafson, E.J.; Parker, G.R. Relationships between landcover proportion and indices of landscape spatial pattern. Landsc. Ecol. 1992, 7, 101–110. [Google Scholar] [CrossRef]
- Mcgarigal, K.; Marks, B. Fragstats Manual. 1995. Available online: www.innovativegis.com/products/fragstatsarc/manual/index.html (accessed on 25 April 2020).
- Schumaker, N.H. Using Landscape Indices to Predict Habitat Connectivity. Ecology 1996, 77, 1210–1225. [Google Scholar] [CrossRef] [Green Version]
- Moretti, R.S. Content and procedures for preparing master plans. In Municipal Master Plans-New Concepts of Territorial Planning (Org); Bueno, L.M.M., Cymbalista, R., Eds.; Annablume: São Paulo, Brazil, 2007; pp. 265–271. [Google Scholar]
- Trevisan, D.P.; Moschini, L.E.; Moraes, M.C.P. Evaluation of the Naturalness of the Landscape in the Municipality of Ibaté, São Paulo, Brazil; Geografia-Rio Claro: Rio Claro, Brazil, 2016; pp. 467–482. Available online: https://www.periodicos.rc.biblioteca.unesp.br/index.php/ageteo/article/view/12646 (accessed on 10 January 2021).
- Trevisan, D.P. Analysis of Environmental Variables Caused by Land Use Changes and Land Cover in São Carlos, São Paulo, Brazil. São Carlos, 80f. Master’s Thesis, Federal University of São Carlos, São Paulo, Brazil, 2015. [Google Scholar]
- Turner, M.G.; Gardner, R.H. Quantitative Methods in Landscape Ecology, 1st ed.; Springer: New York, NY, USA, 1991; p. 536. [Google Scholar]
- Marino, D.; Di Cavallo, A.; Donato, B.D.; Nofroni, L.; Savelli, S. Between Resilience and Sense of Place: Understanding the Agricultural Traditional Landscape. Uniscape En-Route 2015, 1, 66–72. [Google Scholar]
- Bellón, B.; Blanco, J.; De Vos, A.; Roque, F.D.O.; Pays, O.; Renaud, P. Integrated Landscape Change Analysis of Protected Areas and their Surrounding Landscapes: Application in the Brazilian Cerrado. Remote Sens. 2020, 12, 1413. [Google Scholar] [CrossRef]
- Brasil. In Law n°12.651/2013; 2013. Available online: www.planalto.gov.br/ccivil_03/_Ato2011-2014/2012/Lei/L12651.htm (accessed on 13 May 2020).
- Duffy, J.E.; Godwin, C.M.; Cardinale, B.J. Biodiversity effects in the wild are common and as strong as key drivers of productivity. Nat. Cell Biol. 2017, 549, 261–264. [Google Scholar] [CrossRef] [PubMed]
- Trevisan, D.P.; Moschini, L.E.; Guerrero, J.V.R. Dinâmica Temporal do Uso e Cobertura da Terra no Município de Brotas-SP entre os Anos de 1988 e 2016. Front. J. Soc. Technol. Environ. Sci. 2018, 6, 204–219. [Google Scholar] [CrossRef]
- Franklin, J.F.; Forman, R.T.T. Creating landscape patterns by forest cutting: Ecological consequences and principles. Landsc. Ecol. 1987, 1, 5–18. [Google Scholar] [CrossRef]
- Turner, M.; Simard, M. Using Spatial Statistics and Landscape Metrics to Compare Disturbance Mosaics. In Learning Landscape Ecology: A Practical Guide to Concepts and Techniques, 1st ed.; Gergel, S.E., Tuner, M.G., Eds.; Springer: London, UK, 2017; pp. 175–190. [Google Scholar]
- Ribeiro, F.L.; Campos, S.; Piroli, E.L.; Santos, T.G.; Cardoso, L.G. Land use of Alto rio pardo, obtained from visual analysis. In Annals. I Ciclo de Atualização Florestal do Conesul Santa Maria; UFSM: Santa Maria, Brazil, 1999; pp. 75–78. [Google Scholar]
- McRae, B.H.; Beier, P. Circuit theory predicts gene flow in plant and animal populations. Proc. Natl. Acad. Sci. USA 2007, 104, 19885–19890. [Google Scholar] [CrossRef] [PubMed] [Green Version]
- Tundisi, J.G.; Matsumura-Tundisi, T.; Pareschi, D.C.; Luzia, A.P.; Von Haeling, P.H.; Frollini, E.H. The Tietê-Jacaré Watershed: A case study in research and management. Adv. Stud. 2008, 22, 159–172. [Google Scholar]
- CBH-TJ. Report on the Situation of Water Resources in the Tiete Jacaré River Basin Plan, São Paulo: Advanced StudiesState Water Resources Foundation, Final Report, CD-ROM; São Paulo State: São Paulo, Brazil, 2017. [Google Scholar]
- São Paulo. State Law n°7.663, de 30/12/1991. Available online: https://www.al.sp.gov.br/repositorio/legislacao/lei/1991/lei-7663-30.12.1991.html (accessed on 26 October 2020).
- São Paulo. State Law n°9.034, de 27/12/1994. Available online: https://www.al.sp.gov.br/repositorio/legislacao/lei/1994/lei-9034-27.12.1994.html (accessed on 26 October 2020).
- CBH-SM. Water Resources Management Unit. 2015. Available online: www.comitesm.sp.gov.br/institucional.php?k=ugrhi (accessed on 25 April 2020).
- IBGE. Planialtimetric Charts. 1971. Available online: ftp://geoftp.ibge.gov.br/cartas_e_mapas/folhas_topograficas/editoradas/escala_50mil/ (accessed on 25 April 2020).
- USGS. Earth Explorer. Available online: https://earthexplorer.usgs.gov/ (accessed on 28 August 2016).
- IBGE. Technical Manual for Land Use 3aEd. 2013. Available online: www.ibge.gov.br/home/geociencias/recursosnaturais/usodaterra (accessed on 24 April 2020).
- Trevisan, D.P.; Bispo, P.D.C.; Almeida, D.; Imani, M.; Balzter, H.; Moschini, L.E. Environmental vulnerability index: An evaluation of the water and the vegetation quality in a Brazilian Savanna and Seasonal Forest biome. Ecol. Indic. 2020, 112, 106163. [Google Scholar] [CrossRef]
- Canter, L.W. Environmental Impact Assessment—Series in Water Resources and Environmental Engineering, 2nd ed.; McGraw-Hill International Editions: Salford, UK, 1996; 660p. [Google Scholar]
- Eastman, J.R. Idrisi for Windows, Tutorial Exercises, Version 2.0, Clark Labs for Cartographic Technology and Geographic Analysis; Clark University: Worcester, MA, USA, 1997; 245p. [Google Scholar]
- Bojórquez-Tapia, L.A.; Juárez, L.; Cruz-Bello, G. Integrating Fuzzy Logic, Optimization, and GIS for Ecological Impact Assessments. Environ. Manag. 2002, 30, 418–433. [Google Scholar] [CrossRef] [PubMed]
- Fritzsons, E.; Mantovani, L.E.; Rizzi, N.E. Riparian Forest Landscapes Indices for Alto Capivari River Basin on Subtropical Carstic Region from Parana, Brazil. Rev. Florest. 2004, 3–11. Available online: https://revistas.ufpr.br/floresta/article/view/2370 (accessed on 10 January 2021).
- Fushita, A.T.; Reis, R.R.; Faresin, L.; Santos, J.E. Performance of supervised classification in different programs: Comparison through land use and landscape naturalness index. In Annals. XVI Brazilian Symposium on Remote Sensing—SBSR; INPE: Foz do Iguaçu, Brazil, 2013; pp. 6463–6470. [Google Scholar]
- Bueno, B.P.S. Índices de urbanização e urbanidade em perspectiva histórica: São Paulo, 1798–1930. Paranoá 1969, 73, 73–82. [Google Scholar] [CrossRef] [Green Version]
- Fisher, P.; Wood, J.O. What is a Mountain? Or the Englishman Who Went up a Boolean Geographical Concept but Realized it was Fuzzy. Geography 1998, 83, 247–256. Available online: https://www.jstor.org/stable/40573211 (accessed on 10 January 2021).
- Marro, A.A.; Souza, A.M.C.; Cavalcante, E.R.S.; Nunes, G.S.B.R. Lógica Fuzzy: Concepts and Applications, Teaching Material. Annals. VII Ibero-American Congress of Educational Informatics; Federal University of Rio Grande do Norte: Lagoa Nova, Brazil, 2013; pp. 127–136. [Google Scholar]
- Netto, J.N. The Alcohol Saga: Facts and Truths about 100 Years of Fuel Alcohol in Our Country, 1st ed.; Novo Século: Osasco, Brazil, 2007; 343p. [Google Scholar]
- Martini, D.Z.; Aragão, L.E.O.E.C.D.; Sanches, I.D.; Galdos, M.V.; Da Silva, C.R.U.; Dalla-Nora, E.L. Land availability for sugarcane derived jet-biofuels in São Paulo—Brazil. Land Use Policy 2018, 70, 256–262. [Google Scholar] [CrossRef]
- Rudorff, B.F.T.; De Aguiar, D.A.; Da Silva, W.F.; Sugawara, L.M.; Adami, M.; Moreira, M.A. Studies on the Rapid Expansion of Sugarcane for Ethanol Production in São Paulo State (Brazil) Using Landsat Data. Remote Sens. 2010, 2, 1057–1076. [Google Scholar] [CrossRef] [Green Version]
- Moraes, M.C.P.; Toppa, R.H.; Mello, K. Sugarcane Expansion as a pressure factor for protected natural areas. In (Org.) Faces of Landscape Polysemy: Ecology, Planning, and Perception, 1st ed.; Dos Santos, J.E., Zanin, E.M., Eds.; Rima: São Carlos, Brazil, 2013; pp. 163–173. [Google Scholar]
- De Mello, K.; Petri, L.; Leite, E.C.; Toppa, R.H. Cenários ambientais para o ordenamento territorial de áreas de preservação permanente no município de Sorocaba, SP. Rev. Árvore 2014, 38, 309–317. [Google Scholar] [CrossRef] [Green Version]
- Inkoom, J.N.; Frank, S.; Greve, K.; Walz, U.; Fürst, C. Suitability of different landscape metrics for the assessments of patchy landscapes in West Africa. Ecol. Indic. 2018, 85, 117–127. [Google Scholar] [CrossRef]
- Silva, V.C. Current Erosion, Potential Erosion and Sediment Input in the Paracatu River Basin (MG/GO/DF). Ph.D. Thesis, Brasília University, Brasília, Brazil, 2001; 108p. [Google Scholar]
- Bertoni, J.; Lombardi, F. Soil Conservation, 6th ed.; Ícone: São Paulo, Brazil, 2008; 355p. [Google Scholar]
- Hernandez, R.R.; Hoffacker, M.K.; Murphy-Mariscal, M.L.; Wu, G.C.; Allen, M.F. Solar energy development impacts on land cover change and protected areas. Proc. Natl. Acad. Sci. USA 2015, 112, 13579–13584. [Google Scholar] [CrossRef] [PubMed] [Green Version]
- Castro, V.R. Edge Effects on Soil in Cerradão Fragments in the Northeastern Region of São Paulo State, Derived from Agricultural Management. Annals. IX National Cerrado Symposium, Brasília. 2008. Available online: http://simposio.cpac.embrapa.br/simposio_pc210/trabalhos_pdf/00504_trab2_ap.pdf (accessed on 10 January 2021).
- Azevedo, T.N. Effect of Expanding Sugarcane Cultivation on the Landscape Composition of São Paulo State, 79f. Master’s Thesis, São Paulo University, São Paulo, Brazil, 2013. [Google Scholar]
- Macedo, R.C.; Almeida, C.M.; Santos, J.R.; Rudorff, B.F.T. Spatial dynamic modeling of changes in land cover and land use related to sugarcane expansion. Geod. Sci. Bull. 2013, 19, 313–337. Available online: https://sid.inpe.br/mtc-m19/2013/09.06.18.13-TDI (accessed on 10 January 2021).
- Aspinall, R.; Staiano, M. Ecosystem services as the products of land system dynamics: Lessons from a longitudinal study of coupled human-environment systems. Landsc. Ecol. 2019, 34, 1503–1524. [Google Scholar] [CrossRef] [Green Version]
- Zimmermann, C.L. Monoculture and transgenics: Environmental impacts and food insecurity. Law Paths. 2009, 6, 79–100. [Google Scholar]
- Medrano, L.; Recaman, L. Space and society in the 21st century. e case of São Paulo. Bitácora Urbano Territ. 2018, 28, 71–83. [Google Scholar] [CrossRef]
- Moschini, L.E. Environmental Zoning of the Upper Mogi-Guaçu Superior River Basin. 149f. Ph.D. Thesis, Universidade Federal de São Carlos, São Paulo, Brazil, 2008. [Google Scholar]
- Dos Santos, R.M. The Temporal and Spatial Pattern of Land-Use Changes and Scenarios for the Conservation of Regional Biodiversity in São Félix do Araguaia, MT. 153f. Ph.D. Thesis, Federal University of São Carlos, São Carlos, Brazil, 2011. [Google Scholar]
- Fushita, A.T.; Dos Santos, J.E.; De Souza, I.M.M.; Romanini, E.; Costa, R.T. Landscape Structural Indicators as a Tool to Assess Land Use Changes in Planning for Sub-Basin Sustainability (Southeastern Brazil). J. Water Resour. Prot. 2016, 8, 482–492. [Google Scholar] [CrossRef] [Green Version]
- Cristache, S.-E.; Vuță, M.; Marin, E.; Cioacă, S.-I.; Vuţă, M. Organic versus Conventional Farming—A Paradigm for the Sustainable Development of the European Countries. Sustainability 2018, 10, 4279. [Google Scholar] [CrossRef] [Green Version]
- Szafranska, B.; Busko, M.; Kovalyshyn, O.; Kolodiy, P. Building a Spatial Information System to Support the Development of Agriculture in Poland and Ukraine. Agronomy 2020, 10, 1884. [Google Scholar] [CrossRef]
- Tarasovičová, Z.; Saksa, M.; Blažík, T.; Falťan, V. Changes in Agricultural Land Use in the Context of Ongoing Transformational Processes in Slovakia. Agriculture 2013, 59, 49–64. [Google Scholar] [CrossRef]
- Moravcová, J.; Koupilová, M.; Pavlíček, T.; Zemek, F.; Kvítek, T.; Pečenka, J. Analysis of land consolidation projects and their impact on land use change, landscape structure, and agricultural land resource protection: Case studies of Pilsen-South and Pilsen-North (Czech Republic). Landsc. Ecol. Eng. 2017, 13, 1–13. [Google Scholar] [CrossRef]
- Bonita, B. Rio Tietê Dam in Barra Bonita. 2019. Available online: http://bes-br.com/?page_id=1507 (accessed on 13 May 2020).


| Satellite | Overpass | Path/Row | Bands | Pixel Resolution | Clouds (%) |
|---|---|---|---|---|---|
| Landsat 5 | 30th April 2007 | 220/75 | 5/4/3 | 30 m | 0 |
| Landsat 5 | 30th April 2007 | 220/76 | 5/4/3 | 30 m | 0 |
| Landsat 5 | 30th April 2007 | 221/75 | 5/4/3 | 30 m | 0 |
| Landsat 5 | 30th April 2007 | 221/76 | 5/4/3 | 30 m | 0 |
| Landsat 8 | 21st September 2017 | 220/75 | 6/5/4 | 30 m | 0 |
| Landsat 8 | 21st September 2017 | 220/76 | 6/5/4 | 30 m | 0 |
| Landsat 8 | 21st September 2017 | 221/75 | 6/5/4 | 30 m | 0 |
| Landsat 8 | 21st September 2017 | 221/76 | 6/5/4 | 30 m | 0 |
| Class (I) | Type (II) | Description (III) |
|---|---|---|
| Anthropic, not agricultural areas | Urban areas | Urban area and rural developments (industrial and household) |
| Anthropic agricultural areas | Sugarcane | Cultivation of Saccharum officinarum L |
| Citrus | Cultivation of Citrus sinensis | |
| Pastures | An area with the predominance of herbaceous vegetation, used for extensive livestock farming (native or exotic) | |
| Silviculture | Cultivation area of Eucalyptus spp or Pinus spp | |
| Exposed soil (bare soil) | Soil fallow area | |
| Vegetation | Vegetation | An area with a predominance of tree vegetation, with natural vegetation cover |
| Water | Water | Rivers, lakes, ponds, and reservoirs |
| Classes | Land Use (2007) | Land Use (2017) | ||
|---|---|---|---|---|
| Area (ha) | % | Area (ha) | % | |
| Sugarcane | 542,124.00 | 45.90 | 607,455.00 | 51.43 |
| Water | 16,955.80 | 1.44 | 16,764.60 | 1.42 |
| Citriculture | 62,121.90 | 5.26 | 38,198.80 | 3.23 |
| Diverse cultures | 1315.71 | 0.11 | 1382.63 | 0.12 |
| Pastures | 76,817.59 | 6.50 | 51,564.90 | 4.37 |
| Silviculture | 49,272.60 | 4.17 | 58,258.00 | 4.93 |
| Exposed soil | 122,046.00 | 10.33 | 121,346.00 | 10.27 |
| Urban area | 36,148.40 | 3.06 | 43,981.07 | 3.72 |
| Vegetation | 274,288.00 | 23.22 | 242,139.00 | 20.50 |
| Total | 1,181,090.00 | 100.00 | 1,181,090.00 | 100.00 |
| Land Use | Hectares in 2007 | Hectares Kept in 2017 | Hectares Converted in 2017 | % Hectares Converted |
|---|---|---|---|---|
| Sugarcane | 542,124.00 | 421,977.14 | 120,146.86 | 22.20 |
| Water | 16,955.80 | 16,764.60 | 191.20 | 1.10 |
| Citriculture | 62,121.90 | 23,037.40 | 39,084.50 | 62.90 |
| Diverse cultures | 1315.71 | 1315.71 | 0.00 | 0.00 |
| Pastures | 76,817.59 | 24,744.32 | 52,073.27 | 67.80 |
| Silviculture | 49,272.60 | 29,396.77 | 19,875.83 | 40.30 |
| Exposed soil | 122,046.00 | 18,230.60 | 103,815.40 | 85.10 |
| Urban area | 36,148.40 | 36,148.40 | 0.00 | 0.00 |
| Vegetation | 274,288.00 | 199,764.83 | 74,523.17 | 27.20 |
| Total | 1,181,090.00 | 771,379.77 | 409,710.23 | 34.70 |
| 1,181,090.00 | ||||
| Transition (2007/2017) | Area (ha) | Transition (2007/2017) | Area (ha) | ||
|---|---|---|---|---|---|
| Sugarcane | Sugarcane | 421,977.14 | Pasture | Urban | 1921.98 |
| Sugarcane | Citriculture | 5944.67 | Pasture | Vegetation | 7765.59 |
| Sugarcane | Pasture | 9834.27 | Silviculture | Sugarcane | 5935.15 |
| Sugarcane | Silviculture | 10,181.10 | Silviculture | Citriculture | 904.11 |
| Sugarcane | Exposed soil | 72,449.10 | Silviculture | Pasture | 1020.50 |
| Sugarcane | Urban | 2373.09 | Silviculture | Silviculture | 29,396.77 |
| Sugarcane | Vegetation | 19,364.63 | Silviculture | Exposed soil | 7152.34 |
| Water | Sugarcane | 67.22 | Silviculture | Urban | 48.23 |
| Water | Water | 16,764.60 | Silviculture | Vegetation | 4815.50 |
| Water | Citriculture | 0.51 | Exposed soil | Sugarcane | 77,737.30 |
| Water | Pasture | 40.19 | Exposed soil | Citriculture | 5868.57 |
| Water | Silviculture | 21.00 | Exposed soil | Pasture | 6110.23 |
| Water | Exposed soil | 0.61 | Exposed soil | Silviculture | 6929.36 |
| Water | Urban | 16.71 | Exposed soil | Exposed soil | 18,230.60 |
| Water | Vegetation | 44.97 | Exposed soil | Urban | 557.08 |
| Citriculture | Sugarcane | 25,698.81 | Exposed soil | Vegetation | 6612.87 |
| Citriculture | Citriculture | 23,037.40 | Urban | Urban | 36,148.40 |
| Citriculture | Pasture | 541.94 | Diverse uses | Diverse uses | 1315.71 |
| Citriculture | Silviculture | 1386.02 | Vegetation | Sugarcane | 43,881.30 |
| Citriculture | Exposed soil | 7847.92 | Vegetation | Citriculture | 2098.69 |
| Citriculture | Urban | 289.77 | Vegetation | Pasture | 9198.46 |
| Citriculture | Vegetation | 3311.06 | Vegetation | Silviculture | 6953.22 |
| Pasture | Sugarcane | 32,197.40 | Vegetation | Exposed soil | 9302.40 |
| Pasture | Citriculture | 350.02 | Vegetation | Urban | 3022.18 |
| Pasture | Pasture | 24,744.32 | Vegetation | Diverse uses | 66.92 |
| Pasture | Silviculture | 3347.49 | Vegetation | Vegetation | 199,764.83 |
| Pasture | Exposed soil | 6490.80 | |||
| Classes | UI (2007) | UI (2017) | Changes | |||
|---|---|---|---|---|---|---|
| Area (ha) | % | Area (ha) | % | Area (ha) | % | |
| 0.0–0.2 | 218,058.00 | 18.46 | 155,160.00 | 13.14 | −62,898.00 | −28.84 |
| 0.2–0.4 | 49,836.90 | 4.22 | 78,303.10 | 6.63 | 28,466.20 | 57.12 |
| 0.4–06 | 5612.10 | 0.48 | 5351.90 | 0.45 | −260.20 | −4.64 |
| 0.6–0.8 | 107,516.00 | 9.10 | 159,511.00 | 13.51 | 51,995.00 | 48.36 |
| 0.8–1.0 | 800,067.00 | 67.74 | 782,764.00 | 66.27 | −17,303.00 | −2.16 |
| Total | 1,181,090.00 | 100.00 | 1,181,090.00 | 100.00 | - | - |
| IB | Hectares in 2007 | Hectares Kept in 2017 | Hectares Converted in 2017 | % Hectares Converted |
|---|---|---|---|---|
| Very low | 218,058.00 | 109,972.73 | 108,085.27 | 49.57 |
| Low | 49,836.90 | 16,042.34 | 33,794.56 | 67.81 |
| Medium | 5612.10 | 5351.10 | 261.00 | 4.65 |
| High | 107,516.00 | 32,521,85 | 74,994.15 | 69.75 |
| Very High | 800,067.00 | 633,656.12 | 166,410.88 | 20.80 |
| Total | 1,181,090.00 | 797,544.14 | 383,545.86 | 32.47 |
| 1,181,090.00 | ||||
| Transition (2007/2017) | Area (ha) | Transition (2007/2017) | Area (ha) | ||
|---|---|---|---|---|---|
| High | High | 32,521.85 | Medium | Medium | 5351.10 |
| High | Low | 4857.92 | Very high | High | 104,209.00 |
| High | Medium | 378.73 | Very high | Low | 27,801.20 |
| High | Very high | 65,295.30 | Very high | Medium | 1271.08 |
| High | Very low | 4462.20 | Very high | Very high | 633,656.12 |
| Low | High | 6426.99 | Very high | Very low | 33,129.60 |
| Low | Low | 16,042.34 | Very low | Low | 29,455.10 |
| Low | Medium | 488.56 | Very low | High | 16,244.70 |
| Low | Very high | 19,229.60 | Very low | Medium | 392.37 |
| Low | Very low | 7649.41 | Very low | Very high | 61,993.10 |
| Medium | High | 261.00 | Very low | Very low | 109,972.73 |
Publisher’s Note: MDPI stays neutral with regard to jurisdictional claims in published maps and institutional affiliations. |
© 2021 by the authors. Licensee MDPI, Basel, Switzerland. This article is an open access article distributed under the terms and conditions of the Creative Commons Attribution (CC BY) license (http://creativecommons.org/licenses/by/4.0/).
Share and Cite
Trevisan, D.P.; Ruggiero, M.H.; Bispo, P.d.C.; Almeida, D.; Imani, M.; Balzter, H.; Moschini, L.E. Evaluation of Environmental Naturalness: A Case Study in the Tietê-Jacaré Hydrographic Basin, São Paulo, Brazil. Sustainability 2021, 13, 3021. https://doi.org/10.3390/su13063021
Trevisan DP, Ruggiero MH, Bispo PdC, Almeida D, Imani M, Balzter H, Moschini LE. Evaluation of Environmental Naturalness: A Case Study in the Tietê-Jacaré Hydrographic Basin, São Paulo, Brazil. Sustainability. 2021; 13(6):3021. https://doi.org/10.3390/su13063021
Chicago/Turabian StyleTrevisan, Diego Peruchi, Mayara Herrmann Ruggiero, Polyanna da Conceição Bispo, Dayana Almeida, Maryam Imani, Heiko Balzter, and Luiz Eduardo Moschini. 2021. "Evaluation of Environmental Naturalness: A Case Study in the Tietê-Jacaré Hydrographic Basin, São Paulo, Brazil" Sustainability 13, no. 6: 3021. https://doi.org/10.3390/su13063021