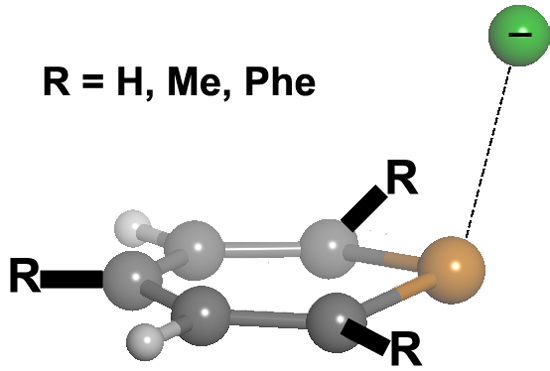
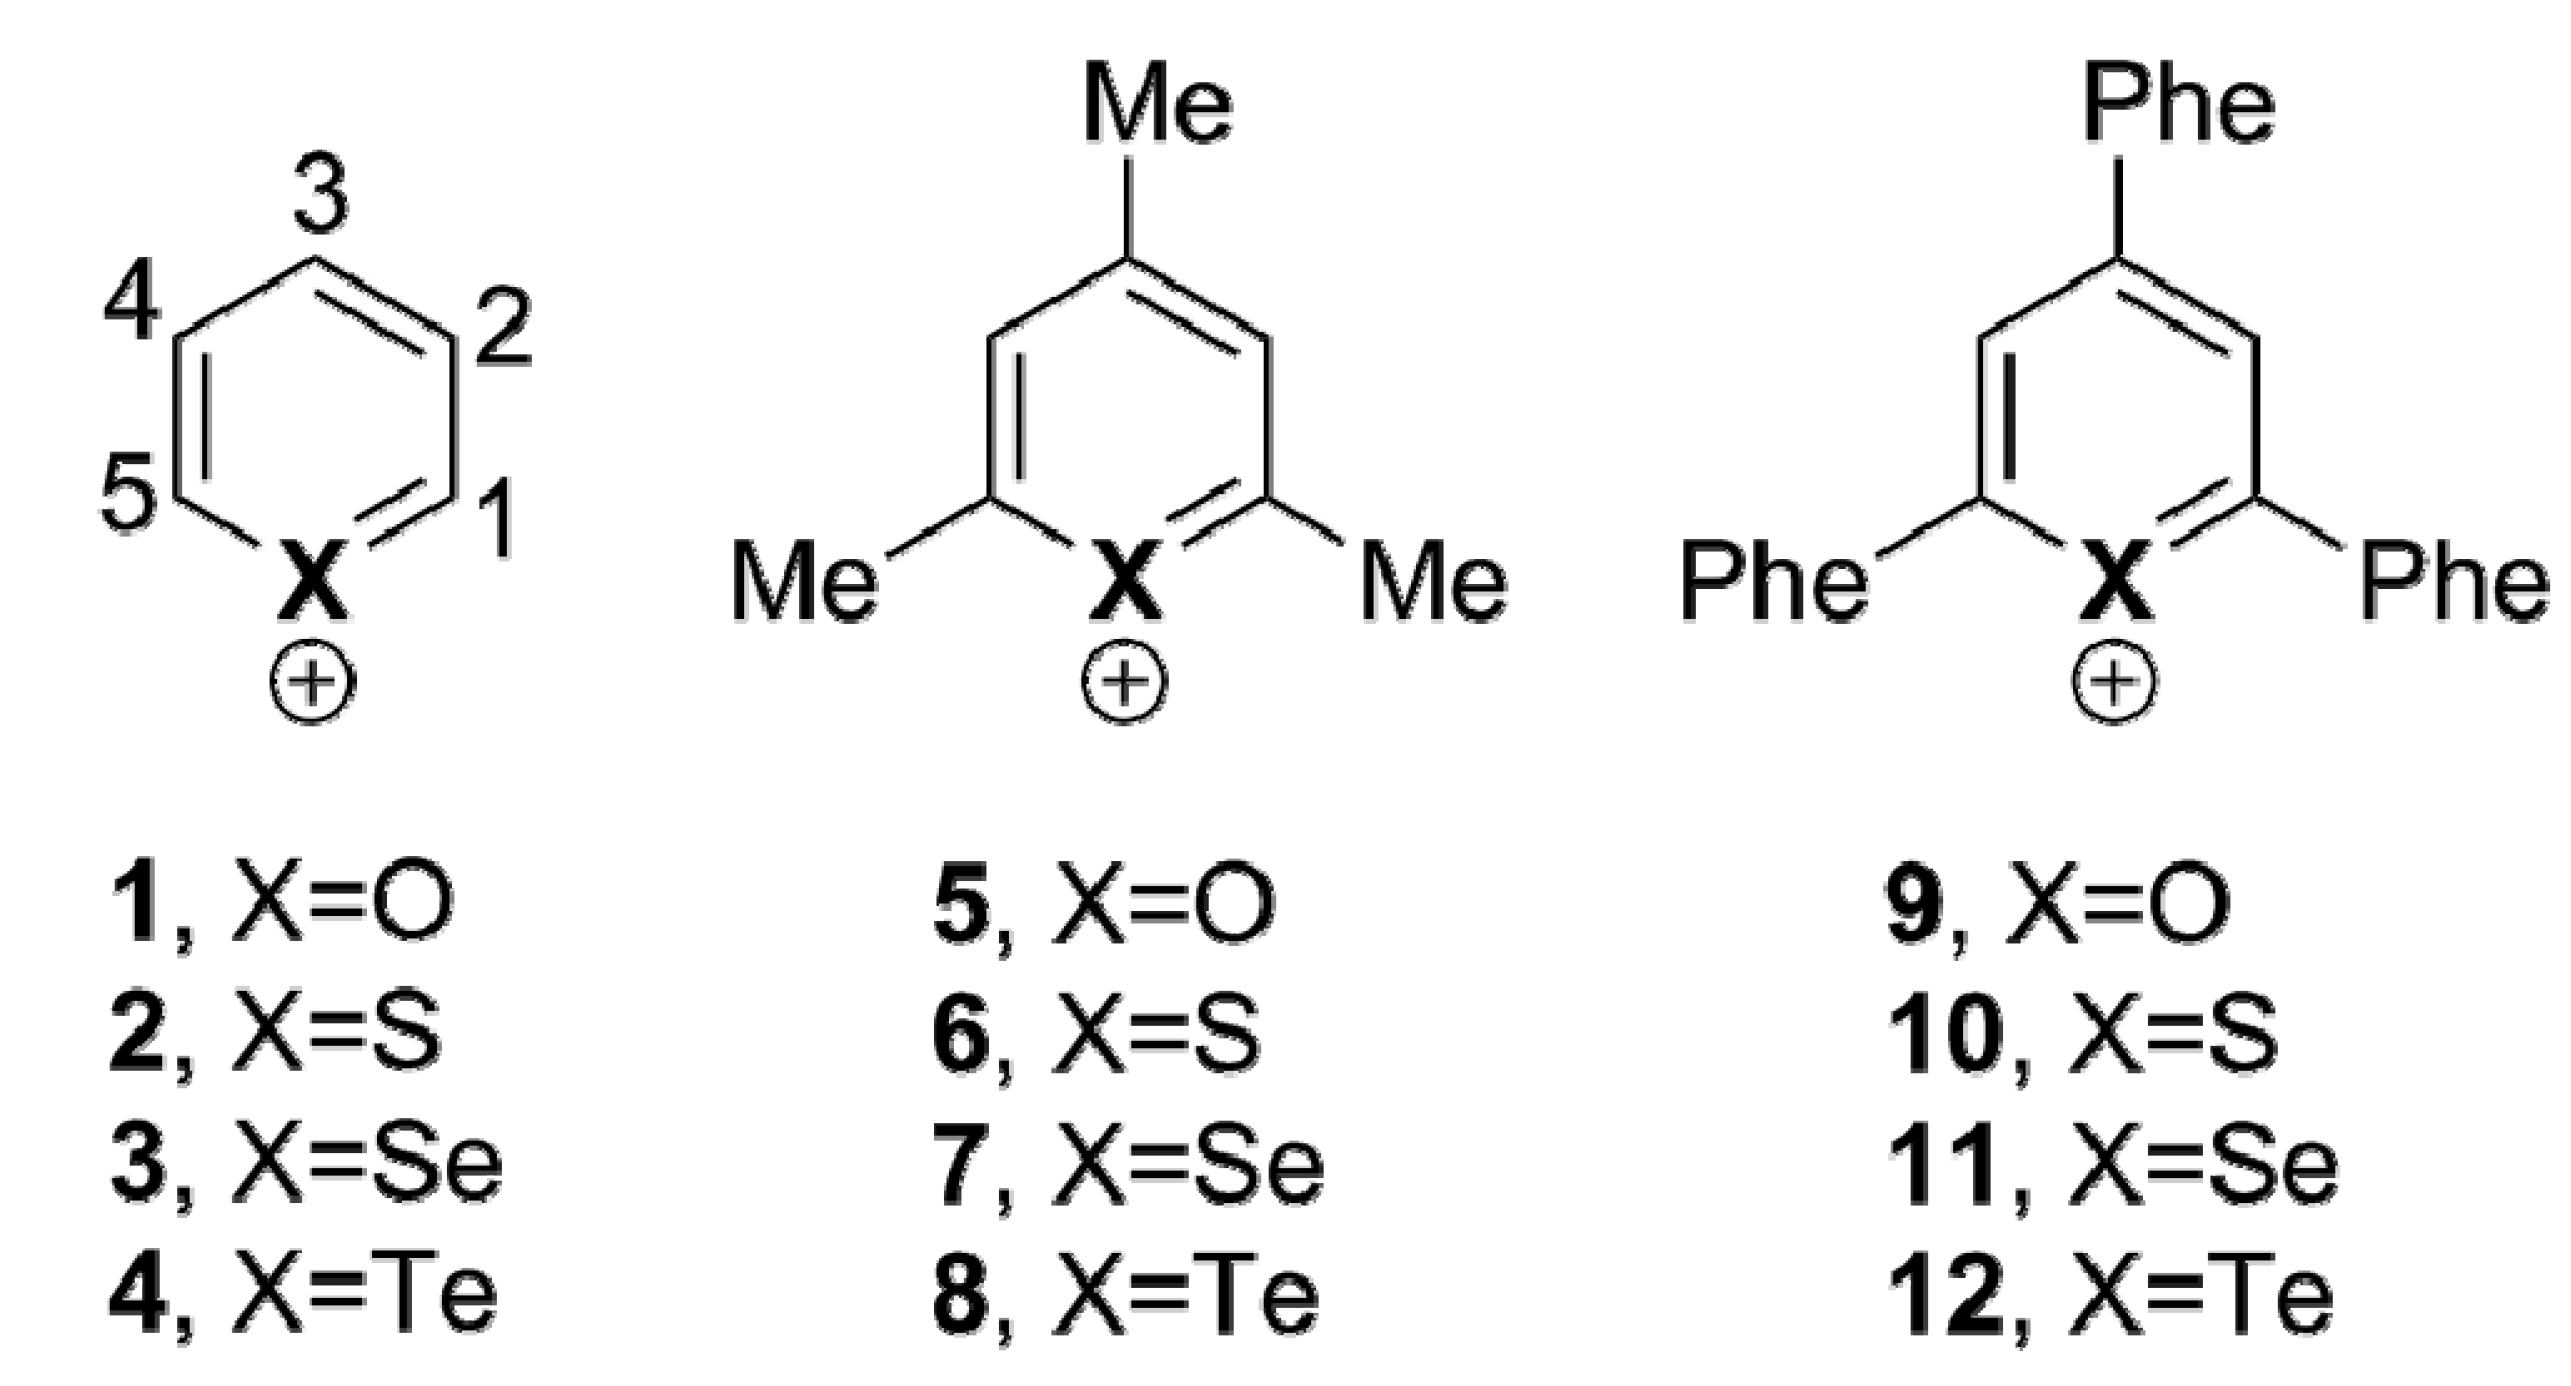
2.1. Preliminary Studies
We chose different aromatic systems to interact with chloride, namely pyrylium, thiopyrylium and selenopyrylium (
1,
2 and
3, respectively, in
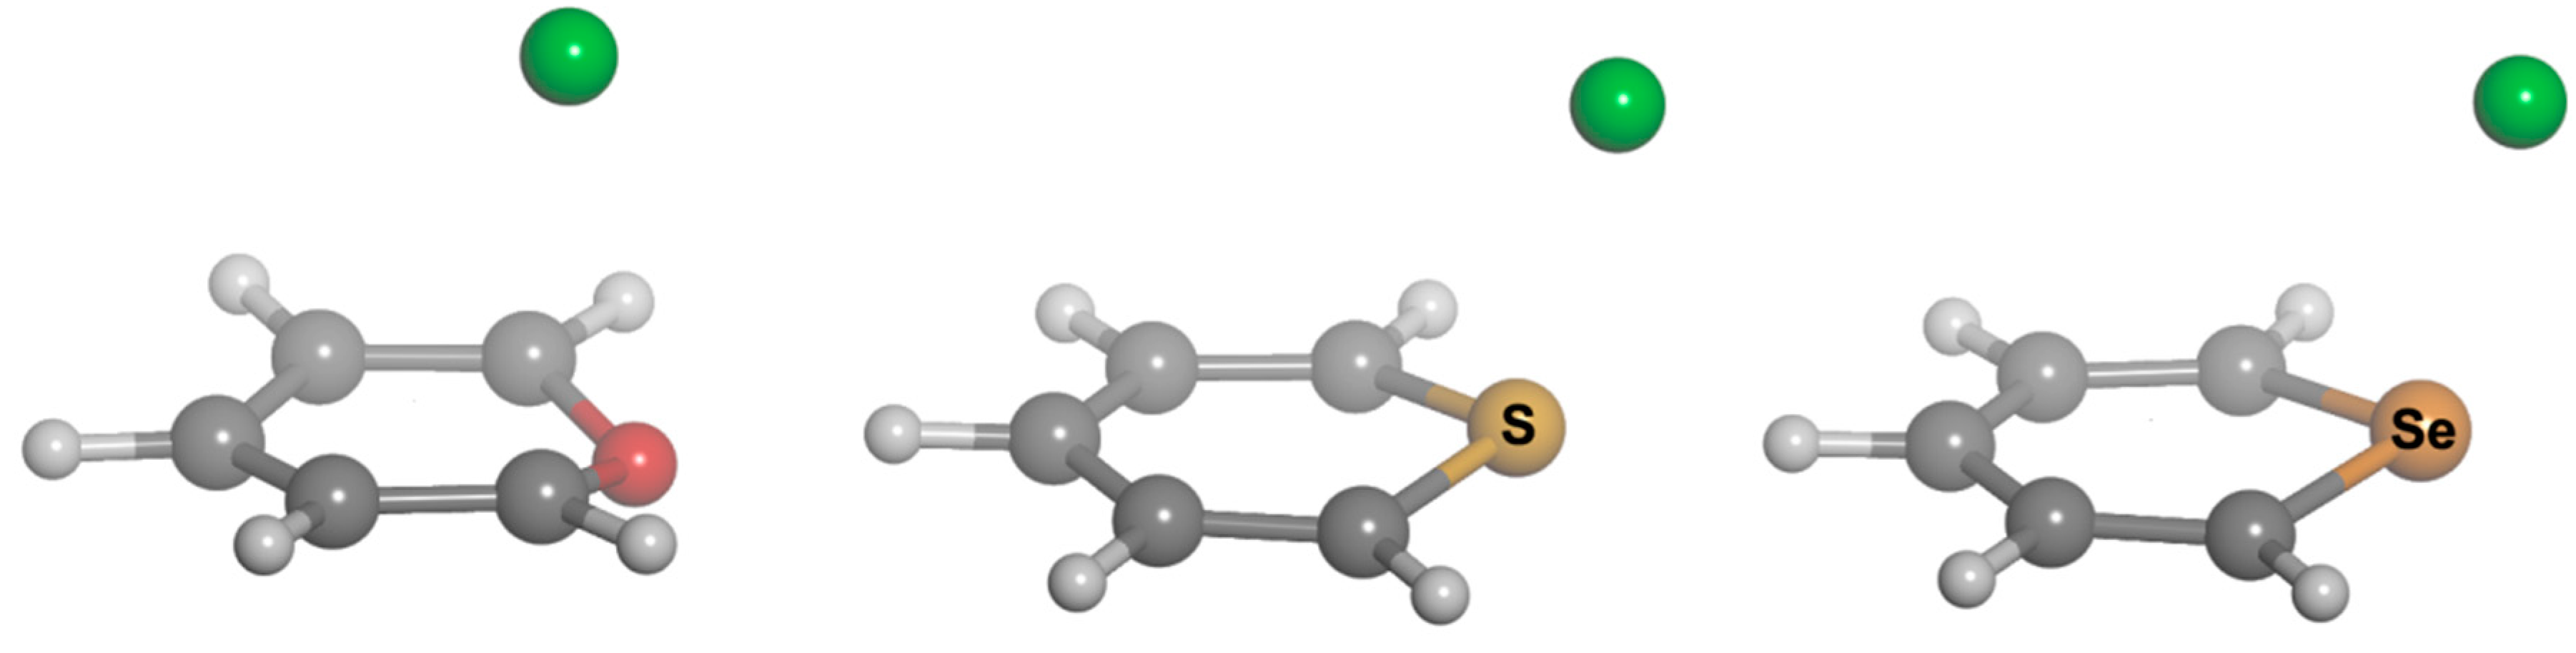
Scheme 1). We carried out Density Functional Theory (DFT) calculations at the BP86-D3/def2-TZVPD, B97-D3/def2-TZVPD levels and resolution of the identity (RI) second-order Møller Plesset (MP2) calculations at the RI-MP2/aug-cc-pVTZ (AVTZ) level. Geometry optimizations for all complexes. The geometries of the analyzed complexes are shown in
Figure 1, and the geometric and energetic results of these calculations are gathered in
Table 1. From the energetic point of view, regardless of the computational method used, all interaction energies are negative, indicating that the formation of the complexes between the aromatic systems and Cl
– is favorable, as expected from the interaction of two ions of opposite sign. The largest binding energy corresponds to the complex of
3, which decreases for
2·Cl
– and then again when the ring is
1. Comparison of the DFT energy values yields larger binding energies for the BP86 than for the B97 results. The B97 interaction energies are in better agreement than the BP86 ones with the MP2 results, with energy differences as large as 2.7 kcal·mol
−1. Furthermore, the agreement is even better when B97 and CCSD(T)/CBS (CCSD(T): coupled-cluster singles doubles and non-iterative triples correction; CBS: complete basis set) interaction energies are compared.
Figure 1.
Optimized geometries of complexes of 1 (left), 2 (center) and 3 (right) with chloride.
Figure 1.
Optimized geometries of complexes of 1 (left), 2 (center) and 3 (right) with chloride.
Table 1.
Interaction energies (∆E, in kcal·mol−1) and equilibrium distances (Re, in Å) a of the complexes of Cl– with 1, 2 and 3 at the BP86-D3/TZVP, B97-D3/TZVP, MP2/AVTZ and CCSD(T)/CBS levels of theory.
Table 1.
Interaction energies (∆E, in kcal·mol−1) and equilibrium distances (Re, in Å) a of the complexes of Cl– with 1, 2 and 3 at the BP86-D3/TZVP, B97-D3/TZVP, MP2/AVTZ and CCSD(T)/CBS levels of theory.
| Complexes | BP86-D3/TZVPD | B97-D3/TZVPD | MP2/AVTZ | CCSD(T)/CBS |
|---|
| | ∆E | Re | ∆E | Re | ∆E | Re | ∆E |
| 1·Cl– | −103.2 | 2.90 | −101.2 | 2.97 | −98.9 | 2.86 | −98.5 |
| 2·Cl– | −110.6 | 2.44 | −106.4 | 2.50 | −107.0 | 2.41 | −104.6 |
| 3·Cl– | −112.9 | 2.52 | −108.8 | 2.57 | −111.5 | 2.49 | −108.2 |
From the geometrical point of view, a comparison has also been made among the different levels of theory, with two points worth being mentioned. On the one hand, the equilibrium distances obtained at the B97 level are generally slightly longer (≥0.07 Å) than the ones obtained at the BP86 level (see
Table 1). For instance, for the
1· Cl
– complex, a 0.07 Å difference in length is observed. On the other hand, the BP86 equilibrium distances are in good agreement (better than the B97 ones) with the MP2 ones, where the former are slightly longer than the latter.
From the results gathered in
Table 1, it can be deduced that despite the small differences in equilibrium distances, the B97 method nicely reproduces all of the interactions. Therefore, the comparison of B97 and CCSD(T) results validates the use of the RI-B97-D3/TZVP level of theory to study the interaction of our systems with Cl
–. From now on, this is the computational methodology that will be used throughout the manuscript.
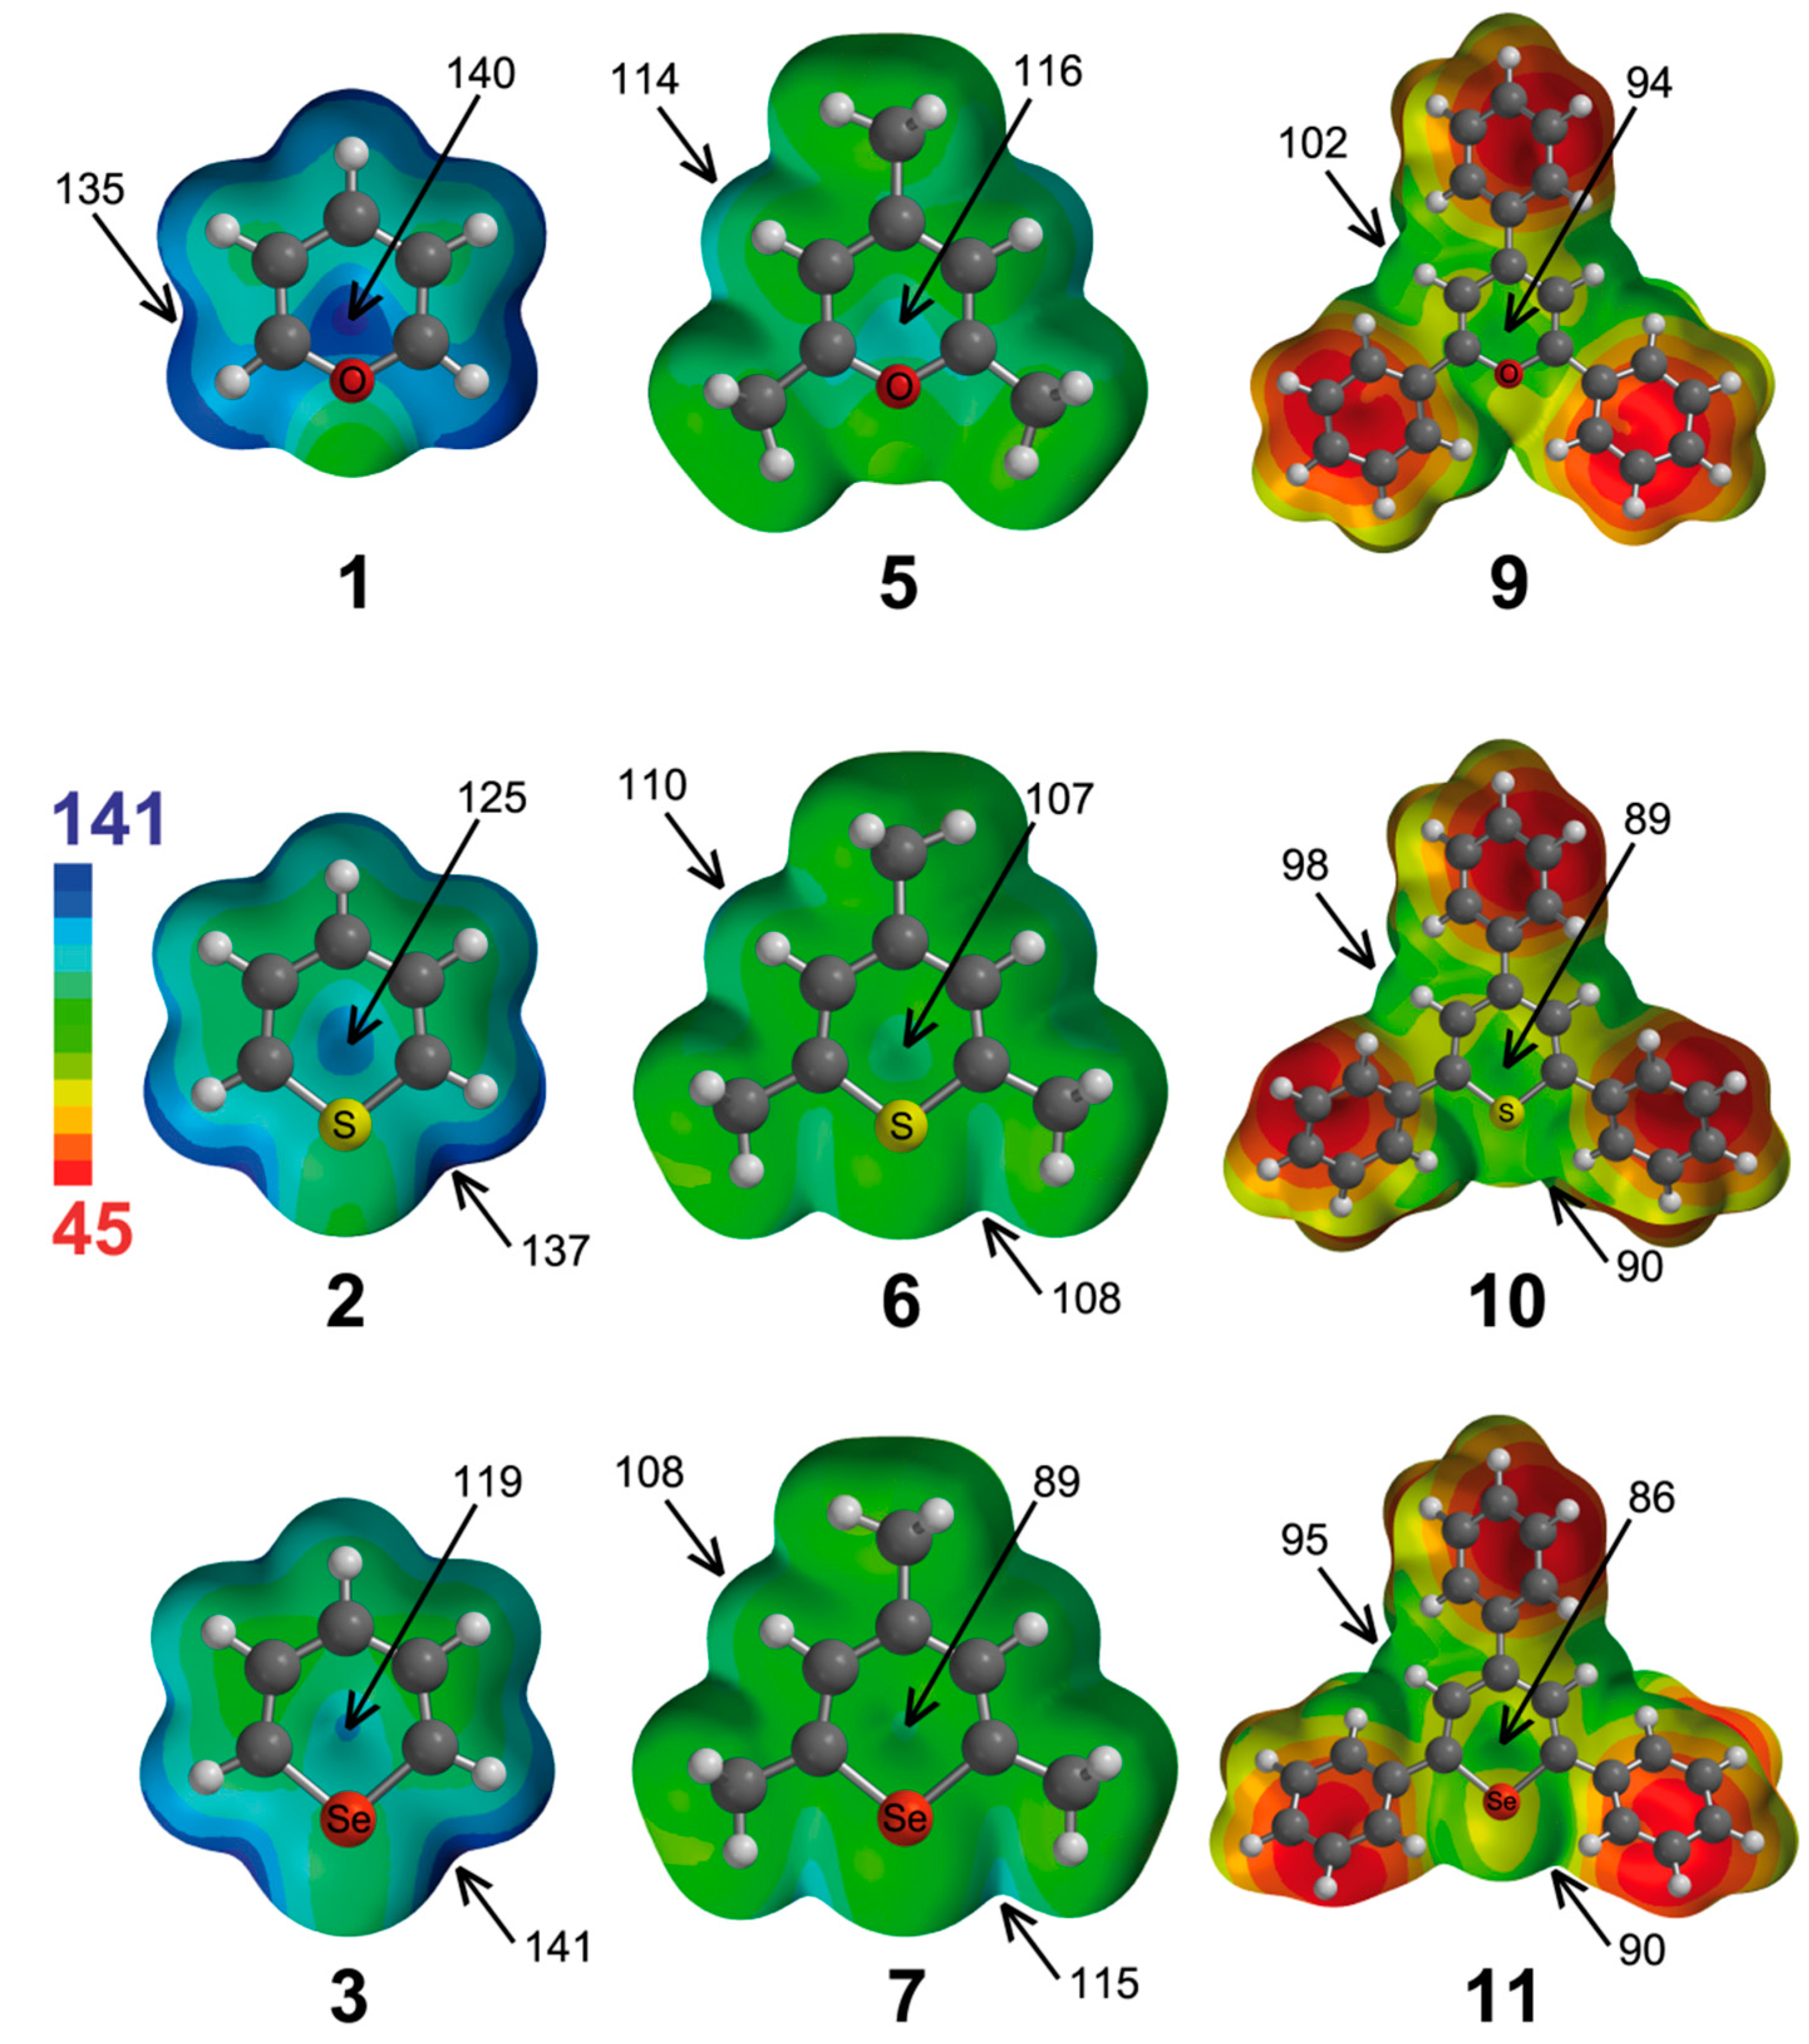
We have also computed the molecular electrostatic potential (MEP) surfaces of the pyrylium cations and analogues (except from tellurium compounds), which are represented in
Figure 2. From the analysis of the MEPs, several considerations can be made. The pyrylium Compound
1 has the highest electrostatic potential (ESP = 140 kcal·mol
−1) located at the center of the molecule, although a little bit displaced towards the location of the oxygen atom. The ESPs associated with in-plane interactions are 5 kcal·mol
−1 lower in energy. If we change the X atom, we observe how the ESP located above the molecular plane diminishes (to 125 and 119 kcal·mol
−1 for
2 and
3, respectively). Interestingly, the highest ESP for
2 and
3 is located at both sides of the X atom (137 and 141 kcal·mol
−1, respectively). Therefore, from electrostatic considerations, the most favorable anion complex of
1 would be that where the anion is positioned above the ring, whereas the most favorable complexes of
2 and
3 would be those where the anion is located in the molecular plane and close to the X atom. However, for π interactions, polarization effects can be important, and the prediction based only on electrostatic effects may not be adequate. As inferred from
Figure 2, the trimethyl Derivatives
5–
7 have less positive values of ESP than their respective unsubstituted counterparts, and likewise, the triphenyl Analogues
9–
11 have less positive ESP values than their respective trimethyl derivatives.
2.2. Complexes with Cl–
First, we are going to analyze the complexes of Compounds
1–
12 that are formed with chloride. After exploring the potential energy surface of the different complexes, four main structural configurations were found. Type
a and
b complexes are the result of a nucleophilic attack of the anion to C1 and C3 atoms, respectively, of the heteroaromatic ring, giving rise to σ-complexes. Thus, according to our nomenclature,
1a will be the σ-complex of
1 with Cl
–. In Type
c complexes, the anion is located above the molecular plane, either interacting with C1 and C5 or the chalcogen atom. Lastly, Type
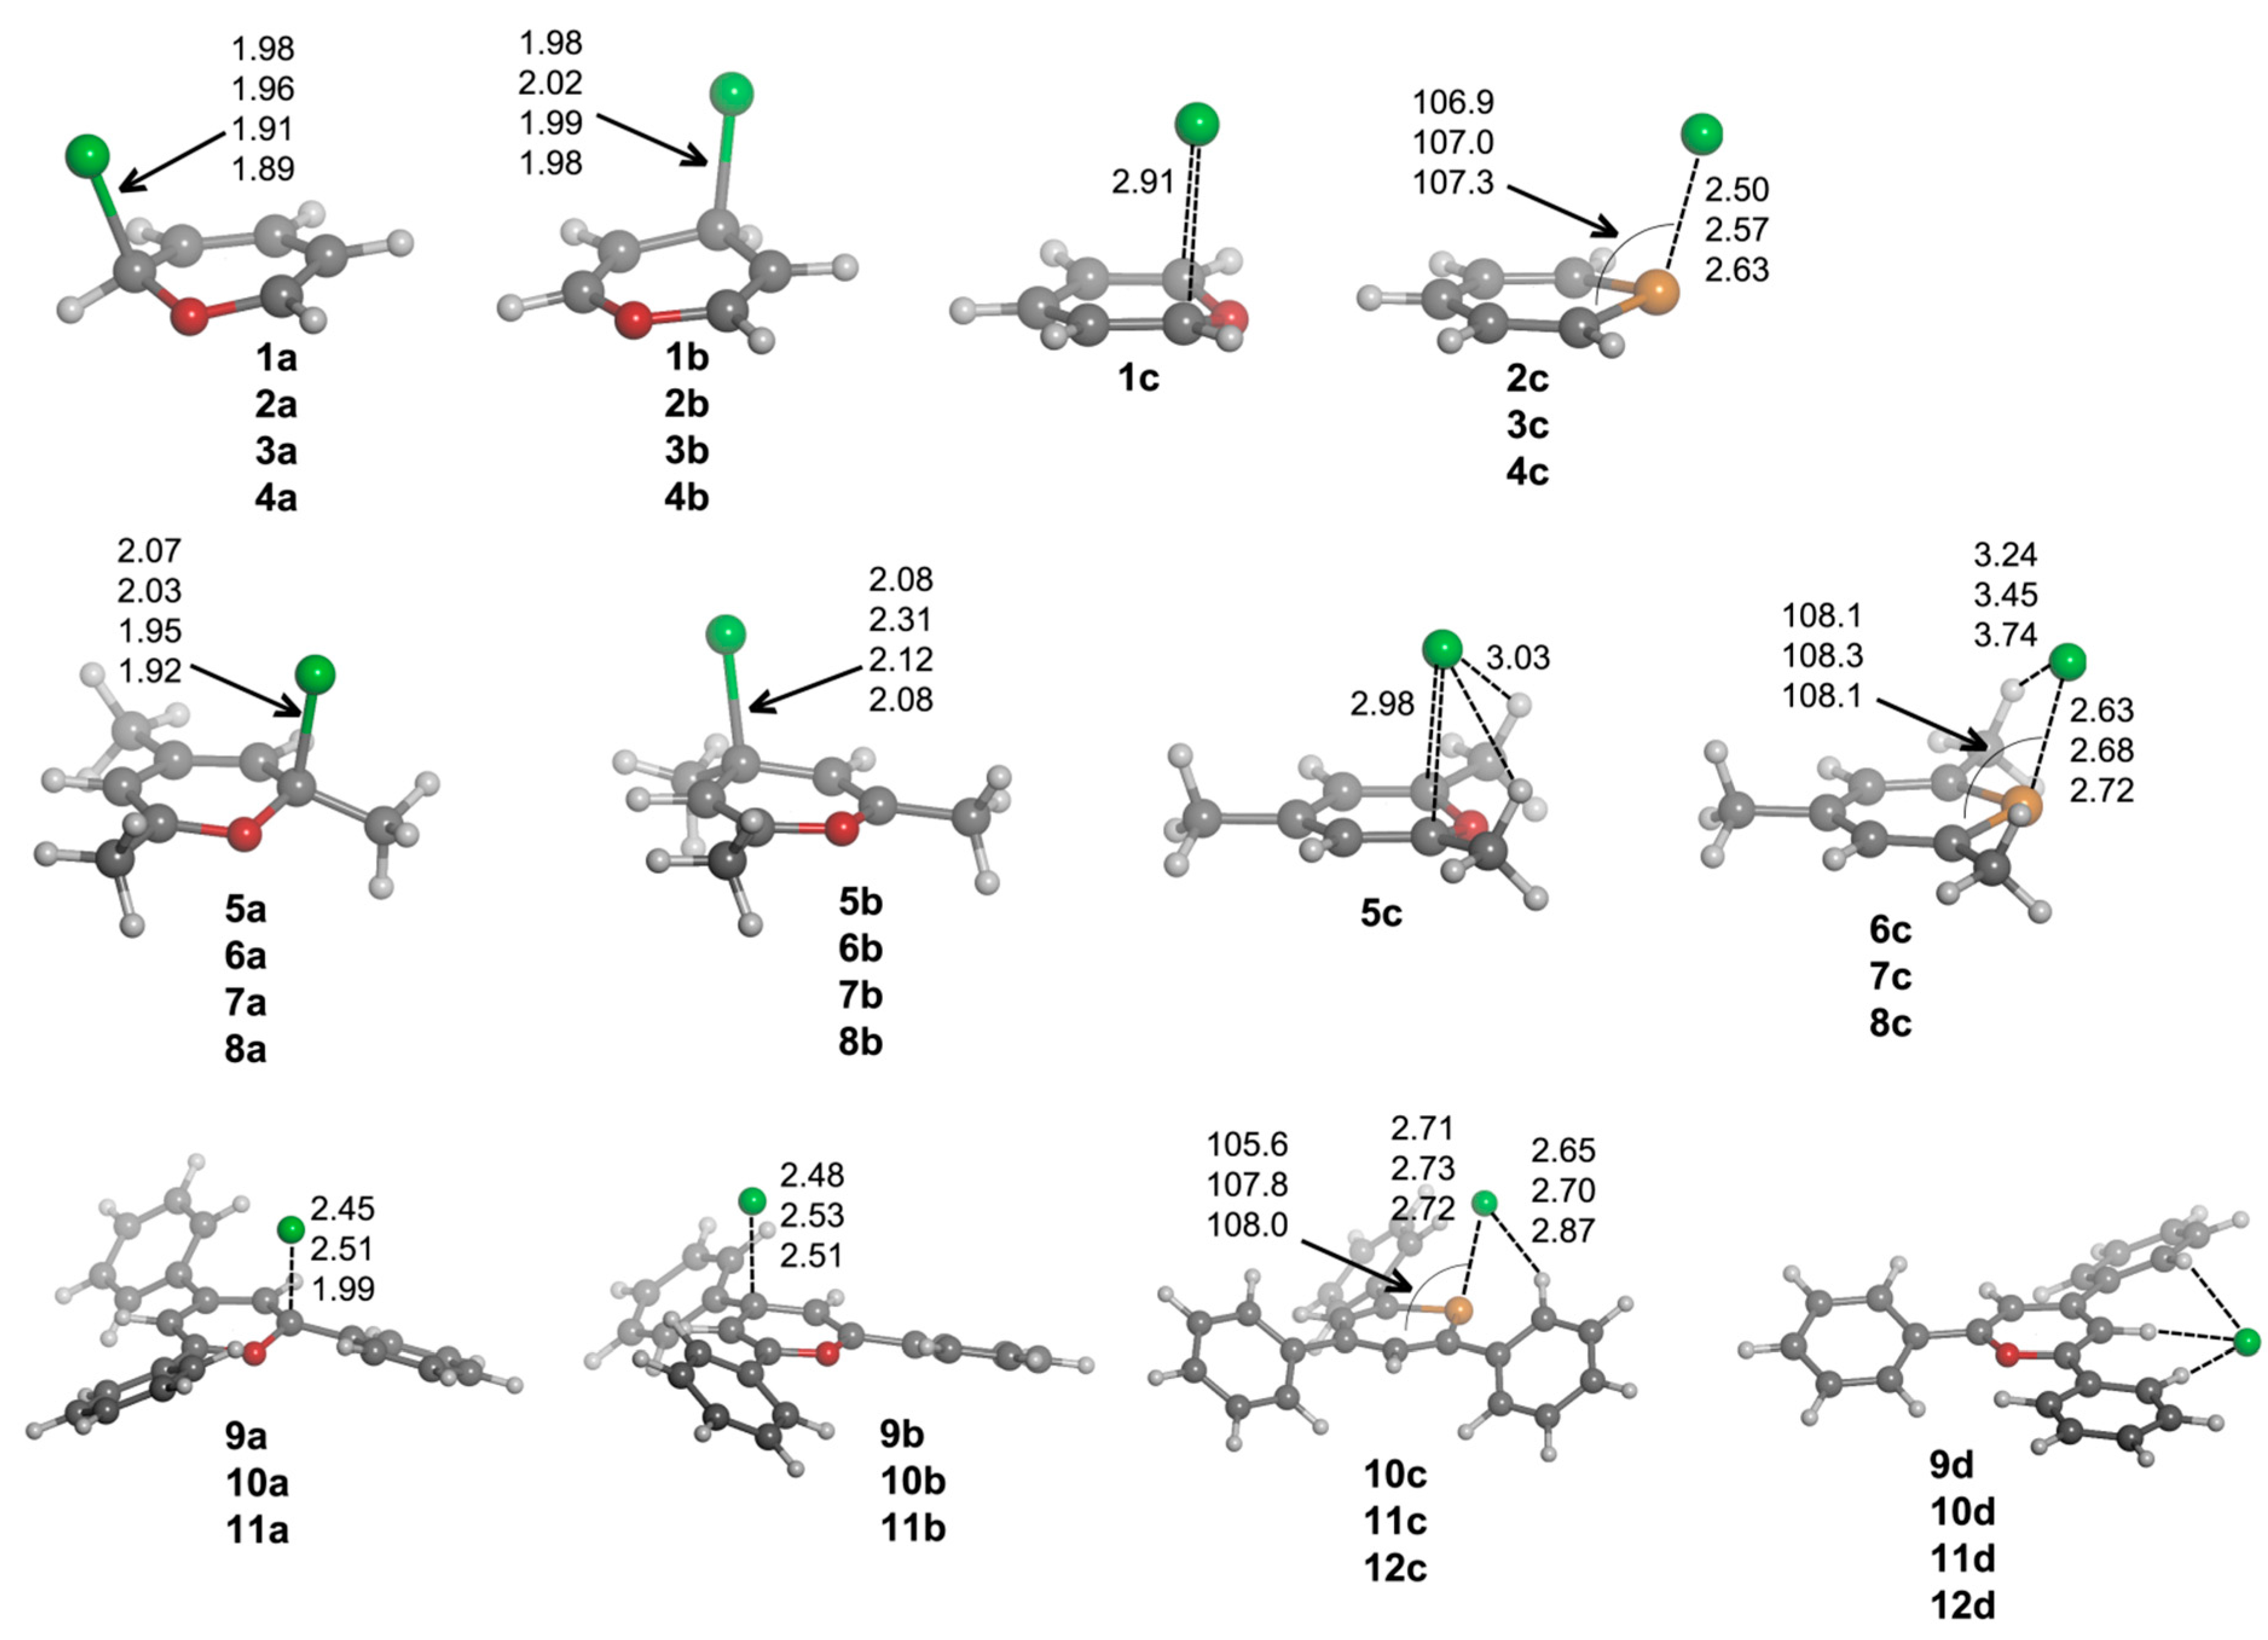
d complexes are based on hydrogen bonding interactions. Several geometrical features of the complexes with chloride are shown in
Figure 3, and their corresponding binding energies are gathered in
Table 2.
From the inspection of the results, several points arise. For either
a and
b type complexes and within every family of compounds (unsubstituted, trimethyl and triphenyl substituted), the Cl–C distance is shortened when going down the chalcogen group. This result is consistent with the electrophilic character of the heteroaromatic ring, which is increased when going from O to Te atoms. Moreover, the Cl–C distance is increasingly lengthened when trimethyl and triphenyl substitution is considered, in agreement with the electrostatic results retrieved from MEP calculations (
Figure 2). Second,
a complexes have shorter Cl–C distances than
b complex. Third,
12a·Cl
– and
12b·Cl
– adducts could not be located. All attempts to find such complexes led to
12c·Cl
–. For
c complexes, we observe a slightly different placement of the anion if X = O (
1c) or X = S, Se, Te (
2c–
4c) are considered. In Complex
1c, the anion is located above the molecule and between C1 and C5, forcing the out-of-plane displacement of the oxygen atom opposite of Cl
–. In fact, this complex is not a minimum on the potential energy surface, but a TS corresponding to the chloride transfer from the σ-complex on C1 (
1a·Cl
–) to its degenerate σ-complex on C5 [
33]. However, for
2c–
4c complexes, Cl
– is parallel displaced towards the X atom, giving rise to a ClXC3 angle of
ca. 107°. Moreover, for such complexes, the X atoms are pulled from the molecular plane towards the anion yielding Cl
–···X distances (2.50, 2.57 and 2.63 Å for
2c,
3c and
4c, respectively) that are remarkably much shorter than the sum of the van der Waals radii (3.91, 4.01 and 4.17 Å, respectively) [
34,
35]. In fact, all intermolecular contacts reported throughout the manuscript are substantially shorter than the sum of the corresponding van der Waals radii. Analogously to
a and
b complexes, the Cl
–···X distance in
c complexes is increasingly lengthened when trimethyl and triphenyl substitution is considered, which could be due, on the one hand, to the decrease in electrophilic character of the heteroaromatic ring for the trimethyl and triphenyl systems (
Figure 2) and, on the other hand, to the presence of CH···Cl
– hydrogen bonds that slightly lower the net charge on the anion. These hydrogen bonds appear to be particularly important for the triphenyl derivatives, since their respective hydrogen bond distances are short (2.65–2.87 Å).
Figure 2.
Molecular electrostatic potential surfaces of Molecules 1–3, 5–7 and 9–11. Some molecular electrostatic potential (MEP) energy values are indicated. Energies in kcal·mol−1.
Figure 2.
Molecular electrostatic potential surfaces of Molecules 1–3, 5–7 and 9–11. Some molecular electrostatic potential (MEP) energy values are indicated. Energies in kcal·mol−1.
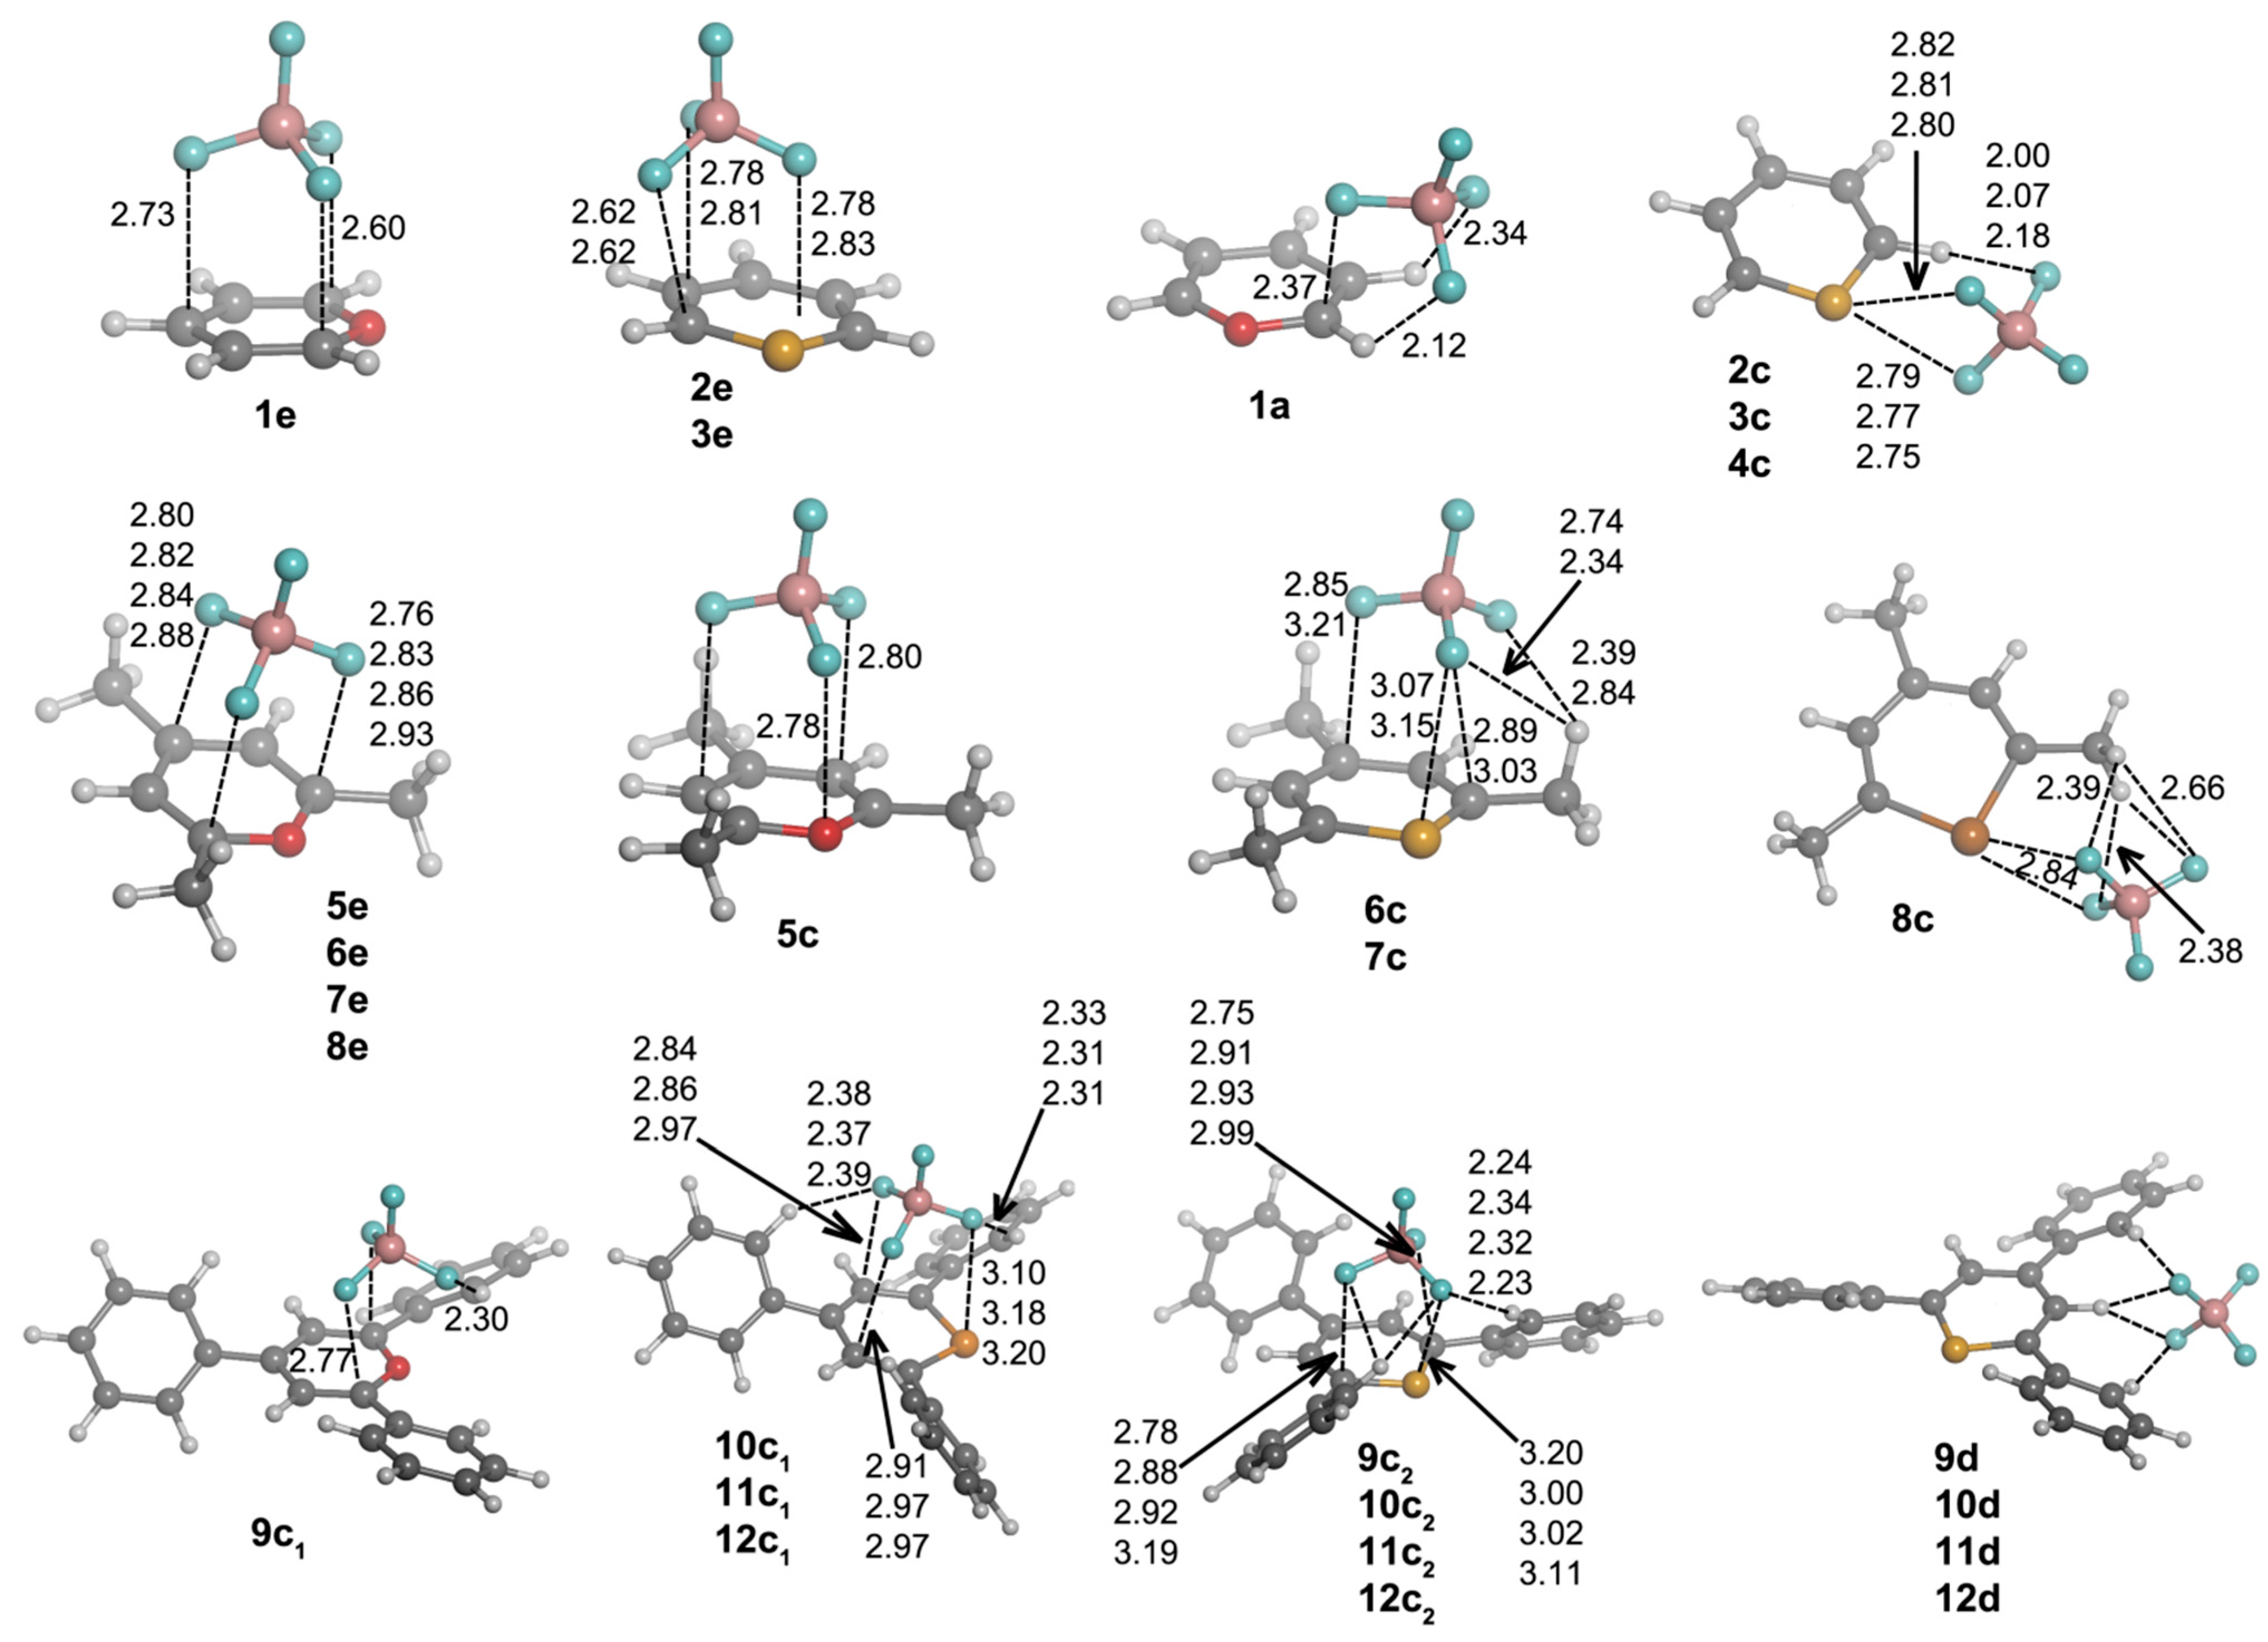
Figure 3.
Optimized geometries of a·Cl–, b·Cl–, c·Cl– and d·Cl– complexes. Selected distances (in angstroms) and angles (in degrees) are shown.
Figure 3.
Optimized geometries of a·Cl–, b·Cl–, c·Cl– and d·Cl– complexes. Selected distances (in angstroms) and angles (in degrees) are shown.
Every attempt to obtain exclusively hydrogen bond-based complexes was unsuccessful for
1–
8 compounds, and the geometry optimizations always ended up yielding one of the geometries mentioned above. However, hydrogen bond complexes (Type
d) were obtained for
9–
12, and their geometries are shown in
Figure 3. All of these Type
d complexes have the same recognition pattern, where the anion is interacting with two hydrogen atoms in ortho to two phenyl rings, with the hydrogen atom bonded to C2. The CH···Cl
– distance oscillates from 2.28–2.54 Å for X = O to 2.44–2.74 Å for X = Te.
Table 2.
Interaction energies (∆E, in kcal·mol−1), electron density (ρBCP), its Laplacian (∇2 ρBCP) and the total electron energy density (HBCP) for the bond critical points (BCPs) of Cl–···C or Cl–···X contacts of complexes of Compounds 1–12 with Cl– and the number of imaginary frequencies (Nimag).
| Complex | ∆E | Nimag | ρBCP × 102 | ∇2 ρBCP × 102 | HBCP |
|---|
| 1a·Cl– | −116.0 | 0 | 12.43 | −2.94 | −5.55 |
| 2a·Cl– | −109.3 | 0 | 12.62 | −3.11 | −5.74 |
| 3a·Cl– | −110.9 | 0 | 13.98 | −6.91 | −7.10 |
| 4a·Cl– | −109.8 | 0 | - | - | - |
| 1b·Cl– | −115.2 | 0 | 11.94 | −2.29 | −5.26 |
| 2b·Cl– | −109.8 | 0 | 11.06 | 0.03 | −4.48 |
| 3b·Cl– | −110.0 | 0 | 11.62 | −1.35 | −4.97 |
| 4b·Cl– | −107.9 | 0 | - | - | - |
| 1c·Cl– | −101.2 | 1 | - | - | - |
| 2c·Cl– | −106.4 | 0 | 6.10 | 8.47 | −1.03 |
| 3c·Cl– | −108.8 | 0 | 5.76 | 7.97 | −0.97 |
| 4c·Cl– | −114.0 | 0 | - | - | - |
| 5a·Cl– | −99.8 | 0 | 10.17 | 1.70 | −3.65 |
| 6a·Cl– | −95.4 | 0 | 10.98 | 0.39 | −4.30 |
| 7a·Cl– | −97.3 | 0 | 12.90 | −4.30 | −6.05 |
| 8a·Cl– | −97.6 | 0 | - | - | - |
| 5b·Cl– | −98.4 | 0 | 9.81 | 2.09 | −3.49 |
| 6b·Cl– | −92.3 | 1 | 6.10 | 6.75 | −1.10 |
| 7b·Cl– | −93.0 | 1 | 9.00 | 3.52 | −2.87 |
| 8b·Cl– | −92.4 | 1 | - | - | - |
| 5c·Cl– | −93.6 | 1 | - | - | - |
| 6c·Cl– | −95.5 | 1 | 4.73 | 8.19 | −0.51 |
| 7c·Cl– | −97.1 | 1 | 4.69 | 7.84 | −0.52 |
| 8c·Cl– | −101.3 | 2 | - | - | - |
| 9a·Cl– | −84.9 | 2 | - | - | - |
| 10a·Cl– | −83.1 | 1 | - | - | - |
| 11a·Cl– | −84.2 | 1 | - | - | - |
| 9b·Cl– | −82.9 | 1 | - | - | - |
| 10b·Cl– | −83.7 | 0 | - | - | - |
| 11b·Cl– | −83.9 | 2 | - | - | - |
| 10c·Cl– | −88.7 | 0 | 4.12 | 7.46 | −0.33 |
| 11c·Cl– | −91.0 | 0 | 4.24 | 7.32 | −0.37 |
| 12c·Cl– | −96.3 | 0 | - | - | - |
| 9d·Cl– | −83.0 | 2 | - | - | - |
| 10d·Cl– | −77.5 | 0 | - | - | - |
| 11d·Cl– | −80.7 | 0 | - | - | - |
| 12d·Cl– | −79.2 | 0 | - | - | - |
The interaction energies of all complexes are large and negative, as shown in
Table 2, ranging from −116.0 kcal·mol
–1 for
1a·Cl
– to −77.5 kcal·mol
–1 for
10d·Cl
–, values than can be rationalized from the electrostatic point of view. The largest binding energies are generally found for
a and
b σ-complexes: For the unsubstituted compounds, we usually obtain the largest binding energies for
a complexes. Analogously, the same trend is also observed for the trisubstituted derivatives,
i.e.,
a complexes have larger ∆
E values than
b complexes, with
c complexes having the smallest binding energies. However, we observe that the energy gap between
a and
c complexes gets smaller when going from
1 (∆∆
E = 4.8 kcal·mol
−1) to
3 (∆∆
E = 0.9 kcal·mol
−1). In fact, for Compound
4, its
c complex is more favorable than its
a complex by 5.2 kcal·mol
−1, leading to the conclusion that the more electrophilic the X atom, the more favorable the
c complex. A similar behavior is observed for complexes of
5–
8, with ∆∆
E values between
a and
c complexes of 6.2, 0.2 and −3.7 kcal·mol
−1 for
1,
3 and
4, respectively. Strikingly, for Compounds
10–
12, their
c complexes are the most favorable (neither
9c·Cl
– nor
12a·Cl
– could be located). For instance, the energy gap between
a and
c chloride complexes is −5.6 and −6.8 kcal·mol
−1 for
10 and
11, respectively.
To investigate the origin and nature of these interactions, AIM, NBO and SAPT studies have been carried out for selected complexes. We have examined all possible intermolecular interactions between occupied (donor) Lewis-type NBOs and vacant (acceptor) non-Lewis NBOs and estimated their energetic importance by second-order perturbation theory. According to the NBO analysis, the interaction in
c complexes of X = S, Se and Te is primarily based on a charge donation from the lone pairs of Cl
– to the vacant π* orbital of the X–C1 or X–C5 bond, as derived from the calculated second-order orbital perturbation energies listed in
Table 3. As a matter of fact, these charge-transfer contributions are very large, with increasing energies as we move from the lightest (44.9 kcal·mol
−1 for
2c·Cl
–) to the heaviest (62.3 kcal·mol
−1 for
4c·Cl
–) chalcogens for the unsubstituted complexes. The same trend is observed for the trimethyl derivatives, although with smaller energy contributions than those for their respective unsubstituted cases. Moreover, there is an excellent linear correlation (
r2 = 0.969) between the binding energies (∆
E in
Table 2) and the second-order orbital perturbation energies (
E(2) in
Table 3) mentioned above for
2c–
4c·Cl
– and
6c–
8c·Cl
– complexes, indicating that these Lp(Cl
–)→π*(X–C1/C5) donor-acceptor contributions are very relevant (
Figure 4). It is worth mentioning the existence of other charge-transfer contributions of up to 3.7 kcal·mol
−1 that arise from the charge donation from Cl
– lone pairs to empty d orbitals of S, Se and Te (
Table 3). All of these results suggest the existence of a chalcogen bond through π-hole interactions. Differently from
2c–
4c·Cl
– and
6c–
8c·Cl
– complexes, there is no charge transfer from Cl
– to either O–C1 or O–C5 empty π* orbitals in
1c·Cl
– and
5c·Cl
–. Instead, modest energetic contributions are obtained from Lp(Cl
–)→π*(C1–C2) and Lp(Cl
–)→π*(C4–C5) donor-acceptor interactions, leading to anion-π interactions. The absence of charge transfer processes in
1c·Cl
– and
5c·Cl
– indicates that induction forces are not important in their binding mechanism, which will be primarily based on electrostatics, as we will see later in the SAPT analysis. As already noted, the geometries of X = O complexes are different from the X = S, Se and Te ones (X is moving away with respect to the anion for the former and getting closer to the anion for the latter), giving rise to a different binding mechanism, where induction forces are supposed to play an important role in the latter compounds.
Table 3.
Natural bond orbital (NBO) second-order orbital perturbation energies (E(2), in kcal·mol−1) derived from charge donation from an occupied (donor) to an empty (acceptor) orbital for Complexes 1c–8c·Cl–.
Table 3.
Natural bond orbital (NBO) second-order orbital perturbation energies (E(2), in kcal·mol−1) derived from charge donation from an occupied (donor) to an empty (acceptor) orbital for Complexes 1c–8c·Cl–.
| Complex | Donor | Acceptor | E(2) |
|---|
| 1c·Cl– | Lp(Cl–) | π*(C1–C2) | 4.5 |
| π*(C4–C5) | 4.5 |
| 2c·Cl– | Lp(Cl–) | π*(S–C1) | 44.9 |
| Ry*(S) | 3.7 |
| 3c·Cl– | Lp(Cl–) | π*(Se–C5) | 52.1 |
| Ry*(Se) | 2.3 |
| 4c·Cl– | Lp(Cl–) | π*(Te–C1) | 62.3 |
| 2.6 |
| 5c·Cl– | Lp(Cl–) | π*(C1–C2) | 3.8 |
| π*(C4–C5) | 3.8 |
| 6c·Cl– | Lp(Cl–) | π*(S–C5) | 23.7 |
| Ry*(S) | 2.7 |
| 7c·Cl– | Lp(Cl–) | π*(Se–C5) | 30.9 |
| Ry*(Se) | 1.6 |
| 8c·Cl– | Lp(Cl–) | π*(Te–C5) | 41.4 |
| Ry*(Te) | 2.3 |
Figure 4.
Selected second-order perturbation energies, E(2), plotted vs. the computed binding energies, ∆E, for 2c–4c·Cl– and 6c–8c·Cl– complexes.
Figure 4.
Selected second-order perturbation energies, E(2), plotted vs. the computed binding energies, ∆E, for 2c–4c·Cl– and 6c–8c·Cl– complexes.
In line with the NBO results, our AIM calculations for
2c–
3c·Cl
–,
6c–
7c·Cl
– and
10c–
11c·Cl
– complexes show the existence of one BCP connecting the X atom with Cl
– (
Figure 5). The values of the electron densities at these BCPs range between 0.061 au for
2c·Cl
– and 0.041 au for
10c·Cl
– (
Table 2). At these BCPs, the values of the Laplacian are positive, and the total energy densities are negative (between −0.010 and −0.003 au), suggesting that these interactions have a certain covalent character [
36].
Figure 5.
Molecular graphs of 2c, 7c and 11c·Cl–. The BCPs and ring critical points are represented by green and red dots, respectively. Only bond paths are depicted.
Figure 5.
Molecular graphs of 2c, 7c and 11c·Cl–. The BCPs and ring critical points are represented by green and red dots, respectively. Only bond paths are depicted.
In addition, the nature of the chemical bond in
1a–
7a·Cl
– and
1b–
7b·Cl
– σ-complexes has been analyzed by means of the AIM approach. From the inspection of the results (
Table 2), the values of the electron density at the BCP originating from the Cl
– ···C1/C3 contact are large (between 0.14 and 0.06 au) with values of the Laplacian oscillating between negative (
1a–
3a,
7a,
1b and
3b) and positive (
5a–
6a,
2b and
5b–
7b). However, the total energy density for all cases is negative (between −0.071 and −0.011 au;
Table 2), indicating that there is a significant sharing of electrons for this contact.
The physical nature of the interaction between the anion and Compounds
1–
3,
5–
7 and
9–
11 has been analyzed by means of SAPT calculations in
c complexes. The energy contributions obtained from the SAPT partitioning scheme are listed in
Table 4. As expected, the electrostatic component,
Eel, is the largest contributor to the interaction with values ranging from −103.8–−138.1 kcal·mol
−1. The
Eel values vary according to the electronegativity of the X atom,
i.e., the smallest and largest contributions are found for X = O and X = Se, respectively. The positive exchange part is large and partly compensates for the electrostatic component, especially for X = S, Se complexes. The dispersion contribution is more or less constant for S and Se complexes and larger than that for O complexes. The induction-polarization contribution,
Eind, however, seems to play an important role in the interaction, since large variations are detected, in line with the donor-acceptor NBO results. Thus,
Eind is small for the oxygen-based
1c and
5c·Cl
– complexes (
ca. −12 kcal·mol
−1), large for sulfur-based
2c,
6c and
10c·Cl
– complexes (from −24 to −34 kcal·mol
−1) and the largest for selenium-based
3c,
7c, and
11c·Cl
– complexes (from −34–−48 kcal·mol
−1). The consideration of higher-order contributions to the interaction energy, δHF (
Table 4), is mandatory at least for X = S compounds to get a good agreement between SAPT interaction energies,
ESAPT, and the binding energies.
Table 4.
DF-DFT-symmetry-adapted perturbation theory (SAPT) electrostatic, exchange, induction, dispersion and Hartree-Fock higher-order energy contributions (Eel, Eexch, Eind, Edis and δHF, respectively), SAPT interaction energy (ESAPT) and binding energies (∆E) of selected complexes. Energies in kcal·mol−1.
| Complex | Eel | Eexch | Eind | Edisp | δHF | ESAPT | ∆E |
|---|
| 1c·Cl– | −112.0 | 38.6 | −12.2 | −10.5 | −4.6 | −100.7 | −101.2 |
| 2c·Cl– | −132.7 | 89.8 | −34.5 | −14.1 | −10.0 | −101.6 | −106.4 |
| 3c·Cl– | −138.1 | 93.6 | −48.0 | −14.0 | −2.1 | −108.6 | −108.8 |
| 5c·Cl– | −104.7 | 36.7 | −12.1 | −11.9 | −2.2 | −94.3 | −93.6 |
| 6c·Cl– | −114.7 | 67.9 | −24.4 | −13.4 | −6.0 | −90.5 | −95.5 |
| 7c·Cl– | −119.8 | 74.1 | −34.4 | −13.4 | −1.3 | −94.8 | −97.1 |
| 10c·Cl– | −103.8 | 66.8 | −25.6 | −15.9 | −6.0 | −84.6 | −88.7 |
| 11c·Cl– | −110.3 | 74.6 | −34.9 | −16.1 | −2.3 | −89.0 | −91.0 |
| 2c·NO3– | −105.4 | 49.3 | −14.0 | −11.9 | −7.3 | −89.2 | −96.4 |
| 3c·NO3– | −111.2 | 57.5 | −19.3 | −12.5 | −8.0 | −93.4 | −97.3 |
| 5e·NO3– | −93.2 | 26.8 | −7.1 | −14.0 | −2.8 | −90.4 | −90.9 |
| 6e·NO3– | −91.0 | 26.7 | −7.6 | −14.2 | −2.8 | −89.0 | −89.0 |
| 7e·NO3– | −89.8 | 26.4 | −7.8 | −14.3 | −2.8 | −88.3 | −88.7 |
| 11c1·NO3– | −80.0 | 32.1 | −13.5 | −13.9 | −3.6 | −78.9 | −82.3 |
| 12c1·NO3– | −81.3 | 34.8 | −14.6 | −13.9 | −3.9 | −79.0 | −83.8 |
| 1e·BF4– | −96.3 | 26.2 | −6.5 | −10.0 | −2.8 | −89.4 | −89.3 |
| 2e·BF4– | −91.3 | 24.0 | −6.5 | −9.8 | −2.5 | −86.2 | −85.8 |
| 3e·BF4– | −90.4 | 24.6 | −6.8 | −9.9 | −2.7 | −85.2 | −84.9 |
| 1a·BF4– | −94.7 | 29.9 | −7.8 | −9.1 | −4.8 | −86.5 | −87.2 |
| 2c·BF4– | −88.2 | 24.4 | −8.8 | −8.4 | −3.6 | −84.6 | −84.7 |
| 3c·BF4– | −91.4 | 27.2 | −10.0 | −9.0 | −4.0 | −87.2 | −86.8 |
| 5e·BF4– | −88.6 | 22.7 | −7.2 | −11.1 | −1.9 | −86.1 | −85.6 |
| 6e·BF4– | −85.2 | 21.6 | −7.3 | −10.8 | −1.7 | −84.9 | −82.9 |
| 7e·BF4– | −85.6 | 22.0 | −7.6 | −11.4 | −1.8 | −84.3 | −82.3 |
| 10c2·BF4– | −73.9 | 23.0 | −11.2 | −12.6 | −2.1 | −76.8 | −74.8 |
| 11c2·BF4– | −73.3 | 23.2 | −11.3 | −12.3 | −2.3 | −76.0 | −74.1 |
2.3. Complexes with NO3–
In this second section, we are going to analyze the complexes formed by Compounds
1–
12 with nitrate as the anion. The exploration of the potential energy surface leads to the formation of five main structural configurations: Type
a,
b and
d complexes, just as defined in the previous subsection, Type
c complexes, which are very similar to the ones found for chloride, but now the anion is interacting either with the chalcogen atom or a C atom and the chalcogen atom, and the new Type
e complexes, where the anion is solely interacting with C atoms above the molecular heteroaromatic ring. The geometries of the complexes can be found in
Figure 6, and their respective binding energies are listed in
Table 5.
Complexes
a and
b follow the same trend observed for chloride complexes,
i.e., the O
2NO–C distance shortens/lengthens with the size of the chalcogen atom/with trisubstitution, and
a complexes have shorter O
2NO–C distances than
b complexes. However,
a and
b complexes are only obtained for the unsubstituted Compounds
1–
4. In
c·NO
3– complexes, different orientations of nitrate are observed. For unsubstituted compounds, the nitrate is perpendicularly placed above the heteroaromatic ring, giving rise to short O
2NO
–···X contacts in
2c–
4c·NO
3– (
Figure 6), similarly to what is observed for
2c–
4c·Cl
–. Type
c complexes for the trimethyl derivatives fall into two subcategories, depending on whether the anion is almost perpendicularly placed above,
c1, or not,
c2, the ring. In
5c1–
7c1 complexes, the anion is slightly displaced towards the C1 half of the aromatic system, yielding three short contacts, as inferred from the distances between one O atom of nitrate with both an X and an H atom of the C1 methyl group and between another O atom of NO
3– with C1, as shown in
Figure 6. The
c1 complex of
8 could not be found. In
5c2–
8c2 complexes, the anion presents to different binding modes: all three O atoms of nitrate in
5c2 are interacting with two H atoms of C1 and C5 methyl groups, keeping the N atom sufficiently close to the O atom of the ring to expect a certain interaction. Conversely, in
6c2–
8c2 complexes, two O atoms of the anion are equidistant to the X atom. In addition, these two O atoms are engaged in equidistant hydrogen-bonding interactions with each O atom with one H atom of the C5 methyl group. In triphenyl
c complexes, two different NO
3– orientations are observed: those similar to the unsubstituted ones,
9c–
10c, and those similar to the trimethyl
c1 complexes,
10c1–
12c1. The
c complexes of
11 and
12 and the
c1 complex of
9 could not be found. The main difference between
c and
c1 complexes resides in the contacts between an O atom of nitrate and C1 and/or C5 atoms of the heteroaromatic system (
Figure 6). Furthermore, the intermolecular O
2NO
–···X contacts are shorter for
c1 than for
c complexes. All of these
c and
c1 complexes present CH···ONO
2– hydrogen bonds with the H atoms in ortho to the C1 and C5 phenyl moieties.
Table 5.
Interaction energies (∆E, in kcal·mol−1), electron density (ρBCP), its Laplacian (∇2 ρBCP) and the total electron energy density (HBCP) for the BCPs of O2NO–···C contacts of complexes of Compounds 1–12 with NO3– and the number of imaginary frequencies (Nimag).
Table 5.
Interaction energies (∆E, in kcal·mol−1), electron density (ρBCP), its Laplacian (∇2 ρBCP) and the total electron energy density (HBCP) for the BCPs of O2NO–···C contacts of complexes of Compounds 1–12 with NO3– and the number of imaginary frequencies (Nimag).
| Complex | ∆E | Nimag | ρBCP × 102 | ∇2 ρBCP × 102 | HBCP × 102 |
|---|
| 1a·NO3– | −108.9 | 0 | 20.58 | −28.06 | −23.62 |
| 2a·NO3– | −103.0 | 0 | 21.79 | −33.63 | −21.21 |
| 3a·NO3– | −105.3 | 0 | 22.87 | −39.79 | −24.12 |
| 4a·NO3– | −104.8 | 0 | - | - | - |
| 1b·NO3– | −109.0 | 0 | 20.24 | −26.26 | −18.53 |
| 2b·NO3– | −102.8 | 0 | 19.97 | −24.49 | −17.91 |
| 3b·NO3– | −103.0 | 0 | 20.29 | −26.19 | −18.63 |
| 4b·NO3– | −100.9 | 0 | - | - | - |
| 2c·NO3– | −96.4 | 0 | 4.42 | 9.92 | −0.31 |
| 3c·NO3– | −97.3 | 0 | 4.64 | 9.89 | −0.39 |
| 4c·NO3– | −100.1 | 0 | - | - | - |
| 5e·NO3 – a | −90.9 | 0 | 1.47 | 4.89 | 0.18 |
| 6e·NO3 – a | −89.0 | 0 | 1.04 | 3.83 | 0.18 |
| 7e·NO3 – a | −88.7 | 0 | 1.00 | 3.67 | 0.18 |
| 8e·NO3– | −88.0 | 0 | - | - | - |
| 5c1·NO3– | −90.2 | 0 | 3.36(1.04) b | 8.71(4.72) b | 0.00(0.25) b |
| 6c1·NO3– | −88.1 | 0 | 2.14(1.75) b | 6.45(5.20) b | 0.18(0.15) b |
| 7c1·NO3– | −88.6 | 1 | 2.10(1.82) b | 6.33(5.03) b | 0.18(0.14) b |
| 5c2·NO3 – b | −84.2 | 0 | 0.92 | 4.80 | 0.25 |
| 6c2·NO3 – b | −85.4 | 2 | 1.83 | 5.70 | 0.16 |
| 7c2·NO3 – b | −88.7 | 2 | 2.13 | 6.10 | 0.12 |
| 8c2·NO3– | −94.4 | 0 | - | - | - |
| 9e·NO3– | −80.7 | 2 | - | - | - |
| 9c·NO3– | −79.8 | 1 | - | - | - |
| 10c·NO3– | −82.3 | 0 | | | |
| 10c1·NO3– | −82.0 | 0 | 1.36(2.03) b | 4.48(5.66) b | 0.18(0.11) b |
| 11c1·NO3– | −82.3 | 0 | 1.22(2.33) b | 4.01(5.97) b | 0.17(0.08) b |
| 12c1·NO3– | −83.8 | 0 | - | - | - |
| 9d·NO3– | −79.7 | 2 | - | - | - |
| 10d·NO3– | −78.6 | 0 | - | - | - |
| 11d·NO3– | −78.3 | 0 | - | - | - |
| 12d·NO3– | −76.8 | 0 | - | - | - |
Figure 6.
Optimized geometries of a·NO3–, b·NO3–, c·NO3–, d·NO3– and e·NO3– complexes. Selected distances (in angstroms) and angles (in degrees) are shown.
Figure 6.
Optimized geometries of a·NO3–, b·NO3–, c·NO3–, d·NO3– and e·NO3– complexes. Selected distances (in angstroms) and angles (in degrees) are shown.
As in Cl
– complexes, hydrogen bond-based
d complexes could not be found for
1–
8. From the geometries included in
Figure 6, we observe that
9d–
12d complexes have the same recognition pattern, in which the anion is interacting with two H atoms in ortho to two phenyl rings, with the H atom at C2. The CH···ONO
2– distance oscillates from 2.14–2.41 Å for X = O to 2.28–2.55 Å for X = Te.
Finally, e complexes are characterized by showing intermolecular contacts with the C atoms of the heteroaromatic system and were obtained only for Compounds 5–9. Thus, in 5e–8e complexes, the anion is located parallel to and above the ring showing distances of 2.8–3.0 Å between the O atoms of nitrate and the ring plane. Two hydrogen bonds are also observed with the H atoms of C3 and C5 methyl groups. In Complex 9e, the nitrate is located above the heteroaromatic ring and perpendicular to it, giving rise to three intermolecular contacts between one O atom of NO3– and two C atoms (C1 and C5) and between a second NO3– O atom and C3.
The values of the interaction energies of all complexes (
Table 5) range from −109.0 kcal·mol
−1 for
1b·NO
3– to −76.8 kcal·mol
−1 for
12d·NO
3–. The largest binding energies are found for
a and
b σ-complexes, with
a complexes and hydrogen bond-based
d complexes being the most and least favorable ones, respectively. Moreover, complexes where anion···X contacts are found (
c) usually have larger binding energies than those where only C atoms are involved in the interaction with the anion (
e). Substitution affects the binding energies the same way as in chloride complexes,
i.e., unsubstituted complexes are the most favorable (∆
E between −109.0 and −96.4 kcal·mol
−1), followed by their trimethyl (∆
E between −94.4 and −84.2 kcal·mol
−1) and triphenyl derivatives (∆
E between −83.8 and −76.8 kcal·mol
−1).
The origin and nature of these interactions have been analyzed within the frames of NBO, AIM and SAPT theories for selected complexes. According to the NBO analysis, the interaction in 4c is based on a charge donation from the lone pairs of an O atom of NO3– to the vacant π* orbital of the Te–C5 bond, as previously observed for their chloride analogues, resulting in a π-hole chalcogen bond. Results for 2c and 3c complexes show some inconsistencies and therefore are not reported. In contrast, interaction in 5c2–8c2 complexes come from Lp(ONO3)→σ*(X–C5) donor-acceptor contributions, except for 5c2, where contributions are based on charge transfer from the anion to H atoms of the methyl groups. Moreover, for this last complex, a very small contribution is found for the Lp(Opyrylium)→π*(N–O) donor-acceptor interaction. Thus, results for 6c2–8c2 suggest the existence of a σ-hole chalcogen bond. Different charge-transfer contributions appear in 5c1–7c1 complexes, where Lp(O)→π*(C1–C2) donor-acceptor interactions for 6c1 and 7c1 and donation from O lone pairs of NO3– to empty p orbitals of C1 are dominant, which will be in agreement with the formation of an anion-π interaction.
Consistent with the NBO results, AIM calculations for
c·NO
3– complexes show the existence of one BCP connecting the X atom with ONO
2– (
Figure 7). The values of the electron densities at these BCPs, comprised between 0.046 au for
3c·NO
3– and 0.009 au for
5c2·NO
3– (
Table 5) and its positive values of the Laplacian are consistent with the existence of noncovalent interactions. However, the total energy densities are negative for
2c and
3c·NO
3– (−0.003 and −0.004 au, respectively), suggesting that these interactions have a small covalent character. In addition, according to the high electron density values (ρ = 0.2 au), and negative values of the Laplacian (between −0.40 and −0.24 au) and total energy densities (between −0.24 and −0.18 au) at the BCPs connecting the anion with the ring,
a·NO
3– and
b·NO
3– σ-complexes have a marked covalent character.
The SAPT analysis of complexes
2c–
3c·NO
3– and
11c2–
12c2·NO
3– (
Table 4) shows similar conclusions to those obtained for chloride complexes. Indeed, the electrostatic component is the largest contributor ranging from −105.4 to −80.0 kcal·mol
−1, and the smallest and largest contributions are found for X = O and X = Se, respectively. The dispersion contribution is practically the same for all complexes and the induction component varies according to the size of the chalcogen. Additionally, again, the consideration of δHF (
Table 4) is very important at least for
2c–
3c compounds to reach an agreement between
ESAPT and ∆
E values. In contrast, exchange, induction, dispersion and δHF contributions are very similar for
5e–
7e·NO
3– complexes, showing only small differences in the electrostatic component, which in the end could be responsible for the observed small differences in the binding energies.
Figure 7.
Molecular graphs of 3c, 5e, 5c1, 5c2, 7c2, 10c1 and 10c2·NO3–. The BCPs, ring and cage critical points are represented by green, red and blue dots, respectively. Only bond paths are depicted.
Figure 7.
Molecular graphs of 3c, 5e, 5c1, 5c2, 7c2, 10c1 and 10c2·NO3–. The BCPs, ring and cage critical points are represented by green, red and blue dots, respectively. Only bond paths are depicted.
2.4. Complexes with BF4–
In this third section, we are going to analyze the complexes formed by Compounds
1–
12 with tetrafluoroborate as the anion. The exploration of the potential energy surface leads to the formation of four main structural configurations: Type
a,
c,
d and
e complexes, analogous to those previously described. The geometries of the complexes are shown in
Figure 8, and their respective binding energies are listed in
Table 6.
Figure 8.
Optimized geometries of a·BF4–,c·BF4–, d·BF4–and e·BF4– complexes. Selected distances (in angstroms) are shown.
Figure 8.
Optimized geometries of a·BF4–,c·BF4–, d·BF4–and e·BF4– complexes. Selected distances (in angstroms) are shown.
There is one Type
a complex,
1a, which exhibits a quite short F···C distance (2.37 Å) coupled with two hydrogen bonds with H atoms of C1 and C2. In
c·BF
4– complexes, different orientations of tetrafluoroborate are observed. For unsubstituted compounds, BF
4– is located establishing two interactions of the F···X type and one hydrogen bond with the H atom at C2 in
2c–
4c·BF
4– (
Figure 8). Type
c complexes for the trimethyl derivatives show two different approximations of the anion. In
5c–
7c, the anion is placed above the ring with three F atoms pointing at the aromatic system. In
5c, two F atoms are facing C2 and C4, and one F atom is facing the oxygen atom. The anion is slightly displaced towards the right half of the molecule in
6c–
7c with two F atoms giving rise to three contacts with C1, C3 and the X atom. In triphenyl
c1 complexes, two F atoms are directed at C2, C4 and a third F atom at X, whereas in
c2 complexes, two F atoms are directed at C1 and C5 and a third F atom at X (
Figure 8), with hydrogen bonds with the H atoms in ortho to the C1 and C5 phenyl moieties. In
Figure 8, we observe that
9d–
12d complexes have the same recognition pattern, in which the anion is interacting with two H atoms in ortho to two phenyl rings and with the H atom at C2. The CH···FBF
3– distance oscillates from 2.07–2.33 Å for X = O to 2.21–2.72 Å for X = Te. Lastly,
e complexes have the anion located above the aromatic ring. As seen in previous BF
4– complexes, the most favorable disposition of the anion is that with three F atoms directed at the aromatic system. In fact, tetrafluoroborate is symmetrically placed, facing C1, C3 and C5 in
1e and
5e–
8e·BF
4–, and a little bit displaced to one side of the molecule in
2e–
3e·BF
4–, as depicted in
Figure 8, most likely due to some sort of interaction between an F atom and X = S, Se.
Table 6.
Interaction energies (∆E, in kcal·mol−1), electron density (ρBCP), its Laplacian (∇2 ρBCP) and the total electron energy density (HBCP) for the BCPs of F3BF–···C contacts of complexes of Compounds 1–12 with BF4– and the number of imaginary frequencies (Nimag).
Table 6.
Interaction energies (∆E, in kcal·mol−1), electron density (ρBCP), its Laplacian (∇2 ρBCP) and the total electron energy density (HBCP) for the BCPs of F3BF–···C contacts of complexes of Compounds 1–12 with BF4– and the number of imaginary frequencies (Nimag).
| Complex | ∆E | Nimag | ρBCP × 102 | ∇2 ρBCP × 102 | HBCP × 102 |
|---|
| 1e·BF4 – a | −89.3 | 0 | 1.63(1.26) | 6.28(4.94) | 0.26(0.24) |
| 2e·BF4 – b | −85.8 | 0 | 1.64(1.11) | 6.53(4.51) | 0.28(0.22) |
| 3e·BF4 – b | −84.9 | 0 | 1.64(1.10) | 6.54(4.66) | 0.28(0.21) |
| 1a·BF4– | −87.2 | 0 | 2.73 | 9.76 | 0.24 |
| 2c·BF4– | −84.7 | 0 | 1.59 | 6.30 | 0.25 |
| 3c·BF4– | −86.8 | 0 | 1.84 | 6.79 | 0.24 |
| 4c·BF4– | −90.5 | 0 | - | - | - |
| 5e·BF4 – a | −85.6 | 0 | 1.17(1.07) | 4.74(4.43) | 0.23(0.22) |
| 6e·BF4 – a | −82.9 | 0 | 1.05(1.03) | 4.32(4.25) | 0.22(22) |
| 7e·BF4 – a | −82.3 | 0 | 1.02(1.00) | 4.07(4.13) | 0.20(0.21) |
| 8e·BF4– | −81.1 | 0 | - | - | - |
| 5c·BF4 – b | −84.9 | 0 | 1.05 | 5.52 | 0.30 |
| 6c·BF4 – b | −82.1 | 0 | 1.05 | 4.28 | 0.22 |
| 7c·BF4 – b | −81.4 | 0 | 0.99 | 3.61 | 0.18 |
| 8c·BF4– | −82.4 | 1 | - | - | - |
| 9c1·BF4– | −72.1 | 1 | - | - | - |
| 10c1·BF4– | −73.9 | 0 | - | - | - |
| 11c1·BF4– | −73.4 | 1 | - | - | - |
| 12c1·BF4– | −73.5 | 0 | - | - | - |
| 9c2·BF4– | −73.6 | 2 | 1.20(0.43) b | 4.82(1.97) b | 0.23(0.12) b |
| 10c2·BF4– | −74.8 | 0 | 0.95(1.18) b | 3.77(4.37) b | 0.19(0.20) b |
| 11c2·BF4– | −74.1 | 0 | 0.89(1.28) b | 3.49(4.38) b | 0.18(0.19) b |
| 12c2·BF4– | −74.1 | 0 | - | - | - |
| 9d·BF4– | −73.8 | 1 | - | - | - |
| 10d·BF4– | −72.5 | 0 | - | - | - |
| 11d·BF4– | −72.0 | 0 | - | - | - |
| 12d·BF4– | −70.8 | 0 | - | - | - |
The values of the interaction energies are the smallest of all of the anion series (
Table 6), ranging from −90.5 kcal·mol
−1 for
4c·BF
4– to −70.8 kcal·mol
−1 for
12d·BF
4–. The largest binding energies are found for the unsubstituted complexes, and
d complexes are the least favorable ones. Substitution affects the binding energies the same way as in chloride and nitrate complexes.
The NBO analysis of BF4– complexes offers interesting results. In 2c–4c complexes, the interaction is mainly based on charge donation from the lone pairs of an F atom of BF4– to the empty σ* orbital of the X–C1 bond (σ-hole chalcogen bond) and from Lp(F)→σ*(C1–H) to a minor extent, except for 4c, where the latter charge donation is dominant. A different picture is observed for 5c-8c complexes with several contributions arising from Lp(F)→p(C1/C3) in 5c, Lp(F)→p(C3/C4) in 6c and Lp(F)→p(C5) in 7c (in line with the formation of anion-π interactions). The Lp(F)→π*(X–C1) donor-acceptor contribution is common for these complexes, increasing its importance with the size of the chalcogen in such a way that it becomes the only contribution in 8c. Contributions for e complexes are also based on charge transfer from lone pairs of F atoms to vacant p orbitals of C3 and C5 (and C1 for 5e), consistent with the existence of an anion-π interaction. Moreover, 6e–8e complexes have charge-transfer contributions of the Lp(F)→π*(X–C1) π-hole chalcogen bond type.
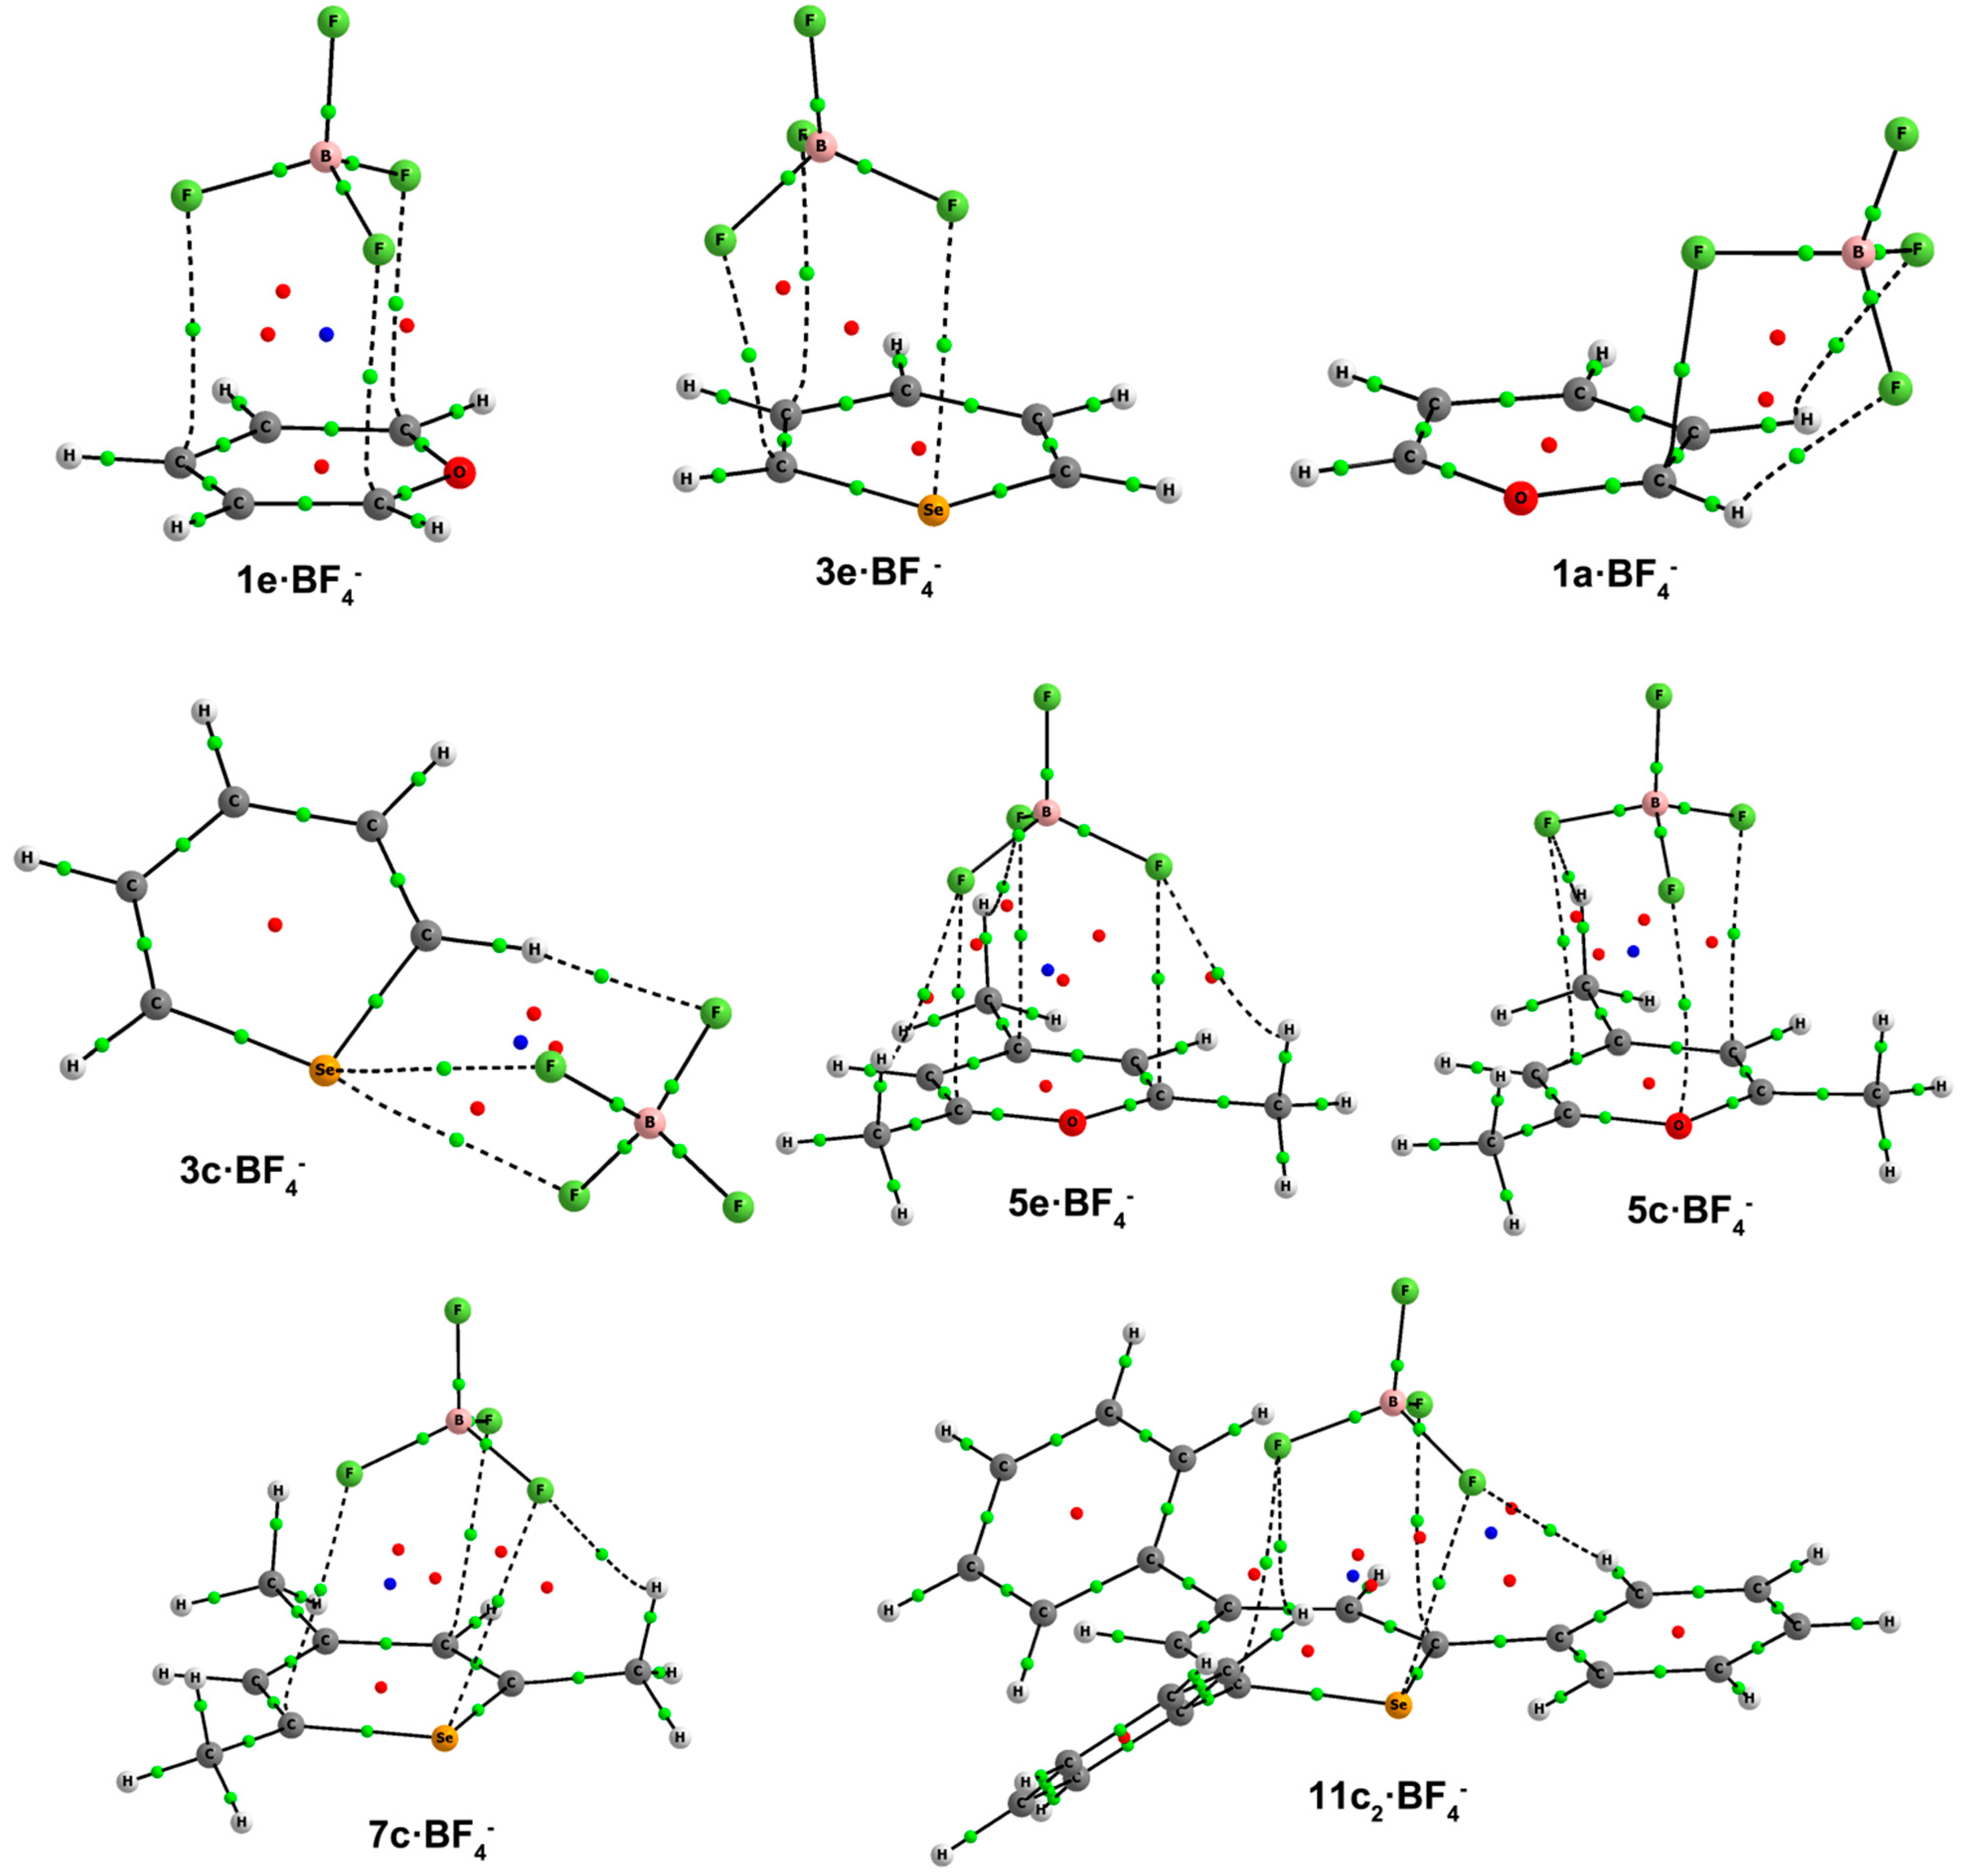
AIM calculations for all complexes are in agreement with NBO results and show the existence of one BCP connecting the X, C and H atoms with FBF
3– (
Figure 9). It is worth noting that the type of contacts with X (characteristic for
c complexes) are also present in
2e–
3e·BF
4–. The values of the electron densities (between 0.027 and 0.004 au), Laplacian (between 0.098 and 0.020 au) and total energy densities (between 0.003 and 0.001 au) at the BCPs of all complexes (
Table 6) are consistent with the existence of noncovalent interactions.
Figure 9.
Molecular graphs of 1a, 3c, 5c, 7c, 11c2, 1e, 3e and 5e·BF4–. The BCPs, ring and cage critical points are represented by green, red and blue dots, respectively. Only bond paths are depicted.
Figure 9.
Molecular graphs of 1a, 3c, 5c, 7c, 11c2, 1e, 3e and 5e·BF4–. The BCPs, ring and cage critical points are represented by green, red and blue dots, respectively. Only bond paths are depicted.
The SAPT results for 1e–3e, 5e–7e, 1a, 2c–3c and 10c2–11c2·BF4– are analogous to the SAPT analysis of nitrate complexes. In general, all contributions are smaller than those for Cl– and NO3–, which is reflected in the smallest binding energies of all series of anions. The largest contribution comes from electrostatics with values between −96.3 and −73.3 kcal·mol−1. Both dispersion and exchange contributions are kept more or less constant for all complexes, and the induction component only varies in c complexes.


