Article

Genetic Diversity Analysis of Tomato (Solanum lycopersicum L.) with Morphological, Cytological, and Molecular Markers under Heat Stress

by
Ahmed B. EL-Mansy
1,
Diaa Abd El-Moneim
2,*,
Salha Mesfer ALshamrani
3,
Fatmah Ahmed Safhi
4,
Mohamed A. Abdein
5 and
Amira A. Ibrahim
6,*
1
Department of Plant Production, (Vegetables Branch), Faculty of Environmental and Agricultural Sciences, Arish University, El-Arish 45511, Egypt
2
Department of Plant Production, (Genetic Branch), Faculty of Environmental and Agricultural Sciences, Arish University, El-Arish 45511, Egypt
3
Department of Biology, College of Science, University of Jeddah, Jeddah 21959, Saudi Arabia
4
Department of Biology, College of Science, Princess Nourah bint Abdulrahman University, Riyadh 11671, Saudi Arabia
5
Biology Department, Faculty of Arts and Science, Northern Border University, Rafha 91911, Saudi Arabia
6
Plant Protection and Biomolecular Diagnosis Department, Arid Lands Cultivation Research Institute, City of Scientific Research and Technological Applications, New Borg El-Arab, Alexandria 21934, Egypt
*
Authors to whom correspondence should be addressed.
Horticulturae 2021, 7(4), 65; https://doi.org/10.3390/horticulturae7040065
Submission received: 7 February 2021 / Revised: 17 March 2021 / Accepted: 20 March 2021 / Published: 26 March 2021
(This article belongs to the Special Issue Molecular Plant Breeding in Tomatoes)

Abstract

:
Tomatoes are usually consumed daily in the human diet. High temperatures reduce the number of tomato yields per year. Heat stress has been considered one of the most prominent causes of alterations in morphological and molecular characteristics in crops that decrease normal growth, production, and yield in diverse plants, including tomatoes (Solanum lycopersicum L.). In this study, we evaluated six tomato lines, namely G1, G2, G3, G4, G5, and G6, at morphological, molecular, and cytological levels under heat stress. The average results of two seasons (2018 and 2019) clarified that the G6, G1, and G2 lines recorded the highest flowering values, as well as some fruit and vegetative growth traits. Furthermore, G6 and G2 had the maximum number of fruits/plant, whereas G2 and G1 produced the highest yield/plant under high temperatures. The number of chromosomes in all lines was 2n = 24, except for G5, in which the number was 2n = 26, whereas chromosome sizes were small, ranging from 323.08 to 464.48 µm. The G1 cultivar was a symmetrical cultivar (primitive), having the highest total form percentage (TF%) and symmetry index (Syi) values and the minimum karyotype asymmetry index (ASK) value, whereas G4 was asymmetrical (advanced). Molecular marker analysis demonstrated that intersimple sequence repeat (ISSR) primers 49A, HB-14, 49A, 49B, and 89B presented the highest values for polymorphism percentage P%, marker index (MI), effective multiplex ratio (EMR), and polymorphism information content (PIC), respectively. In contrast, OP-A3, OP-B3, SCoT 2, and SCoT 12 primers showed the highest PIC, EMR, MI, P%, and resolving power (Rp) values across the studied random amplified polymorphic DNA (RAPD) and start codon-targeted (SCoT) primers. Moreover, ISSR revealed the highest number of unique specific markers (6), followed by RAPD (4) and SCoT (3) markers. Cluster analysis of combined cytological data and data relating to molecular marker attributes separated the G1, G2, and G3 lines into one group, whereas the other lines were clustered in another group. On the whole, the application of combined analysis using morphological, cytological, and molecular genetics techniques could be considered to provide suitable parameters for studying the evolution of the genetic divergence between the studied tomato lines.

1. Introduction

Tomato (Solanum lycopersicum L.) is considered to be one of the most economically remarkable vegetable crops and is grown all over the world, including Egypt. Due to its high nutritional value and various uses, tomato is the second most consumed vegetable crop after potato in the world [1]. International tomato production was 180,766,329 million tons in 2019. The cultivated area of tomatoes in Egypt was 203.678 hectares, and it produced 6,751,856 tons [2], and in North Sinai, the area was 2670 hectares [3]. The optimal temperature for tomato growth and fruit set ranges from 25–30 °C to 22–25 °C [4]. In this regard, heat stress or high temperature is one of the most destructive abiotic stresses, and its intensity is increasing due to global warming [5], causing adverse effects on both the growth and reproduction of plants [6,7]. Moreover, increasing temperature in tomatoes can cause biochemical, morphological, and physiological alterations [8]. This raises the need for further studies to identify more cultivars with high yield, quality, and tolerance to heat-stressed environments. Cultivated tomatoes have a narrow genetic base due to continuous selection and genetic improvement. However, genetic information from different landraces may be essential in order to better understand the suitability of these landraces in heat-stressed environments [9]. Several previous studies, i.e., [10,11], have investigated the genetic performance of tomatoes under heat stress conditions.
Morphological and phenotypic characterizations have been used to evaluate genetic variability because they offer an easy way of measuring genetic divergence [12]. Phenotypic evaluation in tomatoes has traditionally been based on seed and fruit characteristics [12,13]. In addition, karyological studies have been used in plant identification, classification, and taxonomy. These have provided significant knowledge in regard to plant origin, evolution, and interrelationships [14]. The karyotype comprises the number, size, and shape of chromosomes, features which are considered to be the basis of cytogenetic and chromosome evolution. The chromosome number varies from one species to another, and it can also vary among different varieties within species [15]. Variations in karyotype parameters, such as chromosome number, structure, and genome size data, have been shown to have an important role in the genetic diversity of species and relationships among similar species or closely related plants [15,16,17,18,19]. The chromosome number of Solanum lycopersicum is 2n = 24 [20]. Fedorov (1969) [18] reported that there are 24 and 26 chromosomes in different cultivated tomato varieties. Temperature variation may influence the chromosome structure (supramolecular) and DNA (molecular) via thermodynamic effects [19]. On the other hand, genetic diversity between breeding genotypes can be estimated using DNA-based molecular markers, and many molecular markers have been used to study genetic variability in tomatoes [20]. Inter-simple sequence repeat (ISSR) DNA markers have presented an efficient method for evaluating the genetic variance and structure of tomato variety populations [21]. In the same context, random amplified polymorphic DNA (RAPD) and ISSR are two robust DNA fingerprinting mechanisms [22,23]. Additionally, the start codon-targeted (SCoT) marker is considered a premium, simple, low-cost, and rapid system. Moreover, this method is easy to accomplish, very reproducible, polymorphic, and gene-targeted, and the marker is plentiful in the genome [24]. This method has been successfully validated in tomatoes [25].
It is worthwhile to mention that phenotypic evaluation does not exhibit adequate variation for the intraspecific discrimination of cultivars and involves a limited number of phenotypic characteristics, affected by environmental influences [26]. On the contrary, molecular information provides deeper insights into the genetic structure, whereas detecting heterozygous loci utilizing marker techniques can express more realistic genetic relationships. Additionally, molecular evaluation was found to be more favorable than phenotypic evaluation because it had more markers and represented neutral traits of simple inheritance [27,28]. Overall, the information concerning molecular and phenotypic variance between various varieties plays an essential role in vegetable crop amelioration [12,29]. Therefore, the purpose of the investigation described herein was to assess the genetic diversity in six tomato lines based on phenotypic distances, molecular markers, and karyotype parameters, which can aid in preserving genetic resources in gene banks and improving new cultivars in breeding systems.

2. Materials and Methods

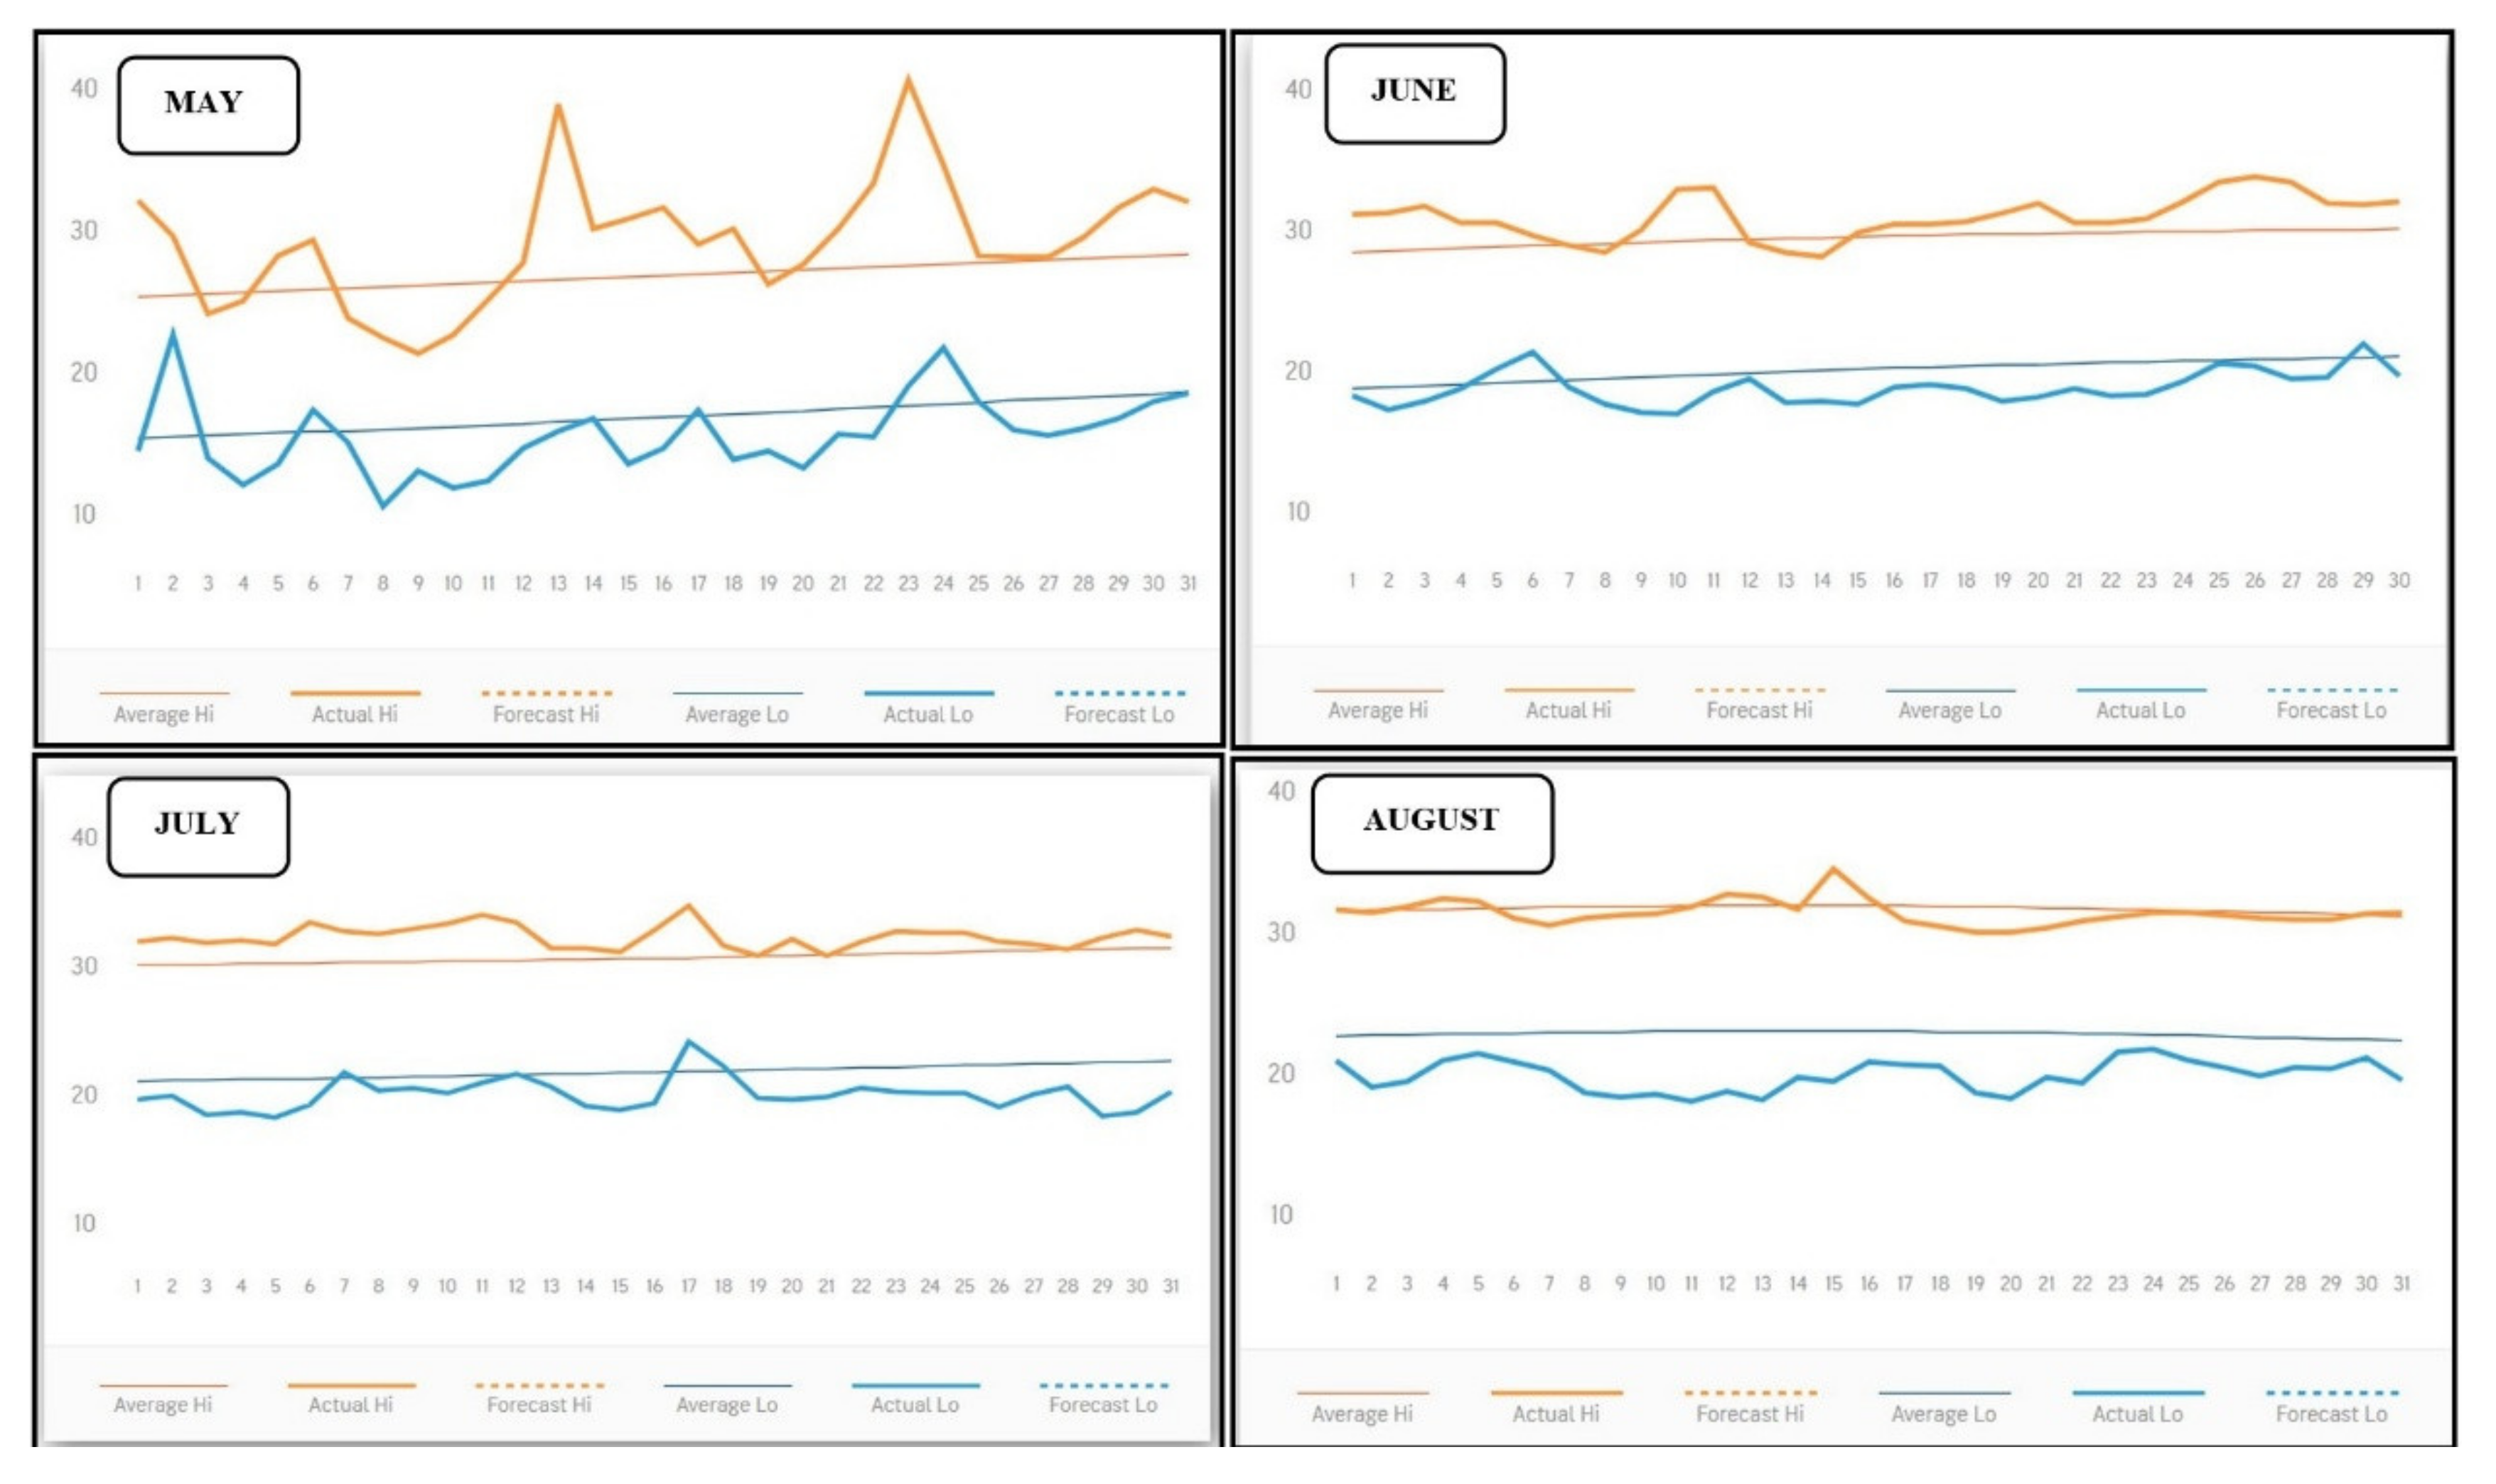
2.1. Plant Material and Growth Conditions

Six tomato lines, namely G1, G2, G3, G4, G5, and G6, obtained from the Asian Vegetable Research and Development Center (AVRDC), were used in the experiments. Table S1 shows the main characteristics and country of origin of the studied lines.

2.2. Morphological and Phenotypic Study

A field experiment was executed at the research farm of the Faculty of Agricultural and Environmental Sciences, Arish University, El- Arish, Egypt, during 2 seasons (2018 and 2019). The studied lines were evaluated under heat tolerance in open-field conditions. Seedlings were transplanted on 15 May in both seasons. The median of max temperature at the flowering and fruit stage for July and August were 37 °C and 35 °C, respectively.
Meanwhile, during the nighttime, the medians were 27 °C and 26 °C for July and August, respectively, in both seasons (Figure 1). The experiment was conducted in a randomized complete block design (RCBD) with 3 replicates. Each replicate contained 6 genotypes, and the plot area was 12 m2 (10 m long and 1.20 m wide), with every plot including 20 plants per line. The drip irrigation system was used. Dripper lines were spaced 1.2 m apart, and plants were spaced 50 cm apart in the same rows. Other regular agricultural practices for tomato production were carried out as recommended in the open fields of the North Sinai region. Different traits were recorded as follows.

2.2.1. Vegetative Traits

Data were recorded for plant height (cm), number of branches/plant, number of leaves/plant, and leaf area/plant by selecting 5 random plants from each plot. These traits were measured after 60 days from transplanting, except the number of branches/plant, which was measured after 4 months.

2.2.2. Yield and Its Components

Total fruit number/plant and total fruit weight/plant (kg) were calculated for all harvested fruits. Average fruit weight (g) was calculated by dividing the total weight of all harvested fruits by the total number of fruits. Harvesting was done every 10 days in the first month. After that, harvesting was done once a week.

2.2.3. Fruit Characteristics

From each plot, 5 fruits were taken randomly from the third harvest to determine fruit length and diameter (cm), which was determined using Vernier calipers and expressed in centimeters. For fruit wall thicknesses, fruits were cut crosswise, and the pericarp thickness was measured using Vernier calipers and described in centimeters. For the number of locules per fruit, fruits were cut crosswise, and the number of locules was counted. Total soluble solid content (TSS %) was measured using a hand refractometer [30]. Fruit firmness was measured on the 2 opposite sides of the fruit using a pressure test (Kg/cm2).

2.2.4. Flowering Parameters

The number of clusters/plant and the number of seeds/fruit were estimated. Moreover, fruit set (%) was calculated according to the following equation:
Fruit   set   %   =   N o .   of   fruits   /   plant N o .   of   flowers   /   plant   ×   100 %

2.3. Cytological Study

About 20 seeds from each tomato line were germinated at room temperature in Petri dishes. Root tips were collected and treated with 0.04 8-hydroxyl quinolone for 2 h. Then, root tips were fixed in a 3:1 (v/v) ratio of alcohol: glacial acetic acid for 24 h. Root tips were hydrolyzed in 1.0 N HCl for 20 min at room temperature. Root tips were stained using 2% aceto-orcein stain. At least 10 metaphase cells were counted using an Olympus CX40 microscope and photographed using a digital camera at X = 100. Karyotype analyses were carried out using KaryoType software (http://mnh.scu.edu.cn/soft/blog/KaryoType/index.html), and ideograms were drawn. Different karyotype parameters were measured and are mentioned in Table S2.

2.4. Molecular Marker Analysis

Seeds were cultivated into pots under greenhouse conditions. Genomic DNA was extracted from young leaves for 5 different plants per line using a DNA Plant Kit (Qiagen). Table S3 shows the sequences of 19 different primers (7 RAPD, 7 ISSR, and 5 SCoT primers) used to study the genetic variability among the studied lines. ISSR analysis and SCoT amplification were achieved according to the methodology described by the authors of [24,31], respectively. Polymerase chain reaction (PCR) products were visualized using agarose gel electrophoresis. The amplified DNA banding patterns were analyzed by Gel Works ID advanced software, where (1) or (0) refers to the presence or absence of each recorded band for each genotype. To assess the markers’ informativeness in distinguishing the investigated lines, various parameters were computed. Polymorphism information content (PIC) was calculated as PIC = 1 − Σpi2, where pi is the frequency of the ith allele [32]. The effective multiplex ratio (EMR) was calculated according to the methodology described by the authros of [33]: EMR = np (np/n), where np is the number of polymorphic loci (per primer), and n is the total loci number. The marker index (MI) was calculated using the formula MI = PIC × EMR [33,34]. The resolving power (Rp) of each primer was calculated using the formula Rp = Σ Ib, where Ib is band informativeness (the Ib can be represented on a scale of 0–1 by the following formula: Ib = 1-(2 ×|0.5 − p|), where p is the proportion of individuals containing the band [35].

2.5. Statistical Analysis

Data were recorded during the 2 seasons of 2018 and 2019. The combined data over the 2 seasons were calculated and statistically analyzed. Analysis of variance (ANOVA) was used to test the hypothesis that the genotype affects the plants’ studied traits, as described by the authors of [36]. If there was a significant difference between the means, Duncan’s test was used to compare different lines [37]. Data and statistical analysis were performed using Excel 2016 (Microsoft Corporation, USA) and SPSS version 23 statistical software package (SPSS Inc., Chicago, Ill., USA). Cluster dendrogram analysis, similarity coefficient, and biplots were estimated using karyological and molecular data. A dendrogram was produced using the unweighted pair group method with arithmetic mean (UPGMA) algorithm using SYSTAT V.7.0 and MVSP V. 3.1 Software [38].

3. Results

3.1. Morphological and Phenotypic Diversity Evaluation

3.1.1. Vegetative Traits

Regarding vegetative traits, the data presented in Figure 2 show that line G6 had the highest values for plant height, number of branches/plant, and number of leaves/plant, followed by G1 and G2, respectively. However, no significant differences were observed between these two lines for the latter trait. Line G1 had the highest value for leaf area per plant (1250 cm2), followed by line G6. On the contrary, line G5 had the lowest value for this trait. For the number of clusters/plant and the fruit set percentage, line G6 recorded the highest values, whereas the lowest value was demonstrated by line G4. Lastly, line G1 produced the highest number of seeds/fruit (213.7) and significantly exceeded the remaining lines.

3.1.2. Flowering and Fruit Traits

The data presented in Figure 2 show that line G2 was the best in terms of average fruit weight, fruit length, fruit diameter, fruit wall thickness, and number of locales/fruit, since it recorded the highest value for these traits and significantly exceeded the remaining lines. The fruit firmness characteristic is considered an essential factor of tomato quality because of the elevated temperatures during the fruit development. However, no significant differences were obtained among the evaluated lines for this trait. For total soluble solids (%), the highest values were recorded by the lines G2, G3, and G4, with insignificant differences among these.

3.1.3. Total Yield

Concerning the total yield per plant, the data presented in Figure 2 reveal that line G6 recorded the highest number of fruits/plant (84.67), followed by line G2, with a value of 52.33, and these significantly exceeded the remaining evaluated lines. With regard to the order, line G2 was considered the best for total yield in terms of weight of fruits/plant, since it produced the highest yield (3.86 kg), followed by G1, with an average of 2.98 kg. Meanwhile, line G5 produced the lowest yield (1.02 kg).

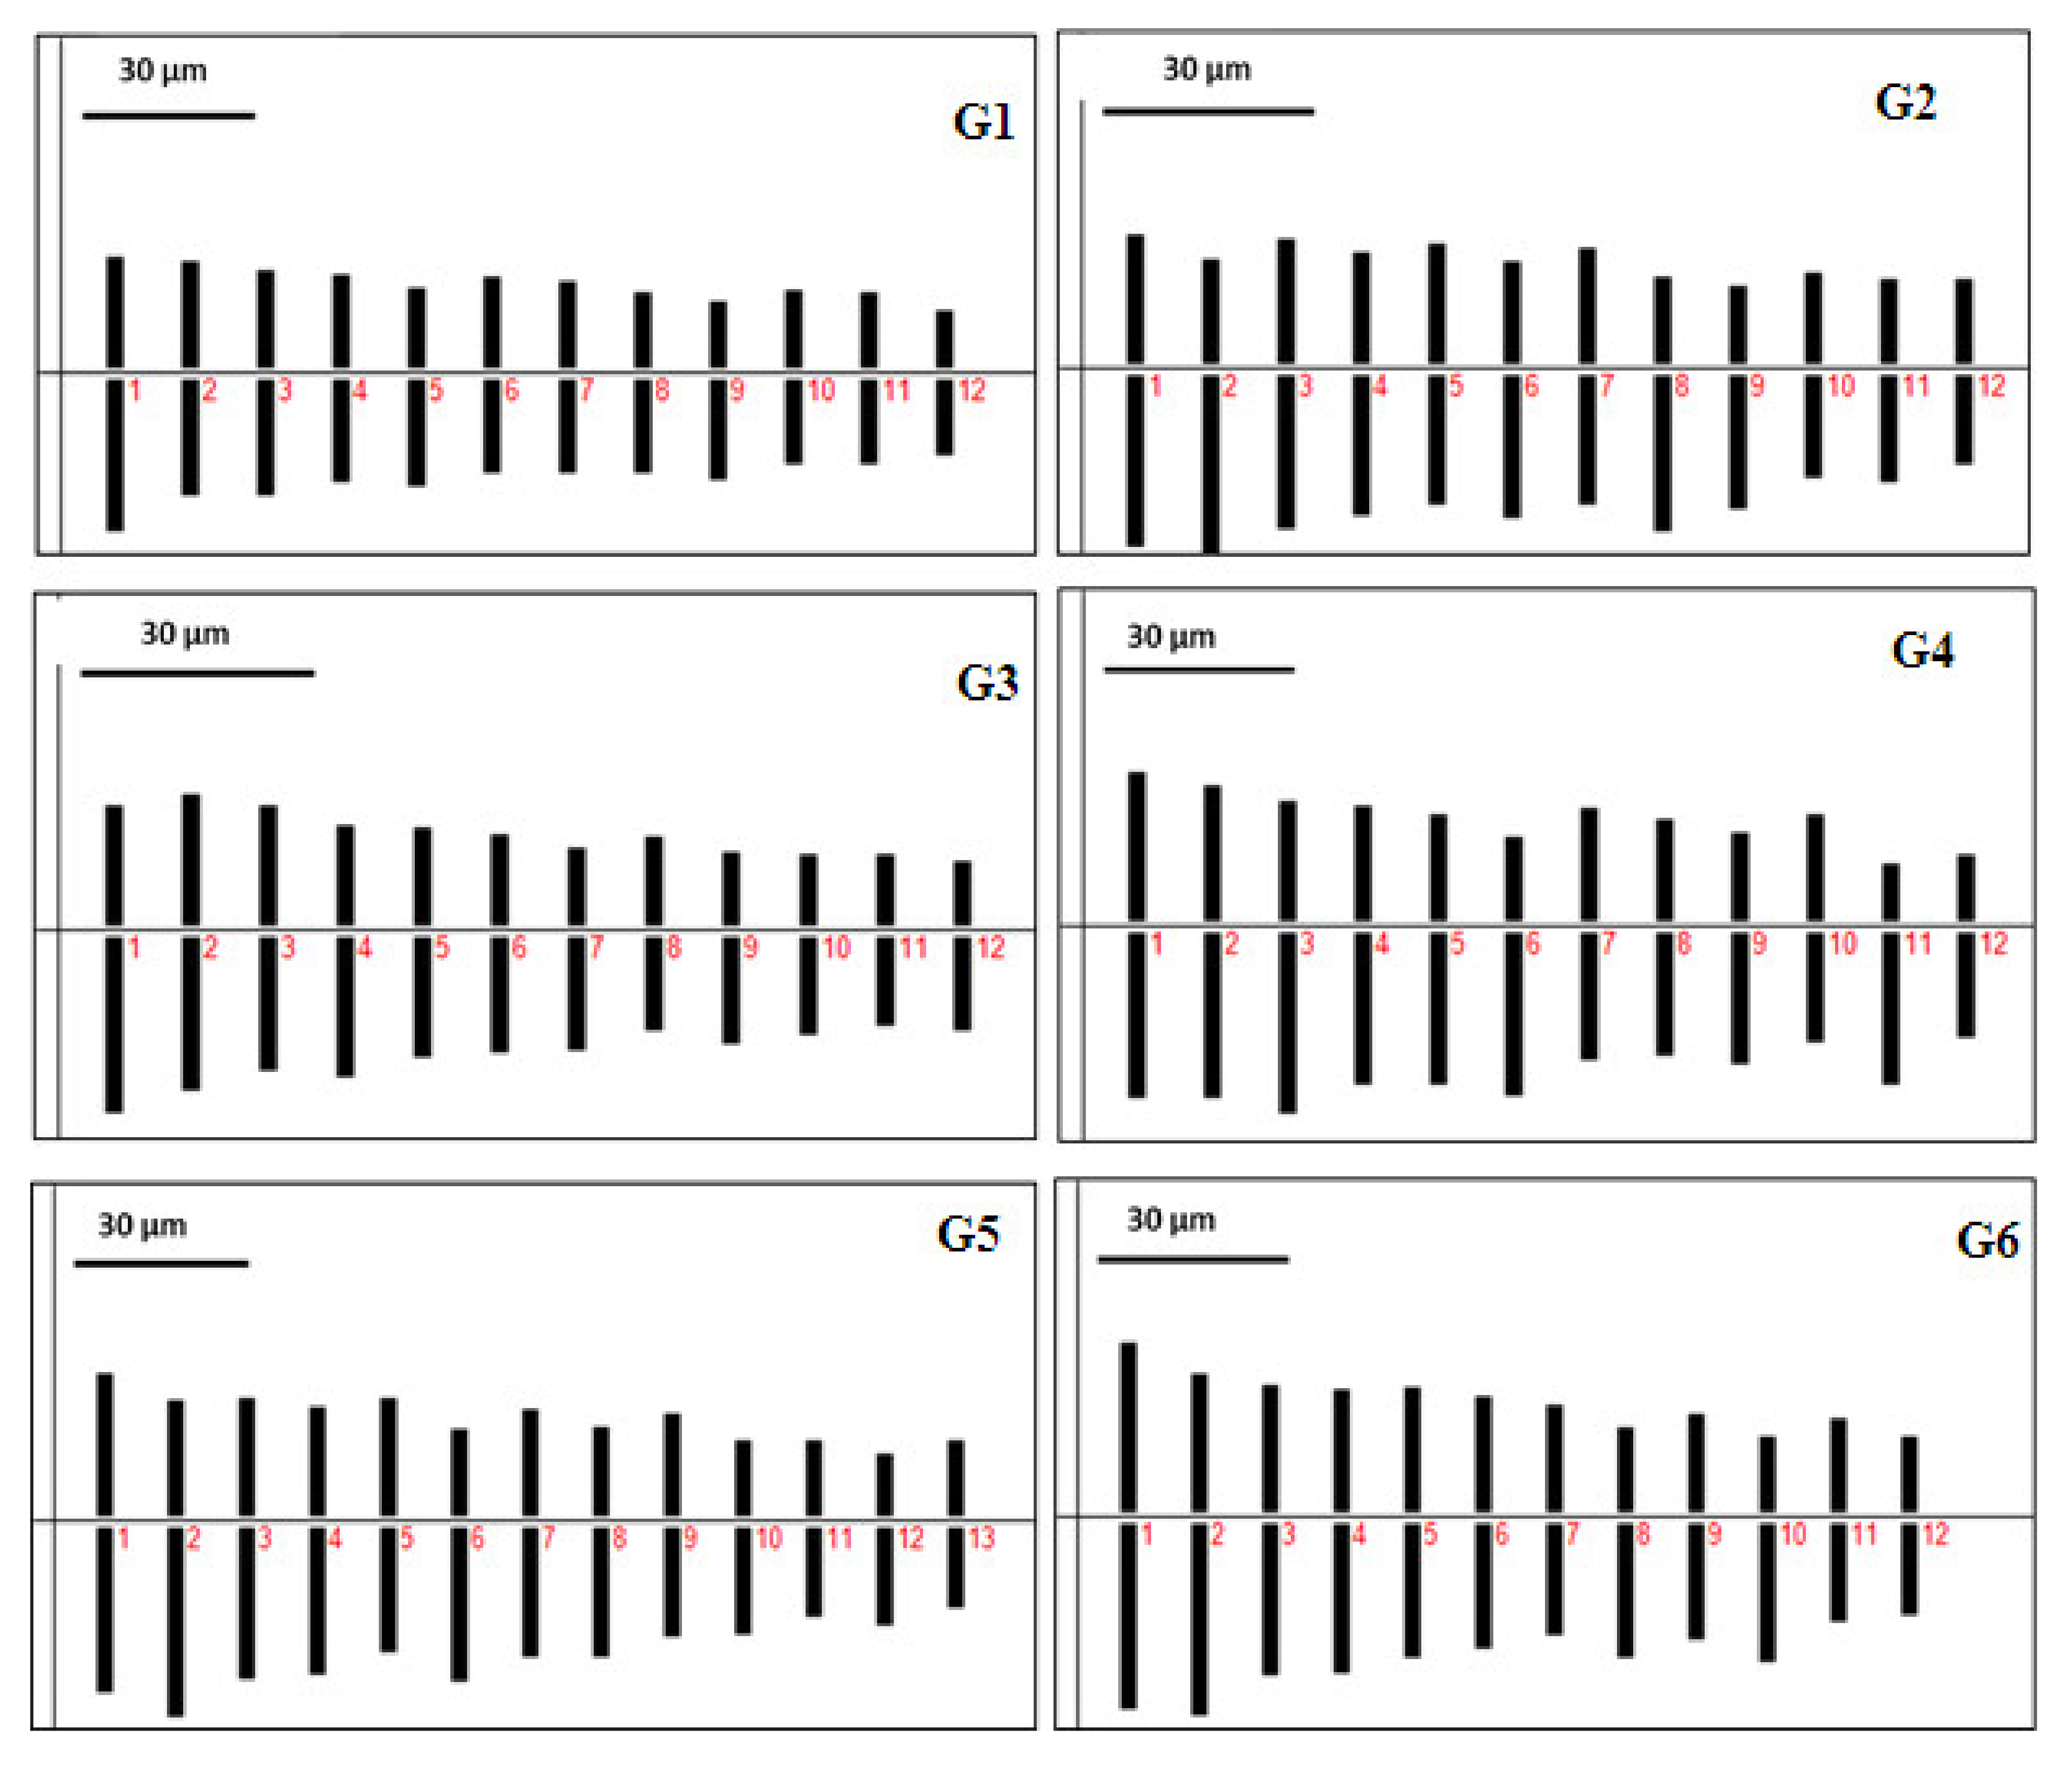
3.2. Cytological Studies

The chromosome number of all tomato lines was 2n = 24, except for the G5 cultivar, in which the number was 2n = 26, as shown in Figure 3. Ideograms of haploid chromosome numbers for the studied six cultivars are illustrated in Figure 4. Different karyotype parameters are presented in Table 1. Karyotype formulas nearly metacentric (nm) and metacentric (m) were recorded in all six cultivars, whereas karyotype formula nearly submetacentric nsm (-) was found in G2, G4, G5, and G6 cultivars. The highest values for the coefficient of variation of centromeric index (CVCI), mean centromeric asymmetry (MCA), the Karyotype asymmetry index (ASK%), intrachromosomal asymmetry index (A1), interchromosomal asymmetry index (A2), and asymmetry index (AI) parameters were recorded in the G4 cultivar, being 14.76, 16.75, 58.05%, 0.27, 0.17, and 2.56, respectively. In contrast, the lowest values of these parameters were present in the G1 cultivar, at 6.19, 8.87, 54.44%, 0.16, 0.09, and 1.15, respectively. On the other hand, the total form percentage (TF%) and symmetry index (Syi) were found to have the highest values, at 45.56% and 83.69%, respectively, in the G1 cultivar. TF% and Syi had the lowest values in the G4 cultivar, at 41.95% and 72.25%, respectively, as shown in Table 1.

3.3. Molecular Diversity as Detected by RAPD, ISSR, and SCoT Analysis

Seven RAPD primers were screened for the analysis of polymorphism (Figure S1). The size of the generated bands ranged from 180 bp to 1075 bp. In total, 36 bands were scored, whereas the number of bands/primer ranged from 3 in OP-C9 to 7 in OP-A3, OP-A9, and OP-C15, with an average of 5 bands/primer. Moreover, the total number of polymorphic bands was 8, with a median of 1.14 polymorphic amplicons/primer, whereas the total number of monomorphic bands was 28, with a median of 4 monomorphic fragments/primer. The maximum number of polymorphic bands was obtained by OP-B3 and OP-C15 primers, whereas primers OP-B3 and OP-K2 revealed the highest polymorphism percentage (50%) (Table 2). Notably, primers OP-A3, OP-A9, OP-C9, and OP-K3 did not present any polymorphic bands. Primer OP-B3 revealed the highest values for PIC (0.28), EMR (1.50), and MI (0.42), whereas primer OP-A3 recorded the highest Rp value (14.0). Moreover, primer OP-K2 generated two unique negative bands at 400 bp and 735 bp in G6. Furthermore, G2 and G5 lines showed two unique bands, a negative and positive marker, at 720 bp and 670 bp, respectively (Table 3).
On the other hand, 35 ISSR bands were amplified after analyzing 7 ISSR primers. The size of the generated bands ranged from 170 bp to 1290 bp (Figure S2). HB-09 and 89B primers recorded the highest (seven) and lowest (three) numbers of amplified bands, respectively, with an average of five bands/primer. The number of polymorphic bands was 18 bands and ranged from 1 for HB-09 to 4 for 49B, with a median of 2.5/primer. Meanwhile, primers 49A and HB-14 revealed the highest polymorphism percentage (75%) (Table 2). The total number of monomorphic bands was 17, with an average of 2 monomorphic fragments/primer. Primers 89B, 49B, 49A, and HB-09 revealed the highest values for PIC (0.59), EMR (2.67), MI (1.31), and Rp (13.4), respectively. Two unique negative markers were detected in G1 at 475 bp using the 49B primer and at 700 bp using the HB-8 primer, whereas primer HB-14 recorded three unique negative markers at 280 bp, 345 bp, and 860 bp in G4 and G5, respectively. Moreover, line G6 showed one unique negative marker at 940 bp for primer HB-9 (Table 3).
The total number of amplified bands was 27 after analyzing 5 SCoT primers (Figure S3). The total number of bands per primer ranged from four (SCoT 4 and SCoT 14) to eight (SCoT 12), with an average of five bands/primer. The size of the amplification products varied from 120 bp to 840 bp (Table 2). The total number of polymorphic bands was nine, with a median of 1.8 polymorphic amplicons per primer, whereas the SCoT 2 primer revealed the maximum number of polymorphic bands. Interestingly, primer SCoT 4 did not represent any polymorphic bands. The highest polymorphism percentage was 50%, detected by the SCoT 2 and SCoT 15 primers. The number of monomorphic markers varied between six (SCoT 12) and two (SCoT 15). The highest values for PIC (0.31), EMR (1.50), and MI (0.47) were revealed by SCoT 2 primers, whereas the highest value for Rp (13.1) was detected by the SCoT 12 primer. SCoT 2 generated two unique markers—one band was negative at 260 bp, and the other one was a positive marker at 530 bp in line G2. In the same context, G1 revealed one unique negative marker using SCoT 15 at 500 bp (Table 3).
The comparison between the studied markers shown in Table 3 clearly shows that the ISSR maker revealed the highest polymorphic bands and polymorphism percentage average (18 and 51.4%) followed by SCoT (9 and 33.3%), and finally RAPD (8 and 22%), respectively.

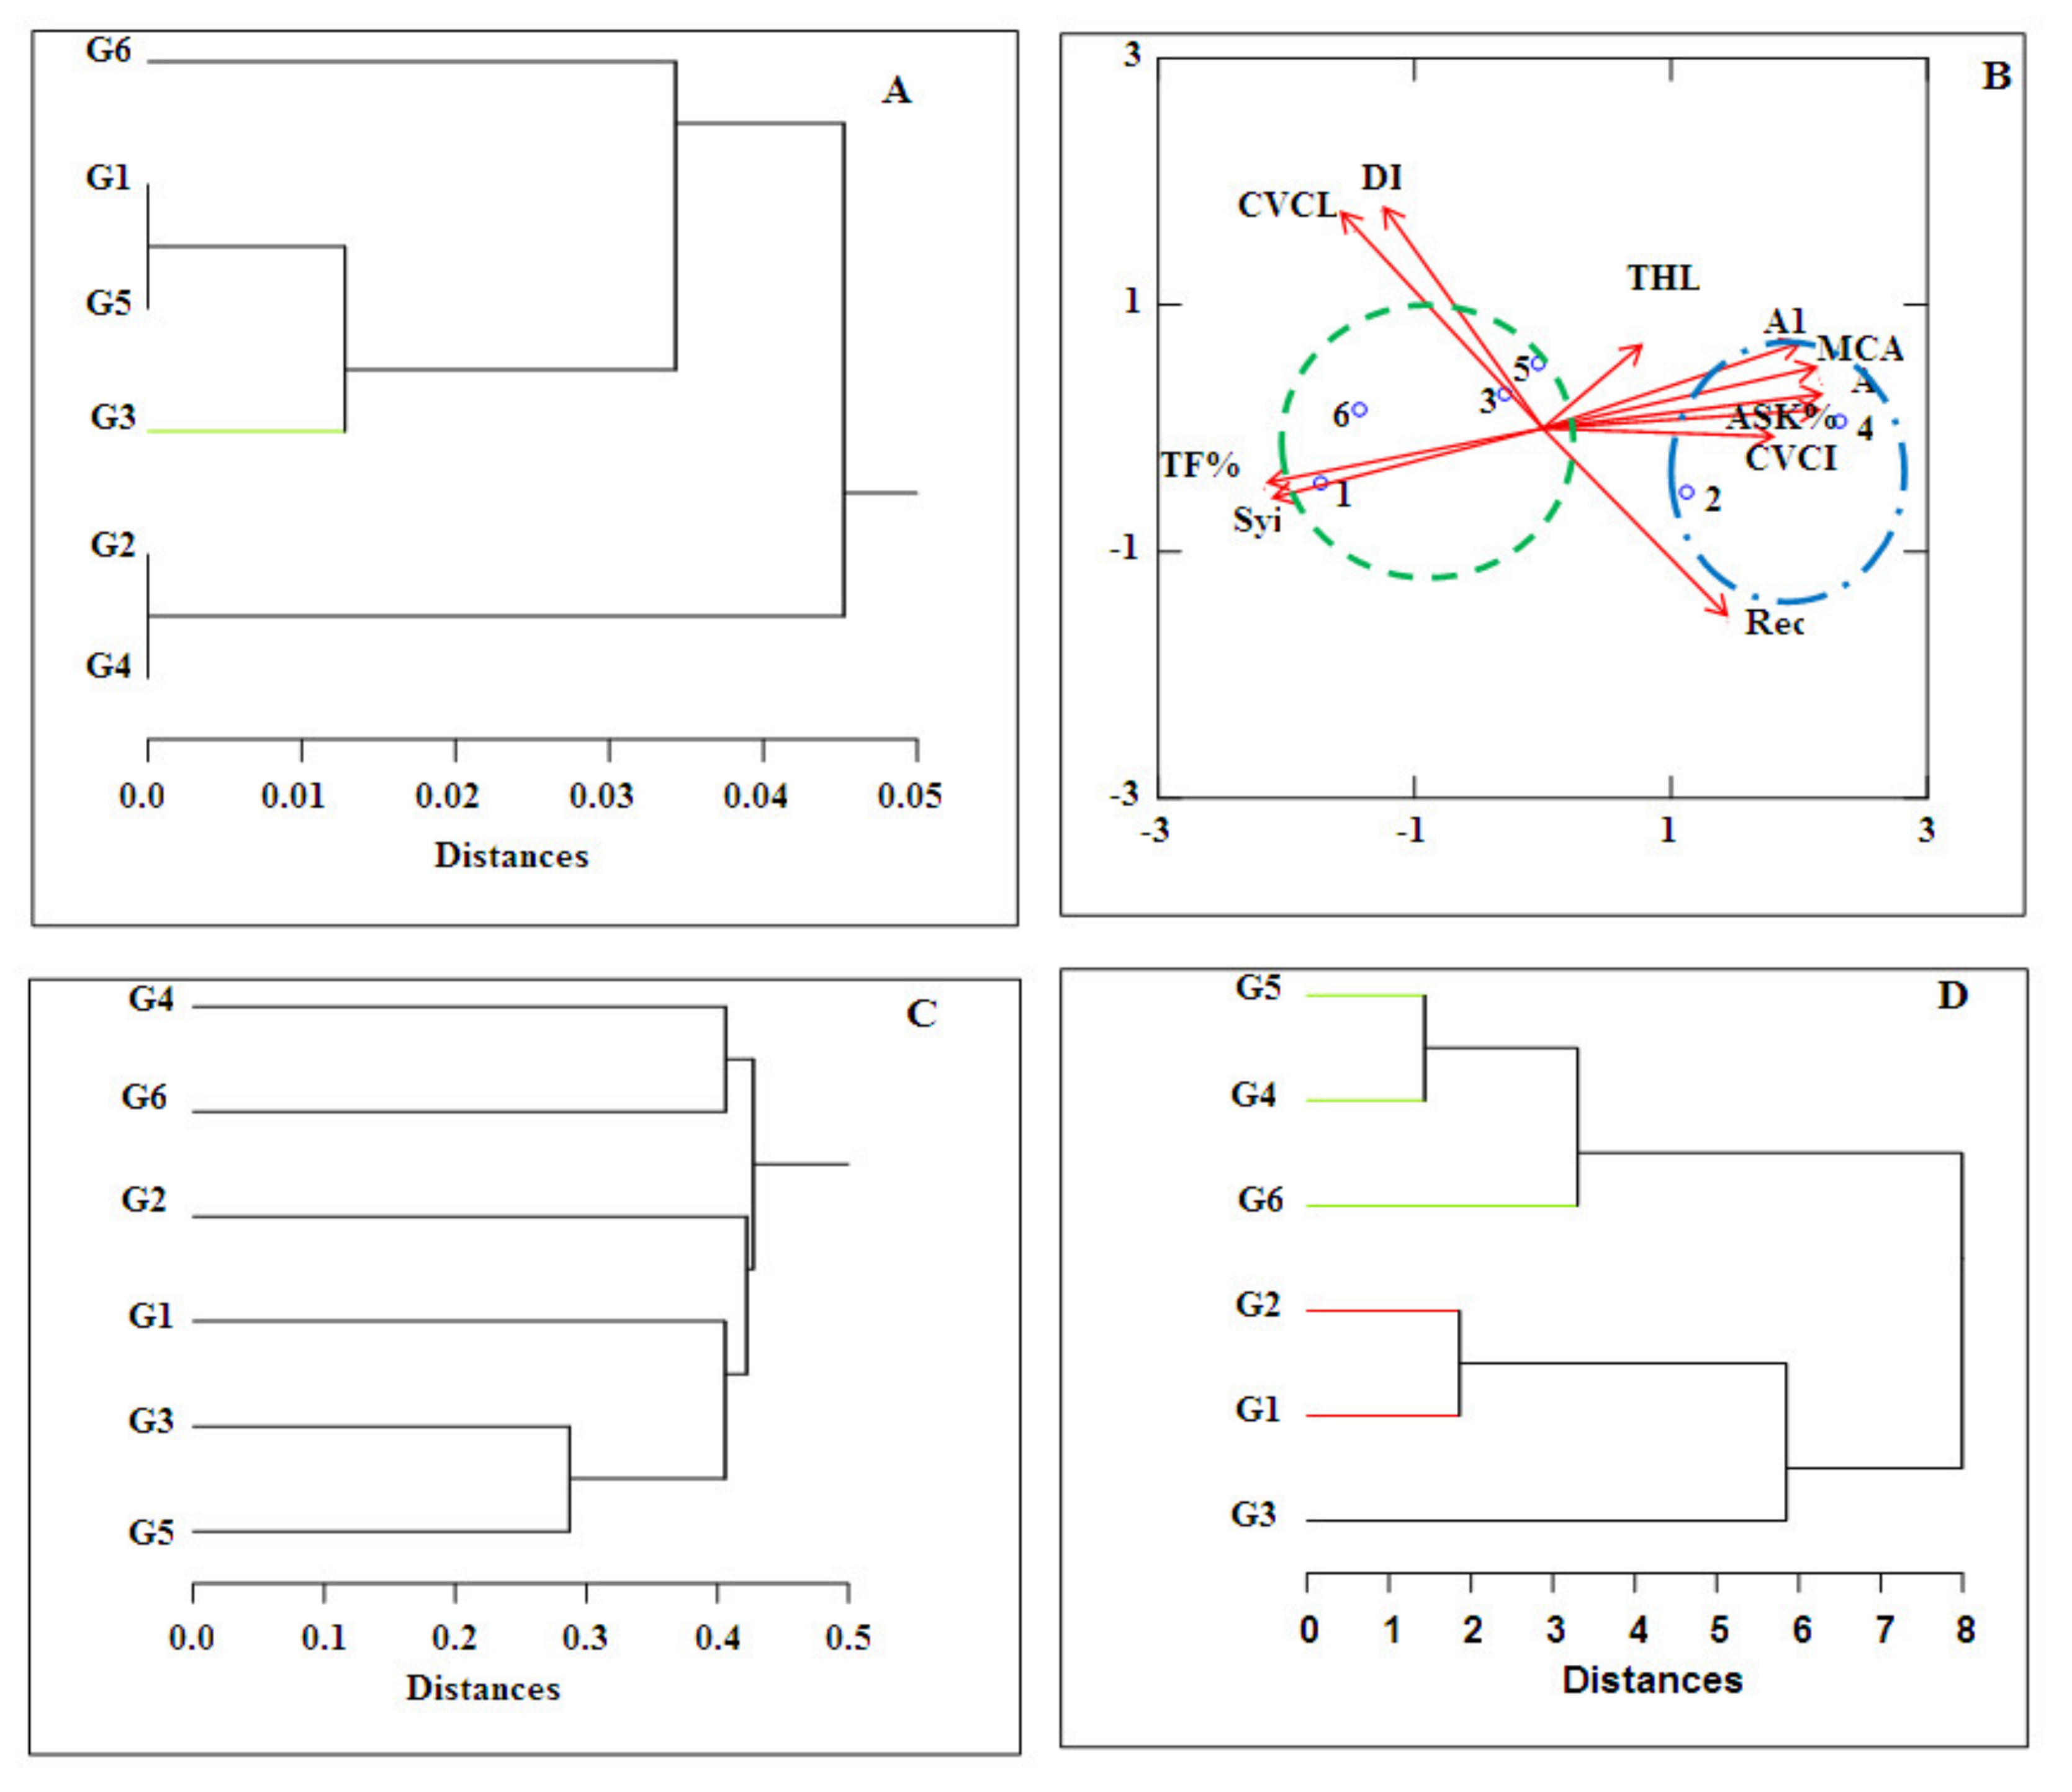
3.4. Statistical Analyses

For cytological studies, a cluster dendrogram was generated based on karyological parameters produced in two groups. One group included the G2 and G4 cultivars, and the second group included the other cultivars (Figure 5A). In addition, biplot mapping of the same result demonstrated the ability of the Rec index, AI, and MCA to separate the G2 and G4 cultivars, whereas TF%, CVCL, and DI parameters separated the other cultivars in the second group (Figure 5B). Similarly, the coefficient among six lines using cytological data showed the highest similarity among G1 and G5, G4 and G2, and G3 and G5, with a value of 0.999, as shown in Table S4. The Pearson correlation among different karyotype parameters showed positive and negative correlations, as presented in Table S5. The highest positive correlation was 0.997, between MCA and the A index, and the lowest positive correlation was 0.032, among THL and the Rec index. The highest negative correlation was −0.994, among TF% and A2, whereas the lowest negative correlation was −0.001, among A2 and AI. For molecular studies, the cluster dendrogram was used to analyze and compute the data, with three molecular markers classifying the studied cultivars into two groups. One group contained G1, G3, and G5 cultivars. The other group included the rest of the cultivars (Figure 5C). The combined data relating to cytological and molecular attributes were analyzed to demonstrate genetic diversity among the six lines using a cluster dendrogram, which separated the studied lines into G1, G2, and G3 cultivars as separate groups. The cluster dendrogram further divided these lines into two subgroups, one including G1 and G2 and the other subgroup containing G3. The remaining three cultivars were combined into one group (Figure 5D).

4. Discussion

Morphological parameters, molecular techniques, and genotype origins are essential tools affecting genetic diversity that can be used to improve cultivars [39]. Estimating genetic variation by assessing phenotypic characteristics is considered very important in plant breeding, especially in producing new genotypes with higher productivity, quality, and broader adaptation [40,41]. Transplanted tomatoes under heat stress have an unfavorable influence on plant development [29,42]. However, heat sensibility in tomato lines varies between cultivars and growth periods [5,43]. The results of our study revealed a wide range of diversity in our collection for most of the evaluated traits, mainly related to vegetative, fruit, and yield and its components. Additionally, our results indicated that the inconsistency in plant growth, fruit set, and yield among heat-tolerant and heat-sensitive lines agree with the plants’ physiological response under heat stress during the seedling period in an open field [44]. In this regard, Peet et al. (1997) [45] reported a decrease in several seeds/fruit, with the daily temperature ranging from 25 °C to 26 °C and from 28 °C to 29 °C. The reduction in the number of seeds/plants under heat stress conditions may lead to a decline in pollen viability and inhibit pollen tube growth and fertility [46,47]. In this connection, many studies have found a decrease in pollen viability and fruit set (%) along with high temperature [45,48]. Phenotypic parameters regulate the basis for germplasm characterization but are sensitive to environmental stresses, limiting the number of studied traits, delayed expression, and low heritability. Most of these complications can be overcome through cytological and molecular genotyping by DNA-based screening. Accordingly, in this study, we tried to confirm this hypothesis.
Data relating to chromosomes and cytological information have been used as important tools to ensure species’ origin and provide examples of species having different chromosome numbers, which provide reliable data for species information [49]. The chromosome number of studied cultivars was 2n = 24, except for the G5 cultivar in which the number was 2n = 26, which is in agreement with the results found by the authors of [50,51], who recorded the basic number of Solanaceae as x = 7, 9, 12, 14. The difference in chromosome number or chromosome formula was associated with morphological variation, as G5 varied from the other cultivars in several characteristics, such as leaves, plant height, and leaf area. Karyotype evolution has been correlated to increases in the chromosome number and formula [52]. Modification in karyotype formulas in different cultivars is associated with chromosome structure changes such as deletion, duplication, and translocation, which cause a decrease in the length of the chromosome [53]. The chromosome length of the studied cultivars was small, varying from 323.08 µm to 464.48 µm, which was consistent with the results reported by the authors of [54], who reported that the chromosome length of Solanaceae varied from small to medium size. Perennial species were found to have small chromosomes in association with chromosome size [55]. The main karyotype formulas of studied tomato cultivars were nearly metacentric nm, and nearly submetacentric nsm(-), which was in accordance with the results reported by the authors of [51,56], who reported that the majority of chromosomes in Solanaceae are m or sm. The evolution of a plant, associated with variation of karyotype parameters, is estimated using different indices of symmetry. Rec and Syi indices vary from 0 to 100 [57], and TF % vary from 0 to 50 [58]. According to the highest TF and Syi value and the lowest ASK value, G1 was the most symmetrical, and G4 was the most asymmetrical. According to A1 and A, the G1 cultivar was the most primitive, and G4 was the most advanced. A higher value of A1 points to a higher level of asymmetry [59].
Molecular markers are used to study the genetic variability, in addition to the distinction among genotypes, for the purpose of cultivating new cultivars with useful traits in plant breeding [60]. Ezekiel et al. [23,61] found that the size of the amplification RAPD products varied from 200 bp to 3100 bp and 196 bp to 1790 bp, whereas the total numbers of scored bands were 74 and 180, respectively, which was higher than our results. In previous studies, the polymorphism percentages detected by the authors of [61,62] were 43.84% and 87.77%, respectively. Furthermore, Sharifova et al. (2017) [63] showed that polymorphism percentages ranged from 50% to 100%. In another study, Abdein et al. (2018) [25] detected 55 polymorphic and monomorphic bands after ISSR analysis of some tomato genotypes, whereas the overall size of amplified products ranged between 130 bp and 4010 bp. Compared with our results, fewer amplification products, ranging from 32 bp to 1550 bp, were detected by the authors of [61]. The higher values of PIC, EMR, MI, and Rp noted after ISSR marker analysis confirm that the studied primers were highly informative. The PIC average recorded by the authors of [62] (0.687) was higher than that detected in this study. On the contrary, the PIC value (0.088) observed by the authors of [64] was less than the PIC values calculated in this research. Moreover, Abdein et al. (2018) [25] reported that the MI and the EMR values were 1.03 and 2.33. In this regard, the previous researchers found that the average Rp values were 1.55 and 12.5 per ISSR primer, respectively [25,64]. Additionally, the polymorphism percentage of the studied SCoT marker in this study was lower than that detected by the authors of [25], who reported that the highest polymorphic rate was 80% for primer SCoT9, and the lowest was 11.11% for primer SCoT11. Moreover, Shahlaei et al. (2014) [64] reported that 10 SCoT primers generated 83 bands, of which 30 (36.14%) were polymorphic. Our results also revealed that the ISSR primer is more informative than other studied markers for the identification and genetic diversity analysis of studied tomato lines. Accordingly, ISSR displayed the highest number of unique specific markers (six), followed by RAPD (four), and SCoT (three) markers. In the same context, 22 RAPD-specific markers were detected by the authors of [61], whereas the authors of [25] reported 24 unique markers after SCoT and ISSR analysis.
In this study, morphological traits represented in leaf area, fruiting, flowering, and yield proved that genotype G5 showed the lowest values for morphological traits after heat stress, in line with its cytological result that differed in chromosome number from the rest of the studied genotypes (2n = 26), which ensures that this genotype is sensitive to temperature stress. Regarding the molecular level, this line generated positive and negative unique bands using OPC15 and HB-14 primers, respectively. This result is in line with the results found by the authors of [65], which proved that the RAPD marker developed for high-temperature stress is a fast tool for estimating DNA changes. On the other hand, the most tolerant lines to heat stress were G1, G2, and G6, which showed no variations in morphological traits; produced the highest values for vegetative growth, fruiting, and yield; and exhibited the same chromosome number (2n = 24). Additionally, these lines generated the highest unique bands across RAPD, ISSR, and SCoT primers compared with the other studied lines. These bands might be considered a useful marker linked with heat tolerance in tomato breeding programs. This phenomenon has also been observed and explained by the authors of in Cymbopogon [66], in canola [67], in tomato [12], in squash [68], and in wheat [69]. Overall, the comparison of molecular and morphological markers showed that both marker mechanisms only represent partial genetic associations between the studied genotypes. As a result, the combined analysis of these systems allows for a more precise measurement of genotype genetic variation [70]. Moreover, it is possible to choose several traits at the same time, such as yield, yield part, fruit consistency, and biotic and abiotic stress tolerance [71].

5. Conclusions

Efforts for tomato amelioration through traditional breeding based on helpful morphological traits are incapable of achieving considerable success. Our findings reinforce the utility of morphological and cytological parameters alongside DNA molecular markers in sorting and investigating relationships between the studied tomato lines. G2, G1, and G6 lines recorded the highest values for morphological traits, vegetative growth, fruiting, and yield, with maintenance in the chromosome number (2n = 24). The same lines revealed the highest number of unique bands, which can be considered a useful marker for heat stress screening. Consequently, these genotypes may be the most heat-tolerant and could be used in tomato breeding programs to increase productivity. Furthermore, ISSR markers demonstrated their effectiveness in discriminating the tested lines by generating the highest polymorphic bands, average polymorphism percentages, and total number of unique bands.

Supplementary Materials

The following are available online at https://www.mdpi.com/article/10.3390/horticulturae7040065/s1, Figure S1: RAPD patterns of the six tomato lines, revealed by seven primers; Figure S2: ISSR patterns of the six tomato genotypes, revealed by seven primers; Figure S3: SCoT patterns of the six tomato genotypes, revealed by five primers; Table S1: Main characteristics and countries of origin of the studied tomato lines; Table S2: Similarity coefficient among six lines of tomatoes using karyotype parameters; Table S3: Pearson correlation between different karyotype parameters for six lines of tomatoes.

Author Contributions

Conceptualization, A.B.E.-M., A.A.I. and D.A.E.-M.; methodology, all authors; validation, all authors; investigation, A.A.I. and D.A.E.-M.; resources, A.B.E.-M. and A.A.I.; data curation, A.B.E.-M. and A.A.I.; writing—original draft preparation, all authors; writing—Review and editing, A.A.I. and D.A.E.-M.; visualization, all authors. All authors have read and agreed to the published version of the manuscript.

Funding

This research received no external funding.

Institutional Review Board Statement

Not applicable.

Informed Consent Statement

Not applicable.

Data Availability Statement

Relevant data applicable to this research are within the paper.

Conflicts of Interest

The authors declare no conflict of interest.

References

  1. Siddiqui, M.H.; Alamri, S.; Alsubaie, Q.D.; Ali, H.M.; Khan, M.N.; Al-Ghamdi, A.; Ibrahim, A.A.; Alsadon, A. Exogenous nitric oxide alleviates sulfur deficiency-induced oxidative damage in tomato seedlings. Nitric Oxide 2020, 94, 95–107. [Google Scholar] [CrossRef]
  2. FAOSTAT. Crops: Tomatoes. 2019. Available online: http://www.fao.org/faostat/ar/#data/QC (accessed on 9 August 2019).
  3. Elnaga, M.A.; Mona, M.A. An Economic Study for Production of Winter Tomato Crop in Bir Al-Abd, North Sinai Governorate. J. Agric. Econom. Soc. Sci. 2018, 9, 885–889. [Google Scholar] [CrossRef]
  4. Camejo, D.; Rodríguez, P.; Morales, M.A.; Dell’Amico, J.M.; Torrecillas, A.; Alarcón, J.J. High temperature effects on photosynthetic activity of two tomato cultivars with different heat susceptibility. J. Plant Physiol. 2005, 162, 281–289. [Google Scholar] [CrossRef] [PubMed]
  5. Masouleh, S.S.S.; Sassine, Y.N. Molecular and biochemical responses of horticultural plants and crops to heat stress. Ornam. Hortic. 2020, 26, 148–158. [Google Scholar] [CrossRef]
  6. Xu, J.; Driedonks, N.; Rutten, M.J.M.; Vriezen, W.H.; De Boer, G.-J.; Rieu, I. Mapping quantitative trait loci for heat tolerance of reproductive traits in tomato (Solanum lycopersicum). Mol. Breed. 2017, 37, 1–9. [Google Scholar] [CrossRef]
  7. Zhou, R.; Yu, X.; Li, X.; Dos Santos, T.M.; Rosenqvist, E.; Ottosen, C.-O. Combined high light and heat stress induced complex response in tomato with better leaf cooling after heat priming. Plant Physiol. Biochem. 2020, 151, 1–9. [Google Scholar] [CrossRef] [PubMed]
  8. Wahid, A.; Gelani, S.; Ashraf, M.; Foolad, M. Heat tolerance in plants: An overview. Environ. Exp. Bot. 2007, 61, 199–223. [Google Scholar] [CrossRef]
  9. Comlekcioglu, N.; Simsek, O.; Boncuk, M.; Aka-Kacar, Y. Genetic characterization of heat tolerant tomato (Solanum lycopersicon) genotypes by SRAP and RAPD markers. Genet. Mol. Res. 2010, 9, 2263–2274. [Google Scholar] [CrossRef]
  10. Mansour, A.; Ismail, H.M.; Ramadan, M.F.; Gyulai, G. Variations in tomato (Lycopersicon esculentum) cultivars grown under heat stress. J. Consum. Prot. Food Saf. 2009, 4, 118–127. [Google Scholar] [CrossRef]
  11. Ayenan, M.A.T.; Danquah, A.; Hanson, P.; Asante, I.K.; Danquah, E.Y. Identification of new sources of heat tolerance in cultivated and wild tomatoes. Euphytica 2021, 217, 1–16. [Google Scholar] [CrossRef]
  12. El-Aziz, M.A.; Farid, S.; Elkomey, S. Evaluation of Molecular and Phenotypic Diversity in Relation to Heterosis in Some Tomato Lines Under Different Climatic Conditions. J. Agric. Chem. Biotechnol. 2016, 7, 141–151. [Google Scholar] [CrossRef]
  13. El-Mansy, A.B.; Metwally, E.I.; Elkasas, A.I.; El-Tantawy, A.M.; Mahmoud, M.I. Performance, Heritability and Correlation Coefficients for Some Important Traits in Tomato Under North Sinai Condition. Sinai J. Appl. Sci. 2015, 4, 79–94. [Google Scholar] [CrossRef]
  14. Wang, L.-J.; Gao, M.-D.; Sheng, M.-Y.; Yin, J. Cluster analysis of karyotype similarity coefficients in Epimedium (Berberidaceae): Insights in the systematics and evolution. PhytoKeys 2020, 161, 11–26. [Google Scholar] [CrossRef]
  15. Gianfranco, V.; Ravalli, C.; Cremonini, R. The karyotype as a tool to identify plant species: Vicia species belonging to Vicia subgenus. Caryologia 2008, 61, 300–319. [Google Scholar] [CrossRef]
  16. Cruz, G.A.D.S.; Filho, J.R.D.M.; Vasconcelos, S.; Gitaí, J.; De Campos, J.M.S.; Viccini, L.F.; Zizka, G.; Leme, E.M.C.; Brasileiro-Vidal, A.C.; Benko-Iseppon, A.M. Genome size evolution and chromosome numbers of species of the cryptanthoid complex (Bromelioideae, Bromeliaceae) in a phylogenetic framework. Bot. J. Linn. Soc. 2019, 192, 887–899. [Google Scholar] [CrossRef]
  17. Tlili, A.; Gouja, H.; Vallès, J.; Garnatje, T.; Buhagiar, J.; Neffati, M. Chromosome number and genome size in Atriplex mollis from southern Tunisia and Atriplex lanfrancoi from Malta (Amaranthaceae). Plant Syst. Evol. 2020, 306, 11. [Google Scholar] [CrossRef]
  18. Fedorova, A. Chromosome Numbers of Flowering Plants; Otto Koeltz Science Publishers: Koenigstein, Germany, 1969. [Google Scholar]
  19. Hemantaranjan, A. Heat Stress Responses and Thermotolerance. Adv. Plants Agric. Res. 2014, 1, 1–10. [Google Scholar] [CrossRef]
  20. Kandel, D.R.; Bedre, R.H.; Mandadi, K.K.; Crosby, K.; Avila, C.A. Genetic Diversity and Population Structure of Tomato (Solanum lycopersicum) Germplasm Developed by Texas A&M Breeding Programs. Am. J. Plant Sci. 2019, 10, 1154–1180. [Google Scholar] [CrossRef]
  21. Vargas, J.E.E.; Aguirre, N.C.; Coronado, Y.M. Study of the genetic diversity of tomato (Solanum spp.) with ISSR markers. Rev. Ceres 2020, 67, 199–206. [Google Scholar] [CrossRef]
  22. Brake, M.; Al-Gharaibeh, M.; Hamasha, H.; Al Sakarneh, N.; Alshomali, I.; Migdadi, H.; Qaryouti, M.; Haddad, N. Assessment of genetic variability among Jordanian tomato landrace using inter-simple sequence repeats markers. JJBS 2021, 14, 91–95. [Google Scholar]
  23. Ezekiel, C.N.; Nwangburuka, C.C.; Ajibade, O.A.; Odebode, A.C. Genetic diversity in 14 tomato (Lycopersicon esculentum Mill.) varieties in Nigerian markets by RAPD-PCR technique. Afr. J. Biotechnol. 2011, 10, 4961–4967. [Google Scholar]
  24. Collard, B.C.Y.; Maackill, D.J. Start Codon Targted (SCoT) polymorphism: A simple novel DNA marker technique for generating gene-targeted markers in plants. Plant Mol. Bio. 2009, 27, 86–93. [Google Scholar] [CrossRef]
  25. Abdein, M.A.; El-Moneim, D.A.; Taha, S.S.; Al-Juhani, W.S.; Mohamed, S.E. Molecular characterization and genetic relationships among some tomato genotypes as revealed by ISSR and SCoT markers. Egypt. J. Genet. Cytol. 2018, 47, 139–159. Available online: http://journal.esg.net.eg/index.php/EJGC/article/view/281 (accessed on 6 September 2018).
  26. Dijkhuizen, A.; Kennard, W.C.; Havey, M.J.; Staub, J.E. RFLP variation and genetic relationships in cultivated cucumber. Euphtica 1996, 90, 79–87. [Google Scholar]
  27. Sensoy, S.; Büyükalaca, S.; Abak, K. Evaluation of genetic diversity in Turkish melons (Cucumis melo L.) based on phenotypic characters and RAPD markers. Genet. Resour. Crop. Evol. 2007, 54, 1351–1365. [Google Scholar] [CrossRef]
  28. Athanasios, L.T.; Koutita, O.; Anastasiadou, A. Description and analysis of genetic diversity among squash accessions. Braz. Arch. Biol. Technol. 2009, 52, 271–283. [Google Scholar]
  29. Zhang, J.; Li, X.D.; Jiang, T.L.; Cao, X.J. Photosynthesis and ultrastructure of photosynthetic apparatus in tomato leaves under elevated temperature. Photosynthetic 2014, 52, 430–436. [Google Scholar] [CrossRef]
  30. Cox, H.E.; Pearson, D. The Chemical Analysis of Foods; Chemical Publishing Co., Inc: New York, NY, USA, 1962; pp. 136–144. [Google Scholar]
  31. Hussein, E.H.A.; Mohamed, A.A.; Attia, S.; Adawy, S.S. Molecular characterization and genetic relationships among cotton genotypes 1- RAPD, ISSR and SSR analysis. Arab J. Biotech. 2006, 9, 313–328. [Google Scholar]
  32. Anderson, J.A.; Churchill, G.A.; Autrique, J.E.; Tanksley, S.D.; Sorrells, M.E. Optimizing parental selection for genetic linkage maps. Genome 1993, 36, 181–186. [Google Scholar] [CrossRef]
  33. Nagaraju, J.; Reddy, K.D.; Nagaraja, G.M.; Sethuraman, B.N. Comparison of multilocus RFLPs and PCR-based marker systems for genetic analysis of the silkworm, Bombyx mori. Heredity 2001, 86, 588–597. [Google Scholar] [CrossRef]
  34. Powell, W.; Morgante, M.; Andre, C.; Hanafey, M.; Vogel, J.; Tingey, S.; Rafalski, A. The comparison of RFLP, RAPD, AFLP and SSR (microsatellite) markers for germplasm analysis. Mol. Breed. 1996, 2, 225–238. [Google Scholar] [CrossRef]
  35. Prevost, A.; Wilkinson, M.J. A new system of comparing PCR primers applied to ISSR fingerprinting of potato cultivars. Theor. Appl. Genet. 1999, 98, 107–112. [Google Scholar] [CrossRef]
  36. Cochran, W.C.; Cox, G.M. Experimental Design, 2nd ed.; John Willey and Sons: New York, NY, USA, 1957. [Google Scholar]
  37. Duncan, B.D. Multiple range and multiple F test. Biometrics 1955, 11, 1–42. [Google Scholar] [CrossRef]
  38. Wilkinson, L. SYSTAT: The System Analysis for Statistic SYSTAT; Prentice Hall: Evanston, IL, USA, 1997. [Google Scholar]
  39. Luo, C.; He, X.-H.; Chen, H.; Ou, S.-J.; Gao, M.-P. Analysis of diversity and relationships among mango cultivars using Start Codon Targeted (SCoT) markers. Biochem. Syst. Ecol. 2010, 38, 1176–1184. [Google Scholar] [CrossRef]
  40. Latif, M.A.; Yusop, M.R.; Rahman, M.M.; Talukdar, M.B.; Rafii, M. Microsatellite and minisatellite markers based DNA fingerprinting and genetic diversity of blast and ufra resistant genotypes. Comptes Rendus Biol. 2011, 334, 282–289. [Google Scholar] [CrossRef] [PubMed]
  41. Elsayed, A.Y.A.M.; Elsaid, E.M.; Habiba, R.M. Selection for heat tolerance in tomato ex situ germplasm. J. Agric. Chem. Biotechnol. 2015, 6, 657–673. [Google Scholar] [CrossRef]
  42. Zhou, R.; Yu, X.; Kjær, K.H.; Rosenqvist, E.; Ottosen, C.-O.; Wu, Z. Screening and validation of tomato genotypes under heat stress using Fv/Fm to reveal the physiological mechanism of heat tolerance. Environ. Exp. Bot. 2015, 118, 1–11. [Google Scholar] [CrossRef]
  43. Molina-Bravo, R.; Arellano, C.; Sosinski, B.R.; Fernandez, G.E. A protocol to assess heat tolerance in a segregating population of raspberry using chlorophyll fluorescence. Sci. Hortic. 2011, 130, 524–530. [Google Scholar] [CrossRef]
  44. Golam, F.; Prodhan, Z.H.; Nezhadahmadi, A.; Rahman, M. Heat Tolerance in Tomato. Life Sci. J. 2012, 9, 1936–1950. [Google Scholar]
  45. Peet, M.M.; Willits, D.H.; Gardner, R. Response of ovule development and post- pollen production processes in male-sterile tomatoes tochronic, sub-acute high temperature stress. J. Exp. Bot. 1997, 48, 101–111. [Google Scholar] [CrossRef]
  46. Kafizadeh, N.; Carapetian, J.; Kalantari, K.M. Effect of heat stress on pollen viability and pollen tube growth in pepper. Res. J. Biol. Sci. 2008, 3, 1159–1162. [Google Scholar]
  47. El-Tantawy, E.M.; Rewaa, S.E. Improving Tomato Productivity under High Temperature Conditions. Hortsci. J. Suez Canal Univ. 2017, 6, 15–29. [Google Scholar]
  48. Zhou, R.; Kjaer, K.H.; Rosenqvist, E.; Yu, X.; Wu, Z.; Ottosen, C.-O. Physiological Response to Heat Stress During Seedling and Anthesis Stage in Tomato Genotypes Differing in Heat Tolerance. J. Agron. Crop. Sci. 2017, 203, 68–80. [Google Scholar] [CrossRef]
  49. El-Twab, M.H.A.; Barakat, N.A.M.; El-Hafeez, A.A.A. Cytogenetical and ecological studies of some wild congeneric species in the Solanaceae distributed in Upper Egypt. Chromosom. Bot. 2010, 5, 65–73. [Google Scholar] [CrossRef]
  50. Banks, P. A new diploid chromosome number for tomato (Lycopersicon esculentum). Can. J. Genet. Cytol. 1984, 26, 636–639. [Google Scholar] [CrossRef]
  51. Badr, A.; Khalifa, S.F.; Aboel-Atta, A.I.; Abou-El-Enain, M.M. Chromosomal Criteria and Taxonomic Relationships in the Solanaceae. Cytologia 1997, 62, 103–113. [Google Scholar] [CrossRef]
  52. Imai, H.T.; Satta, Y.; Takahata, N. Integrative Study on Chromosome Evolution of Mammals, Ants and Wasps Based on the Minimum Interaction Theory. J. Theor. Biol. 2001, 210, 475–497. [Google Scholar] [CrossRef]
  53. Li, S.-F.; Su, T.; Cheng, G.-Q.; Wang, B.-X.; Li, X.; Deng, C.-L.; Gao, W.-J. Chromosome Evolution in Connection with Repetitive Sequences and Epigenetics in Plants. Genes 2017, 8, 290. [Google Scholar] [CrossRef]
  54. Guerra, M. Patterns of heterochromatin distribution in plant chromosomes. Genet. Mol. Biol. 2000, 23, 1029–1041. [Google Scholar] [CrossRef]
  55. Stebbins, G.L. Chromosomal Evolution in Higher Plants; Edward Arnold Publishers Ltd: London, UK, 1971. [Google Scholar]
  56. Moscone, E.; Scaldaferro, M.; Grabiele, M.; Cecchini, N.; García, Y.S.; Jarret, R.; Daviña, J.; Ducasse, D.; Barboza, G.; Ehrendorfer, F. The evolution of chili peppers (Capsicum-Solanaceae): A cytogenetic perspective. Acta Hortic. 2007, 745, 137–170. [Google Scholar] [CrossRef]
  57. Fonsêca, A.; Pedrosa-Harand, A. Karyotype stability in the genus Phaseolus evidenced by the comparative mapping of the wild species Phaseolus microcarpus. Genome 2013, 56, 335–343. [Google Scholar] [CrossRef] [PubMed]
  58. Zuo, L.; Yuan, Q. The difference between the heterogeneity of the centromeric index and intrachromosomal asymmetry. Plant Syst. Evol. 2011, 297, 141–145. [Google Scholar] [CrossRef]
  59. Murat, F.; Zhang, R.; Guizard, S.; Gavranovic, H.; Flores, R.; Steinbach, D.; Quesneville, H.; Tannier, E.; Salse, J. Karyotype and gene order evolution from reconstructed extinct ancestors highlight contrasts in genome plasticity of modern rosid crops. Genome Biol. Evol. 2015, 7, 735–749. [Google Scholar] [CrossRef] [PubMed]
  60. Ng, W.L.; Tan, S.G. Inter-Simple Sequence Repeat (ISSR) Markers: Are We Doing It Right? ASM Sci. J. 2015, 9, 30–39. [Google Scholar]
  61. Hassan, N.; Mostafa, S.; Twfik, A. Assessment of genetic diversity of tomato (Lycopersicon esculentum L.) germplasm using molecular markers (RAPD and ISSR). Egypt. J. Genet. Cytol. 2013, 42, 163–182. [Google Scholar] [CrossRef]
  62. Meng, F.-J.; Xu, X.-Y.; Huang, F.-L.; Li, J.-F. Analysis of Genetic Diversity in Cultivated and Wild Tomato Varieties in Chinese Market by RAPD and SSR. Agric. Sci. China 2010, 9, 1430–1437. [Google Scholar] [CrossRef]
  63. Sharifova, S.S.; Mehdiyeva, S.P.; Abbasov, M.A. Analysis of genetic diversity among different tomato genotypes using ISSR DNA marker. Genetika 2017, 49, 31–42. [Google Scholar] [CrossRef]
  64. Shahlaei, A.; Torabi, S.; Khosroshahli, M. Efficiacy of SCoT and ISSR marekers in assesment of tomato (Lycopersicum esculentum Mill.) genetic diversity. Int. J. Biosci. 2014, 5, 14–22. [Google Scholar]
  65. Lin, K.; Lo, H.; Lee, S.-P.; Kuo, C.G.; Chen, J.-T.; Yeh, W.-L. RAPD markers for the identification of yield traits in tomatoes under heat stress via bulked segregant analysis. Hereditas 2006, 143, 142–154. [Google Scholar] [CrossRef] [PubMed]
  66. Adhikari, S.; Saha, S.; Bandyopadhyay, T.K.; Ghosh, P. Efficiency of ISSR marker for characterization of Cymbopogon germplasms and their suitability in molecular barcoding. Plant Syst. Evol. 2015, 301, 439–450. [Google Scholar] [CrossRef]
  67. El-Aziz, M.H.A.; Habiba, R.M.M. Molecular assessment of genetic diversity in some canola homozygous line. Egypt. J. Genet. Cytol. 2016, 45, 129–145. [Google Scholar] [CrossRef]
  68. El-Hadi, A.A.; El-Aziz, M.A.; Alla, M.A.; Ashak, M. Molecular and Phenotypic Evaluation of some Summer Squash Inbred Lines. J. Agric. Chem. Biotechnol. 2017, 8, 281–287. [Google Scholar] [CrossRef]
  69. El-Moneim, A. Characterization of ISSR and SCoT Markers and TaWRKY Gene Expression in some Egyptian Wheat Genotypes under Drought Stress. J. Plant Prod. Sci. 2019, 8, 31–46. Available online: https://jpps.journals.ekb.eg/article_72549.html (accessed on 27 December 2019).
  70. Nagy, E.; Gyulai, G.; Szabó, Z.; Hegyi, Z.; Marton, L.C. Application of morphological descriptions and genetic markers to analyse polymorphism and genetic relationships in maize (Zea mays L.). Acta Agron. Hung. 2003, 51, 257–265. [Google Scholar] [CrossRef]
  71. Srinivasan, T.; Nagarajan, P.; Senthil, N.; Gnanam, R.; Ponnuswami, V. DNA fingerprinting in Tomato (Lycopersicon esculentum Mill.) germplasm accessions using molecular markers. Int. J. Integr. Biol. 2013, 14, 86–95. [Google Scholar]
Figure 1. Mean of maximum (High > Hi) and minimum (Low > Lo) temperature (average of 2 seasons, 2018 and 2019).
Horticulturae 07 00065 g001
Figure 2. Mean performance (combined data from two seasons, 2018 and 2019) represented as mean ± SD for all studied traits under North Sinai conditions. All data are means of three replicates. One-way analysis of variance (ANOVA) was performed to test the effect of different tomato genotypes on the studied traits. Different lowercase letters indicate significant differences within the studied genotypes according to Duncan’s multiple range test. For all statistical tests, p-values ≤ 0.05 were considered to be statistically significant.
Horticulturae 07 00065 g002
Figure 3. Somatic chromosome number of six lines of tomato (A) G1: 2n = 24, (B) G2: 2n = 24, (C) G3: 2n = 24, (D) G4: 2n = 24, (E) G5:2n = 26, (F) G6: 2n = 24, X = 1000. Scale bar = 30 μm.
Horticulturae 07 00065 g003
Figure 4. Ideogram of six lines of tomato. Scale bar = 30 μm.
Horticulturae 07 00065 g004
Figure 5. (A) Cluster analysis of six genotypes of tomatoes based on karyotype attributes using the 1-gamma coefficient average linkage method; (B) biplot of six lines of tomatoes using different karyotype parameters (lines in blue and green do not represent anything, they are solely for demonstration); (C) dendrogram of combined molecular data (RAPD, ISSR, and SCoT) analysis of six tomato lines; (D) cluster analysis of six lines of tomatoes based on combined cytological and molecular data using the average linkage method; (1) G1, (2) G2, (3) G3, (4) G4, (5) G5, (6) G6. The distance metric is Euclidean distance.
Horticulturae 07 00065 g005
Table 1. Different karyotype parameters for six lines of tomato.
GenotypesChromosome Number (2n)THL (µm)CVCICVCLMCAASK%TF%Syi IndexRec IndexA1A2ADIAIStebbKF
G124375.226.1918.528.8754.44%45.56%83.69%65.74%0.160.190.098.431.151B18 nm + 6 m
G224393.1110.3716.2813.5156.96%43.04%75.55%72.92%0.230.160.146.851.691A6 nsm(-) + 14 nm + 4 m
G324323.086.3822.2213.1656.48%43.52%77.04%64.99%0.230.220.1310.041.421B22 nm + 2 m
G424452.7514.7617.3116.7558.05%41.95%72.25%69.59%0.270.170.177.562.562B4 nsm(-) + 18 nm + 2 m
G526464.489.7722.4912.8156.54%43.46%76.88%63.61%0.220.220.139.792.202B2 nsm(-) + 18 nm + 6 nm
G624425.139.622.549.9654.89%45.11%82.19%65.80%0.170.230.1010.912.161B2 nsm(-) + 12 nm + 10 nm
THL: Total haploid chromosome length; CVCI: Coefficient of variation of centromeric index; CVCL: Coefficient of variation of chromosome length; MCA: Mean centromeric asymmetry; ASK: Karyotype asymmetry index; TF%: Total form percentage; Syi: Symmetry index; Rec index: Resemblance between chromosomes; A1: Intrachromosomal asymmetry index; A2: Interchromosomal asymmetry index; AI: Asymmetry index; Stebb: Stebbins classification; KF: Karyotype formula.
Table 2. The primer names, amplified DNA bands, and polymorphism percentages generated by random amplified polymorphic DNA (RAPD), inter-simple sequence repeat (ISSR), and start codon-targeted (SCoT) primers.
MarkerPrimerMBPBUBTABFSPICEMRMIP (%)RP
RAPDOP-A37.000.000.007.00190–8650.000.000.000.00%14.0
OP-A97.000.000.007.00180–8900.130.000.000.00%12.5
OP- B33.003.000.006.00245–10750.281.500.4250.00%8.70
OP-C93.000.000.003.00300–7000.000.000.000.00%6.00
OP-C154.003.002.007.00375–10500.261.290.3342.86%10.3
OP-K22.002.002.004.00345–7350.151.000.1550.00%6.77
OP-K32.000.000.002.00450–6350.000.000.000.00%4.00
Ave. 4.001.140.575.14 0.120.540.1320.41%8.90
SCoTSCoT 23.003.002.006.00200–5300.311.500.4750.00%8.33
SCoT 44.000.000.004.00120–4300.000.000.000.00%8.00
SCoT 126.002.000.008.00275–7650.180.500.0925.00%13.1
SCoT 133.002.000.005.00390–8400.280.800.2240.00%7.16
SCoT 152.002.001.004.00225–5600.221.000.2250.00%6.27
Ave. 3.601.800.605.40 0.200.760.2033.00%8.57
ISSR49A1.003.000.004.00245–6300.582.251.3175.00%3.33
49B2.004.001.006.00170–9400.442.671.1766.67%6.72
89B1.002.000.003.00380–7000.591.330.7966.67%2.44
HB-83.003.001.006.00370–12900.321.500.4850.00%8.16
HB-96.001.001.007.00270–9400.040.140.0114.29%13.4
HB-141.003.003.004.00280–8600.232.250.5275.00%6.16
HB-153.002.000.005.00240–5400.290.800.2340.00%7.11
Ave. 2.432.570.865.00 0.361.560.6455.37%6.76
MB: Monomorphic band, UB: Unique band, PB: Polymorphic band, TAB: Total amplified bands, FS: Fragment size, PIC: Polymorphic information content, EMR: Effective multiplex ratio, MI: Marker index, %P: Percentage of polymorphism, Rp: Resolving power.
Table 3. Band characteristics and number of positive and negative unique bands produced using RAPD, ISSR, and SCoT markers in studied tomato lines.
ParameterRAPDSCoTISSR
Total bands362735
Monomorphic bands171817
Polymorphic bands8918
Unique bandsNo. of unique bands436
Positive bands670 (G5)530 (G2)-
PrimersOPC15SCoT2-
Negative bands720 (G2)400 (G6)735 (G6)260 (G2)500 (G1)475 (G1)700 (G1)280 (G4)345 (G4)860 (G5)940 (G6)
PrimersOPC15OPK2SCoT2SCoT1549-BHB-8HB-14HB-9
% Polymorphism22%33.33%51.43%
Publisher’s Note: MDPI stays neutral with regard to jurisdictional claims in published maps and institutional affiliations.

