
Renewable Energy Deployment and COVID-19 Measures for Sustainable Development

 ,
,  , and
, and 
Abstract
:1. Introduction
2. Literature Review
- Efficient feed-in-tariff policies for renewable energy technologies;
- Understanding the dynamics and policy for renewable energy diffusion in Colombia;
- Cost-efficient demand-pull policies for multipurpose technologies: the case of stationary electricity storage;
- Integrated benefit–cost analysis of China’s optimal adaptation and targeted mitigation;
- Local demand-pull policy and energy innovation: evidence from the solar photovoltaic market in China.
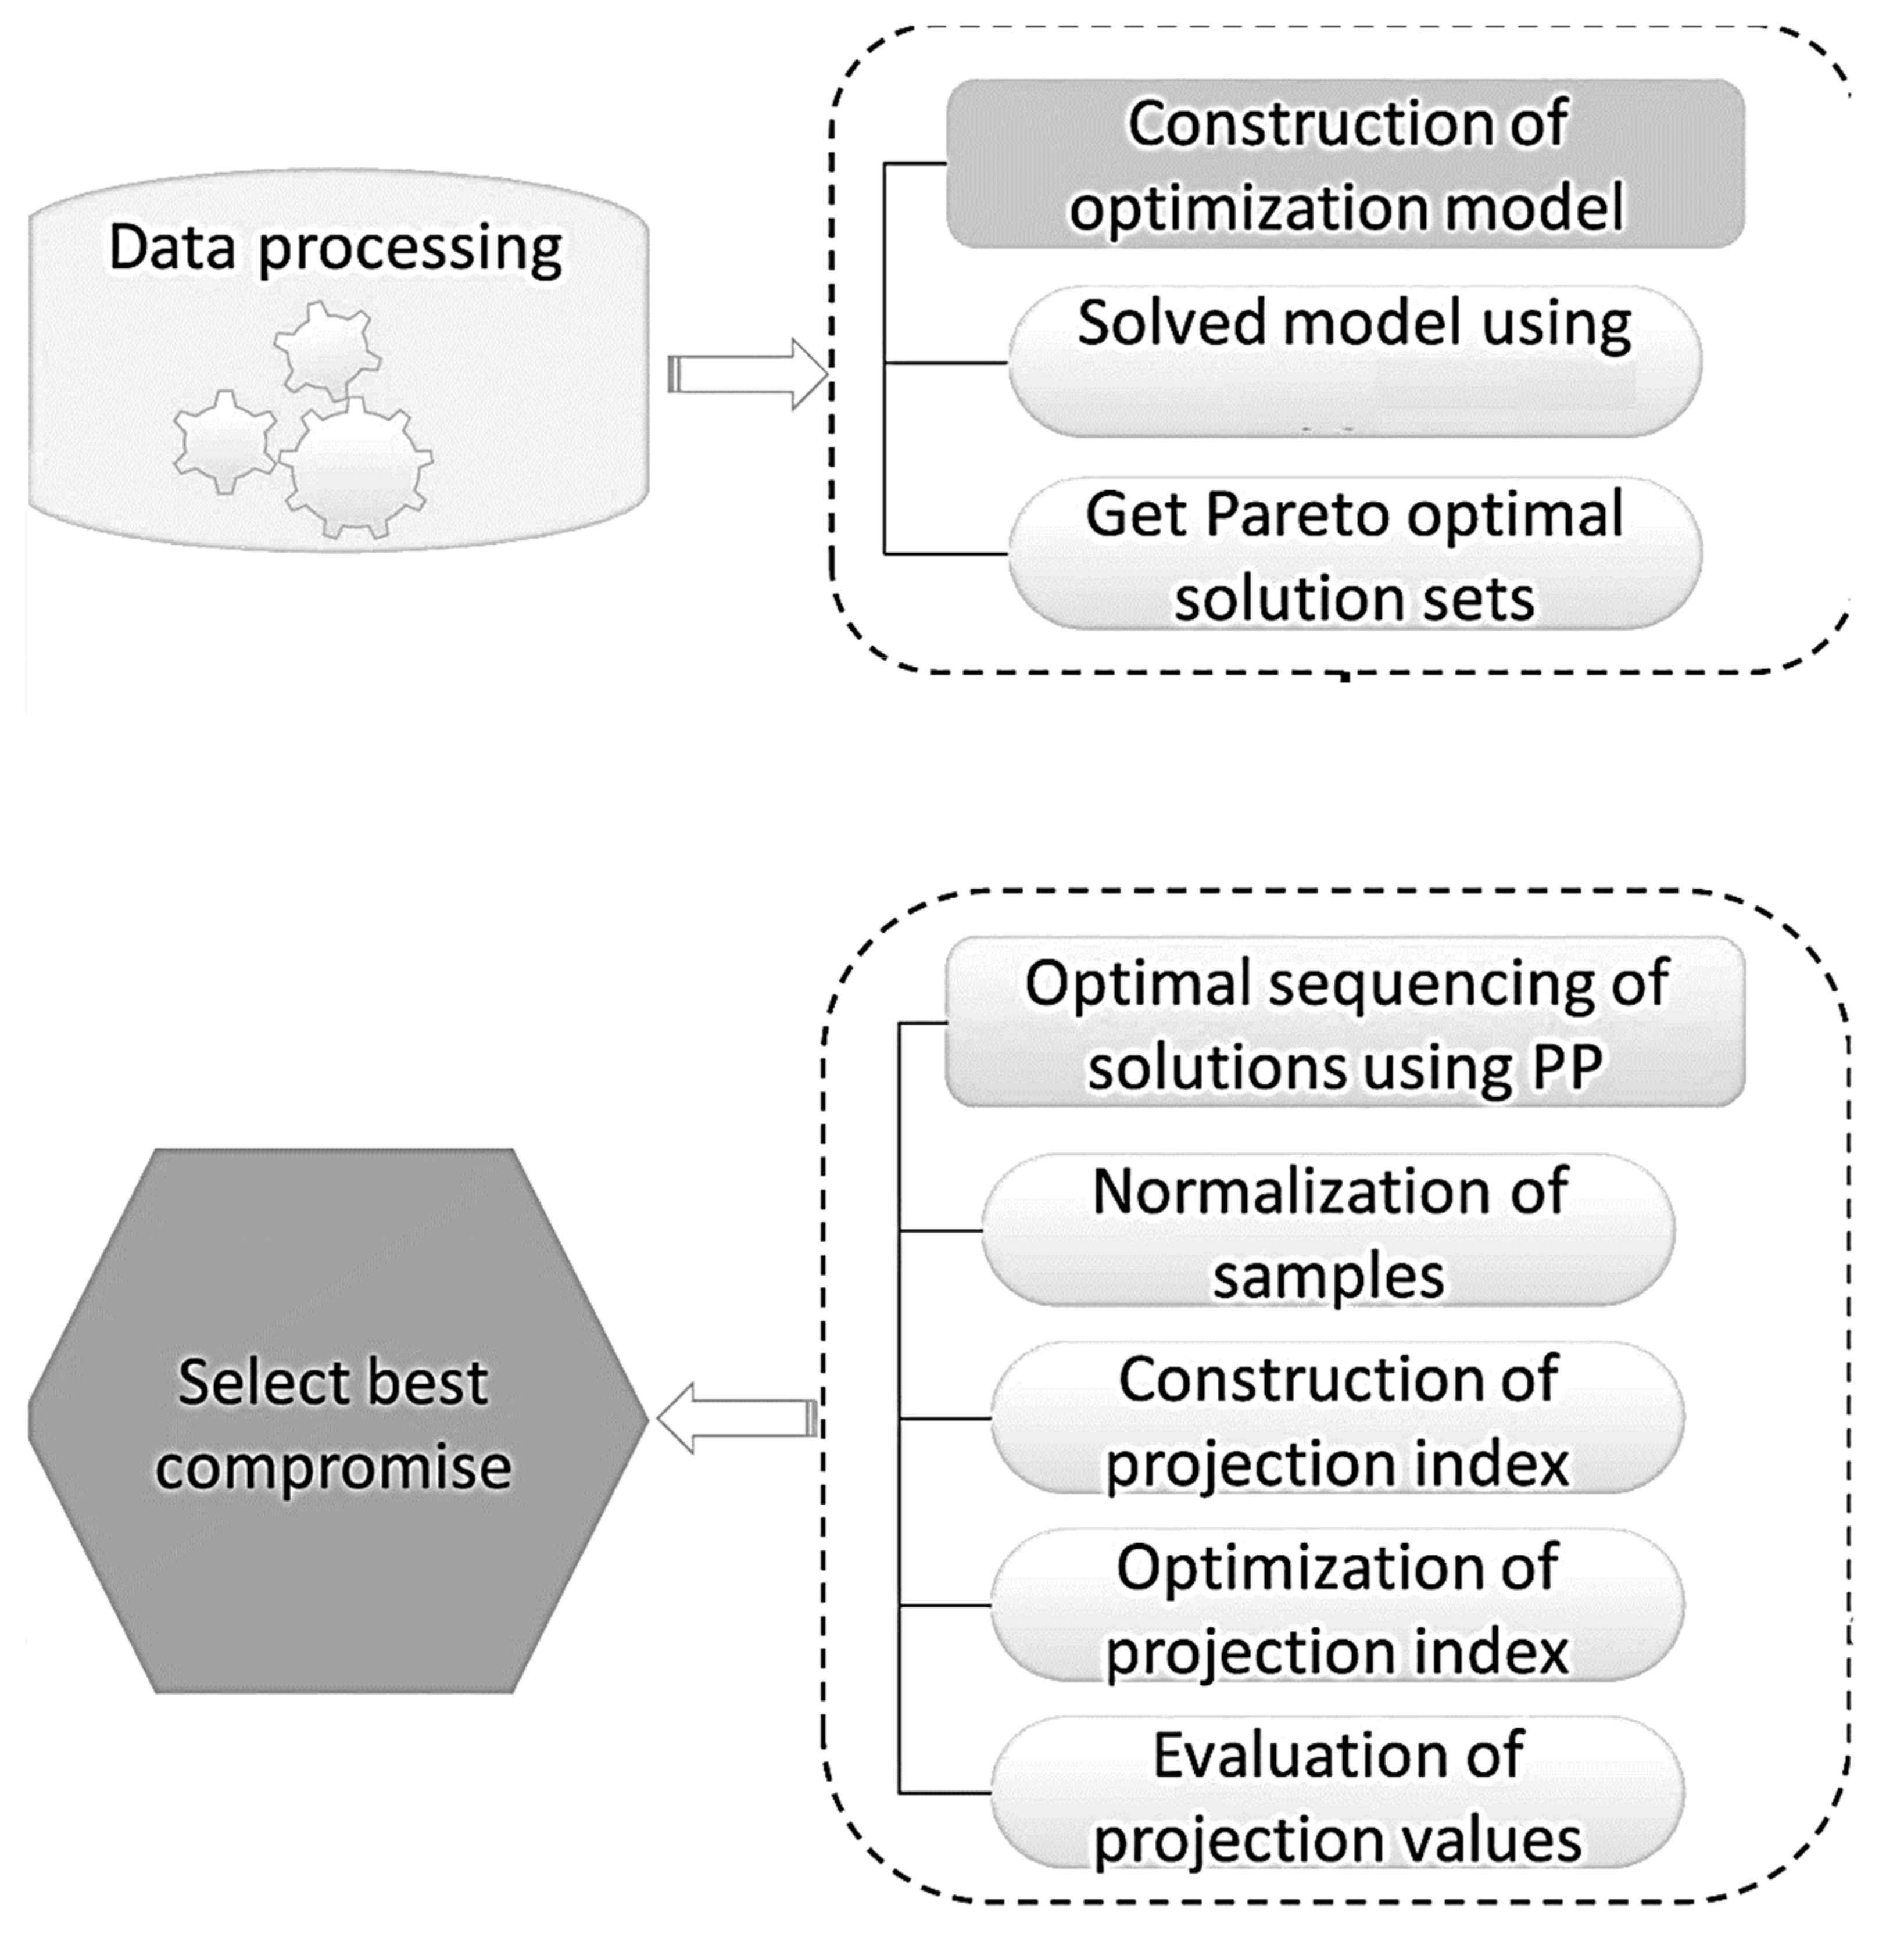
3. Materials and Methods
- 1.
- Time of information and physical delays are defined by
- 2.
- Behavior is implemented, taking into account policies, information and confusions in
- 2.
- Results are implemented on t+ℓ, taking into account policy, behavior, information and confusion.
4. Results
5. Discussion
6. Conclusions
Author Contributions
Funding
Institutional Review Board Statement
Informed Consent Statement
Data Availability Statement
Conflicts of Interest
Appendix A

| Indicator | RMSE | MAPE | DAR | 2016 | 2017 | 2018 | 2019 | 2020 | 2021 | 2022 | 2023 | 2024 | 2025 |
|---|---|---|---|---|---|---|---|---|---|---|---|---|---|
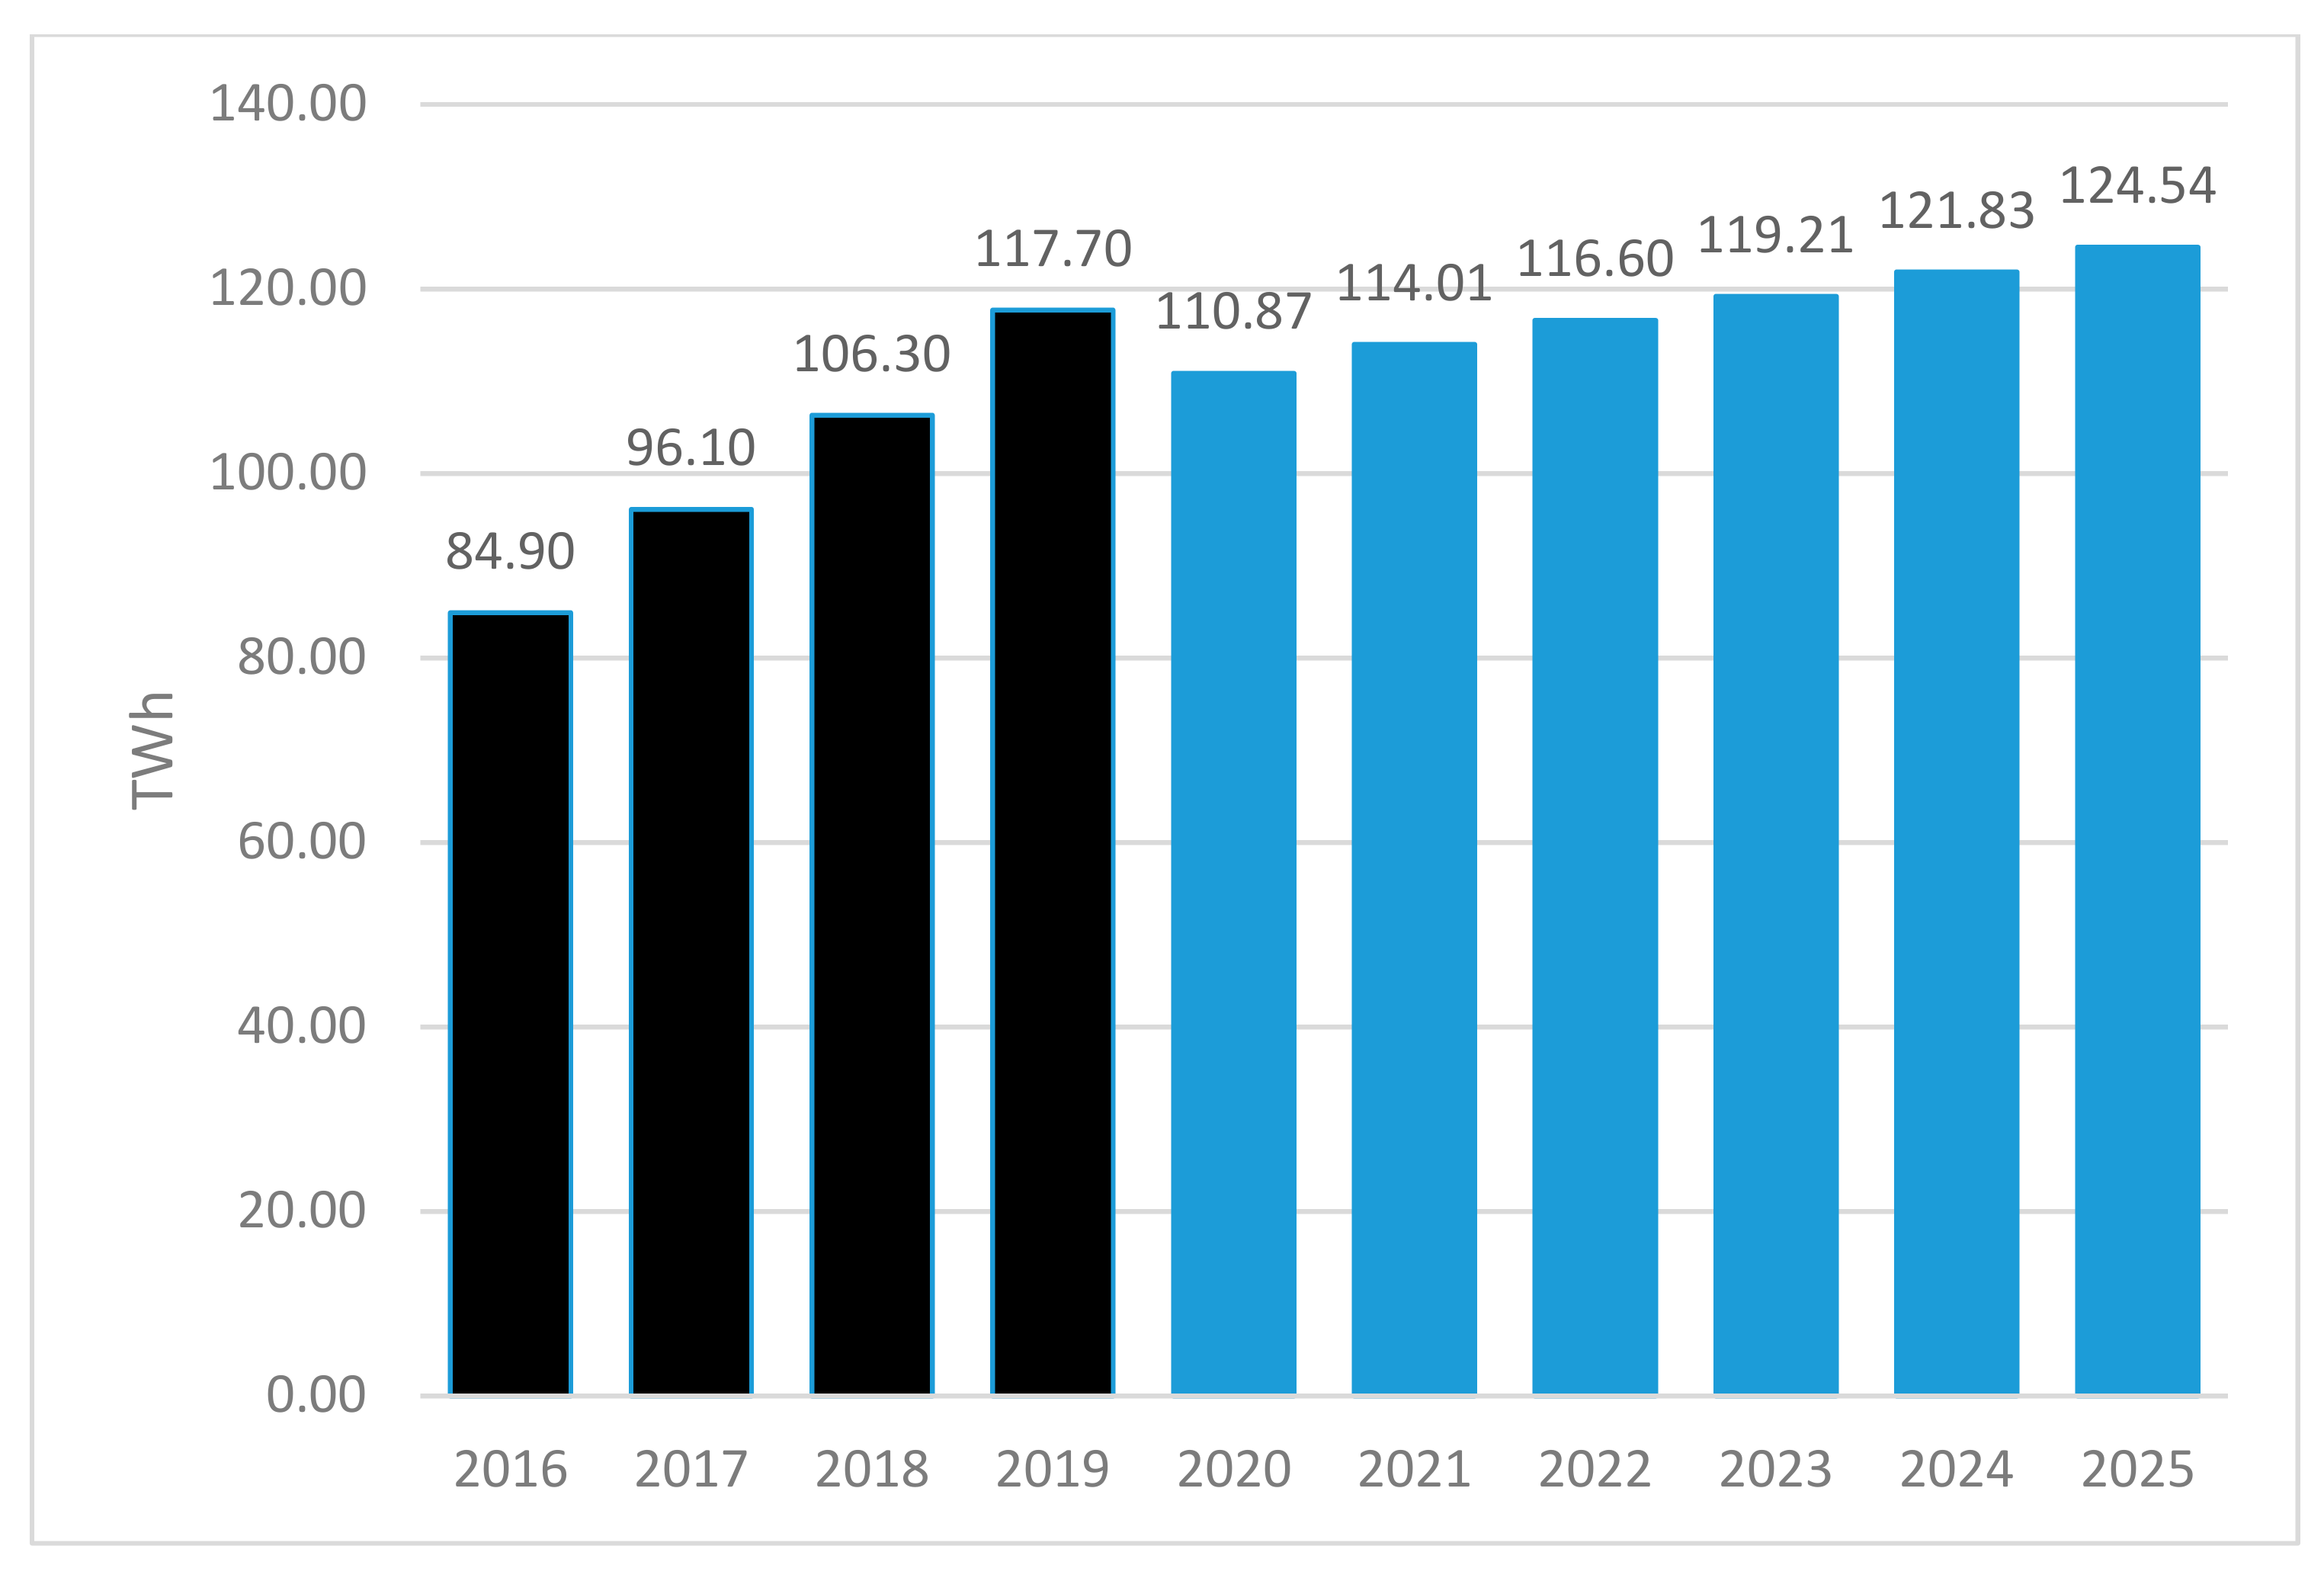
| Brazil. % | - | - | - | −3.28 | 1.32 | 1.32 | 1.14 | −5.80 | 2.83 | 2.27 | 2.24 | 2.21 | 2.22 |
| Brazil. TWh | 12.26 | 5.52 | 0.31 | 84.90 | 96.10 | 106.30 | 117.70 | 110.87 | 114.01 | 116.60 | 119.21 | 121.83 | 124.54 |
| China. % | - | - | - | 6.85 | 6.95 | 6.75 | 6.11 | 1.85 | 8.24 | 5.80 | 5.73 | 5.65 | 5.49 |
| China. TWh | 15.23 | 12.55 | 0.22 | 369.50 | 502.00 | 636.40 | 732.30 | 745.85 | 807.29 | 854.10 | 903.06 | 954.05 | 1006.47 |
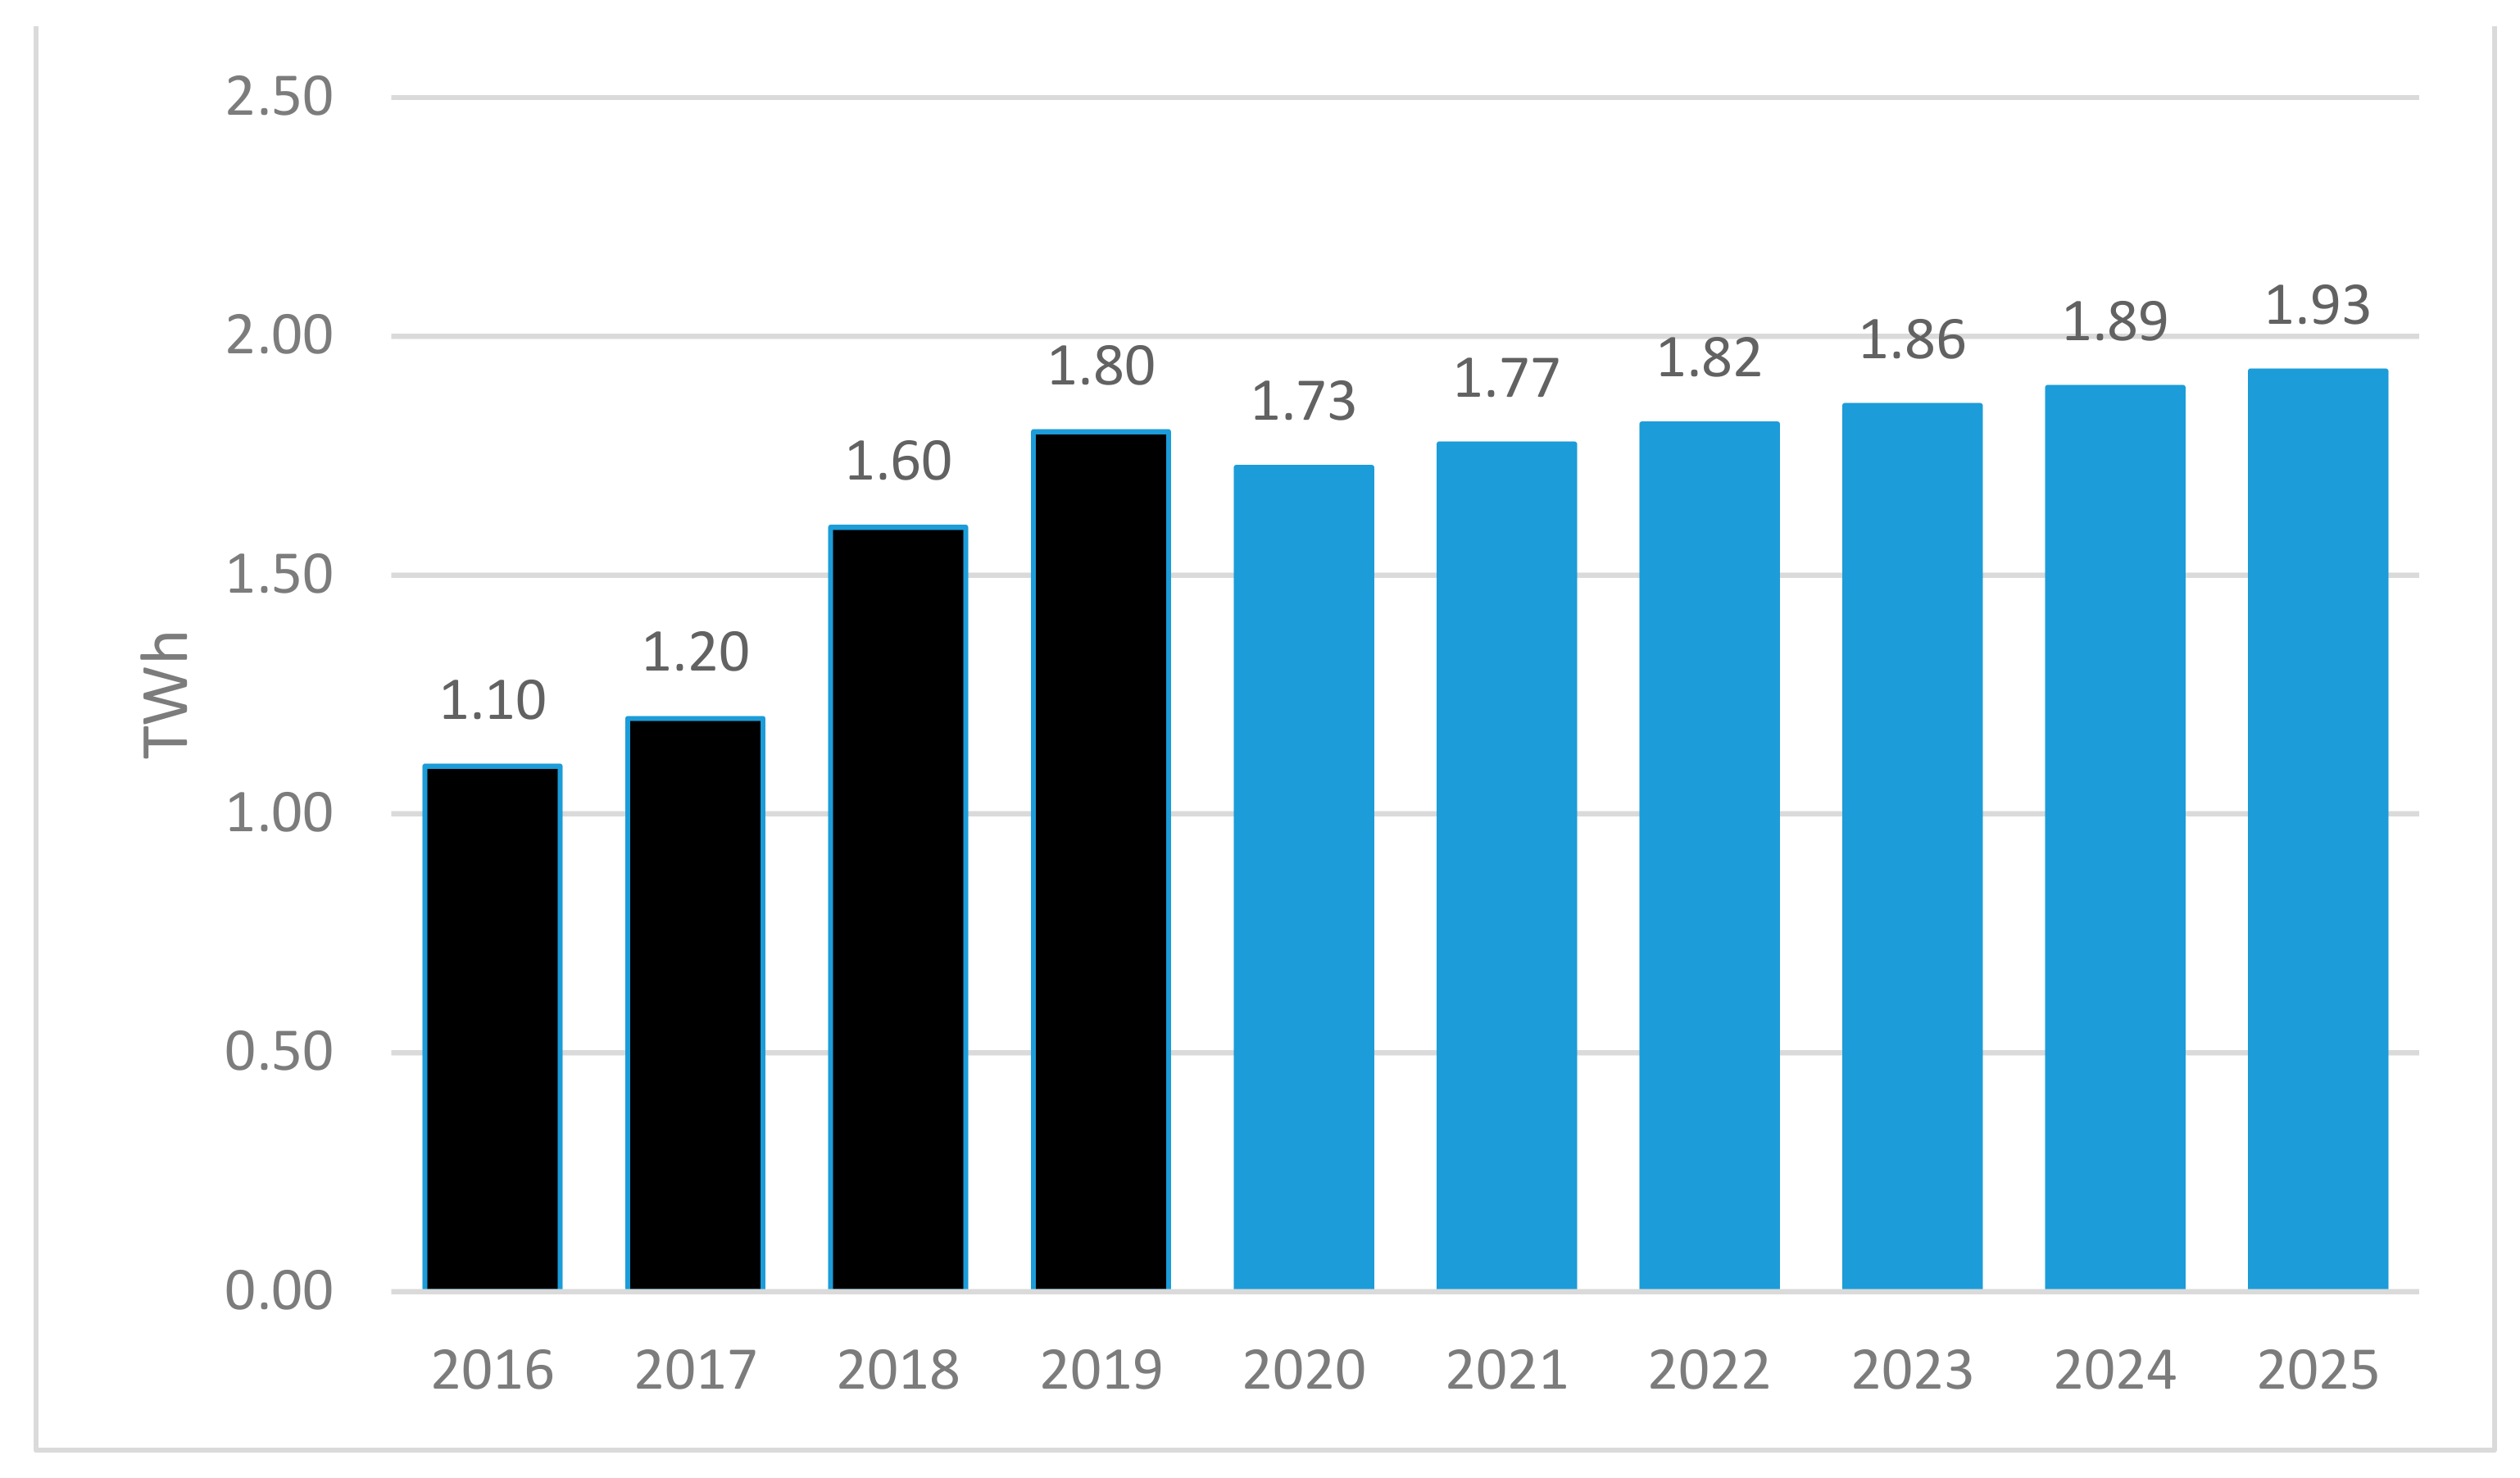
| Russia. % | - | - | - | 0.19 | 1.83 | 2.54 | 1.34 | −4.12 | 2.82 | 2.35 | 2.15 | 2.05 | 1.80 |
| Russia. TWh | 19.26 | 17.62 | 0.13 | 1.10 | 1.20 | 1.60 | 1.80 | 1.73 | 1.77 | 1.82 | 1.86 | 1.89 | 1.93 |
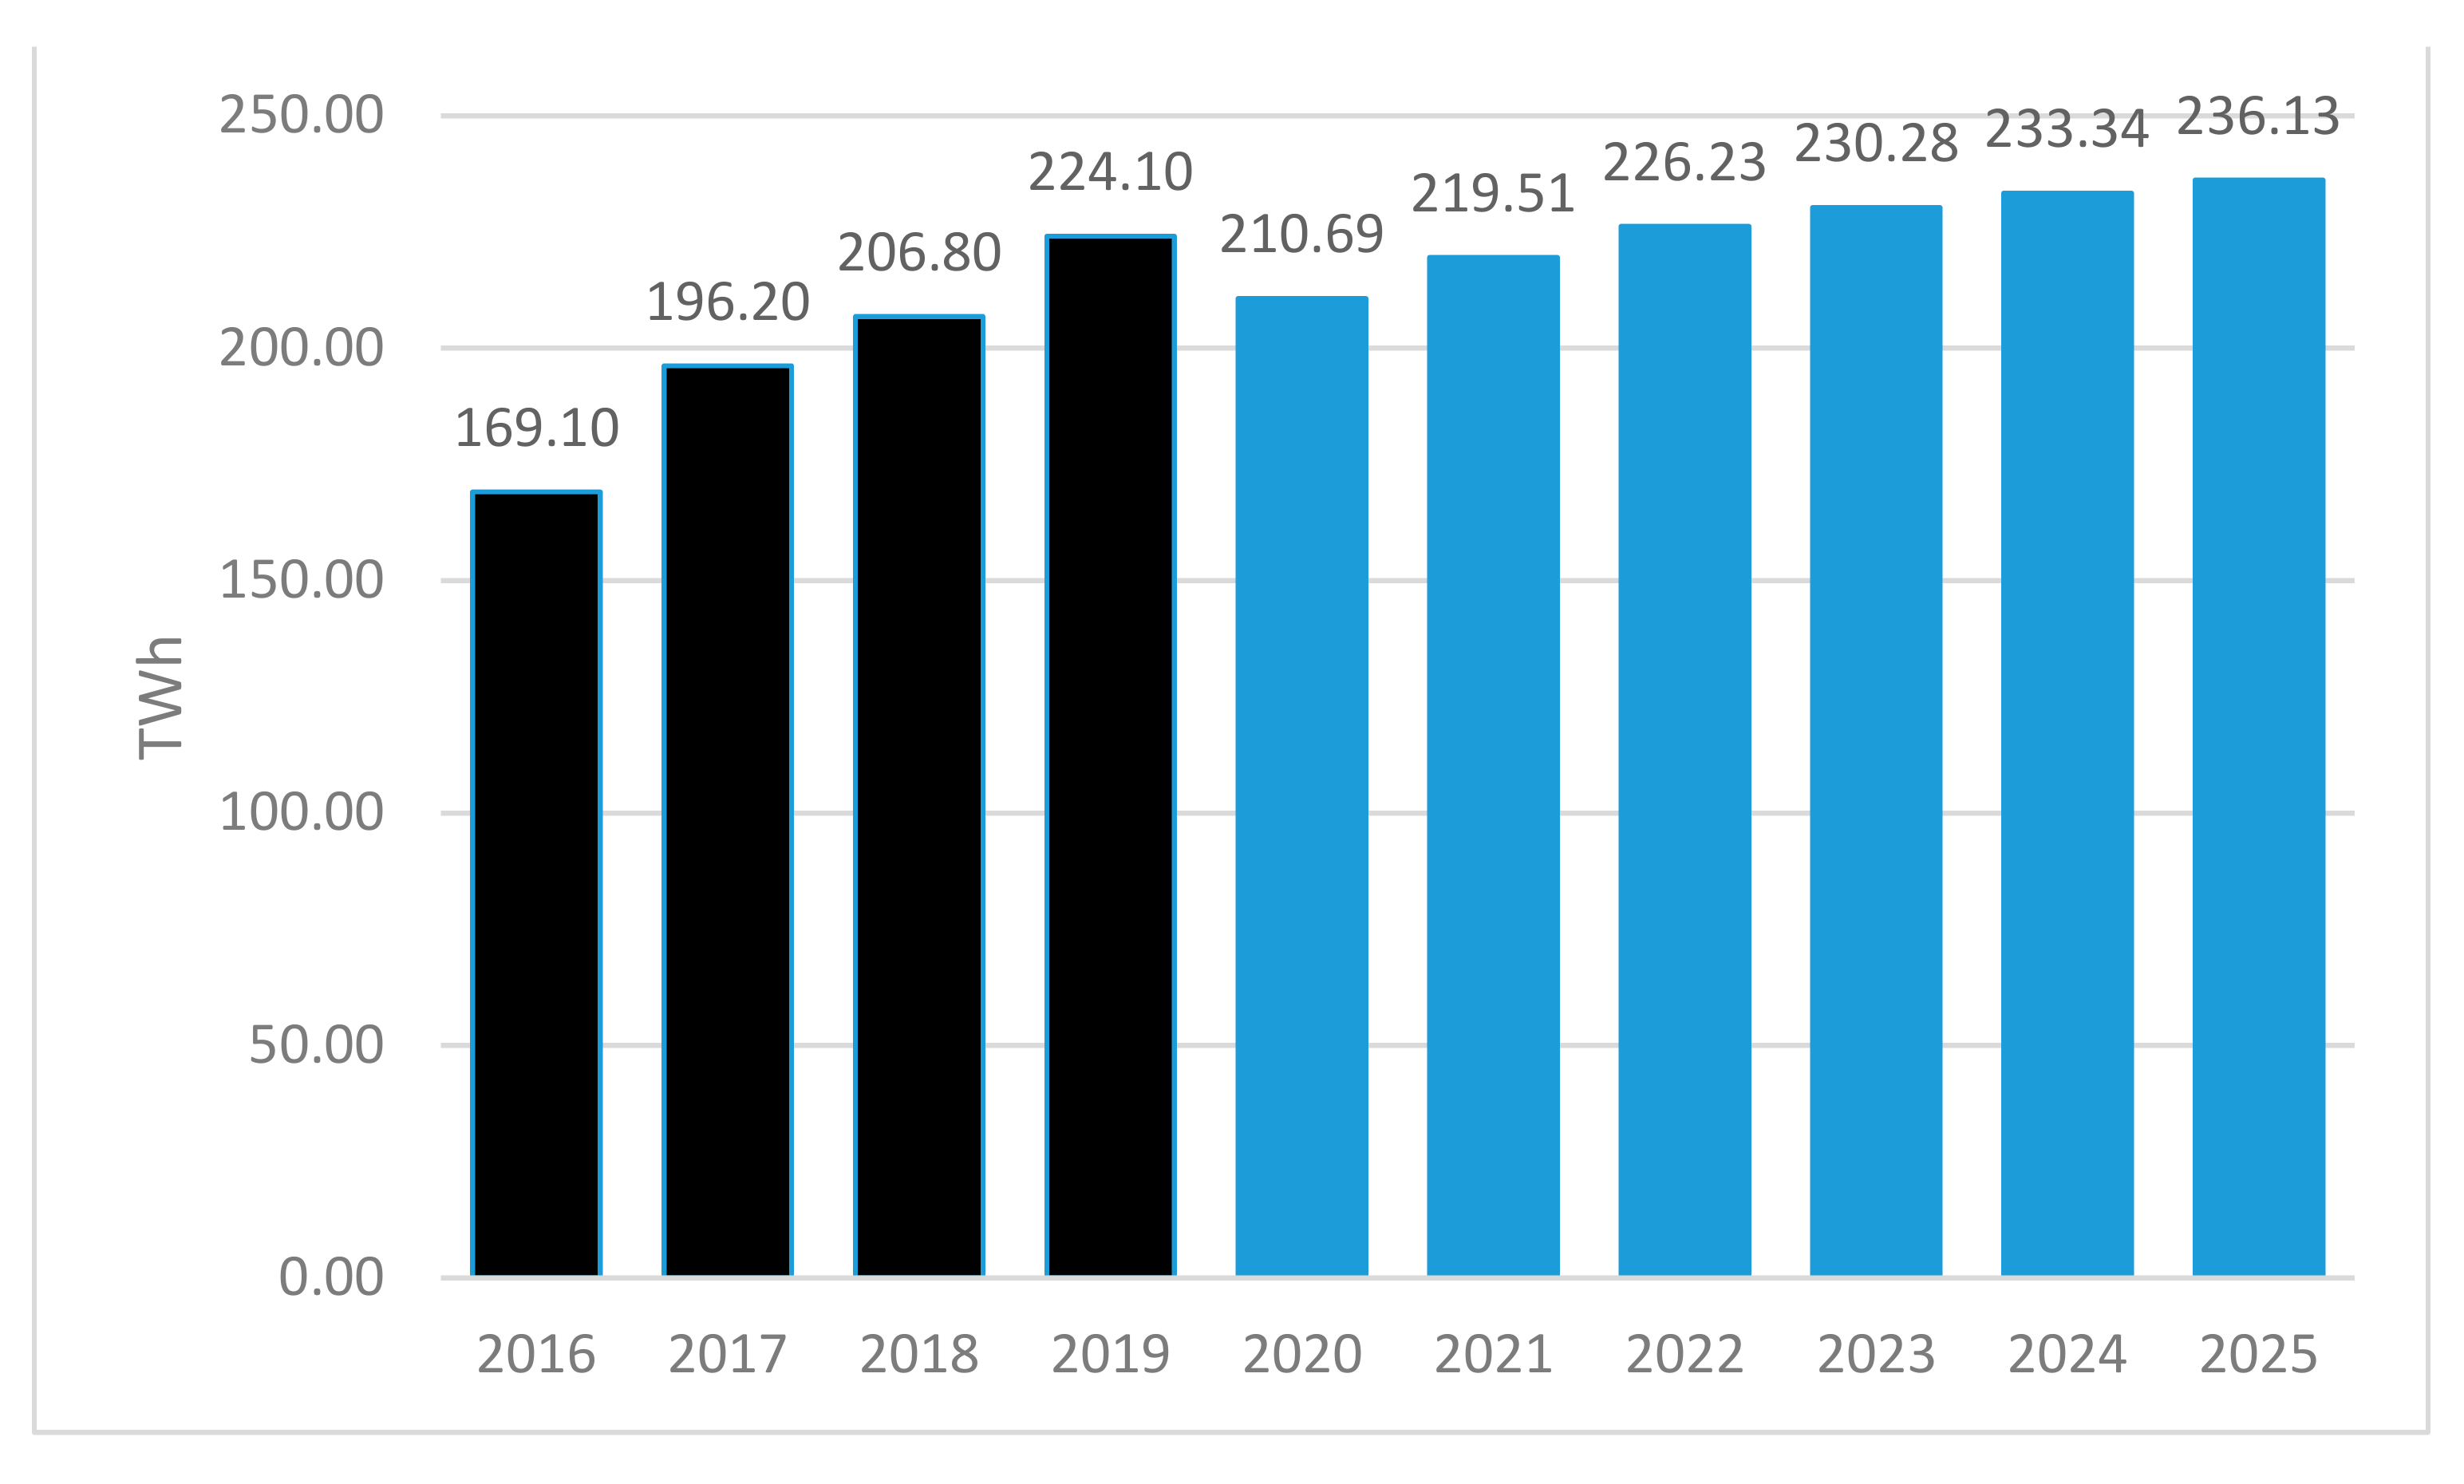
| Germany. % | - | - | - | 2.23 | 2.60 | 1.27 | 0.56 | −5.98 | 4.18 | 3.06 | 1.79 | 1.33 | 1.20 |
| Germany. TWh | 11.18 | 12.73 | 0.69 | 169.10 | 196.20 | 206.80 | 224.10 | 210.69 | 219.51 | 226.23 | 230.28 | 233.34 | 236.13 |
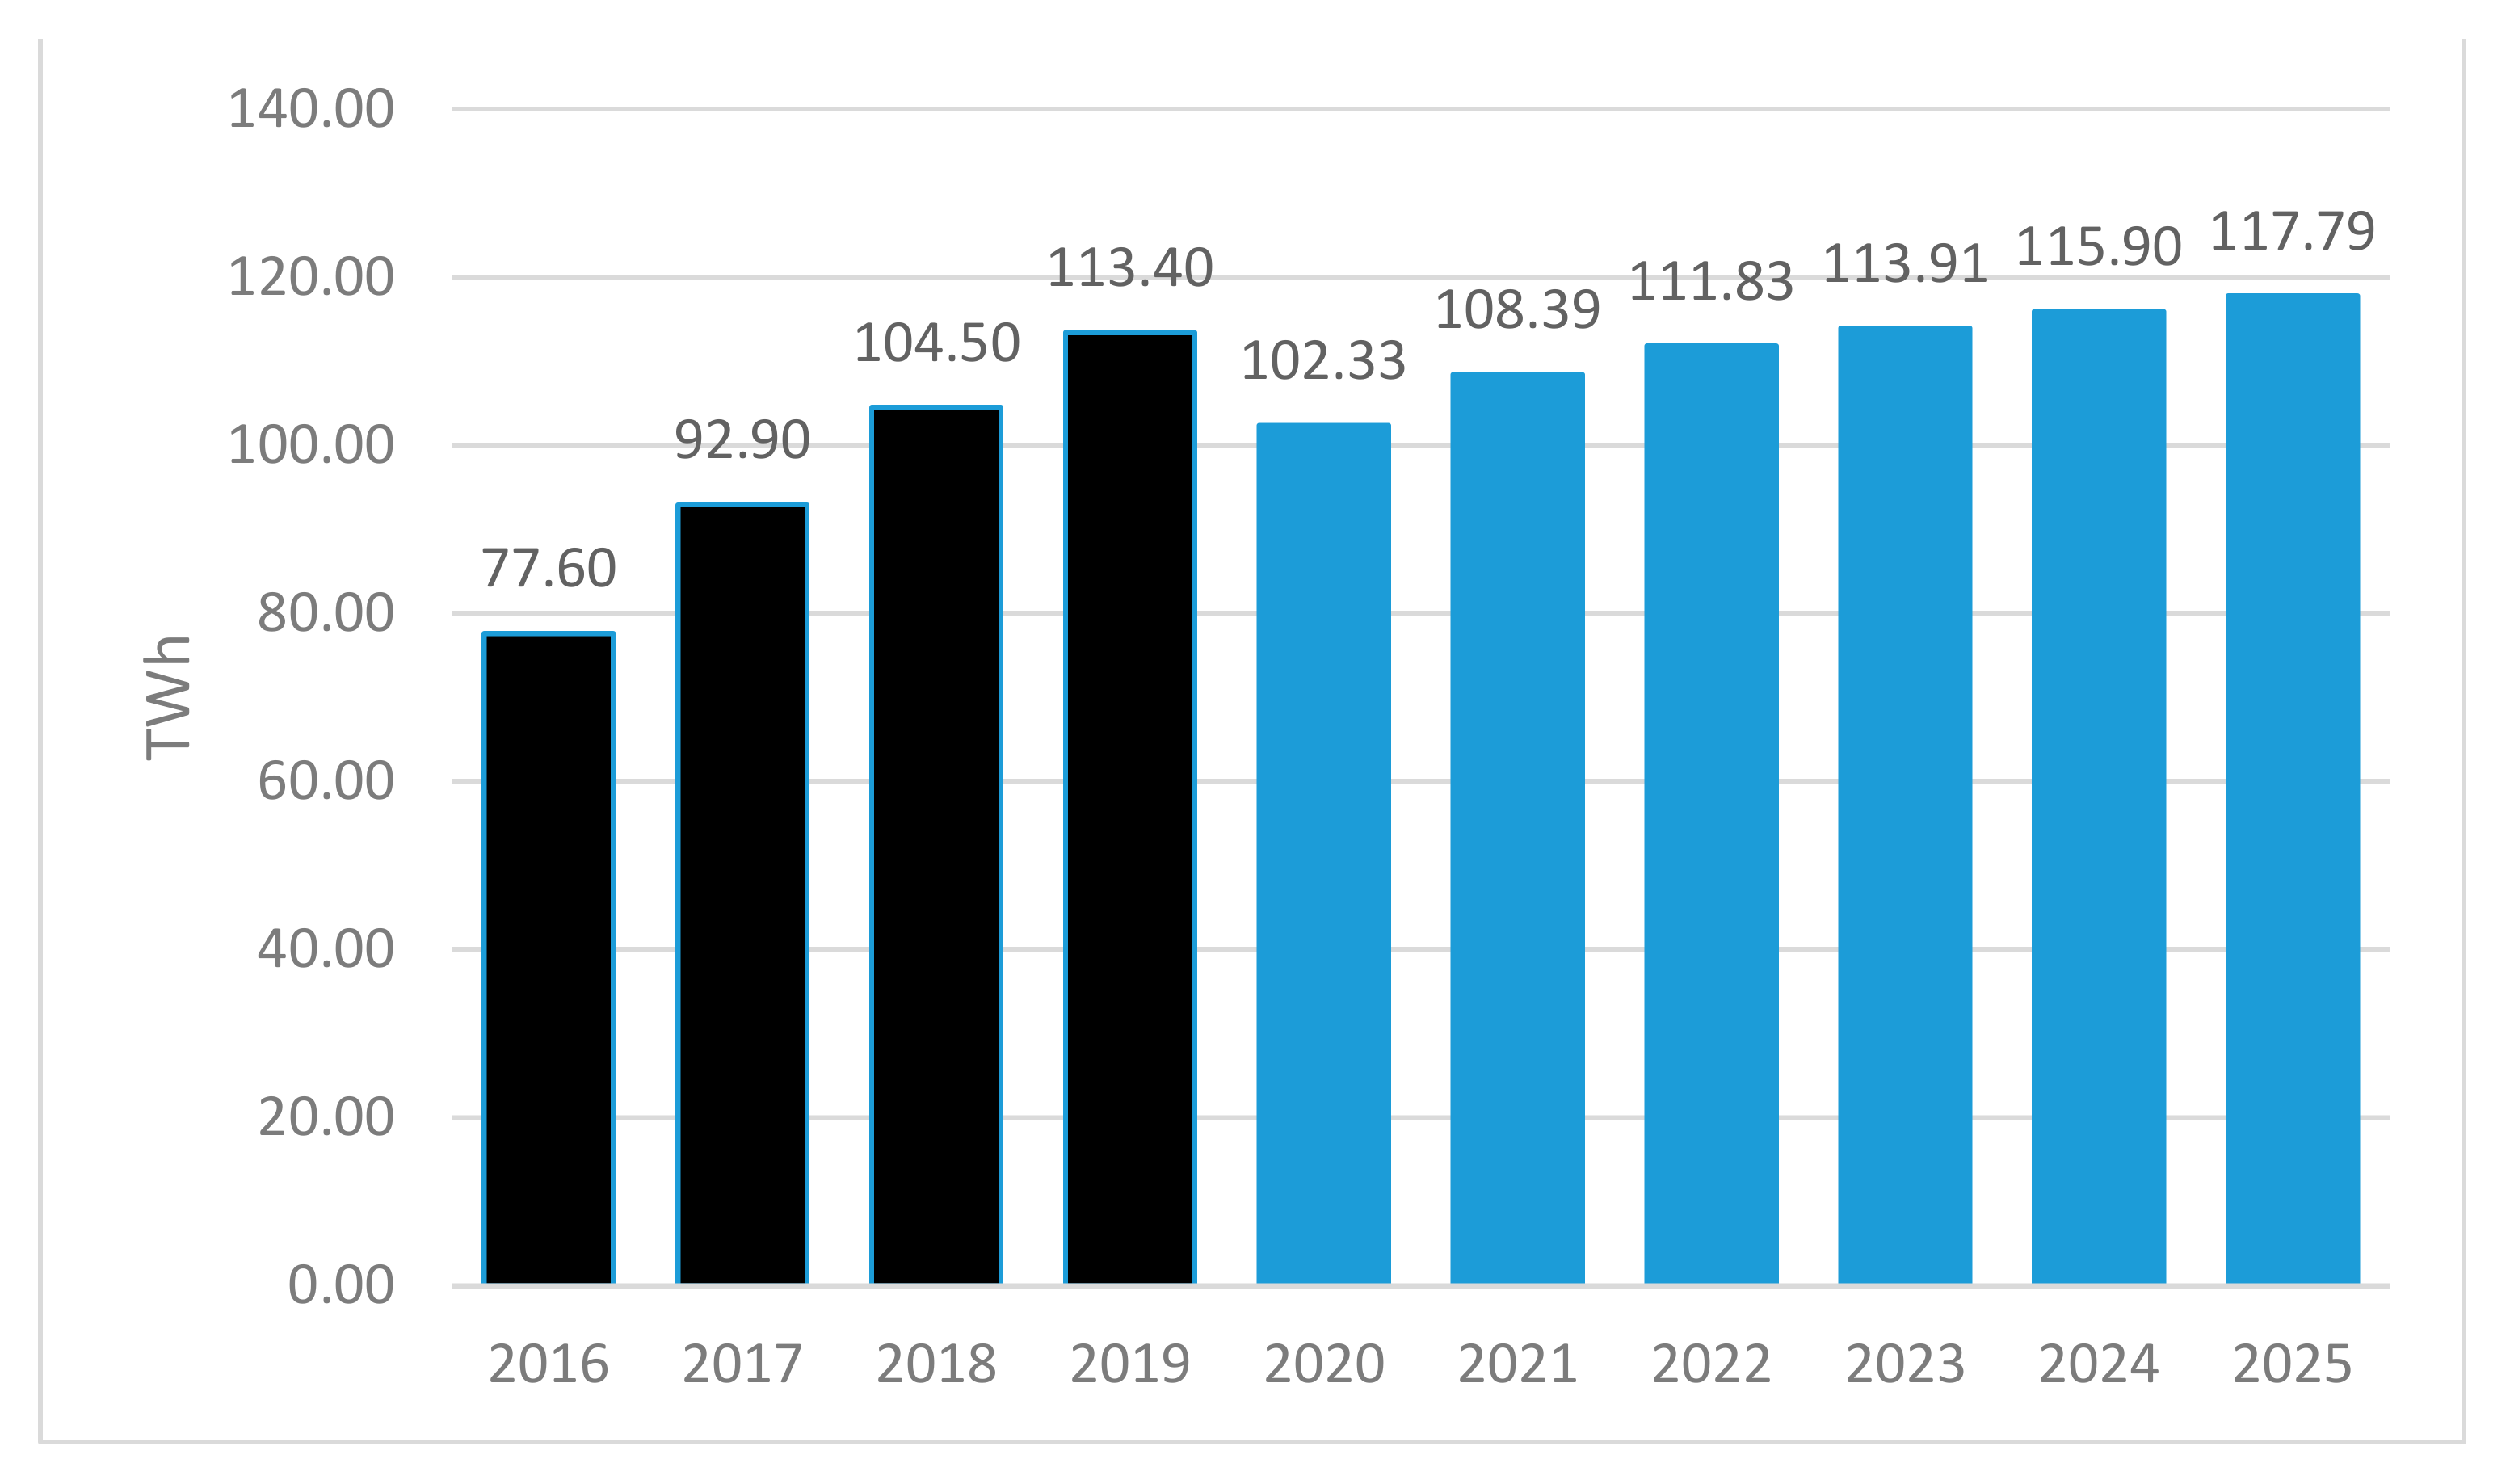
| United Kingdom. % | - | - | - | 1.92 | 1.89 | 1.34 | 1.46 | −9.76 | 5.92 | 3.17 | 1.86 | 1.75 | 1.63 |
| United Kingdom. TWh | 18.21 | 16.35 | 0.15 | 77.60 | 92.90 | 104.50 | 113.40 | 102.33 | 108.39 | 111.83 | 113.91 | 115.90 | 117.79 |
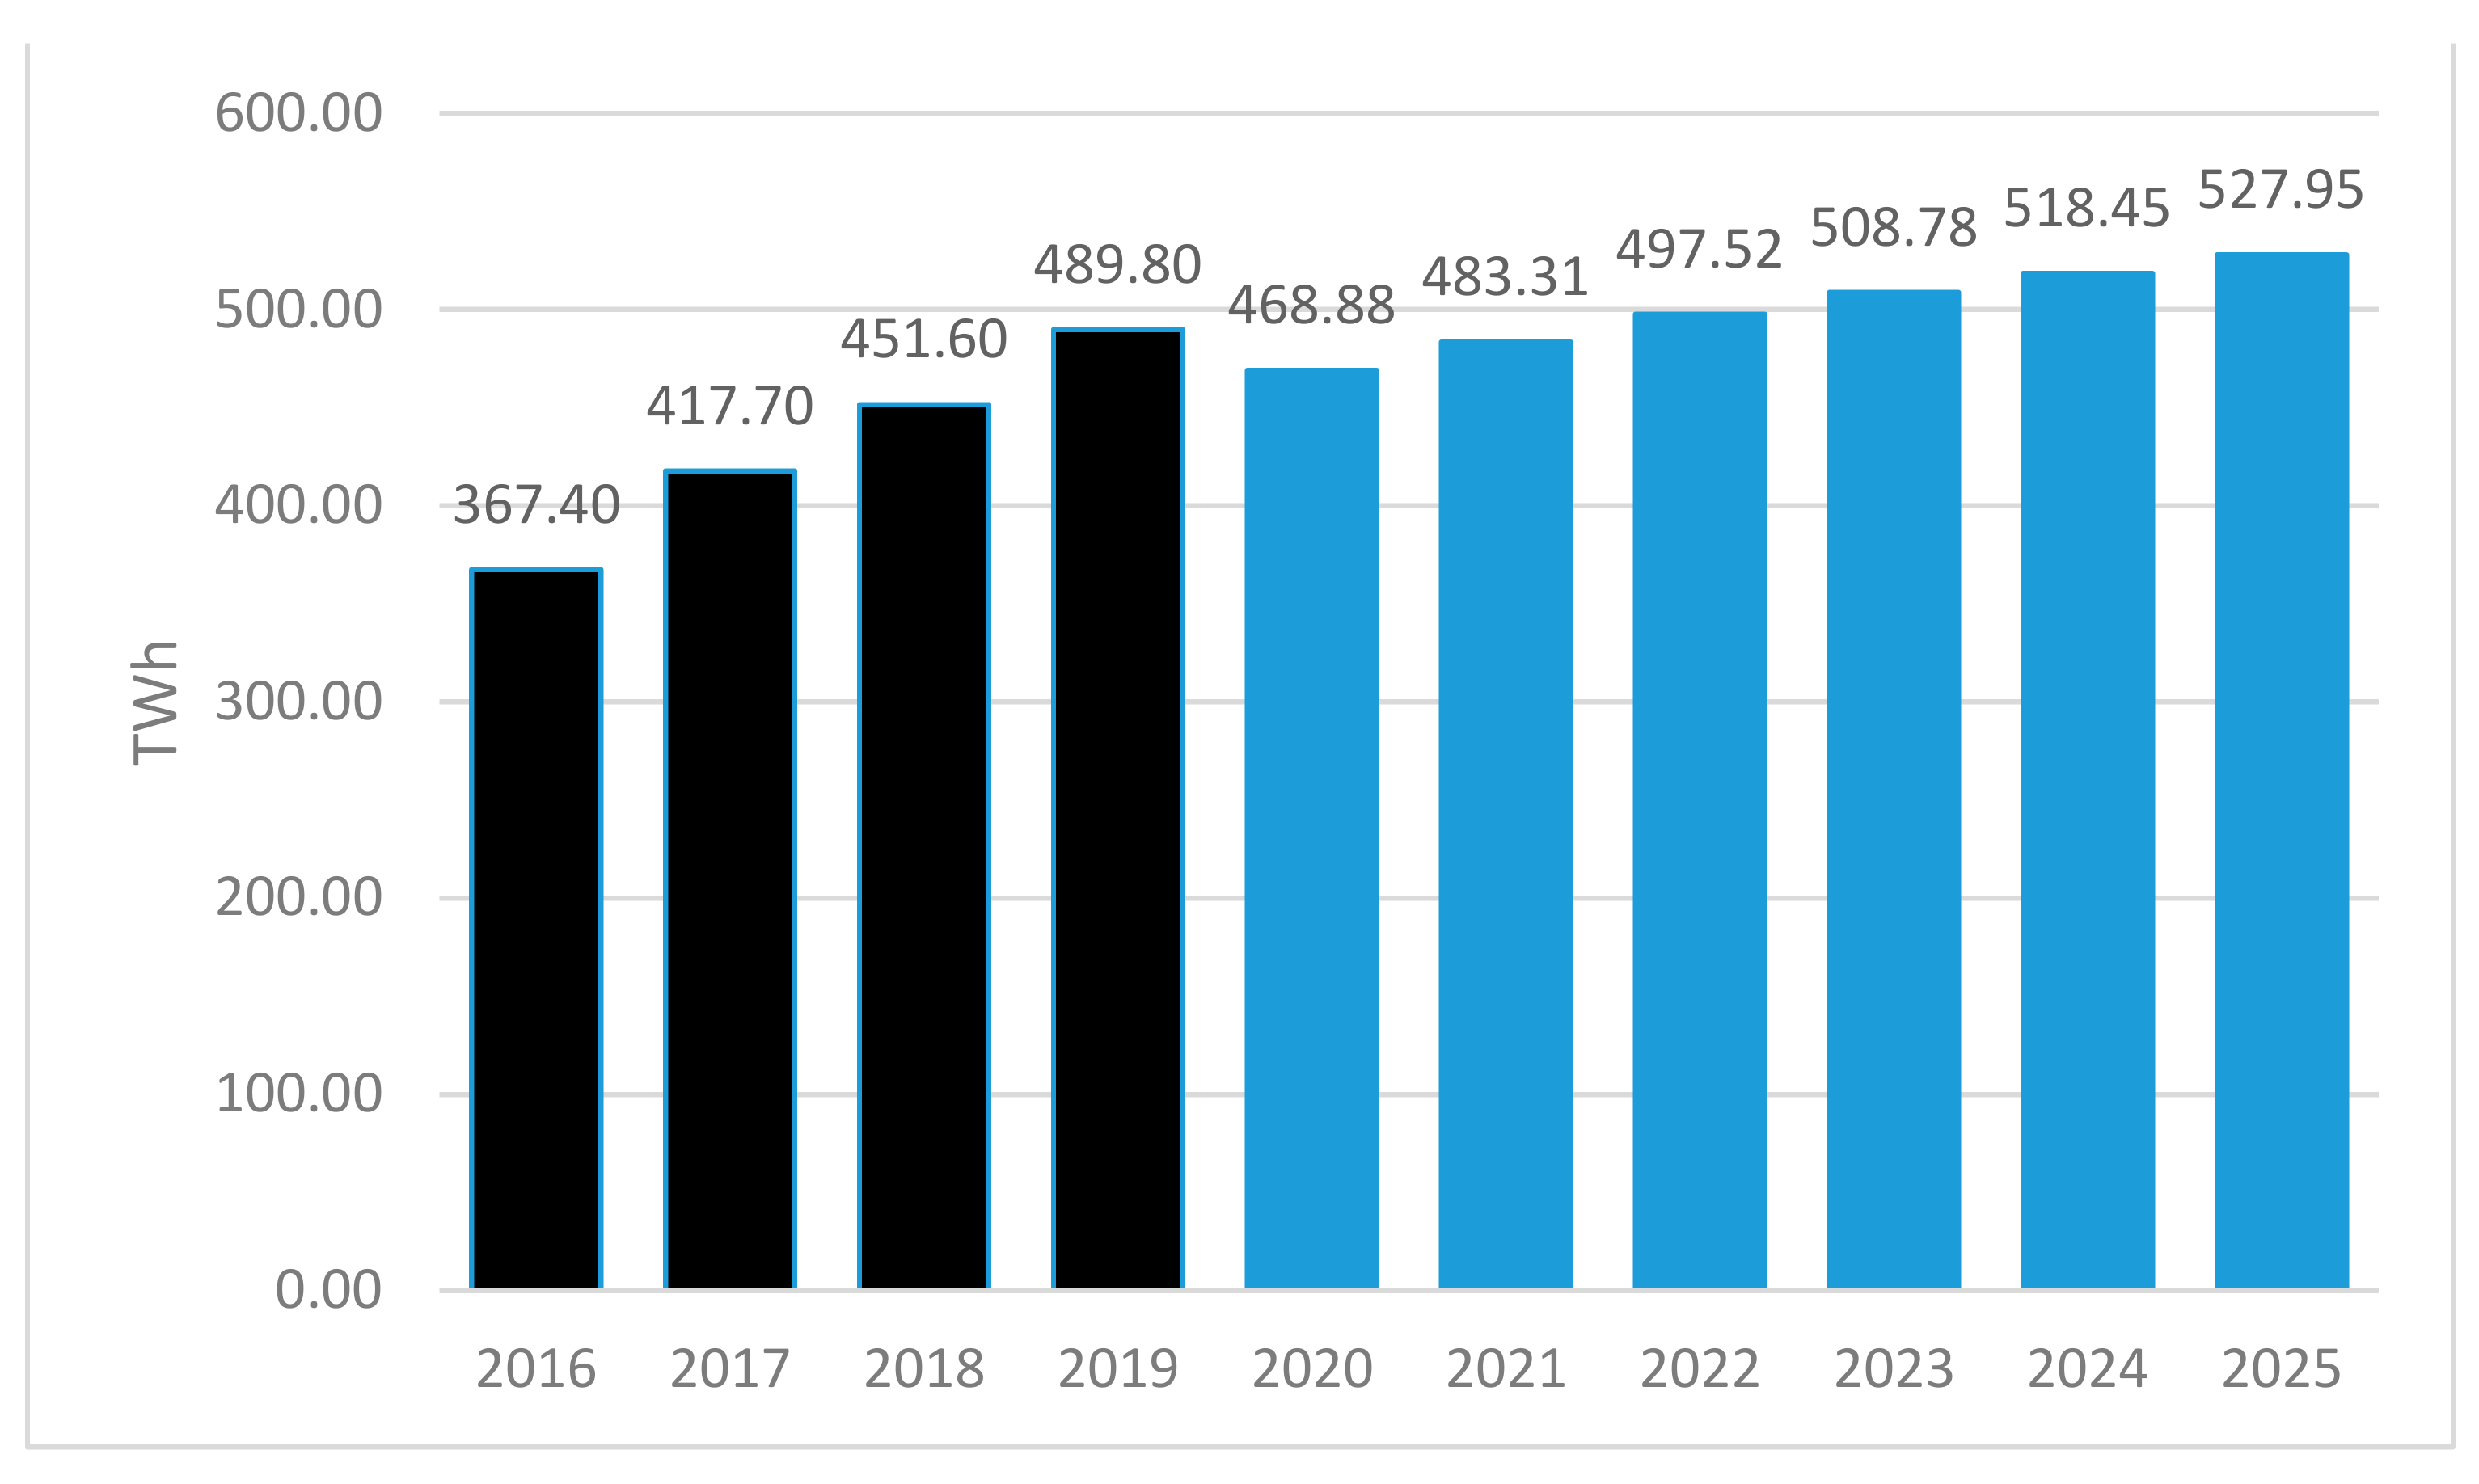
| United States. % | - | - | - | 1.71 | 2.33 | 3.00 | 2.16 | −4.27 | 3.08 | 2.94 | 2.26 | 1.90 | 1.83 |
| United States. TWh | 12.322 | 10.745 | 0.215 | 367.40 | 417.70 | 451.60 | 489.80 | 468.88 | 483.31 | 497.52 | 508.78 | 518.45 | 527.95 |
References
- Mylenka, T. Impact of COVID-19 on the Global Energy Sector. Available online: https://www.pv-magazine.com/2020/04/24/impact-of-COVID-19-on-the-global-energy-sector/ (accessed on 24 April 2020).
- Newman, P. The rise and rise of renewable cities. Renew. Energy Environ. Sustain. 2017, 2, 10. [Google Scholar] [CrossRef] [Green Version]
- Nyangarika, A.; Mikhaylov, A.; Richter, U. Influence Oil Price towards Economic Indicators in Russia. Int. J. Energy Econ. Policy 2019, 9, 123–130. [Google Scholar] [CrossRef]
- Nyangarika, A.; Mikhaylov, A.; Richter, U. Oil Price Factors: Forecasting on the Base of Modified Auto-regressive Integrated Moving Average Model. Int. J. Energy Econ. Policy 2019, 9, 149–160. [Google Scholar]
- Nyangarika, A.; Mikhaylov, A.; Tang, B.-J. Correlation of Oil Prices and Gross Domestic Product in Oil Producing Countries. Int. J. Energy Econ. Policy 2019, 8, 42–48. [Google Scholar]
- Ozili, P.K. Impact of digital finance on financial inclusion and stability. Borsa Istanb. Rev. 2018, 18, 329–340. [Google Scholar] [CrossRef]
- Ozimek, A.; The Future of RemoteWork. SSRN Electron. J. 2020. Available online: https://papers.ssrn.com/sol3/papers.cfm?abstract_id=3638597 (accessed on 12 February 2021).
- Park, E.; Ohm, J.Y. Factors influencing the public intention to use renewable energy technologies in South Korea: Effects of the Fukushima nuclear accident. Energy Policy 2014, 65, 198–211. [Google Scholar] [CrossRef]
- Rana, A.; Perera, P.; Ruparathna, R.; Karunathilake, H.; Hewage, K.; Alam, M.S.; Sadiq, R. Occupant-based energy upgrades selection for Canadian residential buildings based on field energy data and calibrated simulations. J. Clean. Prod. 2020, 271, 122430. [Google Scholar] [CrossRef]
- Raza, N.; Akbar, M.Q.; Soofi, A.A.; Akbar, S. Study of Smart Grid Communication Network Architectures and Technologies. J. Comput. Commun. 2019, 7, 19–29. [Google Scholar] [CrossRef] [Green Version]
- Renewable Energy News & Research Renewables Now. Available online: https://renewablesnow.com/ (accessed on 10 April 2020).
- Renewables Achieve Clean Energy Record as COVID-19 Hits Demand–Renewable Energy World. Available online: https://www.renewableenergyworld.com/2020/04/06/renewablesachieve-clean-energy-record-as-covid-19-hits-demand/ (accessed on 11 April 2020).
- Santiago, I.; Moreno-Munoz, A.; Quintero-Jiménez, P.; Garcia-Torres, F.; Gonzalez-Redondo, M. Electricity demand during pandemic times: The case of the COVID-19 in Spain. Energy Policy 2021, 148, 111964. [Google Scholar] [CrossRef]
- Schmidt, T.S.; Steffen, B.; Egli, F.; Pahle, M.; Tietjen, O.; Edenhofer, O. Adverse effects of rising interest rates on sustainable energy transitions. Nat. Sustain. 2019, 2, 879–885. [Google Scholar] [CrossRef]
- Singhal, D.; Swarup, K. Electricity price forecasting using artificial neural networks. Int. J. Electr. Power Energy Syst. 2011, 33, 550–555. [Google Scholar] [CrossRef]
- Steffen, B.; Egli, F.; Pahle, M.; Schmidt, T.S. Navigating the Clean Energy Transition in the COVID-19 Crisis. Joule 2020, 4, 1137–1141. [Google Scholar] [CrossRef] [PubMed]
- Tsao, Y.-C.; Thanh, V.-V. A multi-objective fuzzy robust optimization approach for designing sustainable and reliable power systems under uncertainty. Appl. Soft Comput. 2020, 92, 106317. [Google Scholar] [CrossRef]
- Wanas, N.; El-Saban, M.; Ashour, H.; Ammar, W. Automatic scoring of online discussion posts. In Proceedings of the 2nd ACM workshop on Video Summarization—TVS ’08; ACM: New York, NY, USA, 2008; pp. 19–26. [Google Scholar]
- Wang, B.; Liu, Y.; Qian, J.; Parker, S.K. Achieving Effective Remote Working during the COVID-19 Pandemic: AWor Design Perspective. Appl. Psychol. 2021, 70, 16–59. [Google Scholar] [CrossRef]
- Why the Future ofWork Might Be ‘Hybrid’. Available online: https://www.bbc.com/worklife/article/20200824-why-the-futureof-work-might-be-hybrid (accessed on 15 November 2020).
- World Health Organization: Pandemic preparedness. Available online: http://www.who.int/csr/disease/influenza/pandemic/en/ (accessed on 15 April 2021).
- Yusup, Y.; Ramli, N.; Kayode, J.; Yin, C.; Hisham, S.; Isa, H.M.; Ahmad, M. Atmospheric Carbon Dioxide and Electricity Production Due to Lockdown. Sustainability 2020, 12, 9397. [Google Scholar] [CrossRef]
- Alizamir, S.; De Véricourt, F.; Sun, P. Efficient Feed-In-Tariff Policies for Renewable Energy Technologies. Oper. Res. 2016, 64, 52–66. [Google Scholar] [CrossRef] [Green Version]
- Arias-Gaviria, J.; Carvajal-Quintero, S.X.; Arango-Aramburo, S. Understanding dynamics and policy for renewable energy diffusion in Colombia. Renew. Energy 2019, 139, 1111–1119. [Google Scholar] [CrossRef]
- Bahar, H.; The Coronavirus Pandemic Could Derail Renewable Energy’s Progress. Governments Can Help. Available online: https://www.iea.org/commentaries/the-coronavirus-pandemic-could-derail-renewable-energy-s-progress-governments-can-help (accessed on 4 April 2020).
- Battke, B.; Schmidt, T.S. Cost-efficient demand-pull policies for multi-purpose technologies–the case of stationary electricity storage. Appl. Energy 2015, 155, 334–348. [Google Scholar] [CrossRef]
- Bhuiyan, T.H.; Medal, H.R.; Harun, S. A stochastic programming model with endogenous and exogenous uncertainty for reliable network design under ran- dom disruption. Eur. J. Oper. Res. 2020, 285, 670–694. [Google Scholar] [CrossRef]
- Big Oil’s Interest in Renewable Energy Investments Expected to Waver, Report Says-The Globe and Mail. Available online: https://www.theglobeandmail.com/business/article-big-oilsinterest-in-renewable-energy-investments-expected-to-waver/ (accessed on 10 April 2020).
- Statistical Review of World Energy 2020. Available online: https://www.bp.com/content/dam/bp/business-sites/en/global/corporate/pdfs/energy-economics/statistical-review/bp-stats-review-2020-full-report.pdf (accessed on 15 April 2021).
- Duan, H.; Zhang, G.; Wang, S.; Fan, Y. Integrated benefit-cost analysis of China’s optimal adaptation and targeted mitiga-tion. Ecol. Econ. 2019, 160, 76–86. [Google Scholar] [CrossRef]
- European Commission Clean Energy for All Europeans. Available online: https://ec.europa.eu/energy/en/topics/energystrategy-and-energy-union/clean-energy-all-europeans (accessed on 1 July 2018).
- European Commission. A Framework Strategy for a Resilient Energy Union with a Forward-Looking Climate Change Policy; 25.2.2015 COM(2015) 80 Final; European Commission: Brussels, Belgium, 2015. [Google Scholar]
- Fact Sheet—Jobs in Renewable Energy, Energy Efficiency, and Resilience (2019) |White Papers | EESI. Available online: https://www.eesi.org/papers/view/fact-sheet-jobs-inrenewable-energy-energy-efficiency-and-resilience-2019 (accessed on 10 April 2020).
- Fernández-Agüera, J.; Domínguez-Amarillo, S.; Sendra, J.J.; Suárez, R. An approach to modelling envelope airtightness in multi-family social housing in Mediterranean Europe based on the situation in Spain. Energy Build. 2016, 128, 236–253. [Google Scholar] [CrossRef]
- Gangolells, M.; Casals, M.; Forcada, N.; Macarulla, M.; Cuerva, E. Energy mapping of existing building stock in Spain. J. Clean. Prod. 2016, 112, 3895–3904. [Google Scholar] [CrossRef]
- Gareta, R.; Romeo, L.M.; Gil, A. Forecasting of electricity prices with neural networks. Energy Convers. Manag. 2006, 47, 1770–1778. [Google Scholar] [CrossRef]
- Gholizadeh, H.; Fazlollahtabar, H.; Khalilzadeh, M. A robust fuzzy stochastic programming for sustainable procurement and logistics under hybrid uncertainty using big data. J. Clean. Prod. 2020, 258, 120640. [Google Scholar] [CrossRef]
- Gilani, M.A.; Kazemi, A.; Ghasemi, M. Distribution system resilience enhance- ment by microgrid formation considering distributed energy resources. Energy 2020, 191, 116442. [Google Scholar] [CrossRef]
- Gobierno, P. Del Normativa Básica de Edificación. Condiciones Térmicas de los Edificios. NBE-CT-79 1979. Available online: https://www.boe.es/buscar/doc.php?id=BOE-A-1979-24866 (accessed on 30 November 2020).
- Golušin, M.; Dodi´c, S.; Popov, S. Chapter 2-Energy and Sustainable Development. In Sustainable Energy Management; Golušin, M., Dodi’c, S., Popov, S., Eds.; Academic Press Inc.: Cambridge, MA, USA, 2013; pp. 7–57. ISBN 9780124159785. [Google Scholar]
- Goodarzian, F.; Hosseini-Nasab, H.; Muñuzuri, J.; Fakhrzad, M.-B. A multi-ob- jective pharmaceutical supply chain net-work based on a robust fuzzy model: A comparison of meta-heuristics. Appl. Soft Comput. 2020, 92, 106331. [Google Scholar] [CrossRef]
- Guillén-Lambea, S.; Rodríguez-Soria, B.; Marín, J.M. Air infiltrations and energy demand for residential low energy buildings in warm climates. Renew. Sustain. Energy Rev. 2019, 116, 109469. [Google Scholar] [CrossRef]
- Guillén-Lambea, S.; Rodríguez-Soria, B.; Marín, J.M. Comfort settings and energy demand for residential nZEB in warm cli-mates. Appl. Energy 2017, 202, 471–486. [Google Scholar] [CrossRef]
- Guillén-Lambea, S.; Rodríguez-Soria, B.; Marín, J.M. Control strategies for Energy Recovery Ventilators in the South of Eu-rope for residential nZEB—Quantitative analysis of the air conditioning demand. Energy Build. 2017, 146, 271–282. [Google Scholar] [CrossRef] [Green Version]
- Guillén-Lambea, S.; Rodríguez-Soria, B.; Marín, J.M. Review of European ventilation strategies to meet the cooling and heat-ing demands of nearly zero energy buildings (nZEB)/Passivhaus. Comparison with the USA. Renew. Sustain. Energy Rev. 2016, 62, 561–574. [Google Scholar] [CrossRef]
- Hosseini, S.E.; Wahid, M.A. Hydrogen production from renewable and sustainable energy resources: Promising green energy carrier for clean development. Renew. Sustain. Energy Rev. 2016, 57, 850–866. [Google Scholar] [CrossRef]
- Hosseini, S.E. An outlook on the global development of renewable and sustainable energy at the time of COVID-19. Energy Res. Soc. Sci. 2020, 68, 101633. [Google Scholar] [CrossRef] [PubMed]
- Hu, S.; Souza, G.C.; Ferguson, M.E.; Wang, W. Capacity investment in renewable energy technology with supply intermit-tency: Data granularity matters! Manuf. Serv. Oper. Manag. 2015, 17, 480–494. [Google Scholar] [CrossRef]
- Ikram, M.; Zhang, Q.; Sroufe, R.; Shah, S.Z.A. Towards a sustainable environ- ment: The nexus between ISO 14001, re-newable energy consumption, access to electricity, agriculture and CO2 emissions in SAARC countries. Sustain. Prod. Consum. 2020, 22, 218–230. [Google Scholar] [CrossRef]
- Instituto para la Diversificación y Ahorro de la Energía. Manual de Fundamentos Técnicos de Calificación Energética de Edi-ficios Existentes CE3 X; IDAE: Madrid, Spain, 2012. [Google Scholar]
- ISO 7730:2005 Ergonomics of the thermal environment—Analytical determination and interpretation of thermal comfort using calculation of the PMV and PPD indices and local thermal comfort criteria. Management 2005, 3, 605–615.
- Ji, L.; Zhang, B.; Huang, G.; Wang, P. A novel multi-stage fuzzy stochastic pro- gramming for electricity system structure optimization and planning with energy-water nexus- a case study of Tianjin, China. Energy 2020, 190, 116418. [Google Scholar] [CrossRef]
- Kavlak, G.; McNerney, J.; Trancik, J.E. Evaluating the causes of cost reduction in photovoltaic modules. Energy Policy 2018, 123, 700–710. [Google Scholar] [CrossRef] [Green Version]
- Kök, A.G.; Shang, K.; Yücel, Ş. Impact of electricity pricing policies on renewable energy investments and carbon emissions. Manag. Sci. 2016, 64, 131–148. [Google Scholar] [CrossRef] [Green Version]
- Kosai, S.; Cravioto, J. Resilience of standalone hybrid renewable energy systems: The role of storage capacity. Energy 2020, 196, 117133. [Google Scholar] [CrossRef]
- Lam, L.T.; Branstetter, L.; Azevedo, I.M. China’s wind industry: Leading in deployment, lagging in innovation. Energy Policy 2017, 106, 588–599. [Google Scholar] [CrossRef]
- Li, L.; Liu, J.; Zhu, L.; Zhang, X.B. How to design a dynamic feed-in tariffs mechanism for renewables–a real options ap-proach. Int. J. Prod. Res. 2019, 9, 1–15. [Google Scholar]
- Li, T.; Li, A.; Guo, X. The sustainable development-oriented development and utilization of renewable energy industry—A comprehensive analysis of MCDM methods. Energy 2020, 212, 118694. [Google Scholar] [CrossRef]
- Liu, J.; Wang, R.; Sun, Y.; Lin, Y.; Xiao, L. A barrier analysis for the development of distributed energy in China: A case study in Fujian province. Energy Policy 2013, 60, 262–271. [Google Scholar] [CrossRef]
- López-Mesa, B.; Monzón-Chavarrías, M.; Espinosa-Fernández, A. Energy Retrofit of Social Housing with Cultural Value in Spain: Analysis of Strategies Conserving the Original Image vs. Coordinating Its Modification. Sustainability 2020, 12, 5579. [Google Scholar] [CrossRef]
- Magazzino, C.; Mele, M.; Schneider, N. A D2C Algorithm on the Natural Gas Consumption and Economic Growth: Chal-lenges faced by Germany and Japan. Energy 2021, 219, 119586. [Google Scholar] [CrossRef]
- Magazzino, C.; Mele, M.; Schneider, N. The relationship between air pollution and COVID-19-related deaths: An application to three French cities. Appl. Energy 2020, 279, 115835. [Google Scholar] [CrossRef]
- Magazzino, C.; Mele, M.; Schneider, N.; Sarkodie, S.A. Waste generation, Wealth and GHG emissions from the waste sector: Is Denmark on the path towards Circular Economy? Sci. Total Environ. 2021, 755, 142510. [Google Scholar] [CrossRef]
- Majumdar, A.; Shaw, M.; Sinha, S.K. COVID-19 debunks the myth of socially sustainable supply chain: A case of the clothing industry in South Asian countries. Sustain. Prod. Consum. 2020, 24, 150–155. [Google Scholar] [CrossRef]
- Mastrucci, A.; Marvuglia, A.; Benetto, E.; Leopold, U. A spatio-temporal life cycle assessment framework for building reno-vation scenarios at the urban scale. Renew. Sustain. Energy Rev. 2020, 126, e109834. [Google Scholar] [CrossRef] [Green Version]
- Mele, M.; Magazzino, C. Pollution, economic growth, and COVID-19 deaths in India: A machine learning evidence. Environ. Sci. Pollut. Res. 2021, 28, 2669–2677. [Google Scholar] [CrossRef]
- Ministerio de Fomento. Documento Básico HE Ahorro de Energía 2019. Código Técnico Edificación. 2019; pp. 1–129. Available online: https://www.codigotecnico.org/DocumentosCTE/AhorroEnergia.html (accessed on 30 November 2020).
- Monzón-Chavarrías, M.; López-Mesa, B.; Resende, J.; Corvacho, H. The nZEB concept and its requirements for residential buildings renovation in Southern Europe: The case of multi-family buildings from 1961 to 1980 in Portugal and Spain. J. Build. Eng. 2021, 34, 101918. [Google Scholar] [CrossRef]
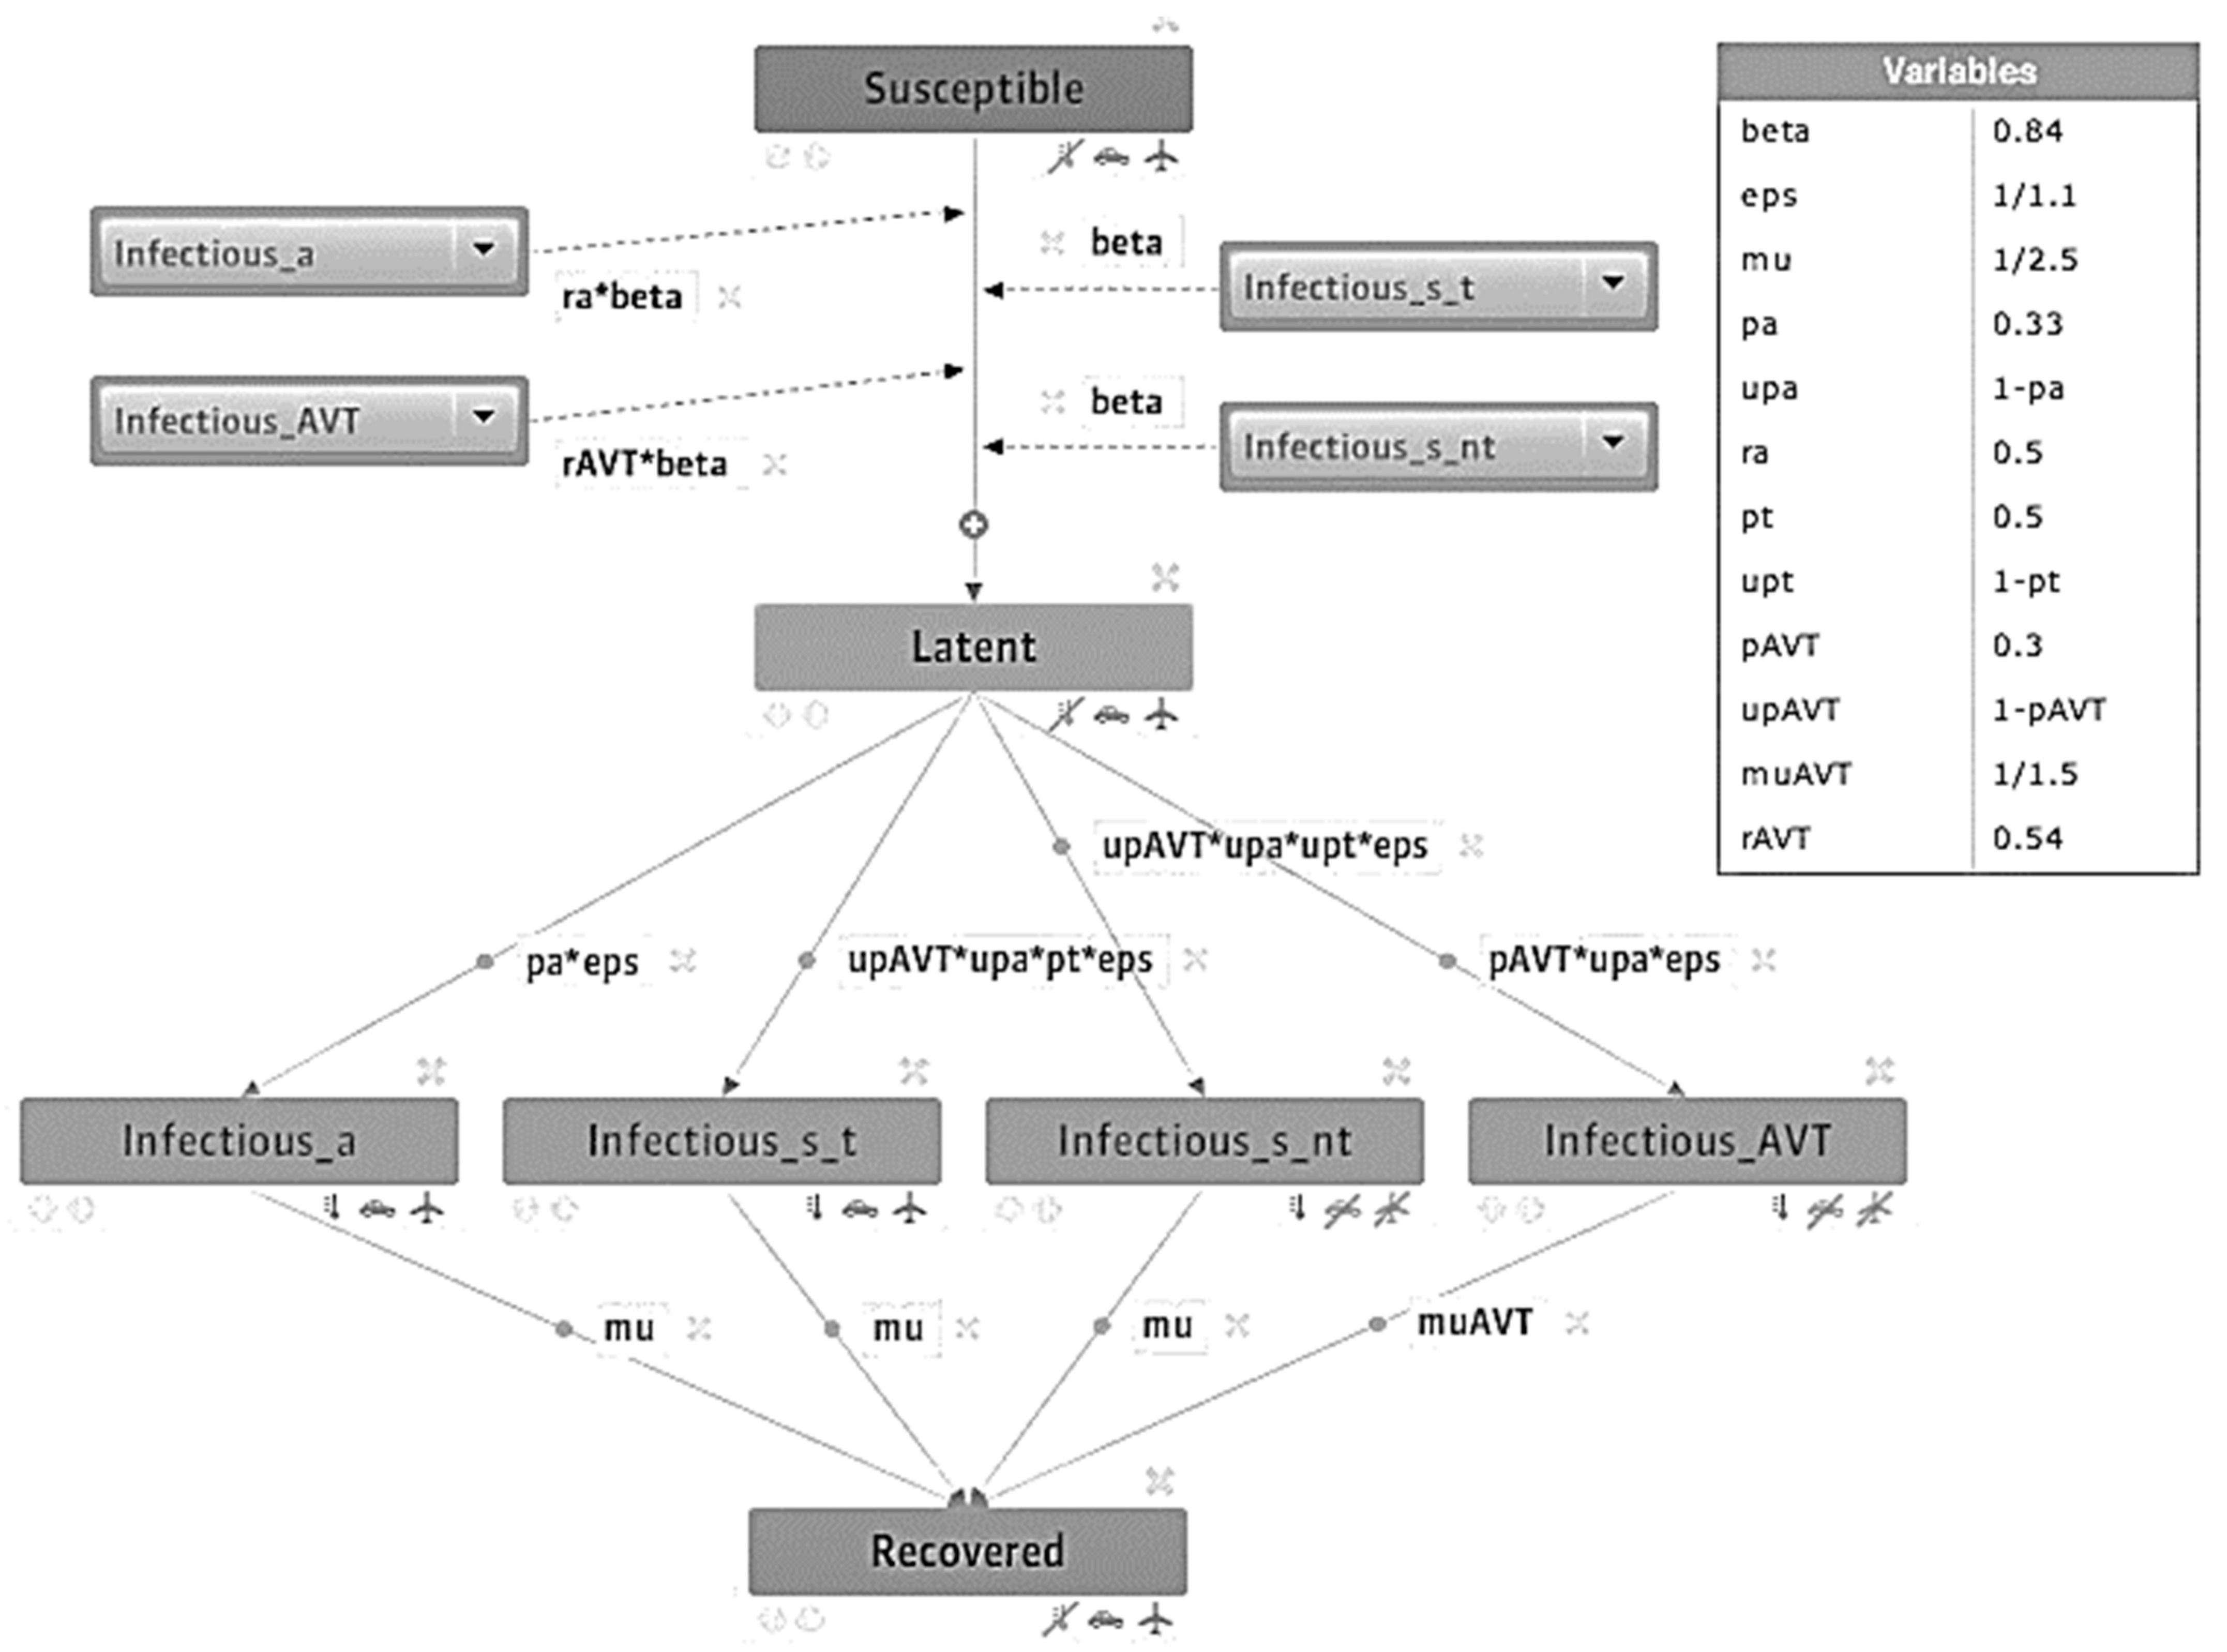

| Main Effects | R | R0 | β | γ | N | C | S | RMSE |
|---|---|---|---|---|---|---|---|---|
| Frame (China) | 0.65 | 1.94 | 0.259 | 0.152 | 1,460,000 | 1,139,010 | 321,266 | 14,660 |
| Frame (USA) | 0.85 | 1.16 | 1.631 | 1.406 | 312,163 | 82,251 | 229,912 | 1532 |
| Frame (Italy) | 0.53 | 2.12 | 0.201 | 0.095 | 275,355 | 228,105 | 47,250 | 9807 |
| Frame (Spain) | 0.43 | 2.17 | 0.317 | 0.146 | 257,397 | 215,621 | 41,776 | 3048 |
| Frame (Germany) | 0.43 | 2.21 | 0.297 | 0.134 | 190,632 | 161,524 | 29,107 | 2021 |
| Frame (UK) | 0.69 | 1.89 | 0.3 | 0.159 | 248,411 | 189,725 | 58,686 | 1588 |
| Frame (Turkey) | 0.69 | 1.77 | 0.344 | 0.194 | 191,967 | 138,767 | 53,200 | 2361 |
| Frame (Iran) | 0.69 | 1.52 | 0.334 | 0.22 | 165,212 | 98,358 | 66,854 | 1456 |
| Frame (Sweden) | 0.94 | 1.72 | 0.204 | 0.119 | 44,534 | 31,210 | 13,325 | 485 |
| Frame (South Korea) | 0.16 | 3.11 | 0.51 | 0.164 | 9253 | 8767 | 487 | 1052 |
| Frame (1 group) | 0.75 | 1.55 | 0.945 | 0.779 | 886,216.5 | 82,251 | 275,589 | 8096 |
| Frame (2 group) | 0.57666666 | 1.94666666 | 0.29883333 | 0.158 | 221,495.6667 | 172,016.666 | 49,478.8333 | 3380.16666 |
| Frame (3 group) | 0.55 | 2.415 | 0.357 | 0.1415 | 26,893.5 | 19,988.5 | 6906 | 768.5 |
| Factor | LSM | VA |
|---|---|---|
| Policy | 33.4 | 9.1 |
| Behavior | 35.5 | 22.1 |
| Information | 26.0 | 15.8 |
| Confusion | 20.9 | 14.0 |
| PRWE Total | 46.9 | 27.1 |
| MHQ-ADL | 57.4 | 34.8 |
Publisher’s Note: MDPI stays neutral with regard to jurisdictional claims in published maps and institutional affiliations. |
© 2021 by the authors. Licensee MDPI, Basel, Switzerland. This article is an open access article distributed under the terms and conditions of the Creative Commons Attribution (CC BY) license (https://creativecommons.org/licenses/by/4.0/).
Share and Cite
Bhuiyan, M.A.; An, J.; Mikhaylov, A.; Moiseev, N.; Danish, M.S.S. Renewable Energy Deployment and COVID-19 Measures for Sustainable Development. Sustainability 2021, 13, 4418. https://doi.org/10.3390/su13084418
Bhuiyan MA, An J, Mikhaylov A, Moiseev N, Danish MSS. Renewable Energy Deployment and COVID-19 Measures for Sustainable Development. Sustainability. 2021; 13(8):4418. https://doi.org/10.3390/su13084418
Chicago/Turabian StyleBhuiyan, Miraj Ahmed, Jaehyung An, Alexey Mikhaylov, Nikita Moiseev, and Mir Sayed Shah Danish. 2021. "Renewable Energy Deployment and COVID-19 Measures for Sustainable Development" Sustainability 13, no. 8: 4418. https://doi.org/10.3390/su13084418