Review

Diverse Roles of Mitochondria in Renal Injury from Environmental Toxicants and Therapeutic Drugs

Department of Pharmacology, Wayne State University School of Medicine, Detroit, MI 48201, USA
Int. J. Mol. Sci. 2021, 22(8), 4172; https://doi.org/10.3390/ijms22084172
Submission received: 27 February 2021 / Revised: 5 April 2021 / Accepted: 14 April 2021 / Published: 17 April 2021
(This article belongs to the Special Issue Nephrotoxicity 2020)

Abstract

:
Mitochondria are well-known to function as the primary sites of ATP synthesis in most mammalian cells, including the renal proximal tubule. Other functions have also been associated with different mitochondrial activities, including the regulation of redox status and the initiation of mitophagy and apoptosis. Mechanisms for the membrane transport of glutathione (GSH) and various GSH-derived metabolites across the mitochondrial inner membrane of renal proximal tubular cells are critical determinants of these functions and may serve as pharmacological targets for potential therapeutic approaches. Specific interactions of reactive intermediates, derived from drug metabolism, with molecular components in mitochondria have been identified as early steps in diverse forms of chemically-induced nephrotoxicity. Applying this key observation, we developed a novel hypothesis regarding the identification of early, sensitive, and specific biomarkers of exposure to nephrotoxicants. The underlying concept is that upon exposure to a diverse array of environmental contaminants, as well as therapeutic drugs whose efficacy is limited by nephrotoxicity, renal mitochondria will release both high- and low-molecular-weight components into the urine or the extracellular medium in an in vitro model. The detection of these components may then serve as indicators of exposure before irreversible renal injury has occurred.

1. Introduction

Mitochondria are important organelles in most mammalian cells. Although their most notable function involves oxidative phosphorylation and generation of ATP for cellular work (e.g., active transport, cellular movement, or contraction) and biosynthetic processes, other types of processes that occur in mitochondria play key roles in other diverse types of functions. Examples include mitochondria serving as sensors for oxidation–reduction or redox status and as sensitive and early sites for responses to chemical toxicants. To illustrate the diverse functions of mitochondria, this review focuses on the renal proximal tubular (PT) cell because this is the main target cell population for many environmental toxicants and nephrotoxic drugs. Renal PT cells are among several cell types that are highly dependent on cellular energy, making mitochondria critical to their function. For the renal PT cell, the high demand for ATP is due to their physiological role in electrolyte and fluid balance. Other aspects of physiological and biochemical function also make renal PT cells a perfect exemplar of a cell type for which mitochondrial function and dysfunction underlie a broad array of processes and activities. The review is subdivided into four sections, each focusing on a distinct role or type of role of mitochondria in the renal PT cell.
The first section can be considered more of a classic view of the role of mitochondria in renal PT cellular function because it summarizes the importance of ATP supply. As an example, the response of renal mitochondria to a marked increase in energy demand that occurs during compensatory renal hypertrophy (CRH) after a reduction of functional renal mass after unilateral nephrectomy (NPX) is discussed.
In the second section, the role of renal mitochondria as redox sensors is discussed. Here, the focus is on the underlying importance of redox processes in renal mitochondria and their susceptibility to derangement such that a state of oxidative stress may occur. Subsequently, the regulation and roles of the glutathione system in renal mitochondria are reviewed. Herein, a dual role for reduced glutathione (GSH), as alternately a protective antioxidant and as an activator of certain classes of chemical toxicants, is summarized and illustrated. Additionally, a brief summary of some of the other key redox sensors in mitochondria is provided.
In the third section, the role of renal mitochondria in the sequelae of events underlying chemically-induced nephrotoxicity is briefly reviewed. Here, mitochondria are viewed as important, sensitive, and early target sites for the molecular events that result in decrements in renal PT cell function.
In the final major section, a novel hypothesis of renal mitochondria as a source of biomarkers for exposure to either environmental toxicants or therapeutic drugs whose clinical utility is limited by nephrotoxicity is presented. This hypothesis builds on a large array of data on renal mitochondria as sensitive and early molecular targets of toxicants, as well as many of the unique biochemical properties of these organelles.

2. Basic Functions of Renal Mitochondria in Supplying ATP for Cellular Work

A basic principle of bioenergetics is that energy production needs to match energy demand. Different tissues and specific cell types within many tissues have distinctive energy demands based on their physiological and biochemical functions. The kidneys, and the PT cells in particular, are notable in that they have an extremely high energy requirement. This energy requirement, in the form of ATP, has long been known to be predominantly due to the active transport of sodium ions and other cations and anions [1,2,3,4,5,6,7,8]. Importantly, mitochondrial respiratory activity in renal PT cells is tightly regulated by energy demand [8,9].
An illustration of this coupling of energy consumption via active transport to energy supply (i.e., ATP generated primarily by mitochondria) in the renal PT cell is shown in Figure 1. An increase in the plasma concentrations of substrates (e.g., organic anions (OAs), organic cations (OCs), D-glucose, and various D-amino acids) for sodium-linked cotransporters on the basolateral plasma membrane (BLM) should result in the utilization of more of the sodium electrochemical gradient for transport. This would, in turn, stimulate activity of the (Na+ + K+)-ATPase on the BLM, which would then increase ATP consumption and correspondingly increase mitochondrial ATP production via oxidative phosphorylation.
A more dramatic illustration of the linkage between energy demand and energy production can be found in the example of compensatory renal hypertrophy (CRH) that results from a reduction of renal mass, such as from unilateral nephrectomy (NPX). A reduction of functional renal mass can occur as a result of renal disease, surgery, or aging. Within a very short period of time after a reduction of the number of functional nephrons, the remnant renal tissue undergoes a large array of biochemical, physiological, and morphological changes to compensate for the loss in function [10,11]. Rather than being an increased synthesis of cells (i.e., hyperplasia), the response is predominantly hypertrophy, in which existing cells (predominantly from the renal PT region) increase in size [10,11]. The NPX rat has been frequently used as a model for reduced functional renal mass. Within several hours of the removal of one kidney, the contralateral or remnant kidney exhibits large increases in sodium ion transport and glomerular filtration [10,11,12]. Consistent with this increased workload per unit mass, it has long been known that mitochondria in the remnant renal tissue proliferate [13]. Biochemically, both the activity and expression of the (Na+ + K+)-stimulated ATPase increase dramatically [14,15]. Moreover, consistent with the concept that mitochondrial respiration increases in response to an increased demand for ATP, renal PT cells in the remnant kidney are described as being in a hypermetabolic state [16,17].
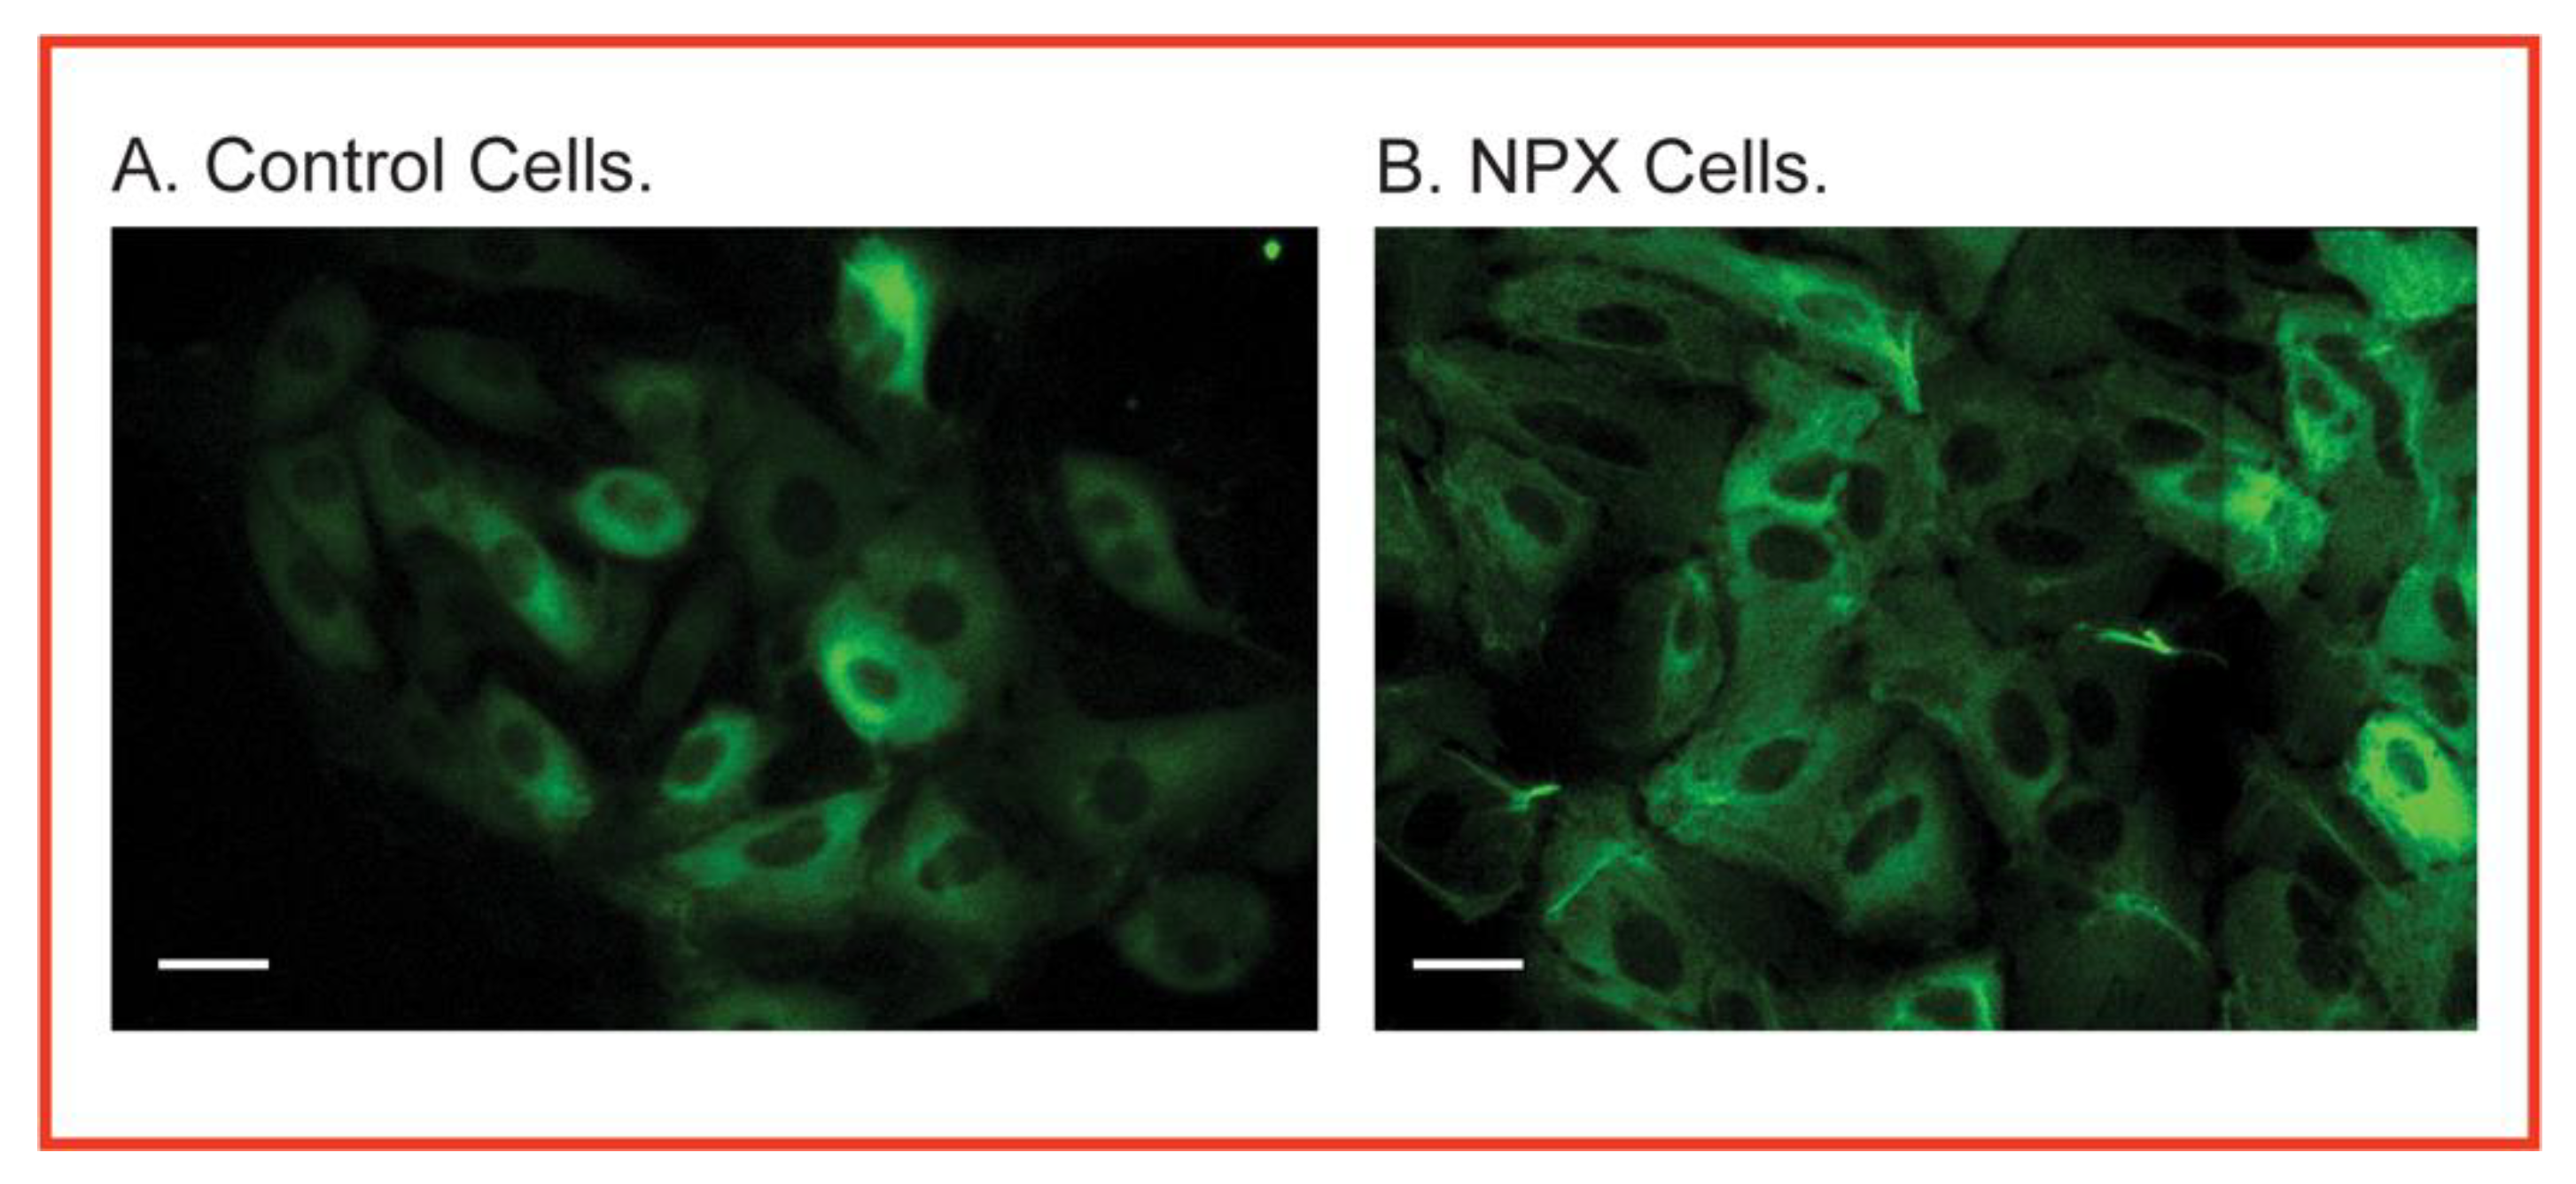
To better understand the biochemical and toxicological implications of CRH, we studied responses of the PT cell from the remnant kidney of NPX rats both in vivo and in vitro in a series of papers, focusing on mitochondrial function and oxidation–reduction (or redox) status [18,19,20,21,22,23,24,25,26,27]. Additionally, we examined the impact of CRH on the susceptibility of PT cells to several nephrotoxicants (e.g., inorganic mercury and tert-butyl hydroperoxide (tBH)), demonstrating that the altered cellular biochemistry and physiology result in increased cytotoxicity. Figure 2 shows the enlarged size and altered morphology of primary cultures of rat PT cells from NPX rats compared to those from normal rats. The figure is meant to provide a qualitative assessment of CRH, in which many, but not all, cells are enlarged. Cytokeratin staining, which is a marker for epithelial cells, was performed to better visualize individual cells.
As shown in Figure 3, the initiating events in the CRH response include an increased glomerular filtration rate (GFR) and an increased fractional sodium excretion (FeNa). These events, in turn, activate the plasma membrane (Na+ + K+)-ATPase. Similar to the relationships illustrated in Figure 1, the activation of the (Na+ + K+)-ATPase increases the mitochondrial respiration rate (QO2) via increased ATP consumption. This increased respiratory rate results in increases in the release of reactive oxygen species (ROS). It is important to mechanistically distinguish between early responses to increases in ROS and those that occur with prolonged or more marked increases in these oxidant-promoting molecules. As described in the next section and conceptualized by Jones and colleagues [28,29,30,31], early increases in ROS are viewed as having a signaling function in regulating the redox circuitry of the mitochondria and other subcellular compartments. Thus, in PT cells from NPX rats, early increases were observed in activities (but not mRNA or protein expression) of the two mitochondrial transporters for GSH, the dicarboxylate and 2-oxoglutarate carriers (DIC and OGC, respectively), and in intramitochondrial concentrations of GSH [26,27]. At later times, however, mitochondrial GSH concentrations in PT cells from NPX rats have been found to decrease compared to those in PT cells from control rats, and an enhanced injury from a variety of toxicants has been observed [22,23,25].
To further understand the molecular changes underlying the CRH response, we conducted a proteomics analysis of renal tissue from control and NPX rats using the iTRAQTM (isobaric tags for relative and absolute quantitation) labeling method for quantitative proteomics with tandem mass spectrometry (Benipal, B.; Stemmer, P.M.S.; Lash, L.H. unpublished data) (Table 1).
The iTRAQTM reagent (from Applied Biosystems; Foster City, CA, USA) labels free amines on peptides with a stable isotope containing an isobaric tag. A portion (100 µg) of each sample was reduced with dithiothreitol, alkylated with iodoacetamide, and digested overnight at 37 °C with trypsin. Each sample was labeled with a unique isobaric iTRAQTM tag (control/buffer = 114; NPX/Buffer = 115). Samples were combined, purified by strong cation exchange chromatography using the SCX Methods Development Kit (Applied Biosystems), dried, resuspended in water (2 cycles), and then dried and resuspended in 2% acetonitrile and 0.1% trifluoroacetic acid. Peptides were separated by reverse phase chromatography (Magic C18 column, Michrom), ionized with the ADVANCE ion source (Michrom), and introduced into an LTQ-XL mass spectrometer (Thermo Fisher Scientific). Abundant species were fragmented in the pulsed-Q dissociation mode (PQD), with 5 short and 2 long LC/MS/MS runs being performed on each sample. Data analyses were performed using the BioWorks (Thermo) and Scaffold software (Proteome Software), which incorporates the SEQUEST, X!Tandem, and ProteinProphet algorithms. A rat protein database (IPI ver. 3.47) was used for analyses. Using a criterion for significance of 1.5-fold, the majority of proteins that were more highly expressed in kidney from NPX rats were found to be of mitochondrial origin (Table 1).

3. Renal Mitochondria as Redox Sensors

3.1. Susceptibility to Oxidative Stress

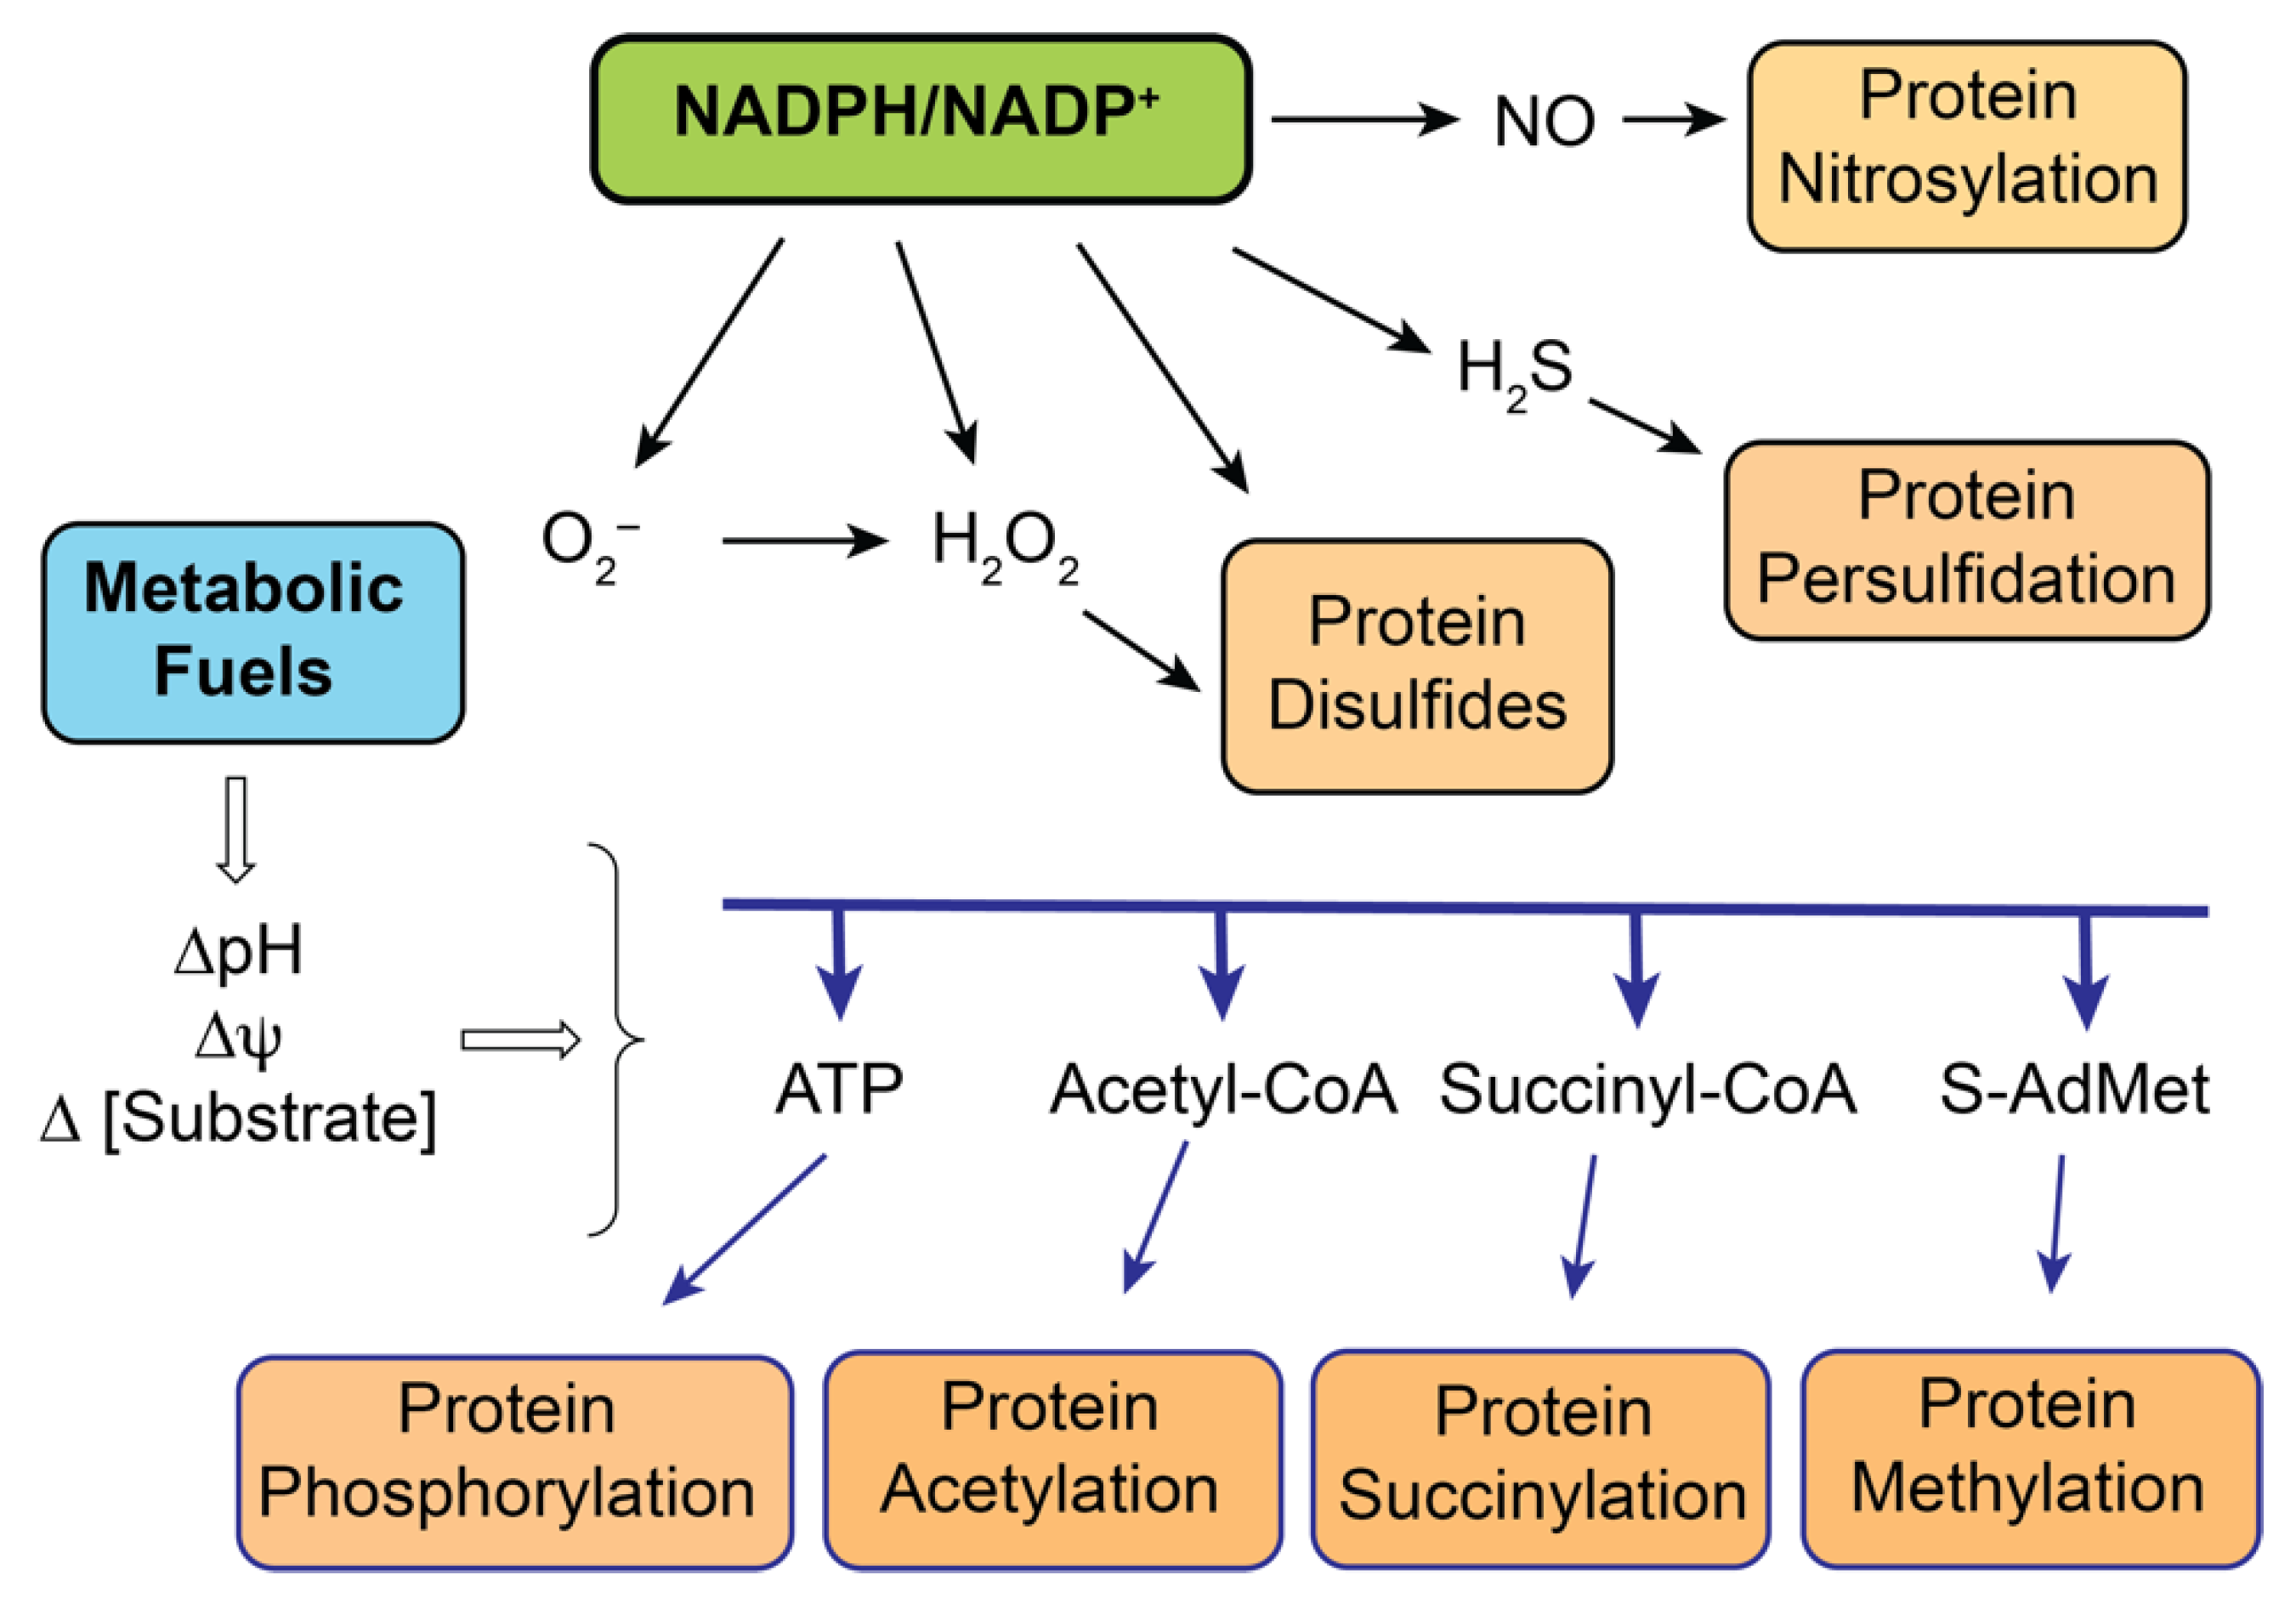
Although we can view mitochondrial function as serving to maintain a balance between ATP demand and ATP supply, there are several factors that are important in the adaptability and plasticity that allow these organelles to respond to changing environmental conditions. While the involved factors or mechanisms, such as electrochemical potential or pH gradients, are considered intrinsic to mitochondrial function, other factors such as redox circuitry are believed to be critical for the ability of mitochondria to respond to physiological, pathological, and toxicological perturbations [28,29,30,31,32,33]. The interplay between bioenergetic processes in mitochondria and the various redox regulatory processes that help regulate metabolism and overall cellular function is illustrated in Figure 4.
Through glycolysis, the citric acid cycle, and the mitochondrial electron transport chain, carbohydrate metabolism generates energy in the form of transmembrane gradients of pH (∆pH), membrane potential (∆ψ), and substrate concentration (∆ (substrate)). These forms of energy can modulate mitochondrial function via one of several types of post-translational modifications. Other forms of post-translational modifications occur through redox regulation linked to the NADPH/NADP+ redox couple. In these manners, changes in levels of ROS or reactive nitrogen species (RNS) may result in different levels of post-translationally modified proteins, thus leading to functional changes. An important implication of these links is that excessive levels of any of the key signaling molecules will result in altered protein function, leading to toxicity. Moreover, one must distinguish between physiological variations in levels of the signaling molecules, such as those that might occur during exercise or short-term starvation, and pathological variations that might occur either during exposure to nephrotoxic chemicals or drugs or during pathological disease states such as ischemia-reperfusion or diabetic kidney disease.

3.2. The Glutathione System as Both Protective Antioxidant and Activator for Nephrotoxicity

3.2.1. Mitochondrial Glutathione as a Protective Antioxidant

The scheme shown in Figure 4 is obviously an oversimplification and is designed to focus on the key mediators and the overall regulatory processes. Multiple intermediates serve to communicate redox status and do so, in large part, by controlling levels of signaling molecules such as O2, H2O2, H2S, and NO. One of the major intermediates is reduced GSH. Though GSH exists in many forms, including as mixed disulfides with proteins and as low-molecular-weight disulfides with L-cysteine or another molecule of GSH, the major form in mitochondria under normal conditions is free GSH. To understand the role of mitochondrial GSH (mtGSH) in redox control and susceptibility to oxidative stress, it is first necessary to delineate how the pool of mtGSH is derived and regulated.
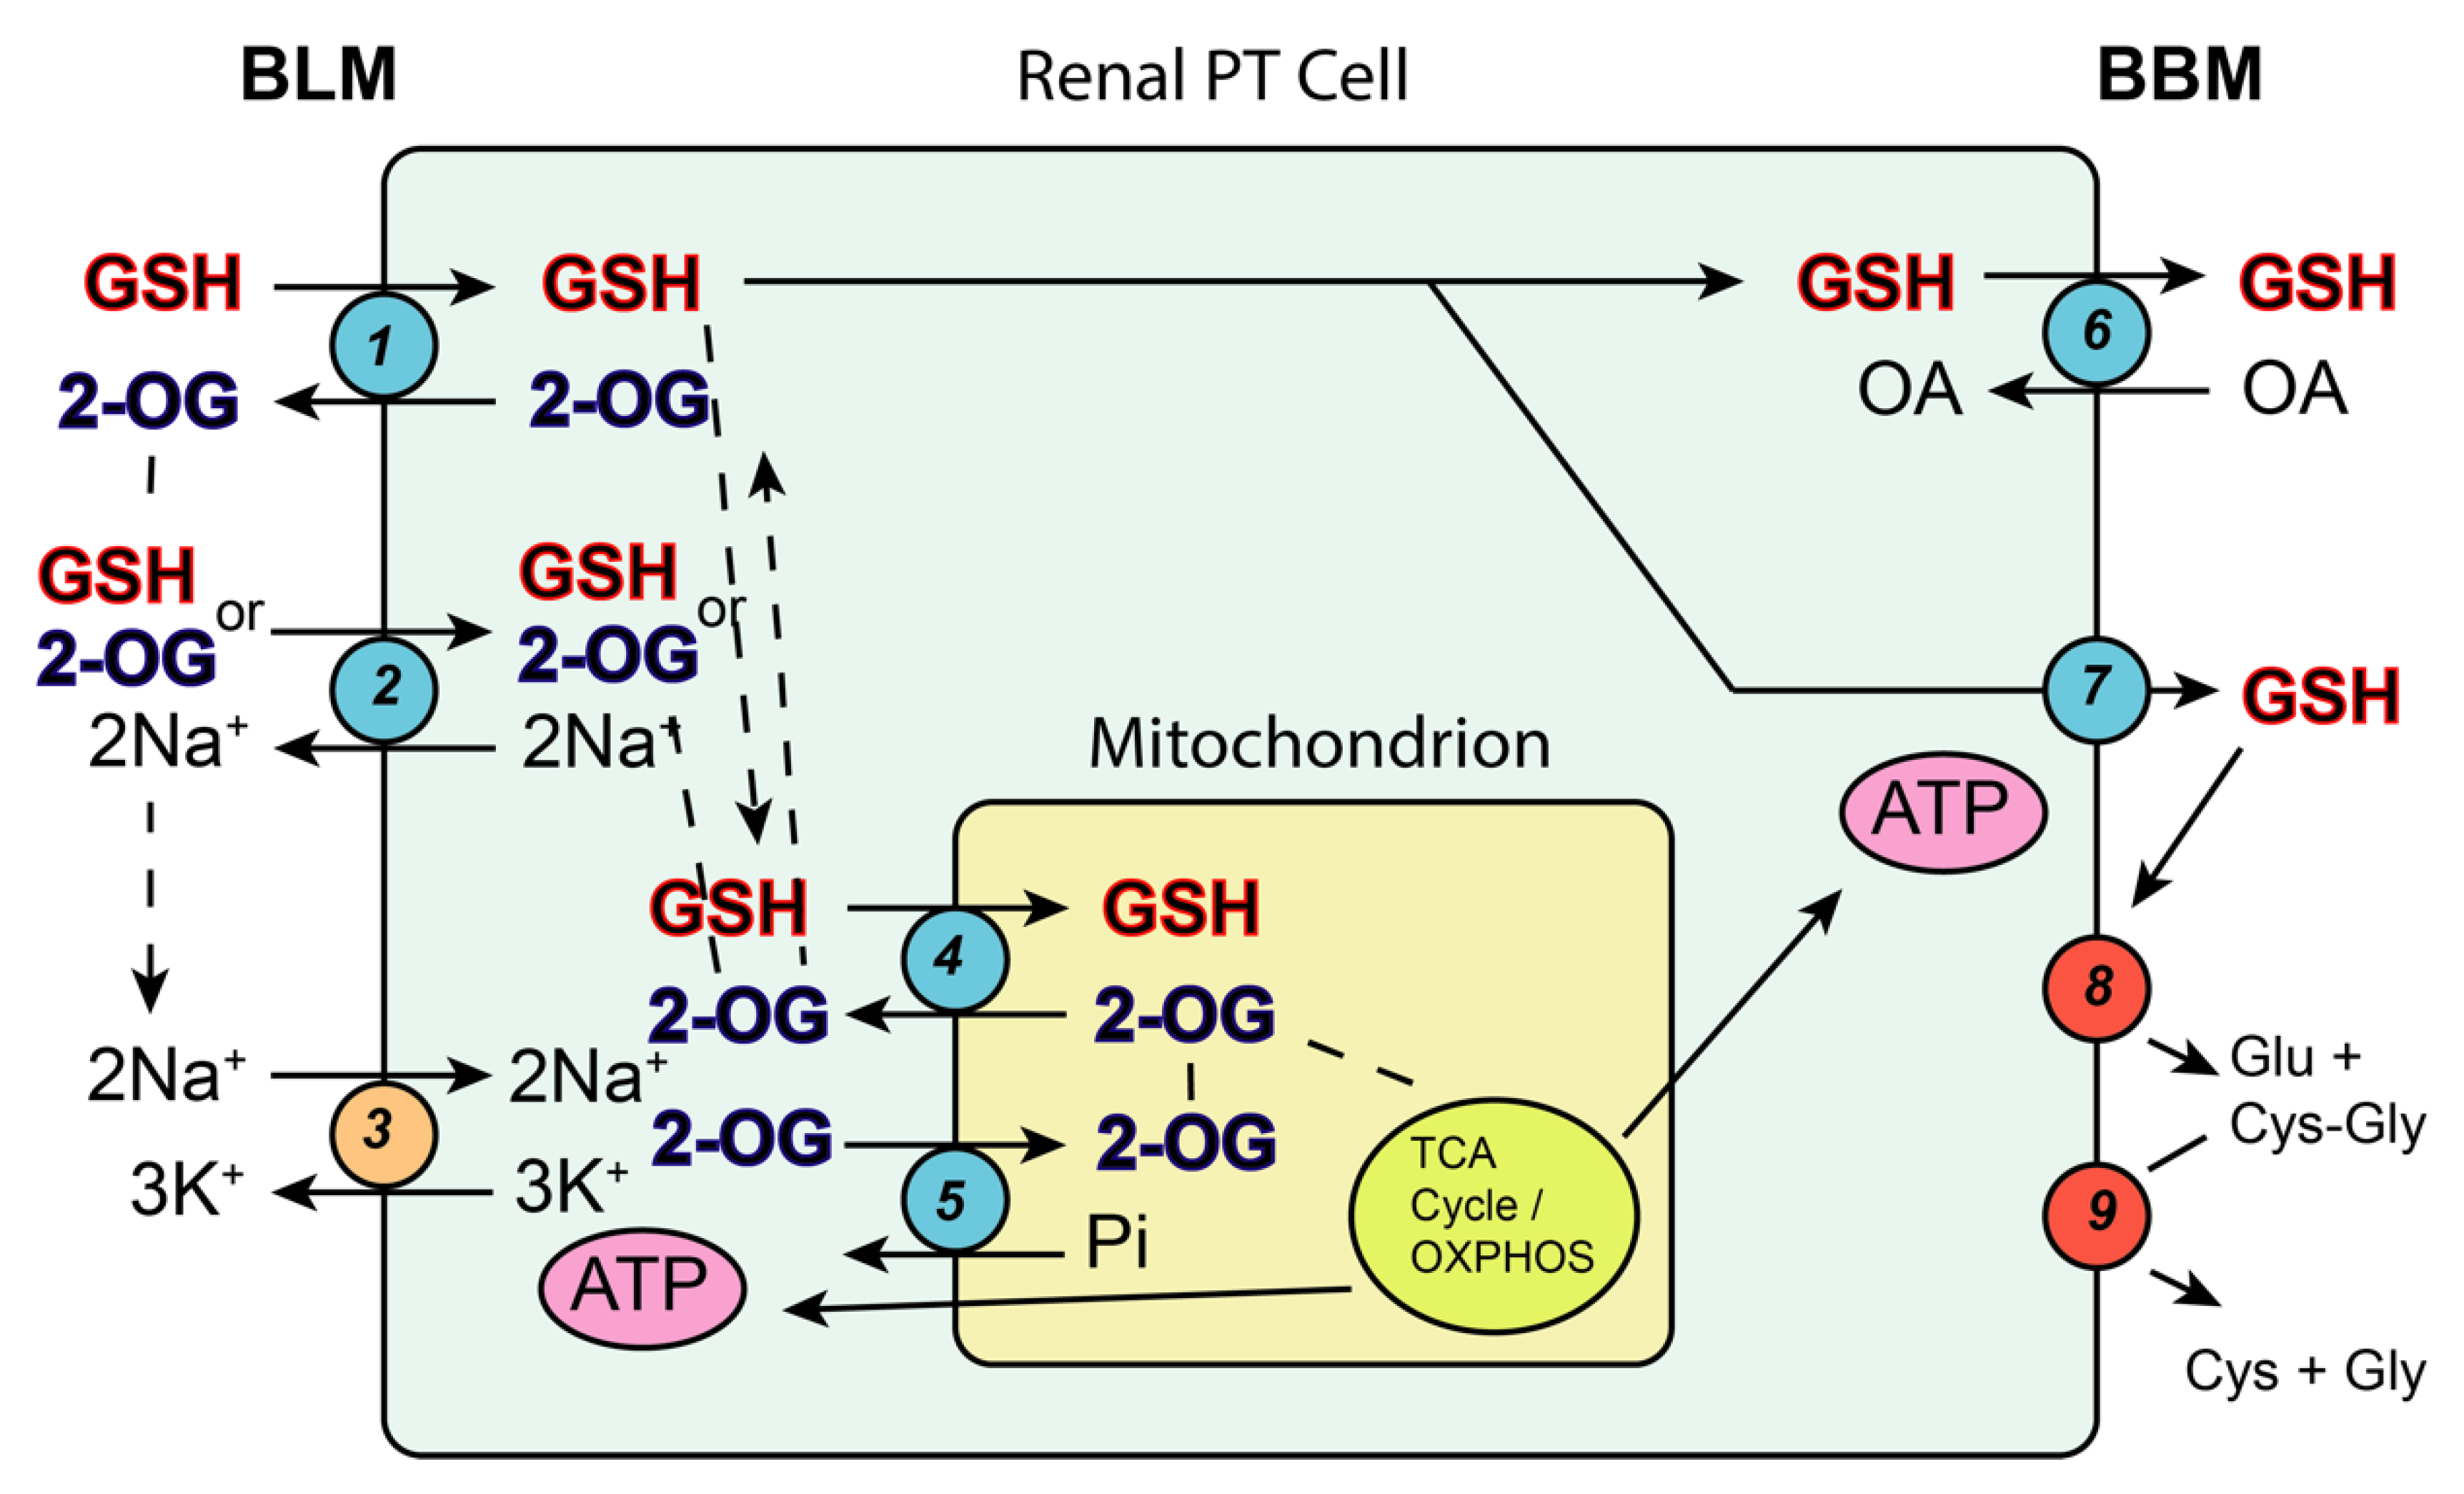
The reader is referred to earlier reviews of renal mtGSH transport for more background and details on the identification of specific carriers involved in the transport process [34,35,36]. The primary rationale for determining the derivation and regulation of mtGSH was based on the realizations that renal GSH synthesis appears to exclusively occur in the cytoplasm [37], that renal mitochondria contain a distinct pool of GSH with concentrations in the millimolar range [38], and that the GSH molecule has a net negative charge at physiological pH. Based on these facts and properties, as well as the presence of numerous carriers in the mitochondrial inner membrane for a diverse array of organic anions and zwitterions (including amino acids) [39], the most likely derivation of the mtGSH pool would be from transport of cytoplasmic GSH into the mitochondrial matrix via one or more electroneutral or electrogenic anion exchange carriers. In a series of studies with isolated renal cortical mitochondria from rat kidney and purified and reconstituted renal mitochondrial anion carriers [37,40,41], we demonstrated that two electroneutral anion exchangers in the renal mitochondrial inner membrane, the dicarboxylate carrier (DIC; Slc25a10), and the 2-oxoglutarate carrier (OGC; Slc25a11), account for most of the observable transport of GSH from the cytoplasm into the mitochondrial matrix. The function of these two carriers is illustrated in Figure 5.
Although the focus of this review is on renal mtGSH, many other tissues have similarly distinct mtGSH pools, and the function of both the DIC and OGC in transport of GSH from the cytoplasm into mitochondrial matrix has been described in other tissues, including the liver [42,43], lung [44,45], cardiac myocytes [46], colonic epithelium [47,48], and brain [49,50]. Despite the presence of the DIC, OGC, and GSH in all mitochondria, some tissue-specific differences in the transport processes between renal mitochondria and those from other tissues, such as the liver [43], have been noted.
In addition to the obvious role of mtGSH, which is present at millimolar concentrations, in maintaining the reduced state of mitochondrial protein thiols, the mtGSH pool is also closely linked to the metabolic state of the renal PT cell. This can be best appreciated by examining the role of 2-OG in mitochondrial intermediary metabolism and the various cellular GSH transport processes (Figure 6). Studies on the transport of GSH across the BLM from the interstitial space/plasma into the renal PT cell have shown that multiple carriers are involved, including Oat3, (possibly) Oat1, and NaC3 [34,51]. 2-OG serves as a co-substrate for all of these carriers, providing the link with the mitochondrial carriers for GSH.
From the scheme, it should be clear that while mtGSH levels may help maintain mitochondrial redox status and thus mitochondrial function, mitochondrial energetics, which supply ATP through the tricarboxylic acid (TCA) cycle and oxidative phosphorylation (OXPHOS), also supply 2-OG as a transporter co-substrate for multiple carriers on both the mitochondrial inner membrane and the BLM. Hence, alterations in substrate supply, such as those that might occur during starvation, could significantly impact the energetic driving forces for GSH transport.
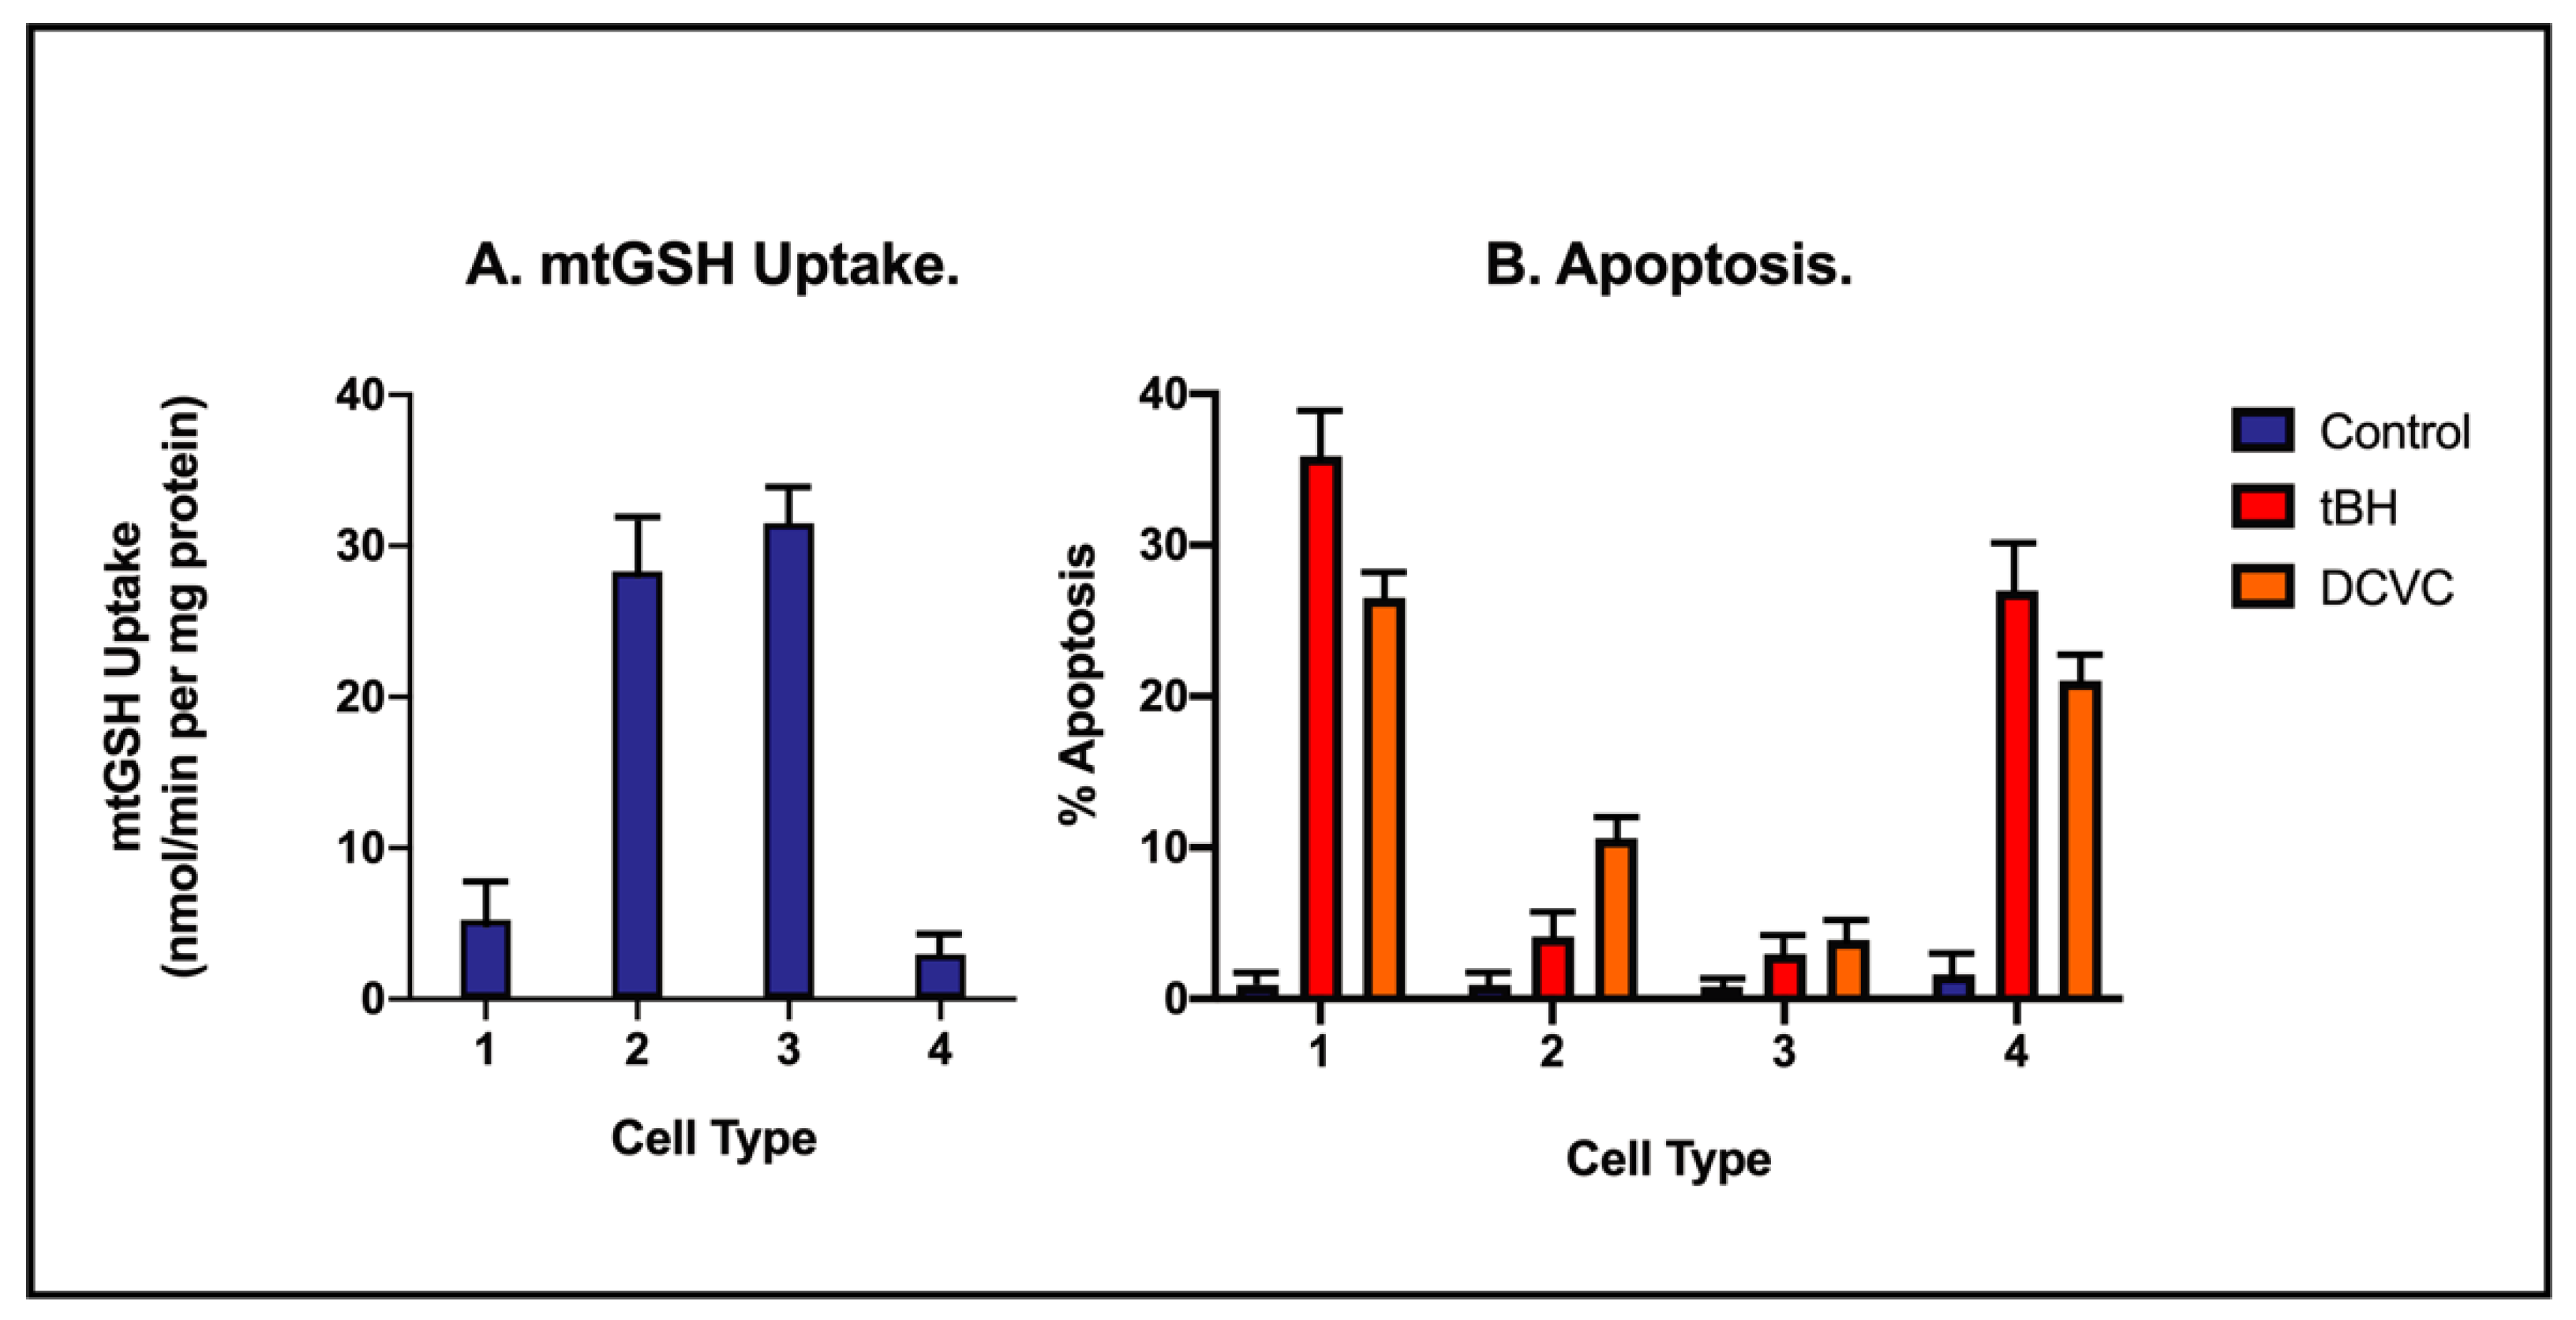
A clear demonstration of the importance of these mitochondrial anion transporters in maintaining mitochondrial and cellular function was provided by studies conducted in Normal Rat Kidney 52 Epithelial (NRK-52E) cells, an immortalized cell line derived from rat PT cells. Although these cells exhibit some of the limitations of other immortalized cell lines, they exhibit many properties of in vivo renal PT cells with respect to mitochondrial function and GSH status [52]. To assess the impact of different levels of mtGSH transport function in a renal PT cell line, initial rates of GSH uptake into mitochondria and apoptosis caused by two previously well-characterized mitochondrial toxicants, tBH and S-(1,2-dichlorovinyl)-L-cysteine (DCVC), were assessed in four types of NRK-52E cells that express varying levels of mtGSH transporter activity (Figure 7).
The transient overexpression of the DIC or the stable overexpression of the OGC was found to result in marked increases in mtGSH uptake, with the overexpression of either transporter resulting in approximately 6-fold increases in the rate of GSH uptake. Most importantly, NRK-52E cells overexpressing either of the carriers exhibited much less apoptosis due to exposure to either of the two well-established chemicals that are mitochondrial and renal toxicants. Consistent with the ability of the mitochondria to accumulate GSH and use it for antioxidant defense, cells that overexpressed the low-activity, double-cysteine mutant of the OGC exhibited slightly less mtGSH uptake activity than even NRK-WT cells but exhibited a high extent of apoptosis from either tBH or DCVC exposure.

3.2.2. Glutathione-Dependent Bioactivation in Renal Mitochondria

The concept that renal GSH in general and mtGSH in particular can have both critical protective and toxic roles in renal cells was recently reviewed [55]. An important group of environmental pollutants, halogenated alkanes and alkenes, are known to specifically elicit nephrotoxicity by GSH-dependent metabolism in the kidneys, by both enzymes in the renal PT cytoplasm and mitochondria [56,57]. The concept and key data behind the seemingly contradictory role of GSH in bioactivation date back more than 50 years to a set of studies on the metabolism and toxicity of DCVC in liver mitochondria by Parker [58] and Stonard and Parker [59,60]. Although these in vitro studies were not conducted in cells or isolated mitochondria from the in vivo target cell, namely the renal PT cell, they established basic mechanisms and metabolic pathways for the bioactivation process that is dependent on GSH.
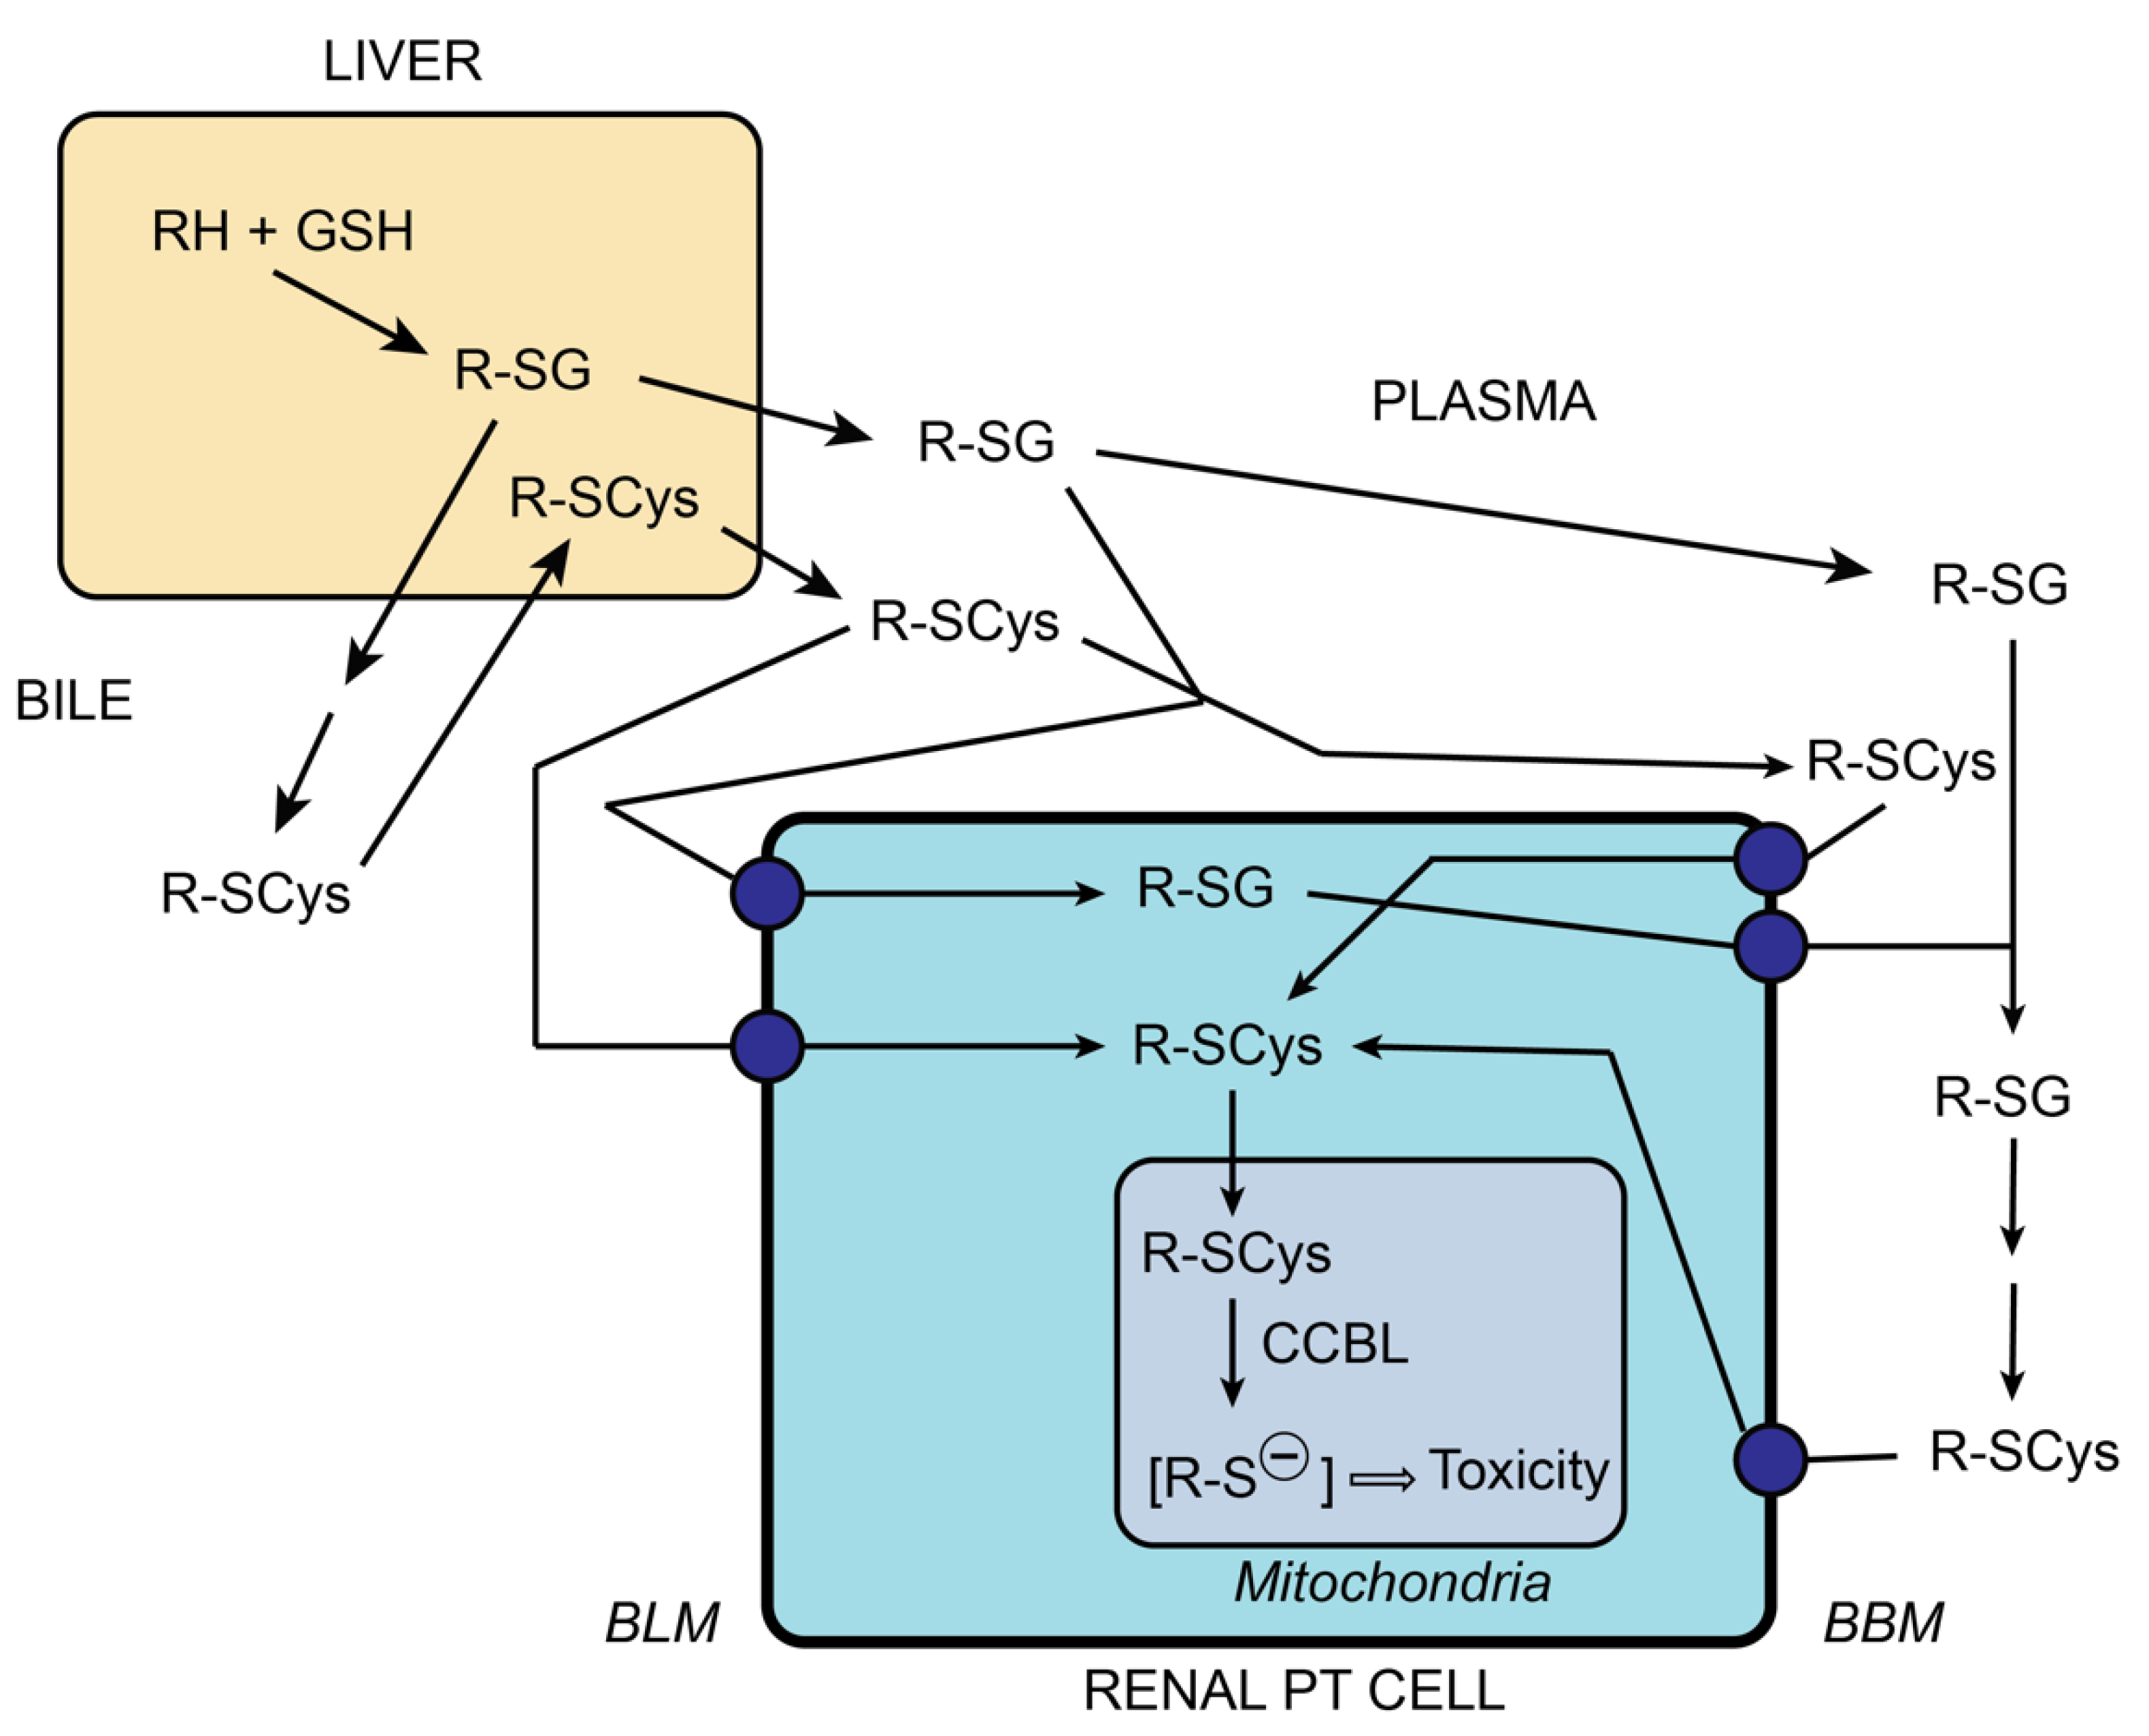
A variety of halogenated alkanes and alkenes, including trichloroethylene, perchloroethylene, hexachlorobutadiene, chlorotrifluoroethylene, and tetrafluoroethylene, all undergo conjugation with GSH, catalyzed by GSH S-transferases, to form GSH S-conjugates [56,57]. These GSH S-conjugates are primarily formed in the liver, but they can also form in many other tissues and are directed to the kidneys via interorgan translocation pathways (e.g., enterohepatic and renal-hepatic transfer) [61]. While the intact GSH S-conjugates may be taken up from the blood side via transport across the BLM [34,55,62], they are typically transported out into the tubular lumen, presumably by Oatp1a1, as shown for GSH in Figure 6. Other GSH S-conjugates that enter the renal tubules via glomerular filtration are rapidly degraded by GGT and DP activities on the BBM to release the corresponding cysteine S-conjugate. While some of these cysteine S-conjugates are metabolized to either N-acetyl-L-cysteine-S-conjugates (i.e., mercapturates) in the cytoplasm, some may also be metabolized by one of several cysteine conjugate-beta-lyases (CCBLs) in either the cytoplasm or mitochondria [56,63,64]. These processes are schematically summarized in Figure 8.
Those cysteine S-conjugates that are bioactivated within the mitochondria of renal PT cells have been demonstrated to produce a range of adverse effects, including targeting of specific mitochondrial enzymes, specific mitochondrial macromolecules including proteins, lipids, and DNA, or specific mitochondrial processes. There are extensive data on these responses in mitochondria for chlorotrifluoroethyl-L-cysteine [65], DCVC [66,67,68,69,70,71,72,73,74,75], pentachlorobutadienyl-L-cysteine [76,77], and tetrafluoroethyl-L-cysteine [78,79]. In this manner, the mitochondrial and cellular toxicity of these halogenated alkanes and alkenes is dependent on GSH, thus illustrating a role that contrasts with its typical antioxidant and protective roles.

3.3. Other Redox Sensors in Renal Mitochondria

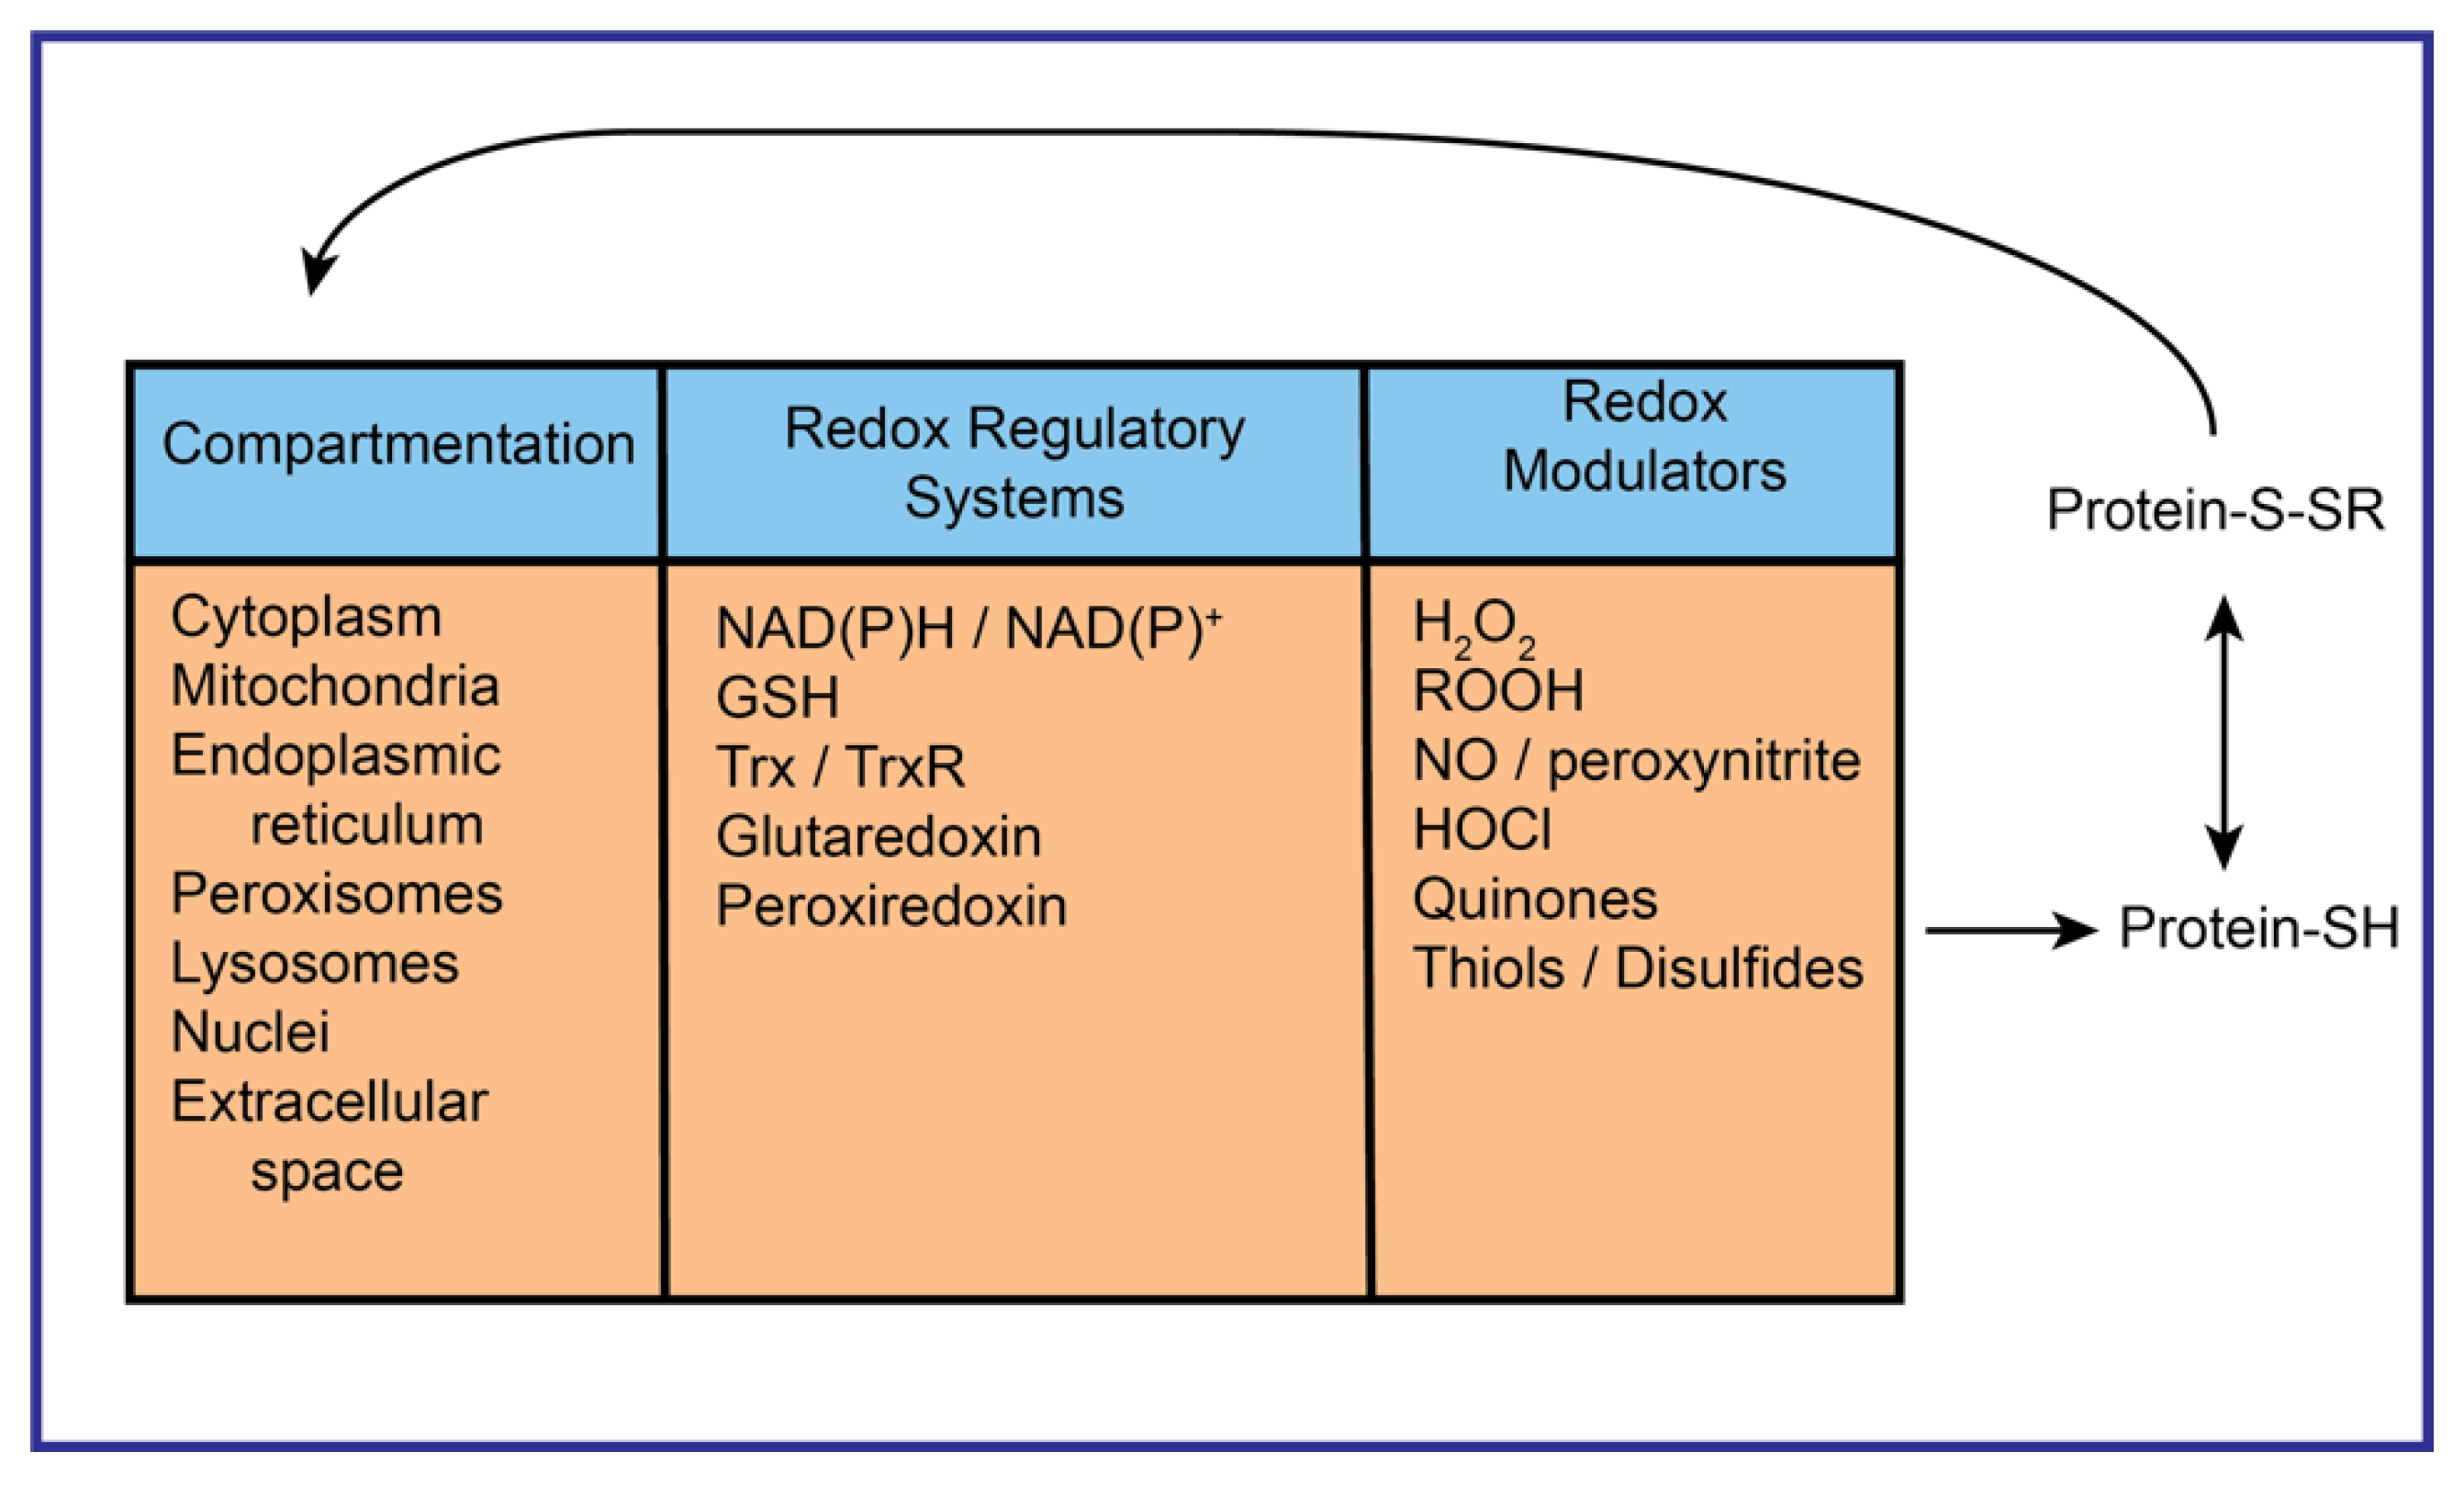
Although the loss of mtGSH clearly sensitizes cells to oxidants and many other types of cytotoxic chemicals, the GSH redox system is not the only one that functions to regulate redox status in mitochondria in the kidneys or other tissues. Jones and colleagues [80,81,82] characterized the role of the thioredoxin (Trx)–thioredoxin reductase (TrxR) system in multiple subcellular compartments, including the mitochondria, as an additional component. In a series of reviews [29,30,32,83,84,85], Jones and colleagues further conceptualized the signaling pathways that regulate redox systems, the redox proteome, and cellular energetics. In this redox systems approach, there are three main components that act to modulate protein cysteinyl residues, resulting in altered protein function (Figure 9). While events impacting cellular function and redox status occur in virtually every subcellular compartment and in the extracellular space, the mitochondria are prominent because of their high rate of metabolic activity in a concentrated space and the existence of numerous redox-sensitive targets. Redox modulators include ROS such as H2O2 and organic peroxides (ROOH), RNS such as NO and peroxynitrite, hypochlorous acid (HOCl), quinones such as ubiquinone, and various thiols and disulfides.

4. Renal Mitochondria in the Sequelae of Chemically-Induced Nephrotoxicity

An important focus in mechanistic toxicology is the determination of the sequence of events that occur upon the exposure of a target cell to a toxicant. Moreover, the identification of the most sensitive molecular targets in an exposure can provide both mechanistic insights and help in the development of therapeutic agents. In cells such as the renal PT cell, mitochondria are prominent targets for chemicals because of the following factors: (1) the high ATP consumption rate, resulting in a high degree of dependence on mitochondrial function; (2) the high density of mitochondria in the cells; (3) the availability of molecular targets (e.g., abundance of protein sulfhydryl groups); (4) the large array of organic anion and organic cation transporters on the inner mitochondrial membrane that can result in the intramitochondrial accumulation of a diverse array of chemicals; and (5) the presence of bioactivation enzymes within the mitochondria that can convert chemicals into reactive and toxic species. The central role of mitochondria in diverse forms of chemically-induced nephrotoxicity, as well as in renal pathological states such as ischemic injury and diabetic nephropathy, was highlighted by a sampling of key review articles published over the past few years [86,87,88,89,90]. The diversity of chemicals and drugs that produce nephrotoxicity that is associated with mitochondrial dysfunction is highlighted in Table 2.
While a discussion of the detailed mechanisms of action of these various chemicals and drugs is beyond the scope of this review, the key message is that for all these diverse agents and the pathological states of hypoxia or ischemia, mitochondrial dysfunction is a prominent, sensitive, and early mode of action. The range of responses and parameters measured in the studies cited in Table 2 include the general assessment of bioenergetic status, the mitochondrial permeability transition, FoF1-ATPase activity, mitochondrial membrane potential, respiration rate, mitochondrial-mediated apoptosis, mitochondrial Ca2+ ion uptake, mitochondrial sulfhydryl status, mitochondrial ROS levels, and mitochondrial transporter function. The diversity of the listed agents and processes, which represent only a sampling and are not exhaustive, should convey the concept that mitochondria play a central role in the response of the renal PT cell to many toxicants, nephrotoxic drugs, and pathological states.

5. Renal Mitochondria as a Source of Biomarkers for Chemical Exposure

Besides being prominent targets for many environmental toxicants and drugs, the mammalian kidneys and the renal PT cells in particular often exhibit dysfunction associated with many diseases. Both chronic kidney disease (CKD) and end-stage renal disease (ESRD) are frequently the result of either chronic diseases such as diabetes or exposure to environmental contaminants or therapeutic drugs whose clinical utility is limited by nephrotoxicity [115]. The standard indicators or biomarkers of renal function that are routinely used clinically, namely serum creatinine (SCr) or blood urea nitrogen (BUN), are relatively insensitive and typically do not exhibit noticeable elevations until there is a significant extent of renal injury that is often irreversible. To reduce the morbidity and mortality associated with CKD and ESRD, so-called biomarkers are needed that can indicate exposure or pathological states at a stage at which kidney injury is either minimal or still reversible.
Interest in the identification of biomarkers for kidney function that are based on non-invasive or minimally invasive methods, such as urine collection or blood samples, respectively, has been strong for more than two decades. One of the earliest attempts at systematizing efforts to identify and clinically apply renal biomarkers was a workshop on Biomarkers in Urinary Toxicology convened by the National Research Council, which published a report in 1995 [116]. A recent special issue of Science in 2019 [117] highlighted the continued interest in this topic. Over the past two decades or so, a number of additional and more sensitive biomarkers, such as Kidney Injury Molecule-1 (KIM-1), cystatin C, and N-acetyl-β-D-glucosaminidase (NAG), have been identified and validated. Indeed, the U.S. Food and Drug Administration (FDA) has developed validation protocols for new biomarkers for multiple target organs including the kidneys [118]. Although many of the new biomarkers for kidney function, such as KIM-1 and cystatin C, are dramatically more sensitive than the standards SCr and BUN, they still possess significant limitations in that they reflect some degree of renal injury and are not necessarily linked to the mechanism of action of specific drugs.
Considering the sensitivity of mitochondria in renal PT cells and the broad array of chemicals and pathological conditions that are associated with mitochondrial perturbations and damage, a hypothesis was proposed that changes in components from renal mitochondria could be detected in either urine or plasma soon after exposure to a broad array of nephrotoxic chemicals or during the early stages of disease progression. These components may include proteins (either altered in abundance or covalently modified), lipids, or low-molecular-weight metabolites.
To test this hypothesis, namely that PT cells primarily release mitochondrial components upon exposure to an array of environmental toxicants or drugs, primary cultures of human proximal tubular (hPT) cells were incubated with either a regular cell culture medium (=control) or DCVC (10, 100, or 250 µM) for either 4 or 24 h. Samples from the extracellular media were collected and analyzed by iTRAQTM labeling and LC–MS/MS in a manner similar to that in studies described in Table 1. To support the hypothesis that hPT cells exposed to a nephrotoxicant release mitochondrial contents into the extracellular space, the subcellular compartment from which the identified derived proteins were categorized (Table 3).
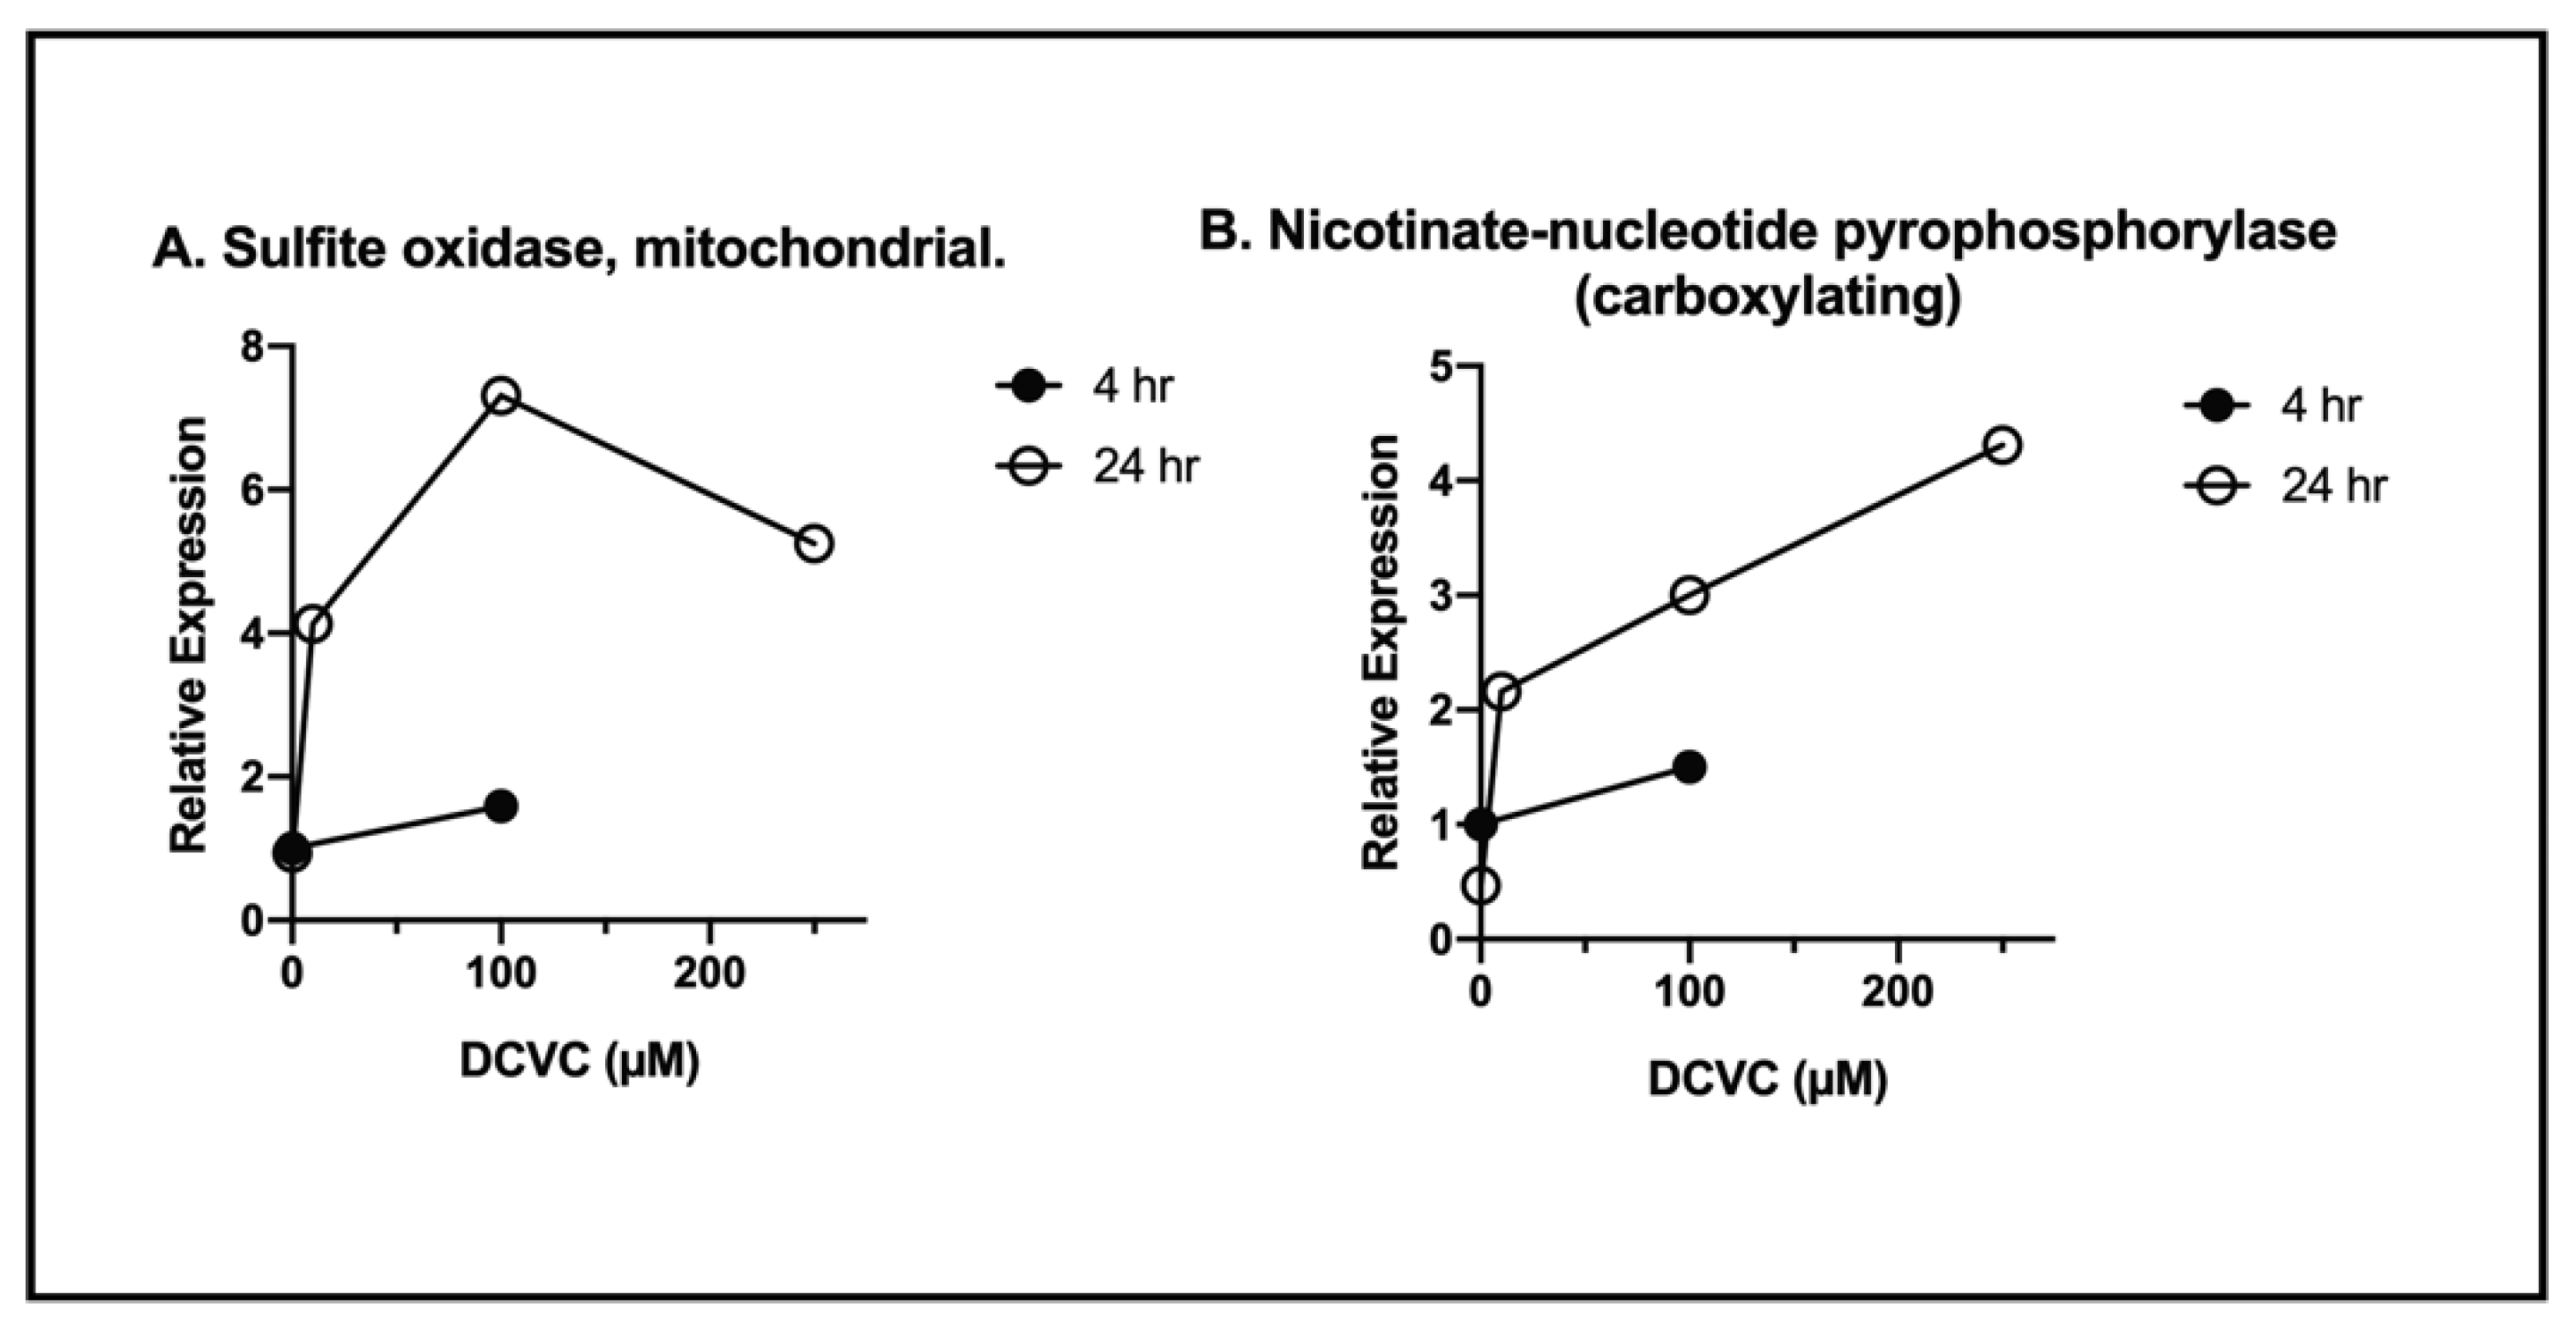
In the analysis, peptides from 311 proteins were identified, although only 299 had sufficient spectral information to permit quantitation. Although proteins that were detected were derived from almost every subcellular compartment, it is quite notable that mitochondria were by far the most significant contributor of detected proteins. Additional analysis using TMTTM multiplexing and LC–MS/MS to compare proteins found in the extracellular space from control vs. DCVC-treated cells identified several proteins that were differentially expressed. Although not all were of mitochondrial origin, two that exhibited significant dose- and exposure time-dependent increases are illustrated in Figure 10. The results showed two potential mitochondrial enzymes that are released from exposed hPT cells and may thus serve as early biomarkers of exposure. These studies were preliminary. Similar studies need to be conducted with other toxicants and drugs to demonstrate the broad applicability of the hypothesis.

6. Summary and Conclusions

This review sought to summarize some of the diverse roles of mitochondria in renal PT cellular function. These diverse roles include classic functions of mitochondria as the major source of ATP for the myriad of energy-dependent functions and as prominent target sites for toxic effects in the early sequence of events after chemical exposure, including initiating apoptosis. Additionally, mitochondria play important roles in the regulation of redox status in the cell by using a network of distinct systems, including the GSH and Trx systems. Though GSH is traditionally viewed as a prominent intracellular and intramitochondrial antioxidant, GSH also plays a role in the bioactivation and nephrotoxicity of a group of halogenated alkanes and alkenes. While the key bioactivation step occurs in both the cytoplasm and mitochondria, the mitochondria are especially susceptible to toxic effects from bioactivated cysteine conjugates. Finally, a novel role for mitochondria—providing a source of sensitive biomarkers of exposure to a diverse array of environmental toxicants and therapeutic drugs whose clinical use is dose-limited by nephrotoxicity—was discussed. Support for this hypothesized role is based on some preliminary proteomics data and is a logical extension of some of the other roles for mitochondria.

Funding

Some of the studies reported here were supported by a Research Stimulation Fund award from the Department of Pharmacology, Wayne State University School of Medicine, Detroit, MI, USA. Earlier work that was summarized was supported by NIDDK Grant R01-DK40725.

Acknowledgments

The author gratefully acknowledges the assistance of Paul Stemmer, Wayne State University, Joseph Caruso (formerly of Wayne State University and now at the University of Michigan, Ann Arbor, MI, USA) and Namhee Shin for technical and analytical assistance for the proteomics studies.

Conflicts of Interest

The author declares no conflict of interest.

Abbreviations

S-AdMetS-Adenosylmethionine
BBMBrush-border membrane
BLMBasolateral membrane
BUNBlood urea nitrogen
CCBLCysteine conjugate beta-lyase
CKDChronic kidney disease
CRHCompensatory renal hypertrophy
DICDicarboxylate carrier
DCVCS-(1,2-Dichlorovinyl)-L-cysteine
DPDipeptidase
ESRDEnd-stage renal disease
FDAFood and Drug Administration
FeNaFractional sodium excretion
GFRGlomerular filtration rate
GGT-Glutamyltransferase
GSHReduced glutathione
GSSGGlutathione disulfide
hPTHuman proximal tubular
iTRAQIsobaric tags for relative and absolute quantitation
KIM-1Kidney Injury Molecule-1
LC–MS/MSLiquid chromatography—mass spectrometry/mass spectrometry
mtGSHMitochondrial GSH
MrpMultidrug resistance-associated protein
NAGN-acetyl-β-D-glucosaminidase
NONitric oxide
NPXUninephrectomy
NRK-52ENormal Rat Kidney-52 Epithelial cell line
OAOrganic anion
OCOrganic cation
2-OG2-Oxoglutarate
OGC2-Oxoglutarate carrier
OXPHOSOxidative phosphorylation
PiInorganic phosphate
PTProximal tubular
QO2Oxygen consumption (respiration) rate
RNSReactive nitrogen species
ROSReactive oxygen species
SCrSerum creatinine
tBHtert-Butyl hydroperoxide
TCATricarboxylic acid
TrxThioredoxin
TrxRThioredoxin reductase
WTWild type

References

  1. Kiil, F. Renal energy metabolism and regulation of sodium reabsorption. Kidney Int. 1977, 11, 153–160. [Google Scholar] [CrossRef] [Green Version]
  2. Balaban, R.S.; Mandel, L.J.; Soltoff, S.P.; Storey, J.M. Coupling of active ion transport and aerobic respiratory rat in isolated renal tubules. Proc. Natl. Acad. Sci. USA 1980, 77, 447–451. [Google Scholar] [CrossRef] [PubMed] [Green Version]
  3. Harris, S.I.; Balaban, R.S.; Barrett, L.; Mandel, L.J. Mitochondrial respiratory capacity and Na+ - and K+-dependent adenosine triphosphatase-mediated ion transport in the intact renal cell. J. Biol. Chem. 1981, 256, 10319–10328. [Google Scholar] [CrossRef]
  4. Harris, S.I.; Patton, L.; Barrett, L.; Mandel, L.J. (Na+,K+)-ATPase kinetics within the intact renal cell: The role of oxidative metabolism. J. Biol. Chem. 1982, 257, 6996–7002. [Google Scholar] [CrossRef]
  5. Tessitore, N.; Sakhrani, L.M.; Massry, S.G. Quantitative requirement for ATP for active transport in isolated renal cells. Am. J. Physiol. Physiol. 1986, 251, C120–C127. [Google Scholar] [CrossRef] [PubMed]
  6. Simpson, D.P. Mitochondrial transport functions and renal metabolism. Kidney Int. 1983, 23, 785–793. [Google Scholar] [CrossRef] [Green Version]
  7. Brazy, P.C.; Mandel, L.J.; Gullans, S.R.; Soltoff, S.P. Interactions between phosphate and oxidative metabolism in proximal renal tubules. Am. J. Physiol. Content 1984, 247, F575–F581. [Google Scholar] [CrossRef]
  8. Soltoff, S. ATP and the Regulation of Renal Cell Function. Annu. Rev. Physiol. 1986, 48, 9–31. [Google Scholar] [CrossRef] [PubMed]
  9. Bhargava, P.; Schnellmann, R.G. Mitochondrial energetics in the kidney. Nat. Rev. Nephrol. 2017, 13, 629–646. [Google Scholar] [CrossRef] [PubMed]
  10. Fine, L. The biology of renal hypertrophy. Kidney Int. 1986, 29, 619–634. [Google Scholar] [CrossRef] [Green Version]
  11. Shirley, D.G.; Walter, S.J. Acute and chronic changes in renal function following unilateral nephrectomy. Kidney Int. 1991, 40, 62–68. [Google Scholar] [CrossRef] [PubMed] [Green Version]
  12. Fine, L.G.; Badie-Dezfooly, B.; Lowe, A.G.; Hamzeh, A.; Wells, J.; Salehmoghaddam, S. Stimulation of Na/H antiport is an early event in hypertrophy of renal proximal tubular cells. Proc. Natl. Acad. Sci. USA. 1985, 82, 1736–1740. [Google Scholar] [CrossRef] [Green Version]
  13. Johnson, H.A.; Amendola, F. Mitochondrial proliferation in compensatory growth of the kidney. Am. J. Pathol. 1969, 54, 35–45. [Google Scholar] [PubMed]
  14. Schmidt, U.; Dubach, U.C. Induction of NaK ATPase in the proximal and distal convolution of the rat nephron after uninephrectomy. Pflug. Arch. 1974, 346, 39–48. [Google Scholar] [CrossRef] [PubMed]
  15. Jacobson, M.P.; Rodriguez, H.J.; Hogan, W.C.; Klahr, S. Mechanism of activation of renal Na+-K+-ATPase in the rat: Effects of reduction of renal mass. Am. J. Physiol. 1980, 239, F281–F288. [Google Scholar] [CrossRef] [PubMed]
  16. Harris, D.C.H.; Chan, L.; Schrier, R.W. Remnant kidney hypermetabolism and progression of chronic renal failure. Am. J. Physiol. 1988, 254, F267–F276. [Google Scholar] [CrossRef]
  17. Nath, K.A.; Croatt, A.J.; Hostetter, T.H. Oxygen consumption and oxidant stress in surviving nephrons. Am. J. Physiol. 1990, 258, F1354–F1362. [Google Scholar] [CrossRef] [PubMed]
  18. Zalups, R.K.; Lash, L.H. Effects of uninephrectomy and mercuric chloride on renal glutathione homeostasis. J. Pharm. Exp. 1990, 254, 962–970. [Google Scholar]
  19. Lash, L.H.; Zalups, R.K. Mercuric chloride-induced cytotoxicity and compensatory hypertrophy in rat kidney proximal tubular cells. J. Pharm. Exp. 1992, 261, 819–829. [Google Scholar]
  20. Lash, L.H.; Zalups, R.K. Activities of enzymes involved in renal cellular glutathione metabolism after uninephrectomy in the rat. Arch. Biochem. Biophys. 1994, 309, 129–138. [Google Scholar] [CrossRef]
  21. Lash, L.H.; Putt, D.A.; Zalups, R.K. Influence of exogenous thiols on mercury-induced cellular injury in isolated renal proximal tubular and distal tubular cells from normal and uninephrectomized rats. J. Pharm. Exp. 1999, 291, 492–502. [Google Scholar]
  22. Lash, L.H.; Putt, D.A.; Zalups, R.K. Biochemical and functional characteristics of cultured renal epithelial cells from uninephrectomized rats: Factors influencing nephrotoxicity. J. Pharm. Exp. 2001, 296, 243–251. [Google Scholar]
  23. Lash, L.H.; Putt, D.A.; Horky III, S.J.; Zalups, R.K. Functional and toxicological characteristics of isolated renal mitochondria: Impact of compensatory renal growth. Biochem. Pharm. 2001, 62, 383–395. [Google Scholar] [CrossRef]
  24. Lash, L.H.; Hueni, S.E.; Putt, D.A.; Zalups, R.K. Role of organic anion and amino acid carriers in transport of inorganic mercury in rat renal basolateral membrane vesicles: Influence of compensatory renal growth. Toxicol. Sci. 2005, 88, 630–644. [Google Scholar] [CrossRef] [PubMed]
  25. Lash, L.H.; Putt, D.A.; Zalups, R.K. Influence of compensatory renal growth on susceptibility of primary cultures of renal cells to chemically induced injury. Toxicol. Sci. 2006, 94, 417–427. [Google Scholar] [CrossRef] [PubMed] [Green Version]
  26. Benipal, B.; Lash, L.H. Influence of renal compensatory hypertrophy on mitochondrial energetics and redox status. Biochem. Pharm. 2011, 81, 295–303. [Google Scholar] [CrossRef] [PubMed]
  27. Benipal, B.; Lash, L.H. Modulation of mitochondrial glutathione status and cellular energetics in primary cultures of proximal tubular cells from remnant kidney of uninephrectomized rats. Biochem. Pharm. 2013, 85, 1379–1388. [Google Scholar] [CrossRef]
  28. Jones, D.P.; Sies, H. The redox code. Antioxid. Redox Signal. 2015, 23, 734–746. [Google Scholar] [CrossRef] [PubMed] [Green Version]
  29. Go, Y.-M.; Fernandes, J.; Hu, X.; Uppal, K.; Jones, D.P. Mitochondrial network responses in oxidative physiology and disease. Free Radic. Biol. Med. 2018, 116, 31–40. [Google Scholar] [CrossRef] [PubMed]
  30. Roede, J.R.; Go, Y.-M.; Jones, D.P. Redox equivalents and mitochondrial bioenergetics. Methods Mol. Biol. 2018, 1782, 197–227. [Google Scholar] [PubMed]
  31. Dennis, K.K.; Go, Y.-M.; Jones, D.P. Redox systems biology of nutrition and oxidative stress. J. Nutr. 2019, 194, 553–565. [Google Scholar] [CrossRef] [PubMed]
  32. Sies, H.; Jones, D.P. Reactive oxygen species (ROS) as pleiotropic physiological signalling agents. Nat. Rev. Mol. Cell. Biol. 2020, 21, 363–383. [Google Scholar] [CrossRef]
  33. Cai, J.; Jones, D.P. Mitochondrial redox signaling during apoptosis. J. Bioenerg. Biomembr. 1999, 31, 327–334. [Google Scholar] [CrossRef] [PubMed]
  34. Lash, L.H. Role of glutathione transport processes in kidney function. Toxicol. Appl. Pharm. 2005, 204, 329–342. [Google Scholar] [CrossRef] [PubMed]
  35. Lash, L.H. Mitochondrial glutathione transport: Physiological, pathological and toxicological implications. Chem. Biol. Interact. 2006, 163, 54–67. [Google Scholar] [CrossRef] [PubMed] [Green Version]
  36. Lash, L.H. Mitochondrial glutathione in toxicology and disease of the kidneys. Toxicol. Res. 2012, 1, 39–46. [Google Scholar] [CrossRef]
  37. McKernan, T.B.; Woods, E.B.; Lash, L.H. Uptake of glutathione by renal cortical mitochondria. Arch. Biochem. Biophys. 1991, 288, 653–663. [Google Scholar] [CrossRef]
  38. Schnellmann, R.G.; Mandel, L.J. Intracellular compartmentation of glutathione in rabbit renal proximal tubules. Biochem. Biophys. Res. Commun. 1985, 133, 1001–1005. [Google Scholar] [CrossRef]
  39. Schoolwerth, A.C.; LaNoue, K.F. Transport of metabolic substrates in renal mitochondria. Annu. Rev. Physiol. 1985, 47, 143–171. [Google Scholar] [CrossRef] [PubMed]
  40. Chen, Z.; Lash, L.H. Evidence for mitochondrial uptake of glutathione by dicarboxylate and 2-oxoglutarate carriers. J. Pharm. Exp. 1998, 285, 608–618. [Google Scholar]
  41. Chen, Z.; Putt, D.A.; Lash, L.H. Enrichment and functional reconstitution of glutathione transport activity from rabbit kidney mitochondria: Further evidence for the role of the dicarboxylate and 2-oxoglutarate carriers in mitochondrial glutathione transport. Arch. Biochem. Biophys. 2000, 373, 193–202. [Google Scholar] [CrossRef] [PubMed]
  42. Coll, O.; Garcia-Ruiz, C.; Kaplowitz, N.; Fernandez-Checa, J.C. Sensitivity of the 2-oxoglutarate carrier to alcohol intake contributes to mitochondrial glutathione depletion. Hepatology 2003, 38, 692–702. [Google Scholar] [CrossRef] [PubMed] [Green Version]
  43. Zhong, Q.; Putt, D.A.; Xu, F.; Lash, L.H. Hepatic mitochondrial transport of glutathione: Studies in isolated rat liver mitochondria and H4IIE rat hepatoma cells. Arch. Biochem. Biophys. 2008, 474, 119–127. [Google Scholar] [CrossRef] [PubMed] [Green Version]
  44. Guidot, D.M.; Brown, L.A.S. Mitochondrial glutathione replacement restores surfactant synthesis and secretion in alveolar epithelial cells of ethanol-fed rats. Alcohol Clin. Exp. Res. 2000, 24, 1070–1076. [Google Scholar] [CrossRef] [PubMed]
  45. O′Donovan, D.J.; Fernandes, C.J. Mitochondrial glutathione and oxidative stress: Implications for pulmonary oxygen toxicity in premature infants. Mol. Genet. Metab. 2000, 71, 352–358. [Google Scholar] [CrossRef]
  46. Ghosh, S.; Pulinilkunnil, T.; Yuen, G.; Kewalramani, G.; An, D.; Qi, D.; Abrahani, A.; Rodrigues, B. Cardiomycyte apoptosis induced by short-term diabetes requires mitochondrial GSH depletion. Am. J. Physiol. 2005, 289, H768–H776. [Google Scholar]
  47. Circu, M.L.; Rodriguez, C.; Maloney, R.; Moyer, M.P.; Aw, T.Y. Contribution of mitochondrial GSH transport to matrix GSH status and colonic epithelial cell apoptosis. Free Radic. Biol. Med. 2008, 44, 768–778. [Google Scholar] [CrossRef] [Green Version]
  48. Circu, M.L.; Moyer, M.P.; Harrison, L.; Aw, T.Y. Contribution of glutathione status to oxidant-induced mitochondrial DNA damage in colonic epithelial cells. Free Radic. Biol. Med. 2009, 47, 1190–1198. [Google Scholar] [CrossRef] [Green Version]
  49. Kamga, C.K.; Zhang, S.X.; Wang, Y. Dicarboxylate carrier-mediated glutathione transport is essential for reactive oxygen species homeostasis and normal respiration in rat brain mitochondria. Am. J. Physiol. 2010, 299, C497–C505. [Google Scholar] [CrossRef] [Green Version]
  50. Wilkins, H.M.; Marquardt, K.; Lash, L.H.; Linseman, D.A. Bcl-2 is a novel interacting partner for the 2-oxoglutarate carrier and a key regulator of mitochondrial glutathione. Free Radic. Biol. Med. 2012, 52, 410–419. [Google Scholar] [CrossRef] [Green Version]
  51. Lash, L.H.; Putt, D.A.; Xu, F.; Matherly, L.H. Role of rat organic anion transporter 3 (Oat3) in the renal basolateral transport of glutathione. Chem. Biol. Interact. 2007, 170, 124–134. [Google Scholar] [CrossRef] [PubMed] [Green Version]
  52. Lash, L.H.; Putt, D.A.; Hueni, S.E.; Cao, W.; Xu, F.; Kulidjian, S.J.; Horwitz, J.P. Cellular energetics and glutathione status in NRK-52E cells: Toxicological implications. Biochem. Pharm. 2002, 64, 1533–1546. [Google Scholar] [CrossRef]
  53. Lash, L.H.; Putt, D.A.; Matherly, L.H. Protection of NRK-52E cells, a rat renal proximal tubular cell line, from chemical induced apoptosis by overexpression of a mitochondrial glutathione transporter. J. Pharm. Exp. 2002, 303, 476–486. [Google Scholar] [CrossRef] [PubMed] [Green Version]
  54. Xu, F.; Putt, D.A.; Matherly, L.H.; Lash, L.H. Modulation of expression of rat mitochondrial 2-oxoglutarate carrier in NRK-52E cells alters mitochondrial transport and accumulation of glutathione and susceptibility to chemically induced apoptosis. J. Pharm. Exp. 2006, 316, 1175–1186. [Google Scholar] [CrossRef] [PubMed] [Green Version]
  55. Lash, L.H. Renal glutathione transport systems: Roles in redox homeostasis, cytoprotection, and bioactivation. In Glutathione; Flohé, L., Ed.; CRC Press: Boca Raton, FL, USA, 2018; Chapter 2; pp. 35–52. [Google Scholar]
  56. Lash, L.H. Glutathione-dependent bioactivation. In Current Protocols in Toxicology; Reed, D.J., Ed.; Unit 6.12; John Wiley & Sons: New York, NY, USA, 2007. [Google Scholar] [CrossRef]
  57. Lash, L.H.; Chiu, W.A.; Guyton, K.Z.; Rusyn, I.I. Trichloroethylene biotransformation and its role in mutagenicity, carcinogenicity and target organ toxicity. Mutat. Res. Rev. 2014, 762, 22–36. [Google Scholar] [CrossRef] [Green Version]
  58. Parker, V.H. A biochemical study of the toxicity of S-dichlorovinyl-L-cysteine. Food Cosmet. Toxicol. 1965, 3, 75–84. [Google Scholar] [CrossRef]
  59. Stonard, M.D.; Parker, V.H. 2-Oxoacid dehydrogenases of rat liver mitochondria as the site of action of S-(1,2-dichlorovinyl)-L-cysteine and S-(1,2-dichlorovinyl)-3-mercaptopropionic acid. Biochem. Pharm. 1971, 20, 2417–2427. [Google Scholar] [CrossRef]
  60. Stonard, M.D.; Parker, V.H. The metabolism of S-(1,2-dichlorovinyl)-L-cysteine by rat liver mitochondria. Biochem. Pharm. 1971, 20, 2429–2437. [Google Scholar] [CrossRef]
  61. Lash, L.H.; Jones, D.P.; Anders, M.W. Glutathione homeostasis and glutathione S-conjugate toxicity in kidney. Rev. Biochem. Toxicol. 1988, 9, 29–67. [Google Scholar]
  62. Lash, L.H.; Anders, M.W. Uptake of nephrotoxic S-conjugates by isolated rat renal proximal tubular cells. J. Pharm. Exp. 1989, 248, 531–537. [Google Scholar]
  63. Lash, L.H.; Elfarra, A.A.; Anders, M.W. Renal cysteine conjugate b-lyase: Bioactivation of nephrotoxic cysteine S-conjugates in mitochondrial outer membrane. J. Biol. Chem. 1986, 261, 5930–5935. [Google Scholar] [CrossRef]
  64. Stevens, J.L.; Ayoubi, N.; Robbins, J.D. The role of mitochondrial matrix enzymes in the metabolism and toxicity of cysteine conjugates. J. Biol. Chem. 1988, 263, 3395–3401. [Google Scholar] [CrossRef]
  65. Banki, K.; Elfarra, A.A.; Lash, L.H.; Anders, M.W. Metabolism of S-(2-chloro-1,1,2-trifluoroethyl)-L-cysteine to hydrogen sulfide and the role of hydrogen sulfide in S-(2-chloro-1,1,2-trifluoroethyl)-L-cysteine-induced mitochondrial toxicity. Biochem. Biophys. Res. Commun. 1986, 138, 707–713. [Google Scholar] [CrossRef]
  66. Lash, L.H.; Anders, M.W. Mechanism of S-(1,2-dichlorovinyl)-L-cysteine- and S-(1,2-dichlorovinyl)-L-homocysteine-induced renal mitochondrial toxicity. Mol. Pharm. 1987, 32, 549–556. [Google Scholar]
  67. Hayden, P.J.; Stevens, J.L. Cysteine conjugate toxicity, metabolism, and binding to macromolecules in isolated rat kidney mitochondria. Mol. Pharm. 1990, 37, 468–476. [Google Scholar]
  68. Hayden, P.J.; Ichimura, T.; McCann, D.J.; Pohl, L.R.; Stevens, J.L. Detection of cysteine conjugate metabolite adduct formation with specific mitochondrial proteins using antibodies raised against halothane metabolite adducts. J. Biol. Chem. 1991, 266, 18415–18418. [Google Scholar] [CrossRef]
  69. Van de Water, B.; Zietbey, J.P.; de Bront, H.J.G.M.; Mulder, G.J.; Nagelkerke, J.F. The relationship between intracellular Ca2+ and the mitochondrial membrane potential in isolated proximal tubular cells from rat kidney exposed to the nephrotoxin 1,2-dichlorovinyl-cysteine. Biochem. Pharm. 1993, 45, 2259–2267. [Google Scholar] [CrossRef]
  70. Van de Water, B.; Zoeteweij, J.P.; de Bont, H.J.G.M.; Mulder, G.J.; Nagelkerke, J.F. Role of mitochondrial Ca2+ in the oxidative stress-induced dissipation of the mitochondrial membrane potential: Studies in isolated proximal tubular cells using the nephrotoxin 1,2-dichlorovinyl-L-cysteine. J. Biol. Chem. 1994, 269, 14546–14552. [Google Scholar] [CrossRef]
  71. Lash, L.H.; Xu, Y.; Elfarra, A.A.; Duescher, R.J.; Parker, J.C. Glutathione-dependent metabolism of trichloroethylene in isolated liver and kidney cells of rats and its role in mitochondrial and cellular toxicity. Drug Metab. Dispos. 1995, 23, 846–853. [Google Scholar] [PubMed]
  72. Van de Water, B.; Zoeteweij, J.P.; de Bont, H.J.G.M.; Nagelkerke, J.F. Inhibition of succinate:ubiquinone reductase and decrease of ubiquinol in nephrotoxic cysteine S-conjugate-induced oxidative cell injury. Mol. Pharm. 1995, 48, 928–937. [Google Scholar]
  73. Chen, Y.; Cai, J.; Anders, M.W.; Stevens, J.L.; Jones, D.P. Role of mitochondrial dysfunction in S-(1,2-dichlorovinyl)-L-cysteine-induced apoptosis. Toxicol. Appl. Pharm. 2001, 170, 172–180. [Google Scholar] [CrossRef] [PubMed]
  74. Lash, L.H.; Putt, D.A.; Hueni, S.E.; Krause, R.J.; Elfarra, A.A. Roles of necrosis, apoptosis, and mitochondrial dysfunction in S-(1,2-dichlorovinyl)-L-cysteine sulfoxide-induced cytotoxicity in primary cultures of human renal proximal tubular cells. J. Pharm. Exp. 2003, 305, 1163–1172. [Google Scholar] [CrossRef]
  75. Xu, F.; Papanayotou, I.; Putt, D.A.; Wang, J.; Lash, L.H. Role of mitochondrial dysfunction in cellular responses to S-(1,2-dichlorovinyl)-L-cysteine in primary cultures of human proximal tubular cells. Biochem. Pharm. 2008, 76, 552–567. [Google Scholar] [CrossRef] [PubMed] [Green Version]
  76. Wallin, A.; Jones, T.W.; Vercesi, A.E.; Cotgreave, I.; Ormstad, K.; Orrenius, S. Toxicity of S-pentachlorobutadienyl-L-cysteine studied with isolated rat renal cortical mitochondria. Arch. Biochem. Biophys. 1987, 258, 365–372. [Google Scholar] [CrossRef]
  77. Schnellmann, R.G.; Cross, T.J.; Lock, E.A. Pentachlorobutadienyl-L-cysteine uncouples oxidative phosphorylation by dissipating the proton gradient. Toxicol. Appl. Pharm. 1989, 100, 498–505. [Google Scholar] [CrossRef]
  78. Cooper, A.J.L.; Bruschi, S.A.; Anders, M.W. Toxic, halogenated cysteine S-conjugates and targeting of mitochondrial enzymes of energy metabolism. Biochem. Pharm. 2002, 64, 553–564. [Google Scholar] [CrossRef]
  79. James, E.A.; Gygi, S.P.; Adams, M.L.; Pierce, R.H.; Fausto, N.; Aebersold, R.H.; Nelson, S.D.; Bruschi, S.A. Mitochondrial aconitase modification, functional inhibition, and evidence for a supramolecular complex of the TCA cycle by the renal toxicant S-(1,1,2,2-tetrafluoroethyl)-L-cysteine. Biochemistry 2002, 41, 6789–6797. [Google Scholar] [CrossRef] [PubMed]
  80. Watson, W.H.; Yang, X.; Choi, Y.E.; Jones, D.P.; Kehrer, J.P. Thioredoxin and its role in toxicology. Toxicol. Sci. 2004, 78, 3–14. [Google Scholar] [CrossRef] [PubMed] [Green Version]
  81. Zhang, H.; Go, Y.-M.; Jones, D.P. Mitochondrial thioredoxin-2/peroxiredoxin-3 system functions in parallel with mitochondrial GSH system in protection against oxidative stress. Arch. Biochem. Biophys. 2007, 465, 119–126. [Google Scholar] [CrossRef] [PubMed]
  82. He, M.; Cai, J.; Go, Y.-M.; Johnson, J.M.; Martin, W.D.; Hansen, J.M.; Jones, D.P. Identification of thioredoxin-2 as a regulator of the mitochondrial permeability transition. Toxicol. Sci. 2008, 105, 44–50. [Google Scholar] [CrossRef] [PubMed] [Green Version]
  83. Hansen, J.M.; Go, Y.-M.; Jones, D.P. Nuclear and mitochondrial compartmentation of oxidative stress and redox signaling. Annu. Rev. Pharm. Toxicol. 2006, 46, 215–234. [Google Scholar] [CrossRef] [PubMed]
  84. Kemp, M.; Go, Y.-M.; Jones, D.P. Nonequilibrium thermodynamics of thiol/disulfide redox systems: A perspective on redox systems biology. Free Radic. Biol. Med. 2008, 44, 921–937. [Google Scholar] [CrossRef] [Green Version]
  85. Go, Y.-M.; Jones, D.P. Thiol/disulfide redox states in signaling and sensing. Crit. Rev. Biochem. Mol. Biol. 2013, 48, 173–181. [Google Scholar] [CrossRef] [PubMed] [Green Version]
  86. Zhan, M.; Brooks, C.; Liu, F.; Sun, L.; Dong, Z. Mitochondrial dynamics: Regulatory mechanisms and emerging role in renal pathophysiology. Kidney Int. 2013, 83, 568–581. [Google Scholar] [CrossRef] [Green Version]
  87. Sharma, K. Mitochondrial dysfunction in the diabetic kidney. Adv. Exp. Med. Biol. 2017, 982, 553–562. [Google Scholar]
  88. Duann, P.; Lin, P.-H. Mitochondrial damage and kidney disease. Adv. Exp. Med. Biol. 2017, 982, 529–552. [Google Scholar] [PubMed]
  89. Quadri, M.M.; Fatima, S.-S.; Che, R.-C.; Zhang, A.-H. Mitochondria and renal fibrosis. Adv. Exp. Med. Biol. 2019, 1165, 501–524. [Google Scholar] [PubMed]
  90. Inoue, T.; Maekawa, H.; Inagi, R. Organelle crosstalk in the kidney. Kidney Int. 2019, 95, 1318–1325. [Google Scholar] [CrossRef] [PubMed] [Green Version]
  91. Schnellmann, R.G.; Ewell, F.P.Q.; Sgambati, M.; Mandel, L.J. Mitochondrial toxicity of 2-bromohydroquinone in rabbit renal proximal tubules. Toxicol. Appl. Pharm. 1987, 90, 420–426. [Google Scholar] [CrossRef]
  92. Hill, B.A.; Monks, T.J.; Lau, S.S. The effects of 2,3,5-triglutathion-S-yl)hydroquinone on renal mitochondrial respiratory function in vivo and in vitro: Possible role in cytotoxicity. Toxicol. Appl. Pharm. 1992, 117, 165–171. [Google Scholar] [CrossRef]
  93. Tune, B.M.; Fravert, D.; Hsu, C.-Y. Oxidative and mitochondrial toxic effects of cephalosporin antibiotics in the kidney: A comparative study of cephaloridine and cephaloglycin. Biochem. Pharm. 1989, 38, 795–802. [Google Scholar] [CrossRef]
  94. Tune, B.M.; Hsu, C.-Y. The renal mitochondrial toxicity of cephalosporins: Specificity of the effect on anionic substrate uptake. J. Pharm. Exp. 1990, 252, 65–69. [Google Scholar]
  95. Mela-Riker, L.M.; Widener, L.L.; Houghton, D.C.; Bennett, W.M. Renal mitochondrial integrity during continuous gentamicin treatment. Biochem. Pharm. 1986, 35, 979–984. [Google Scholar] [CrossRef]
  96. Walker, P.D.; Shah, S.V. Gentamicin enhanced production of hydrogen peroxide by renal cortical mitochondria. Am. J. Physiol. 1987, 253, C495–C499. [Google Scholar] [CrossRef] [PubMed]
  97. Ueda, N.; Guidet, B.; Shah, S.V. Gentamicin-induced mobilization of iron from renal cortical mitochondria. Am. J. Physiol. 1993, 265, F435–F439. [Google Scholar] [CrossRef] [PubMed]
  98. Kohler, J.J.; Hosseini, S.H.; Hoying-Brandt, A.; Green, E.; Johnson, D.M.; Russ, R.; Tran, D.; Raper, C.M.; Santoianni, R.; Lewis, W. Tenofovir renal toxicity targets mitochondria of renal proximal tubules. Lab. Investig. 2009, 89, 513–519. [Google Scholar] [CrossRef] [PubMed] [Green Version]
  99. Herlitz, L.C.; Mohan, S.; Stokes, M.B.; Radhakrishnan, J.; D’Agati, V.D.; Markowitz, G.S. Tenofovir nephrotoxicity: Acute tubular necrosis with distinctive clinical, pathological, and mitochondrial abnormalities. Kidney Int. 2010, 78, 1171–1177. [Google Scholar] [CrossRef] [PubMed] [Green Version]
  100. Perazella, M.A. Tenofovir-induced kidney disease: An acquired renal tubular mitochondriopathy. Kidney Int. 2010, 78, 1060–1063. [Google Scholar] [CrossRef] [Green Version]
  101. Milián, L.; Peris, J.E.; Gandía, P.; Andújar, I.; Pallardó, L.; Górriz, J.L.; Blas-García, A. Tenofovir-induced toxicity in renal proximal tubular epithelial cells: Involvement of mitochondria. AIDS 2017, 31, 1679–1684. [Google Scholar] [CrossRef] [PubMed]
  102. Ramamoorthy, H.; Abraham, P.; Isaac, B.; Selvakumar, D. Mitochondrial pathway of apoptosis and necrosis contribute to tenofovir disproxil fumarate-induced renal damage in rats. Hum. Exp. Toxicol. 2019, 38, 288–302. [Google Scholar] [CrossRef] [PubMed]
  103. Brady, H.R.; Kone, B.C.; Stromski, M.E.; Zeidel, M.L.; Giebisch, G.; Gullans, S.R. Mitochondrial injury: An early event in cisplatin toxicity to renal proximal tubules. Am. J. Physiol. 1990, 258, F1181–F1187. [Google Scholar] [CrossRef] [PubMed]
  104. Zhang, J.-G.; Lindup, W.E. Role of mitochondria in cisplatin-induced oxidative damage exhibited by rat renal cortical slices. Biochem. Pharm. 1993, 45, 2215–2222. [Google Scholar]
  105. Zhang, J.-G.; Lindup, W.E. Cisplatin nephrotoxicity: Decreases in mitochondrial protein sulfhydryl concentration and calcium uptake by mitochondria from rat renal cortical slices. Biochem. Pharm. 1994, 47, 1127–1135. [Google Scholar] [CrossRef]
  106. Kruidering, M.; van de Water, B.; de Heer, E.; Mulder, G.J.; Nagelkerke, J.F. Cisplatin-induced nephrotoxicity in porcine proximal tubular cells: Mitochondrial dysfunction by inhibition of complexes I to IV of the respiratory chain. J. Pharm. Exp. 1997, 280, 638–649. [Google Scholar]
  107. Jiang, M.; Wang, C.; Huang, S.; Yang, T.; Dong, Z. Cisplatin-induced apoptosis in p53-deficient renal cells via the intrinsic mitochondrial pathway. Am. J. Physiol. 2009, 296, F983–F993. [Google Scholar] [CrossRef] [PubMed] [Green Version]
  108. Cao, L.-C.; Honeyman, T.W.; Cooney, R.; Kennington, L.; Scheid, C.R.; Jonassen, J.A. Mitochondrial dysfunction is a primary event in renal cell oxalate toxicity. Kidney Int. 2004, 66, 1890–1900. [Google Scholar] [CrossRef] [PubMed] [Green Version]
  109. Lund, B.-O.; Miller, D.M.; Woods, J.S. Studies on Hg(II)-induced H2O2 formation and oxidative stress in vivo and in vitro in rat kidney mitochondria. Biochem. Pharm. 1993, 45, 2017–2024. [Google Scholar] [CrossRef]
  110. Scaduto, R.C., Jr.; Fattone, V.H., II.; Grotyohann, L.W.; Wertz, J.; Martin, L.F. Effect of an altered glutathione content on renal ischemic injury. Am. J. Physiol. 1988, 255, F911–F921. [Google Scholar] [CrossRef]
  111. Feldkamp, T.; Kribben, A.; Weinberg, J.M. Assessment of mitochondrial membrane potential in proximal tubules after hypoxia-reoxygenation. Am. J. Physiol. 2005, 288, F1092–F1102. [Google Scholar] [CrossRef] [PubMed] [Green Version]
  112. Feldkamp, T.; Kribben, A.; Weinberg, J.M. F1FO-ATPase activity and ATP dependence of mitochondrial energization in proximal tubules after hypoxia/reoxygenation. J. Am. Soc. Nephrol. 2005, 16, 1742–1751. [Google Scholar] [CrossRef] [Green Version]
  113. Feldkamp, T.; Park, J.S.; Pasupulati, R.; Amora, D.; Roeser, N.F.; Venkatachalam, M.A.; Weinberg, J.M. Regulation of the mitochondrial permeability transition in kidney proximal tubules and its alteration during hypoxia-reoxygenation. Am. J. Physiol. 2009, 297, F1632–F1646. [Google Scholar] [CrossRef] [PubMed] [Green Version]
  114. Szeto, H.H.; Liu, S.; Soong, Y.; Birk, A.V. Improving mitochondrial bioenergetics under ischemic conditions increases warm ischemia tolerance in the kidney. Am. J. Physiol. Ren. Physiol. 2015, 308, F11–F21. [Google Scholar] [CrossRef] [PubMed] [Green Version]
  115. United States Renal Data System. USRDS Annual Data Report: Epidemiology of Kidney Disease in the United States; National Institutes of Health, National Institute of Diabetes and Digestive and Kidney Diseases: Bethesda, MD, USA, 2020. [Google Scholar]
  116. National Research Council. Biologic Markers in Urinary Toxicology; The National Academies Press: Washington, DC, USA, 1995. [Google Scholar] [CrossRef]
  117. Siwy, J.; Mischak, H. Novel biomarkers in chronic kidney disease. In Kidney Update: Biomarkers for Kidney Disease; Science/AAAS: Washington, DC, USA, 2019; pp. 4–8. [Google Scholar]
  118. FDA Biomarkers. List of Qualified Biomarkers. 2020. Available online: https://www.fda.gov/drugs/cder-biomarker-qualification-program/list-qualified-biomarkers (accessed on 25 February 2021).
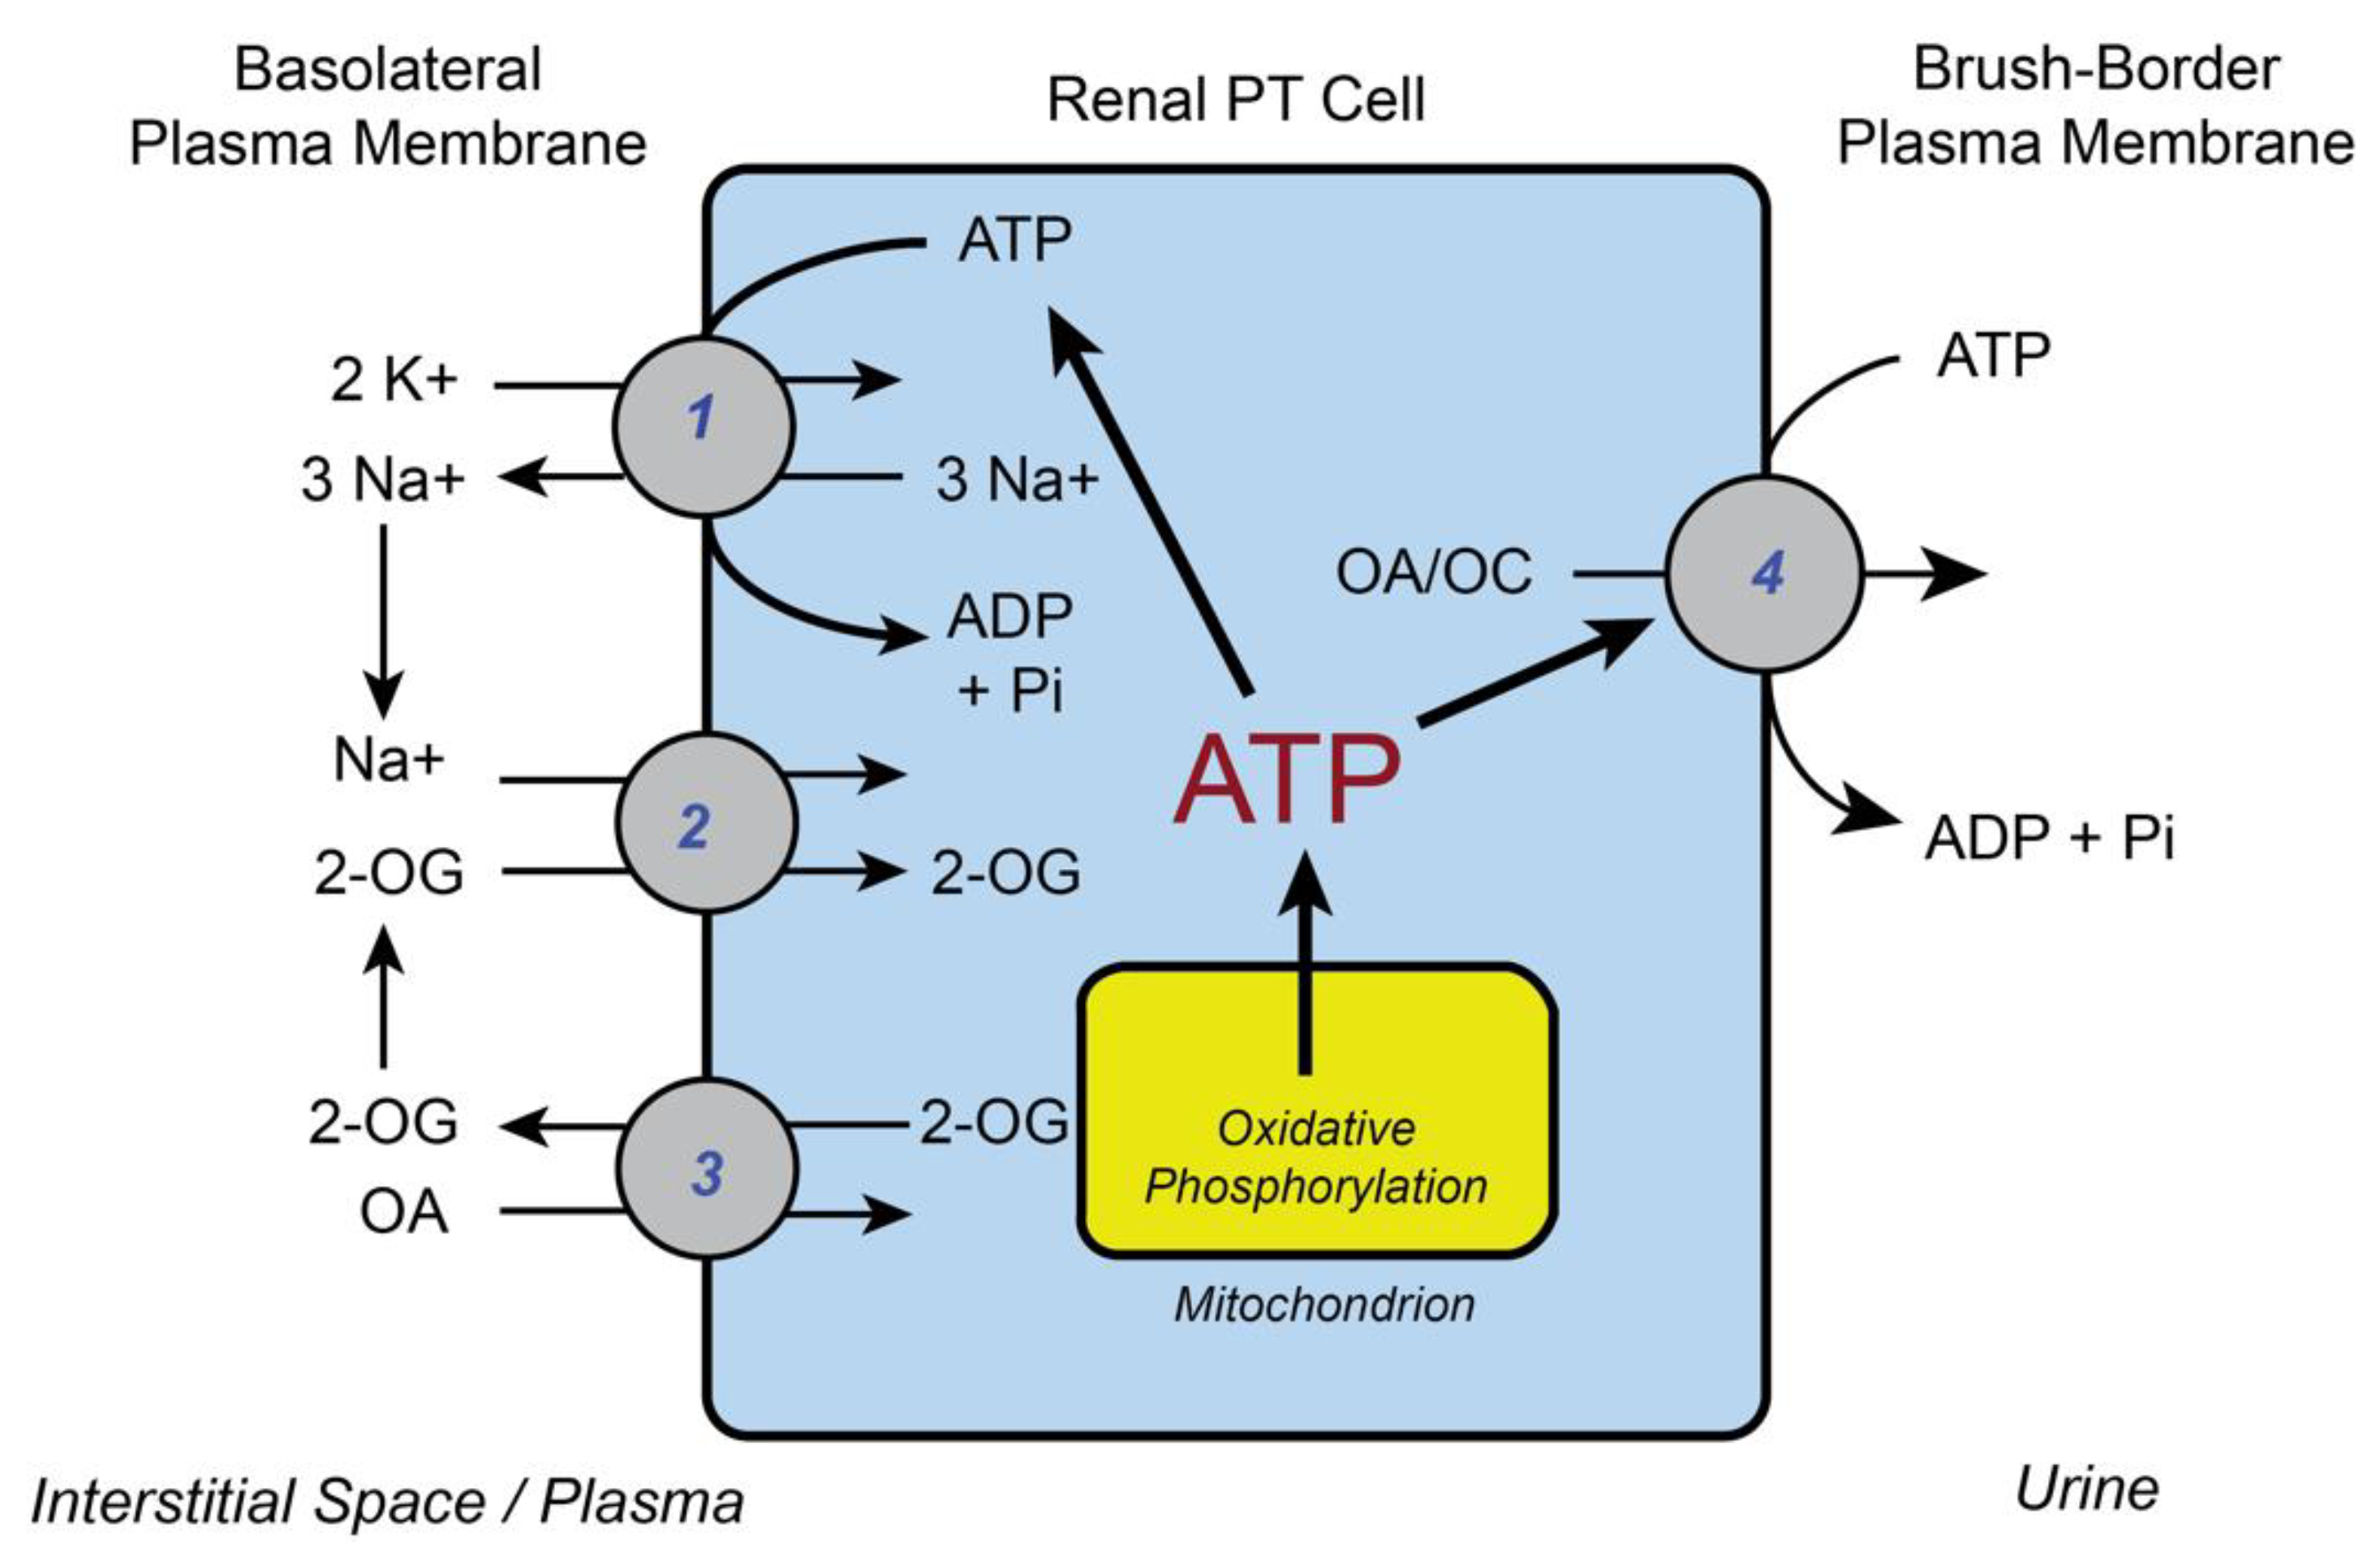
Figure 1. Generalized scheme showing coupling of various active transport processes in the renal proximal tubular (PT) cell to ATP levels and mitochondrial function. 1: (Na+ + K+)-stimulated ATPase; 2: sodium-dicarboxylate 3 cotransporter (NaC3; Slc13a3); 3: organic anion transporter 1 or 3 (Oat 1/3; Slc22a6/8); and 4: multidrug resistance-associated protein 2 or 4 (Mrp2/4; Abcc2/4) or P-glycoprotein (Mdr1; Abcb1). Abbreviations: OA: organic anion; OC: organic cation; 2-OG: 2-oxoglutarate; Pi: inorganic phosphate.
Ijms 22 04172 g001
Figure 2. Immunofluorescent staining for cytokeratins in renal PT cells from control and NPX rats on day 5 of primary culture. Freshly isolated PT cells from control (left) or NPX (right) rats were seeded at a density of 0.5–1.0 × 10⁶ cells/mL and allowed to grow for 5 days. Cells were then washed twice with sterile phosphate-buffered saline, and cytokeratin expression was visualized using a monoclonal fluorescein isothiocyanate-conjugated anti-mouse cytokeratin antibody. Note the enlarged size of many of the PT cells from the NPX rats relative to that of the PT cells from the control rats. Photomicrographs were taken at 100X magnification on a Zeiss confocal laser microscope. Bar = 5 mm. Adapted from [22].
Ijms 22 04172 g002
Figure 3. Summary scheme showing impact of compensatory renal hypertrophy (CRH) on renal PT cell mitochondrial function and redox status. The initial compensatory response to a loss in the number of functional nephrons leads to an increase in the glomerular filtration rate (GFR) and fractional sodium excretion (FeNa). These changes, in turn, activate the plasma membrane (Na+ + K+)-ATPase, which increases cellular ATP consumption. As a consequence, the mitochondrial respiration rate (QO2) increases. The persistence of these changes ultimately results in increased levels of reactive oxygen species (ROS), which impact mitochondrial redox status. Initially, compensatory increases are observed in antioxidants, such as glutathione (GSH). However, with continued hypermetabolism in the mitochondria, oxidant stress and increased cell injury occurs. + = stimulated; − = inhibited.
Ijms 22 04172 g003
Figure 4. Involvement of mitochondrial metabolism and redox processes in the post-translational regulation of mitochondrial proteins and enzymes. The scheme illustrates the involvement of redox processes (acting through NADPH/NADP+) and metabolic processes to produce several types of protein modifications that can alter protein structure and/or function. Abbreviations: S-AdMet: S-adenosylmethionine; NO: nitric oxide. Adapted from [29].
Ijms 22 04172 g004
Figure 5. Transport of GSH into renal mitochondria via the dicarboxylate carrier (DIC) and the 2-oxoglutarate carrier (OGC). The scheme illustrates the function of two key inner membrane anion exchange carriers in the movement of GSH from the cytoplasm into the mitochondrial matrix. The DIC catalyzes electroneutral exchange of inorganic phosphate (Pi2−) with various organic anions such as malate. The OGC catalyzes the electroneutral exchange of 2-oxoglutarate (2-OG2–) with other dicarboxylates such as malate. The GSH molecule is a zwitterion containing a free amino group (positive at physiological pH), two free carboxyl groups (negative at physiological pH), and a sulfhydryl or thiol group (-SH or -S). The last group has a pKa of 8.3, so it is extensively deprotonated at the modestly alkaline pH of the mitochondrial matrix. In this manner, GSH is primarily transported as a dianion in electroneutral exchange for either Pi2– or 2-OG2–.
Ijms 22 04172 g005
Figure 6. Pathways of plasma membrane and mitochondrial GSH transport in the renal PT cell. The scheme shows the major membrane carriers for GSH on the mitochondrial inner membrane and on the basolateral membrane (BLM) and the brush-border membrane (BBM). The integration of these carriers with a supply of 2-oxoglutarate and a supply of ATP and Na+ ion gradients is highlighted with dashed lines. A critical role for mitochondrial energetics, which supplies the PT cell with ATP via the tricarboxylic acid (TCA) cycle and oxidative phosphorylation (OXPHOS), is also evident. Processes and their functions: (1) Organic anion transporter 1 or 3 (Oat1/3; Slc22a6/8): transports GSH in exchange for 2-OG at the BLM; (2) sodium-dicarboxylate carrier (NaC3; Slc13a3): transports 2-OG in exchange for 2 Na+ ions at the BLM and provides 2-OG for Oat1/3; (3) (Na+ + K+)-ATPase: establishes Na+ and K+ ion gradients across the BLM and provides Na+ as a driving force for many Na+-coupled transporters; (4) 2-oxoglutarate carrier (OGC; Slc25a11): transports GSH in exchange for 2-OG across the mitochondrial inner membrane; (5) dicarboxylate carrier (DIC; Slc25a10): transports either 2-OG or GSH in exchange for inorganic phosphate (Pi) across the mitochondrial inner membrane; (6) organic anion transporting polypeptide 1a1 (Oatp1a1; Slco1a1): transports GSH across the BBM and into the tubular lumen in exchange for various organic anions (OA); (7) multidrug resistance protein 2/4 (Mrp2/4; Abcc2/4): primary active transporters (ATP-dependent) that catalyze efflux of GSH across the BBM and into the tubular lumen; (8) γ-glutamyltransferase (GGT): enzyme on BBM that cleave the γ-glutamyl residue from GSH; (9) cysteinylglycine dipeptidase (DP): enzyme on BBM that cleaves L-Cys-Gly into constituent amino acids.
Ijms 22 04172 g006
Figure 7. Impact of genetic modulation of mtGSH transporter expression in NRK-52E cells on mtGSH uptake and apoptosis caused by two mitochondrial toxicants. The cDNA for the rat kidney DIC was transiently overexpressed in NRK-52E cells (NRK-DIC = cell type 2), and the cDNA for either the normal OGC (NRK-OGC = cell type 3) and that of a double-cysteine mutant OGC with ~20% of normal activity (NRK-OGC-C221,224S = cell type 4) were stably expressed. Responses were compared to those of wild-type NRK-52E cells (=cell type 1). (A) Initial uptake rates for mtGSH. Mitochondria were isolated from each cell population and were incubated with [3H]-GSH (final concentration = 5 mM). Data are means ± SD of initial uptake rates from 3–5 separate experiments. (B) Percent of apoptotic cells. The four different cell populations were incubated for 4 hr with a normal cell culture medium (=control), 10 µM tBH, or 50 µM DCVC. The percentage of cells undergoing apoptosis (sub-G1 fraction) was estimated by propidium iodide staining, flow cytometry, and fluorescence-activated cell sorter (FACS) analysis. Results are means ± SD of 4–5 separate experiments. While the data were derived from previously published primary studies [53,54], the combined summary figure was adapted and modified from a previous review paper [35].
Ijms 22 04172 g007
Figure 8. Interorgan metabolism of nephrotoxic GSH and cysteine S-conjugates. The scheme emphasizes the roles of initial GSH conjugation, which primarily occurs in the liver, and interorgan transport pathways that deliver either the GSH S-conjugate or the cysteine S-conjugate to the kidneys, which rapidly transport these conjugates into the PT cell, where the cysteine S-conjugate can be bioactivated by the cysteine conjugate beta-lyase (CCBL) within mitochondria to produce a reactive thiolate or related metabolites (e.g., [R-S]) that cause toxicity.
Ijms 22 04172 g008
Figure 9. A systems biology approach to redox regulation. The three primary components of the system are subcellular compartments and the extracellular space, several redox regulatory systems, and redox modulators or signaling molecules. Within specific compartments, changes in activities of redox regulatory systems lead to changes in the concentrations of redox modulators. These, in turn, alter the redox state of protein-cysteinyl residues, which, in turn, impact function in the different cellular or subcellular compartments. Abbreviations: GSH: reduced glutathione; NO: nitric oxide; ROOH: organic peroxide; Trx: thioredoxin; TrxR: thioredoxin reductase.
Ijms 22 04172 g009
Figure 10. Two mitochondrial proteins identified in culture media of human proximal tubular (hPT) cells exposure to S-(1,2-dichlorovinyl)-L-cysteine (DCVC) (10, 100, or 250 µM) for 4 or 24 h. Primary cultures of hPT cells were incubated with either a culture medium (=control) or DCVC, and samples from the extracellular fluid were analyzed using TMTTM multiplexing and LC–MS/MS analysis, as described in the legend of Table 3. Results are shown as expression levels relative to that in the 4-h control samples and are from a single set of analyses.
Ijms 22 04172 g010
Table 1. Summary of selected proteomics data of mitochondria from control and NPX rat kidneys using iTRAQTM labeling and liquid chromatography/mass spectrometry/mass spectrometry (LC/MS/MS) analysis. Results are the ratios of protein abundance relative to a control and are means ± SD of 5 sample LC/MS/MS runs. Fold changes in ratios of NPX: control ≥ 1.50 are highlighted in bold.
Accession No.Classification/ProteinNPX/Control (Mean ± SD)
ATP Synthesis, Transport and Metabolic Processes
P15999Atp5a1 ATP synthase F1 subunit alpha precursor, mitochondrial1.91 ± 0.05
P10719Atp5b ATP synthase F1 subunit beta precursor, mitochondrial1.33 ± 0.71
P05141ADP/ATP translocase 2, Slc25a41.03 ± 0.36
Tricarboxylic Acid Cycle (Citrate Cycle)
P56574Isocitrate dehydrogenase (NADP) (oxalosuccinate decarboxylase)1.88 ± 0.56
Q9ER34Aconitate hydratase (aconitase)2.54 ± 0.32
Respiratory Electron Transport Chain
P13803Electron transfer flavoprotein subunit alpha1.00 ± 0.11
Q66HF1NADH-ubiquinone oxidoreductase 75 kDa subunit1.90 ± 0.20
Amino Acid and Fatty Acid Metabolic Pathways
P50442Glycine amidotransferase (transamidinase)1.92 ± 0.15
Q64565Alanine-glyoxylate aminotransferase 2 (beta-alanine-pyruvate aminotransferase)2.13 ± 0.15
Q02253Methylmalonate-semialdehyde dehydrogenase (malonate-semialdehyde dehydrogenase)1.32 ± 0.31
P08503Medium-chain specific acyl-CoA dehydrogenase2.62 ± 0.35
Q64428Trifunctional enzyme subunit alpha (3-hydroxyacyl-CoA dehydrogenase)0.70 ± 0.22
P10860Glutamate dehydrogenase 11.94 ± 0.41
Anion Transport (Transmembrane Transport)
Q9Z2L0Voltage-dependent anion-selective channel protein 1 (VDAC-1)1.12 ± 0.08
Oxidoreductase Activity
Q6AYT0Quinone oxidoreductase (zeta-crystallin)1.21 ± 0.23
Q07523Hydroxyacid oxidase 21.47 ± 0.74
Q68FT3Pyridine nucleotide-disulfide oxidoreductase domain-containing protein 21.92 ± 0.22
Table 2. Selective list of chemicals and drugs whose nephrotoxicity is associated with mitochondrial dysfunction.
Chemical/Drug or Pathological StateClassificationReferences
DCVCCysteine conjugate of environmental pollutant trichloroethylene[54,62,63,69,70,72,73,74,78]
PCBCCysteine conjugate of occupational contaminant hexachloro-butadiene[76,77]
Bromohydroquinone and its cysteine conjugateCysteine conjugate of chemical synthetic intermediate bromohydroquinone[91,92]
CephalosporinsAntibiotics[93,94]
GentamicinAntibiotic[95,96,97]
TenofovirAntiviral[98,99,100,101,102]
CisplatinChemotherapeutic agent[103,104,105,106,107]
OxalateMetabolite[108]
HgCl2Environmental contaminant[109]
Hypoxia/ischemiaPathological states of oxygen deprivation with or without blood flow disruption[110,111,112,113,114]
Abbreviations: DCVC: S-(1,2-dichlorovinyl)-L-cysteine; PCBC: pentachlorobutadienyl-L-cysteine.
Table 3. Distribution of proteins in subcellular compartments from culture media of human proximal tubular (hPT) cells incubated with S-(1,2-dichlorovinyl)-L-cysteine (DCVC). Data are shown for primary cultures of hPT cells incubated with 250 µM DCVC for 24 h. A portion of each sample of extracellular medium was reduced with dithiothreitol, alkylated with iodoacetamide, and digested overnight with trypsin. Samples were then labeled with a unique isobaric TMPTM reporter tag. Multiplexed samples were analyzed using a Q Exactive Orbitrap mass spectrometer (Thermo Fisher Scientific). Abundant species were fragmented in high-energy collision dissociation mode. Data were analyzed using Proteome Discover version 1.4.0.288 (Thermo) and Scaffold Q+ version 4.1.1 (Proteome Software), which incorporate the Sequest, X! Tandem, and ProteinProphet algorithms. The SwissProt_2013_04 database with 20,253 entries was used.
Subcellular Compartment# Proteins Identified% Total
Mitochondria11843.2
Cytosol3011.0
Vesicles217.7
Soluble186.6
Vacuoles134.8
Lysosomes124.4
Melanosomes124.4
Cell Surface114.0
Microsomes93.3
Nucleoid93.3
Vesicular93.3
Outer membrane62.2
Peroxisomes51.8
Publisher’s Note: MDPI stays neutral with regard to jurisdictional claims in published maps and institutional affiliations.