Abstract
Water quality in the Dawu water source area is primarily studied through the traditional water quality assessment method that measures the chemical parameters of water against the existing standards, which is simple but cannot accurately describe the water quality. Although the water quality index (WQI) proposed by Horton is widely used for comprehensive water quality evaluation, parameter selection and weight determination are primarily based on the Delphi method, which is subjective and random. Moreover, in groundwater evaluation, the focus is primarily laid on general chemical parameters, such as Total Dissolved Solids, hydrogen ion concentration, Electrical Conductivity, and heavy metals, such as Hydrargyrum, Arsenic, and Chromium, with limited consideration for organic pollutants. In this study, WQI technology in combination with the entropy weight method was used to evaluate the groundwater environmental quality of the Dawu water source area, and the scientific results were analyzed by comparing the full index, Delphi, and multivariate statistical analysis methods. The results showed that the groundwater in the Dawu water source area generally had good quality and was potable and that the application of multivariate statistical analysis method was more suitable than the Delphi method in the index selection process.
1. Introduction
Groundwater is an important component of water resources and acts as a large natural “reservoir” that supplies water even in conditions of low surface water availability (i.e., dry season or interannual periods of prolonged drought). Using the WaterGAP Global Hydrology Model, global groundwater recharge was estimated at 12,666 km3/a during 1961–1990 under normal climate conditions, accounting for 32% of the total renewable water resources [1]. In 2017, China’s total groundwater resources accounted for 28.89% of its total water resources, and groundwater supply accounted for 16.82% of its total water supply. However, groundwater pollution is a serious problem in China [2]. In 2019, among the 10,168 state-level groundwater quality monitoring sites in China, 14.4% were classified as category 1 to 3, 66.9% as category 4, and 18.8% as category 5. The above standard indices were based on Mn, Total hardness (TH), I, Total Dissolved Solids (TDS), Ferrum (Fe), Fluoride ion(F−), Ammonia nitrogen (NH4+–N), Sodium ion (Na+), Sulfate ion (SO42−), and Chloride ion (Cl−) [3]. On the basis of the groundwater quality standards, groundwaters of categories 4 and 5 are not safe for drinking without treatment.
The Dawu water source area is located in the groundwater gathering area of the Dawu hydrogeological unit, covering approximately 148 km2. It is an important water source for sustaining the livelihood of approximately one million people and the industrial and agricultural development of Zibo City [4]. As the only super-large karst water source in Shandong Province, Central China, and a rare super-large karst water source in North China, its groundwater has been intensely exploited. Conforming to the survey report of Shandong Geological Survey Institute in 2018, the maximum exploitation has been 504,500 m3/d since the large-scale centralized development in the middle and late 1970s. During groundwater exploitation, a series of problems, such as groundwater environmental pollution by petroleum processing enterprises, have gained the attention of relevant local departments. In recent years, researchers have analyzed the quality of groundwater in the Dawu water source area and found that the rate of organic pollutants exceeded the standards by 13.89%, indicating serious organic pollution.
The quality of groundwater affects human activities and health; therefore, it is necessary to scientifically evaluate the quality of groundwater. The traditional method of evaluating water quality by measuring its chemical parameters and comparing these with the existing standards is simple but cannot accurately describe the water quality [5]. Horton defined the water quality index (WQI) according to the weighted relative importance of eight water quality parameters [6,7,8,9,10,11,12,13]. Brown et al. has given the steps of the Weight Arithmetic Water Quality Index (WAWQI) [14]. An improved version of National Sanitation Foundation water quality index (Hereinafter referred to as “NSFWQI”) was proposed by Brown et al. (1973) with the support of the National Sanitation Foundation (NSF) in the United States, wherein parameter selection was based on the Delphi technology by RAND Corporation [15,16,17]. In Canada, British Columbia introduced a new Water Quality Index in the mid-1990s as British Columbia Water Quality Index (BCWQI), and the Water Quality Guidelines Working Group of the Council of Canadian Ministers of the Environment (CCME), recognizing the need to assess the suitability of water for different uses, revised the index in 2001 to become known as the Canadian Council of Ministers of the Environment Water Quality Index (CCME WQI) [17]. The groundwater quality index (GWQI) for groundwater quality was first derived by Backman et al. in 1998 [17,18]. Subsequently, researchers have globally developed and used WQI technology, but the parameter selection and weight determination were primarily conducted using the Delphi method, which is subjective and random; the use of statistical multivariate analysis technology has been limited [17]. Mahapatra et al. proposed a groundwater quality classification method by measuring the Euclidean distance matrix as an input to Q-mode principal component analysis (PCA) [19]. Fathy et al. evaluated the water quality of three sites along the Alexandria coast in Egypt using principal component analysis (PCA) approach to develop water quality index [20]. In Yotova’s study, a new method combining water quality index (WQI) and self-organizing map (SOM) was proposed to evaluate surface water quality in a specific watershed [21]. In the research on the application of multivariate statistical analysis technology, the scientific application of principal component analysis (PCA) and other methods using the WQI, as well as a comparative study with that of the Delphi method, are lacking. In groundwater evaluation, the focus is primarily laid on general chemical parameters, such as Total Dissolved Solids (TDS), hydrogen ion concentration(pH), Electrical Conductivity (EC), and heavy metals such as Hydrargyrum (Hg), Arsenic (As), and Chromium (Cr), with limited consideration for organic pollutants [18]. Previous studies on the application of WQI technology in groundwater quality analysis in China are few, and the application of groundwater environmental quality assessment in the Dawu water source area has not yet been reported.
In this study, the full index method, Delphi method, principal component analysis (PCA) approach combined with entropy weight assignment method were adopted to develop WQI technology; the groundwater environment quality of Dawu water source area was evaluated, and the results were compared; the scientific basis of the multivariate statistical analysis method in the process of index selection was verified, and the groundwater pollution situation of the Dawu water source area was analyzed to provide a theoretical basis for sustainable development of the area.
2. Materials and Methods
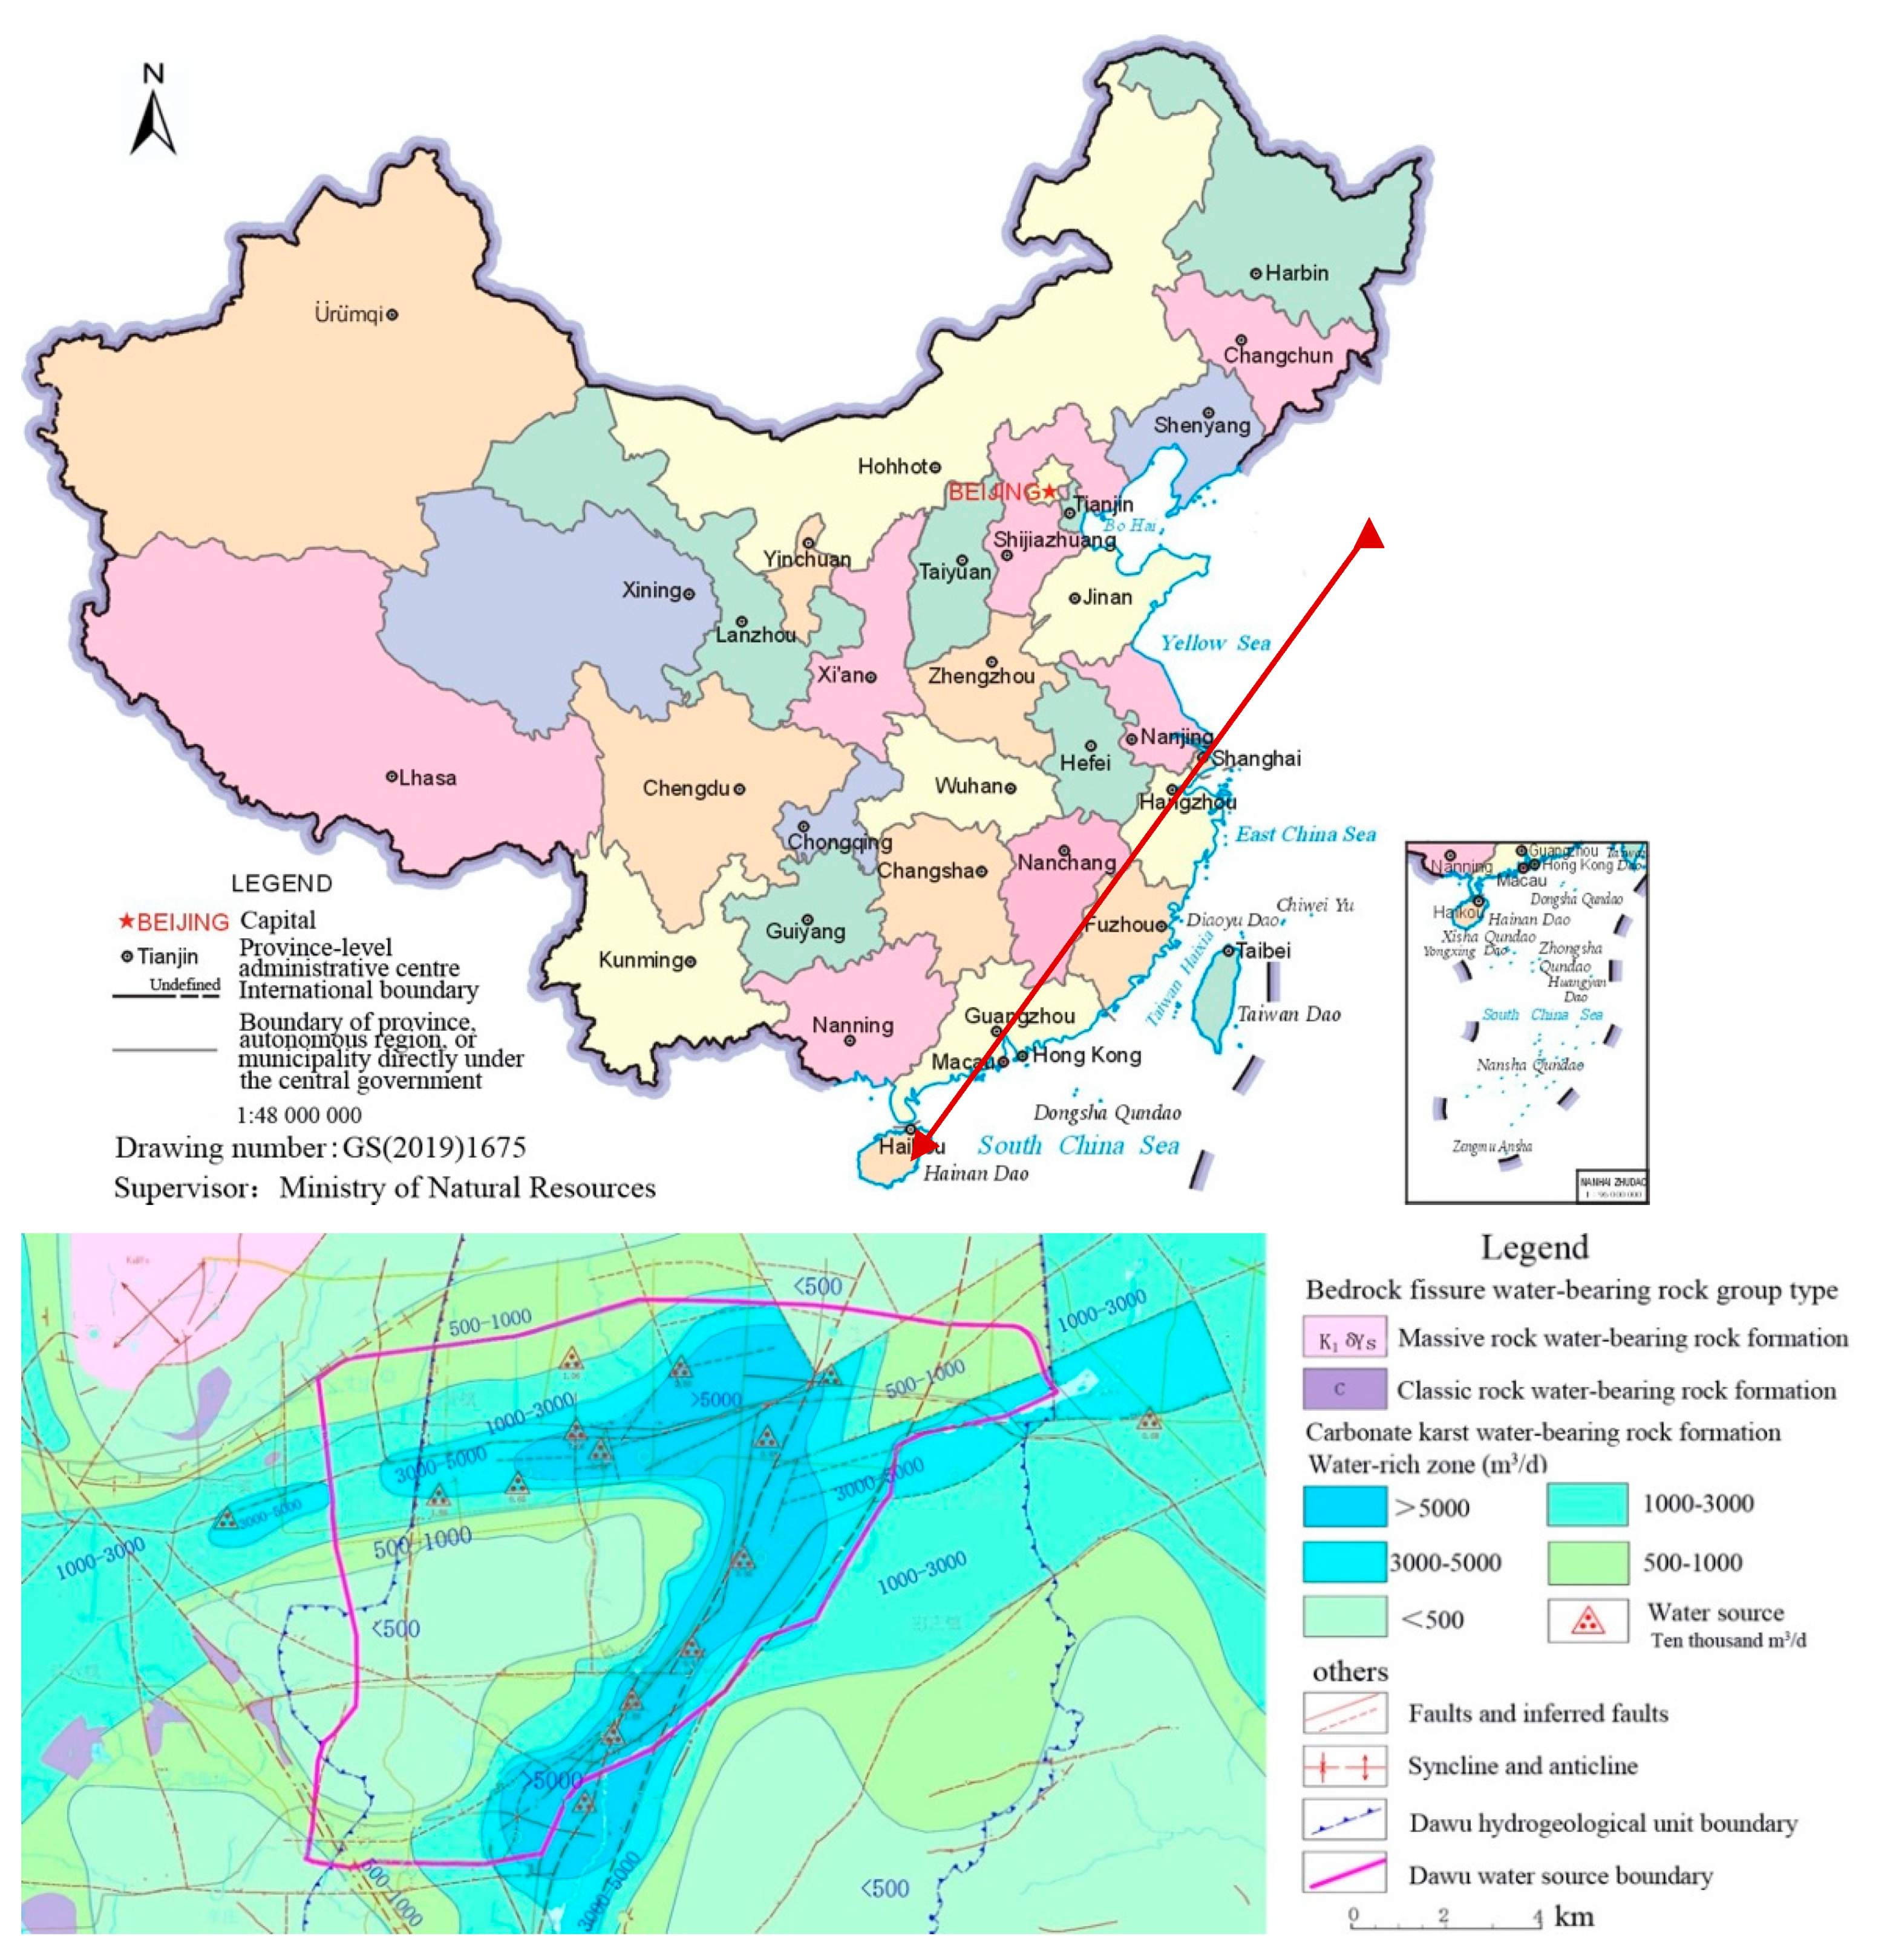
The Dawu water source area is located at 36°30′31′′–36°51′12′′ N, 118°02′16′′–118°26′55′′ E, Linzi District, Zibo City, Shandong Province, China. It includes a part of Fengshui Town in Zhangdian District in the west, parts of the northeastern towns in Zichuan District in the south, and the western part of Qingzhou District in Weifang City in the east. The terrain slope gradually decreases from the south of the low hills to the northern piedmont slope plain. Figure 1 shows the location of the Dawu water source area.
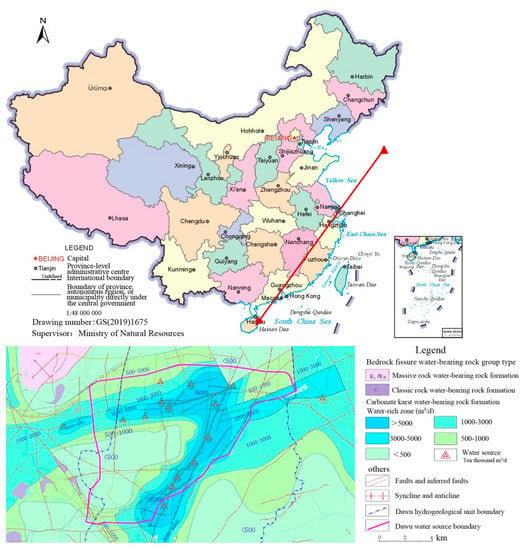
Figure 1.
Map of the study area.
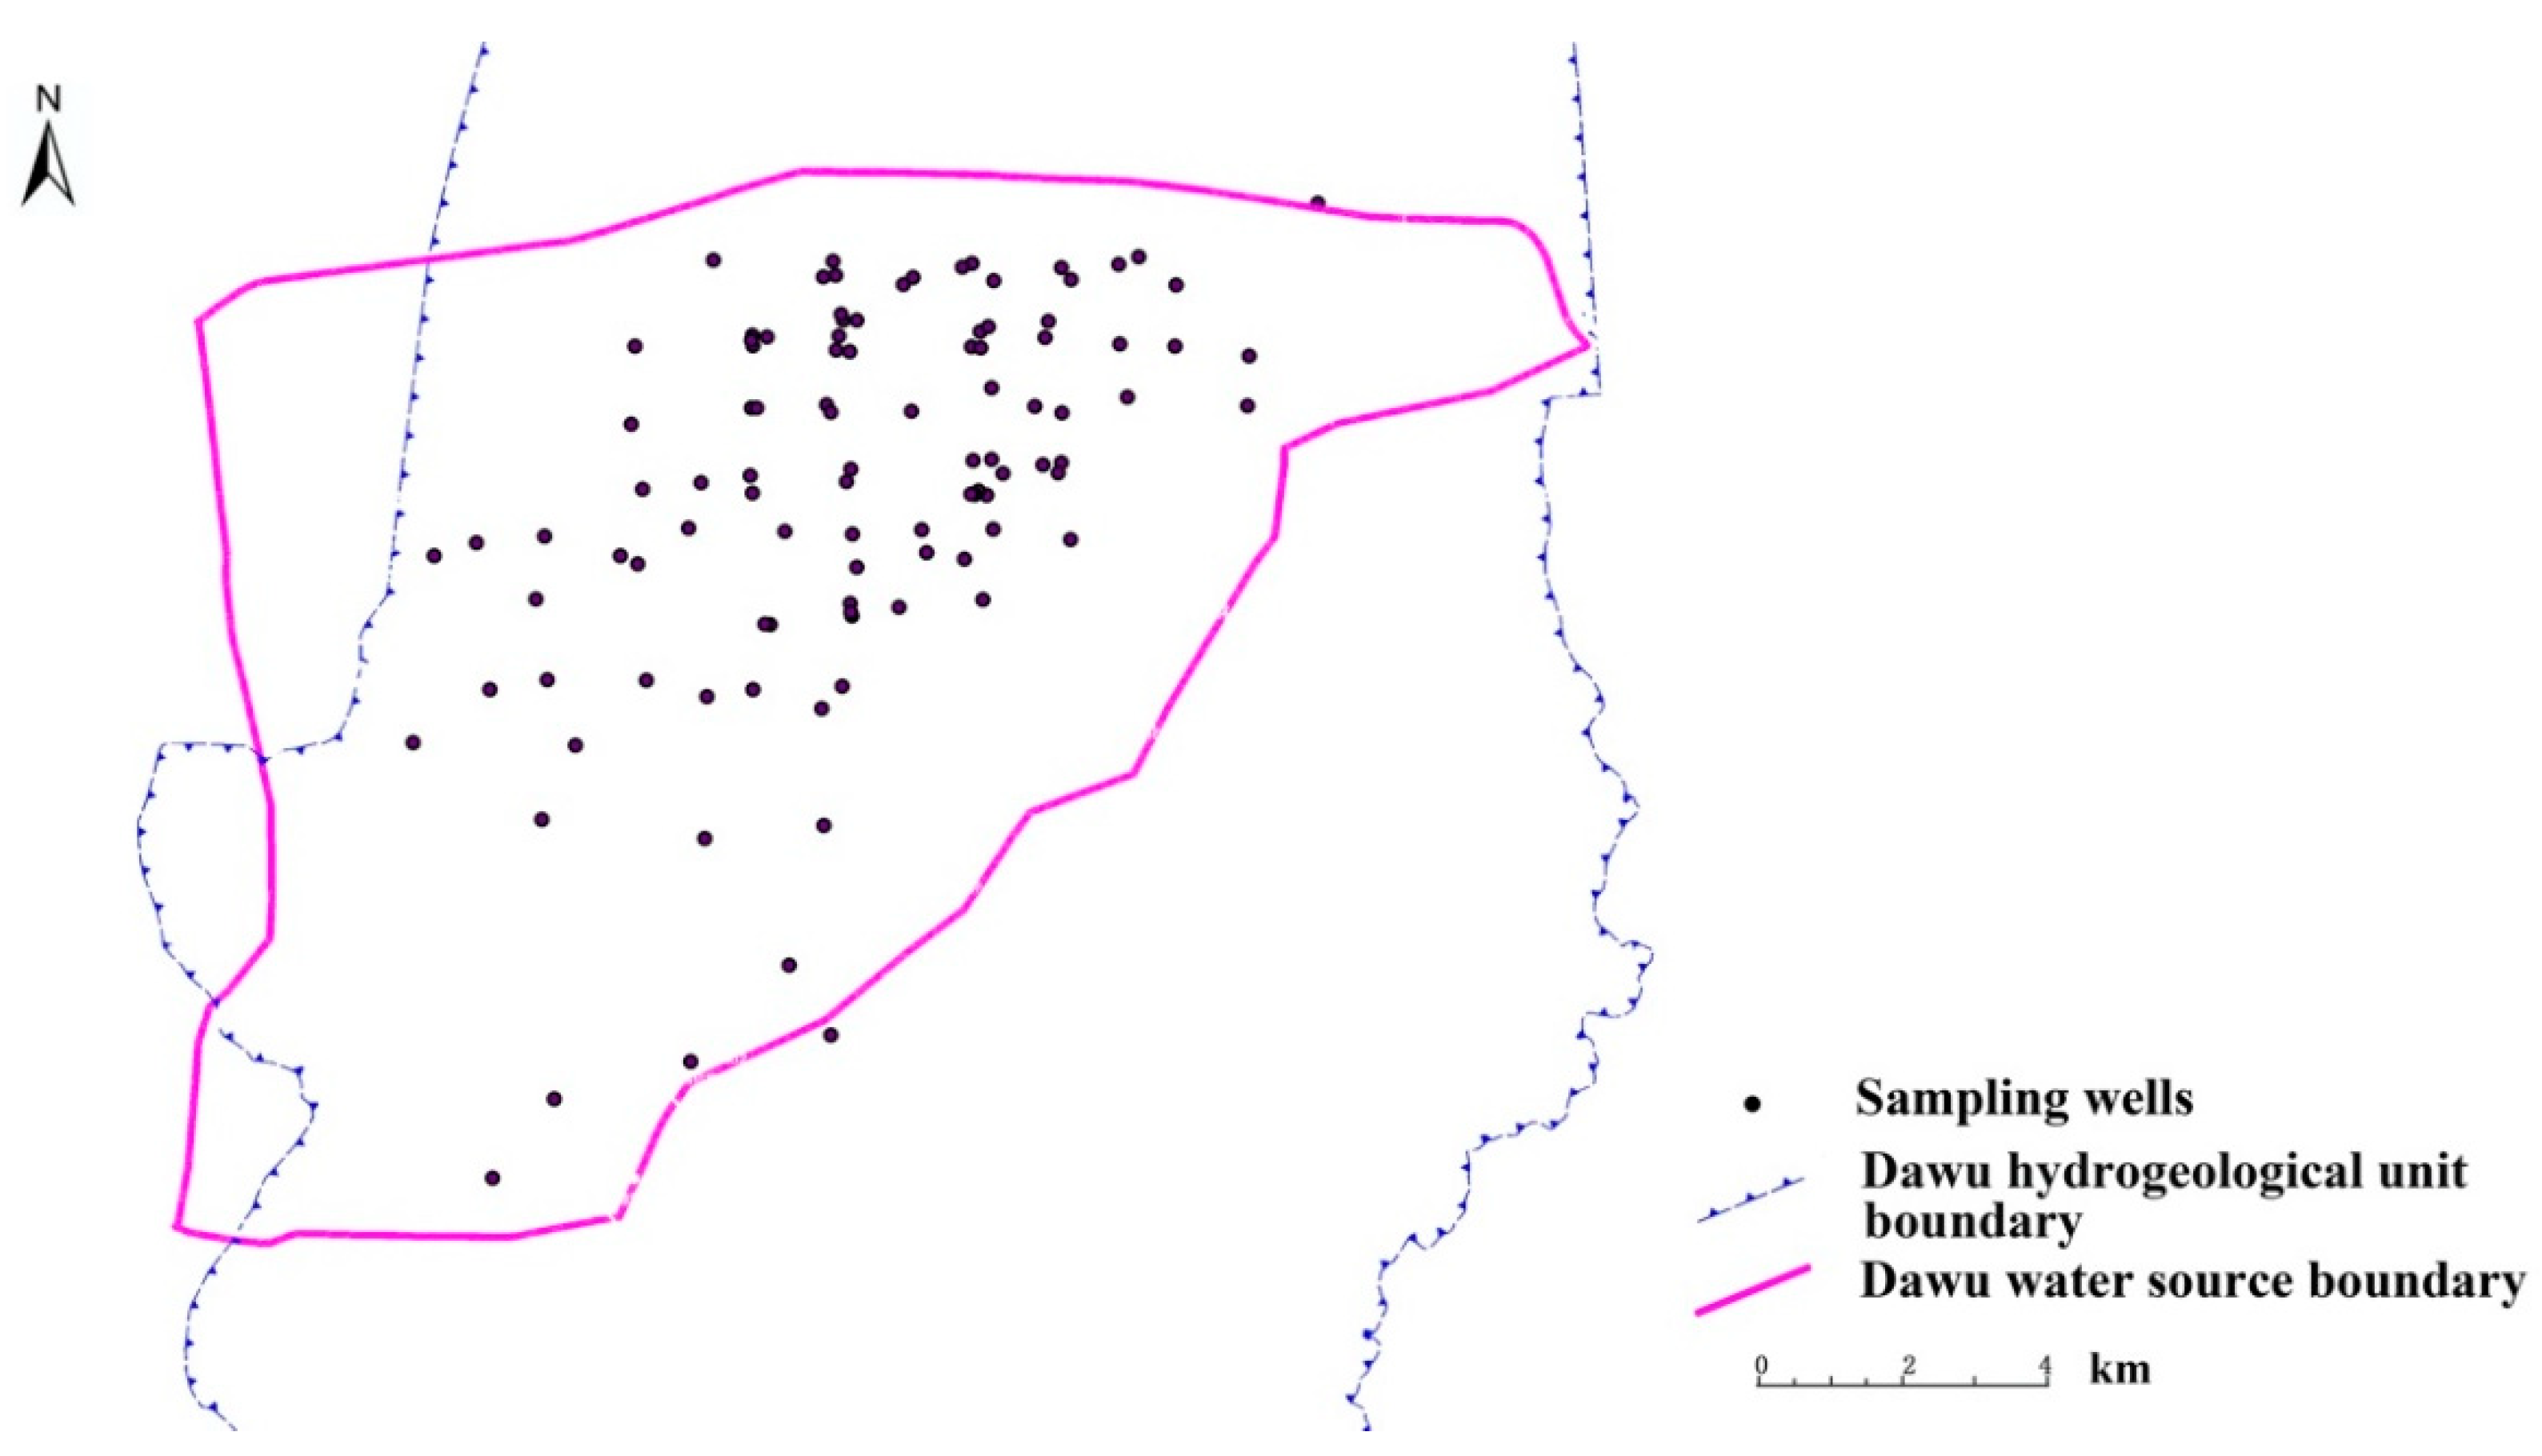
This study was based on the 3D visualization information system construction of the water source of Zibo City from October 2017 to January 2018; 101 samples were collected with a sampling depth of 150–520 m. There were 122 detection indices, including the general chemical indices, such as metal ions, pH, and total hardness, and toxicology indices, such as nitrite, nitrate, heavy metals, organic pollutants, and pesticides. The sampling points were mining wells or pressure wells that often supply water, and the water was pumped for more than 10 mins before collection to ensure that the water samples obtained can reflect the real conditions of groundwater in the sampling points. Samples were collected in brown sampling bottles, which were pickled and washed with distilled water before sampling and washed with fresh water at least three times during sampling, and pH was measured on-site. After sampling, the container was immediately stoppered to avoid air gap, and the sample was promptly sent for analysis. Organic matter was detected in consonance with Standard examination methods for drinking water (GB/T5750) [22], primarily using Agilent6890N gas chromatograph (United States) and TU1810 UV-visible spectrophotometer (China). Groundwater samples were primarily karst water, which also accounted for pore water. In a preliminary analysis of the index data, none of the 37 pesticides were detected; eventually, the 33 organic compounds, such as dibromomethane, bromodichloromethane, and 1,2-dibromoethane, were also not detected. At the same time, referring to Standards for groundwater quality (GT14848-2017) [23], Standards for drinking water quality (GB5749-2006) [24], The European Union Water Framework Directive (hereafter referred to as the “WFD”) in 2000 [25] and the World Health Organization (WHO) Guidelines for drinking-water quality (the fourth edition) in July 2011 [26], the similar index and other indices not included in the scope of standards and guidelines were removed. Finally, 38 indices were determined as within the scope of this study. If the detected concentration was below the detection limit, it was set as the standard detection concentration for evaluation. Figure 2 shows the distribution of the sampling Wells.
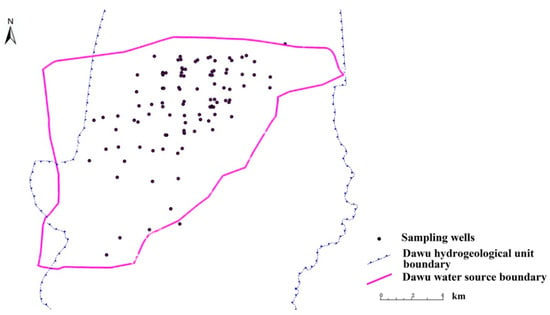
Figure 2.
Map of the Dawu water source boundary with the locations of the sampling wells.
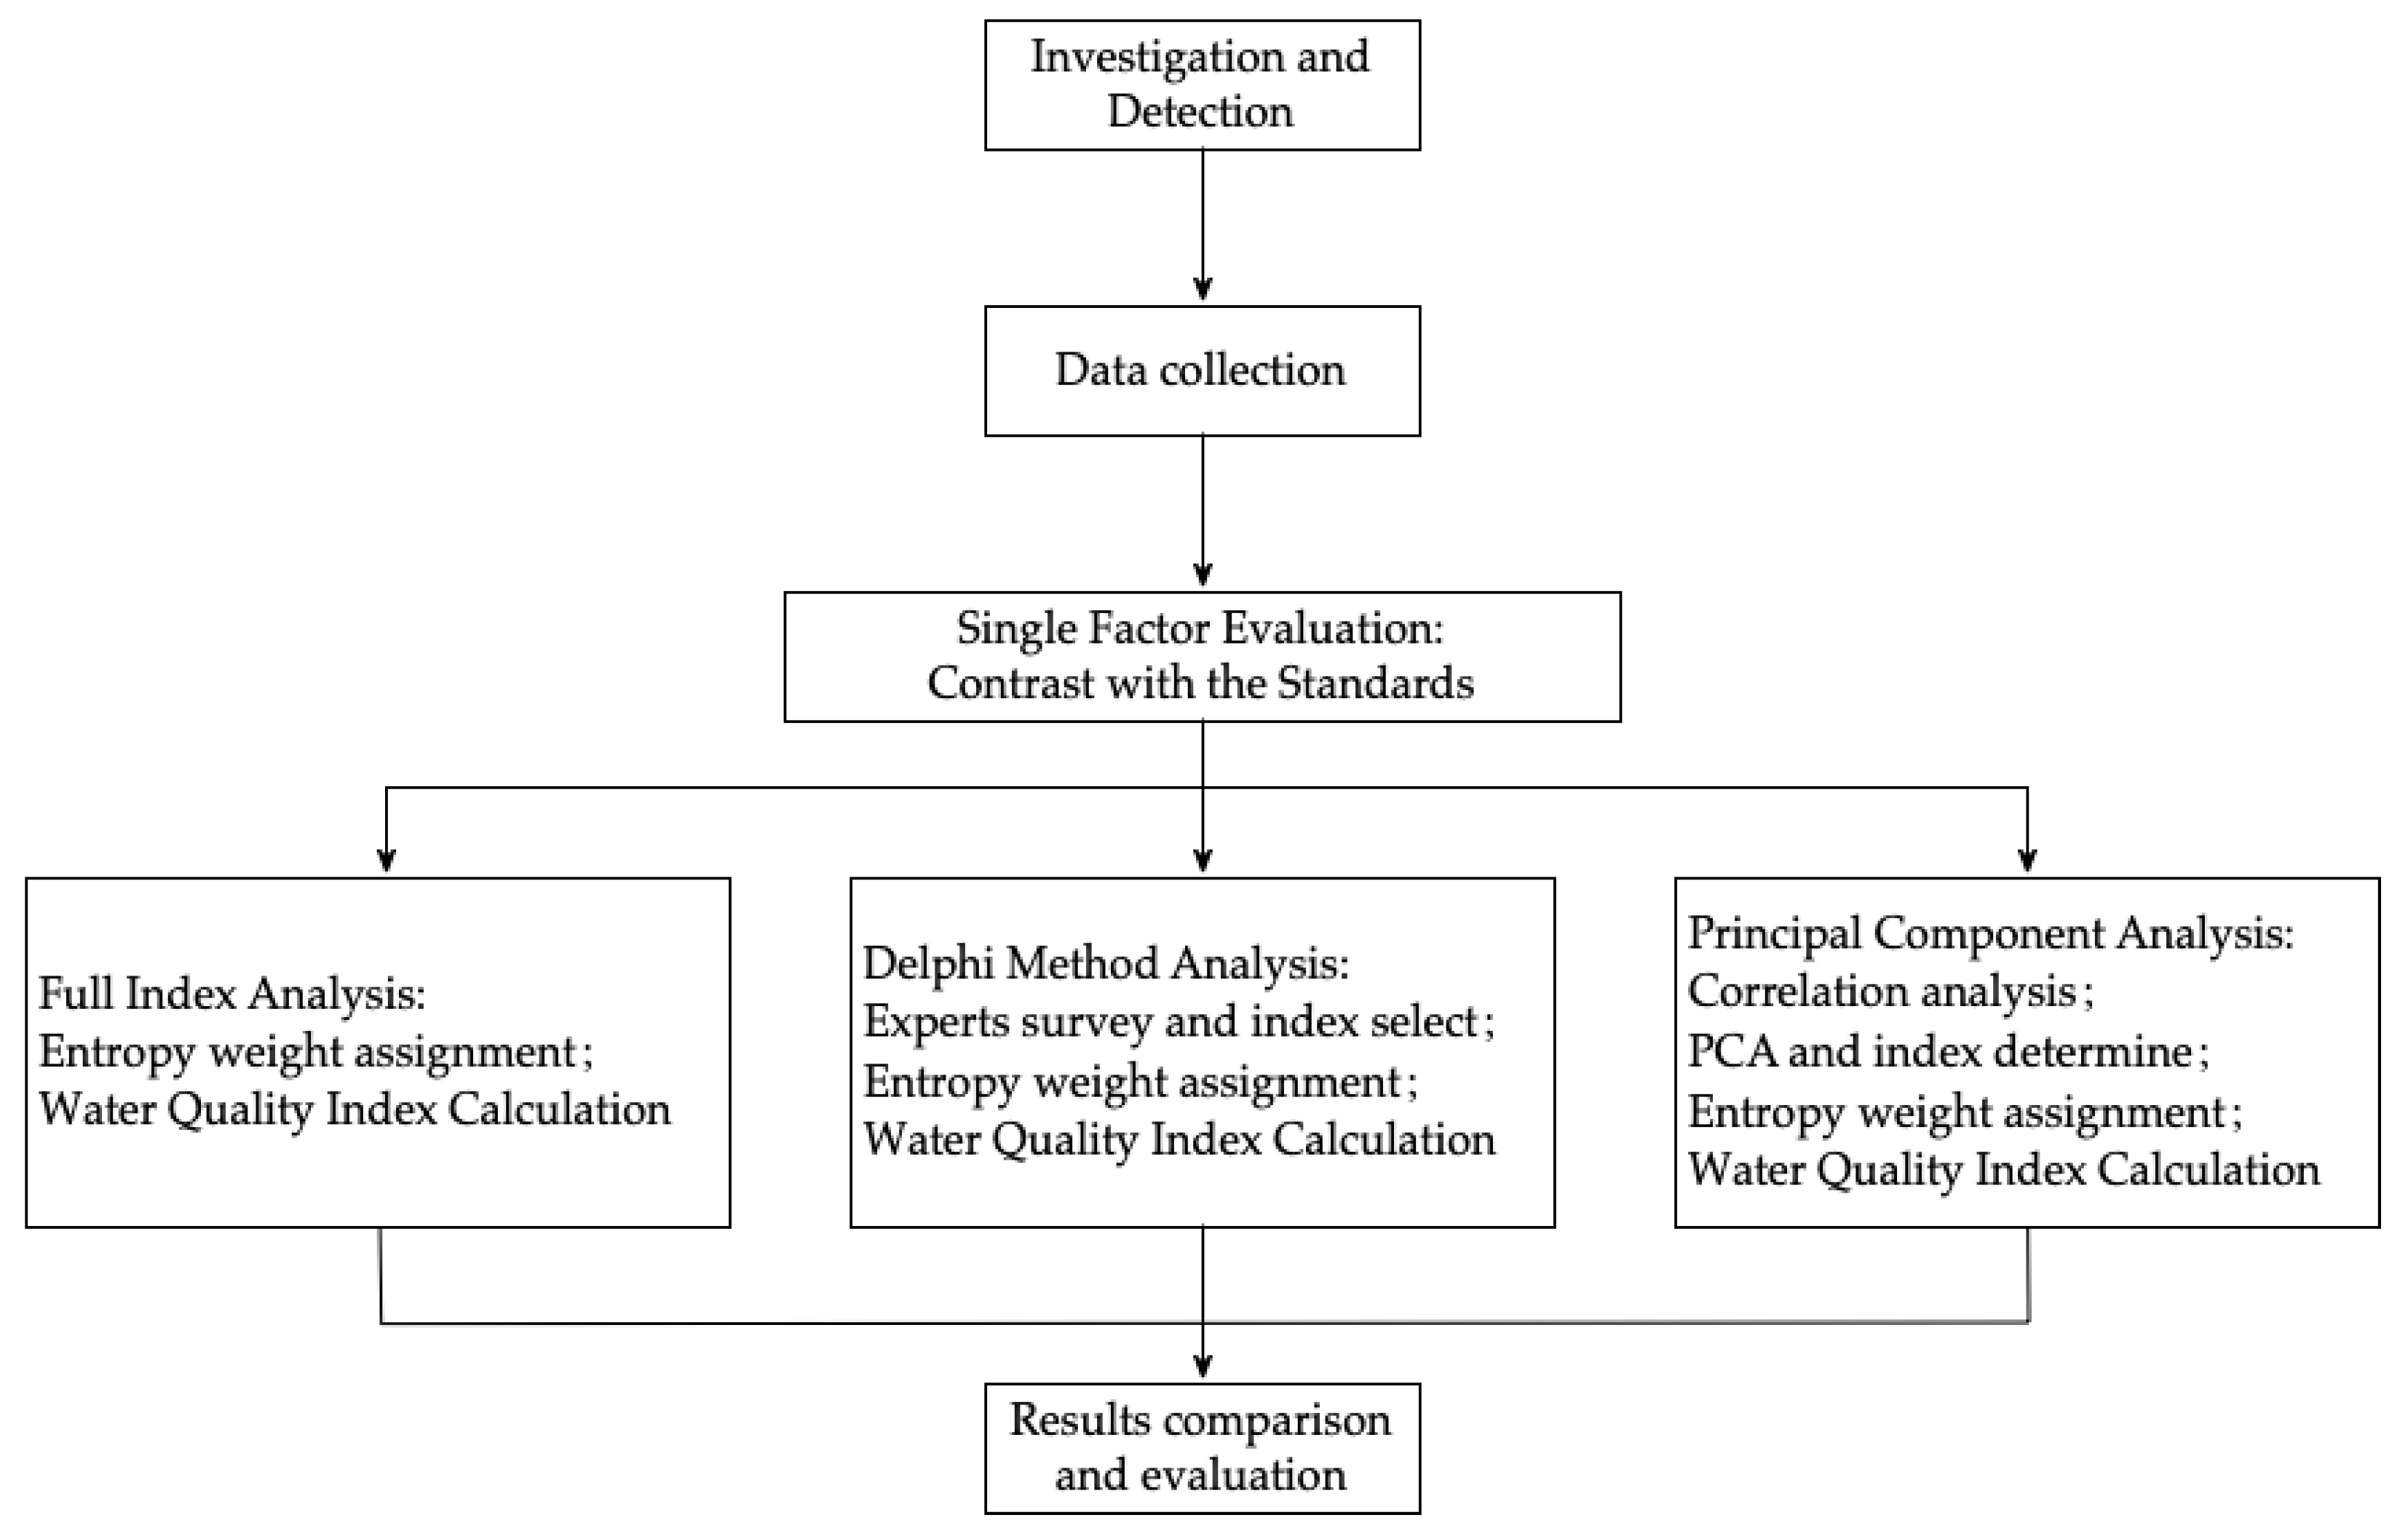
In this study, the full index method, Delphi method, and PCA were adopted to evaluate the groundwater quality of the Dawu water source area. The research process is shown in the Figure 3 below.
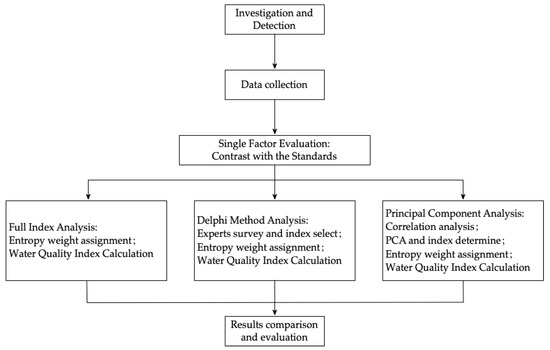
Figure 3.
The block diagram of this research.
The Delphi method, also known as the expert survey method, was initiated and implemented by Dalkey and Helmer for RAND Corporation in 1946 [27]. It is primarily a feedback and anonymous consultation method; the general process is to collect opinions of experts on the problems to be predicted; then organize, statistically summarize, and give anonymous feedback to experts; then solicit opinions again, analyze and give feedback again, until a consistent opinion is obtained [28,29]. The Delphi method is a qualitative research method that can anonymously accept a large number of individual opinions from different sources and professional fields. Participants are allowed to openly provide criticism, which can thereby minimize social pressure or the influence of experts [27,30]. The standard Delphi method has five primary characteristics: the use of experts, anonymity, controlled feedback, multi-stage iteration, and the search for consensus through the statistical aggregation of group responses [31].
Multivariate statistical analysis was developed from classical statistics. It is a comprehensive analysis method that can analyze the statistical law of multiple objects and multiple indices under the condition that they are interrelated. Multivariate statistical techniques have been widely used in water quality data analysis [32,33,34,35,36,37]. These tools help simplify and organize large datasets to explain the observed relationships between several variables [38]. In this study, correlation analysis, PCA, and principal factor analysis (PFA) were used to select evaluation index parameters, and IBM SPSS Statistics 26 software (United States) was used for data visualization. Each water quality parameter contained important water quality information, and there may be different degrees of correlation between the parameters. Through comprehensive analysis of these correlations, we can obtain the water quality information from the data [35,36,38,39,40]. Based on PCA, the water quality indices obtained from the same principal component had similar or the same sources contributing to pollution, while the water quality parameters within different principal components represent different sources of pollutants. Based on the correlation, PFA was carried out and factor load calculated. The contribution rate of water quality parameters in principal components can be determined through factor load calculation, to identify the primary pollution impact factors [38,40,41,42].
The entropy weight method is based on Shannon entropy, proposed by Shannon in 1948 [43]. According to Shannon’s theory, information is a function: the sender of the information chooses a piece of information from a set of possible choices, and the degree of uncertainty associated with this choice behavior is central to this concept [44]. Consistent with the basic principles of information theory, information is a measure of the degree of system order, and entropy is a measure of the degree of system disorder. In line with the definition of information entropy, for a certain index, the entropy value can be used to determine the degree of dispersion of an index. A smaller information entropy value will lead to a greater degree of dispersion of an index, and a greater influence (i.e., weight) of the index on the comprehensive evaluation. If all the values of an index are equal, the index will not play any role in the comprehensive evaluation [43,45,46,47]. Therefore, the information entropy tool can be used to calculate the weight of each index and provide a basis for the comprehensive evaluation of multiple indices. Li et al. [48] used the entropy weight fuzzy analysis method to evaluate the groundwater quality of industrial parks in Northwest China.
Indices can be divided into positive and negative indices. Positive indices are also known as efficiency criteria; a high original value of the index will result in a higher efficiency level, whereas a low original value of the index will result in a lower level. The inverse index is also known as the cost index. A smaller original value of the index will result in a higher level; a higher original value of the index will result in a lower level [45,49,50]. In the water quality index, except pH, all others are inverse indices. If the membership function is Uw (x), the membership degree of the positive index is
the inverse index membership degree is
where xmax and xmin represent the maximum and minimum of the original data values of m samples of the index, respectively. In Equations (1) and (2), Uw (x) ∈ [0,1]. The closer the membership function value is to 1, the better the water quality. On the basis of the membership degree of each index, the membership matrix, namely the decision matrix Rw, was obtained as
where rij = Uw (x); i = 1,2, …, m, j = 1,2, …, n; m is the number of samples; and n is the number of indices. The entropy method was used to determine the weight of each index, and the weight transformation was carried out to calculate the new weight of each index.
The specific gravity of the index was transformed as
Ej represents the total contribution of all samples to the index, namely the entropy value,
Here, the constant K = 1/ln (m), such that 0 ≤ Ej ≤ 1 can be ensured; that is, Ej has a maximum value of 1.
The reverse entropy was obtained as
Finally, the index weight was calculated as
The WQI is the simplest and most widely used index for assessing the overall quality of surface and groundwater water [17,33,51,52]. In this study, the WQI was [48] calculated as
where wj is the weight, which ranges between 0 and 1, w1 + w2 + w3 +…+ wn = 1; qj is the quality level of each parameter, and n is the number of parameters used in WQI evaluation.
where Cj is the concentration (mg/L) of each index in each water sample, CpH is the value of the pH in each water sample, and Sj is the standard limit (mg/L) of each index in the Standards for drinking water quality (GB5749-2006).
3. Results
3.1. Single Factor Evaluation
The research scope includes 38 indices, such as Na+, NH4+–N, Fe, TH, TDS, Hg, Lead (Pb), benzene, and xylene (total). First, all index data of 101 samples were summarized and preliminarily analyzed and compared with Standards for drinking water quality (GB5749-2006) (hereafter referred to as the “Standards”), the European Union Water Framework Directive (hereafter referred to as the “WFD”) of 2000, and the WHO Guidelines for drinking-water quality (the fourth edition) of July 2011 (hereafter referred to as “Guidelines”). The results are shown in Table 1.

Table 1.
Summary of sample well index data and index limits.
Among them, 16 indexes including NH4+–N, Fe, Cl−, SO42−, pH, TH, TDS, chemical oxygen demand (permanganate index) (hereinafter referred to as “COD(Mn)”), Aluminum (Al), Manganese (Mn), Molybdenum (Mo), Argentum (Ag), 1,1-dichloroethylene, 1,1,2-trichloroethane, chlorobenzene, and trichlorobenzene (total) are considered unnecessary or have not been established in the “Guidelines”, while 1,2-dichloropropane is not specified in the “Standards”. There are even more missing indicators in “WFD”. The core of the water quality standards is the index and limit values. The index selection is primarily based on the water quality analysis to determine which pollutants are present in the water and their corresponding concentration levels. The limits are determined mainly based on toxicological data. The primary investigation requires significant time and manpower and material resources. Therefore, China’s water quality standards are primarily based on the relevant standards adopted by the developed countries and organizations, such as WHO, Environmental Protection Agency (EPA) of the United States, and the European Union. Toxicological data can be used directly, but the contribution of different exposure routes and sources varies for countries and regions because of geographical factors, living standards, and habits, which require reassessment. Therefore, it is considered that the revised “Standards” should focus on the selection of indices. The indices that are unlikely to exceed the threshold (or where the apparent concentration is much lower than the health-based guideline value) need not be included in the “Standards” for mandatory testing but can be used as reference indices for emergency management and response requirements. In addition, the “Standards” limits of F−, Nitrate nitrogen (NO3−–N), Nitrite nitrogen (NO2−–N), Hg, Nickel (Ni), tetrachloromethane, chloroethylene, and trichloroethylene vary from the “Guidelines” limits, of which 62.5% are stricter than the “Guidelines” limits. Therefore, the Chinese standard limits were adopted as the evaluation standards in this study, and for the values not included in the standard, the WHO guidelines were referred.
In accordance with the preliminary analysis of the data, 27 indices exceeded the limits, accounting for 71.05%. Each index of 101 sample wells was compared with Standards for groundwater quality (GT14848-2017), and 42 sample wells were classified as groundwater category 3 water bodies, 32 as groundwater category 4 water bodies, and 27 as groundwater category 5 water bodies, with no category 1 or category 2 water body. For the control standard, the exceeding rate of each sample index is shown in Table 2. The highest exceeding factor was NO3−–N, with an exceeding rate of 49.5%, followed by Fe and TH, with an exceeding rate of 42.57% and 31.68%, respectively. The exceeding rate of Cl−, TDS, NO2−–N, Mn, and 1,2-Trichloroethane was approximately 10.00%. The average exceeding rate of heavy metal pollutants was 2.48%, and that of organic pollutants was 2.50%. The concentrations of Na+, Cl−, SO42−, TH, and TDS were primarily related to rock weathering, while the concentrations of NH4+–N, COD (Mn), F−, heavy metals, and organic matter were related to environmental pollution. In the single factor water quality evaluation method, if only one of all indices exceeded the standard value, the water quality is defined as exceeding the standards, which does not evaluate the groundwater quality accurately. This is because the impact (weight) of the index on the overall water quality is possibly minimal, and because of the different background water quality values, the water quality varies from place to place. Therefore, this study adopted the WQI method to comprehensively evaluate water quality.

Table 2.
Exceeding rate of the index value.
3.2. Full Index Analysis
In accordance with Equations (1)–(3), the membership degree was calculated for 38 index data of 101 sample wells to obtain the decision matrix,
In the light of Equations (4)–(7), the weights of 38 indexes were calculated as follows:
Conforming to Equations (8) and (9), the WQI of 101 sample wells were calculated as follows:
3.3. Delphi Method Analysis
In agreement with the Delphi method, we sent questionnaires to 60 experts in the water environment industry, and finally determined Na+, NH4+–N, Fe, Cl−, SO42−, pH, TH, TDS, COD (Mn), Al, and Mn as the evaluation indices. To improve convenience for comparison, we also used the entropy value method to determine the weight in the Delphi method. According to Equations (1)–(3), the membership degree of 11 index data of 101 sample wells was calculated to obtain the decision matrix,
In accordance with Equations (4)–(7), the weights of the 11 indexes are
On the basis of Equations (8) and (9), the WQI of 101 sample wells were calculated as follows:
3.4. Principal Component Analysis
The SPSS26 software was used for correlation analysis of the 38 indices, and the results showed that the concentration changes of these indicators were highly correlated. It means that these highly correlated index pollutants have the same or similar sources of pollution, and that they have the same change trends. So the concentration changes of one pollutant can be indicative the changes of other highly correlated pollutants [19]. We can screen the indicators through PCA.
Principal component analysis (PCA) and principal factor analysis (PFA) were carried out on 38 index data. PCA is a mathematical approach to dimensionality reduction. Through PCA, the original 38 indicators are recombined into several groups of new comprehensive indicators which are unrelated to each other to replace the original indicators. The information contained in each group of indicators is expressed by variance, that is, the greater the variance, the more information contained. Each set of indicators is called the principal component. The principal component 1 contains the most information, and then it decreases. In the process of principal component extraction, we select the principal components whose initial eigenvalue is greater than 1, namely, principal components 1 to 9. The total variance of the 9 principal components is presented in Table 3. The variance contribution rate of principal component 1 (PC1) was 29.188%, the variance contribution rate of principal component 2 (PC2) was 16.224%, and the accumulation variance contribution rate of the nine principal components was 85.356%. These values can better explain the characteristics of the 38 indexes, so 9 principal components were extracted. The composition matrix after rotation is shown in Table 4. PC1 includes the indices of xylene (total), styrene, methylbenzene, trichlorobenzene (total), Ni, TH, and Mn; PC2 those of dichloromethane, 1,2-dichloroethylene, 1,2-dichloroethane, chloroethylene, 1,1,2-trichloroethane, chlorobenzene, and 1,1-dichloroethylene; principal component 3 (PC3) those of o-dichlorobenzene, ethyl benzene, benzene, paradichlorobenzene; principal component 4 (PC4) those of Na+, TDS, Cl−, and pH; principal component 5 (PC5) those of NO3−–N, NH4+–N, NO2−–N, and COD (Mn); principal component 6 (PC6) those of tetrachloromethane, 1,2-dichloropropane, trichloroethylene, and tetrachloroethylene; principal component 7 (PC7) those of Mo, SO42−, F−, and Ag; principal component 8 (PC8) those of Al, Pb, and Fe; and principal component 9 (PC9) is the index of Hg.

Table 3.
Total variance interpretation.

Table 4.
The composition matrix after rotation.
In consonance with the PCA results, the indices with the highest correlation coefficient among the nine principal components were selected as evaluation indices, namely, Na+, Al, NO3−–N, Hg, tetrachloromethane, Mo, dichloromethane, xylene (total), and o-dichlorobenzene. In the light of Equations (1)–(3), the membership degree for nine index data of 101 sample wells was calculated to obtain the decision matrix,
On the basis of Equations (4)–(7), the weights of the nine indices are
Conforming to Equations (8) and (9), the WQI of 101 sample wells were calculated as follows:
3.5. Evaluation and Comparison
The groundwater was classified in agreement with the WQI evaluation results, as shown in Table 5 [48]. The WQI indices obtained by the full index method, Delphi method, and PCA analysis method were used for grading evaluation of 101 sample wells, as shown in Table 6. By the full index method, Class Ⅰ sample wells accounted for 57.43%, Class Ⅱ 21.78%, Class Ⅲ 8.91%, Class Ⅳ 7.92%, and Class Ⅴ 3.96%. In the Delphi method, Class Ⅰ sample wells accounted for 28.71%, Class Ⅱ 28.71%, Class Ⅲ 17.82%, Class Ⅳ 8.91%, and Class Ⅴ 15.84%. In the PCA method, Class Ⅰ sample wells accounted for 74.26%, Class Ⅱ 17.82%, Class Ⅲ 5.94%, Class Ⅳ 0.99%, and Class Ⅴ 0.99%. In all three methods, the average of Class Ⅰ and Ⅱ sample wells was 76.24%. Therefore, the groundwater quality in the Dawu water source area can be considered good and potable.

Table 5.
Classification of Water quality index (WQI).

Table 6.
Sample wells classification results.
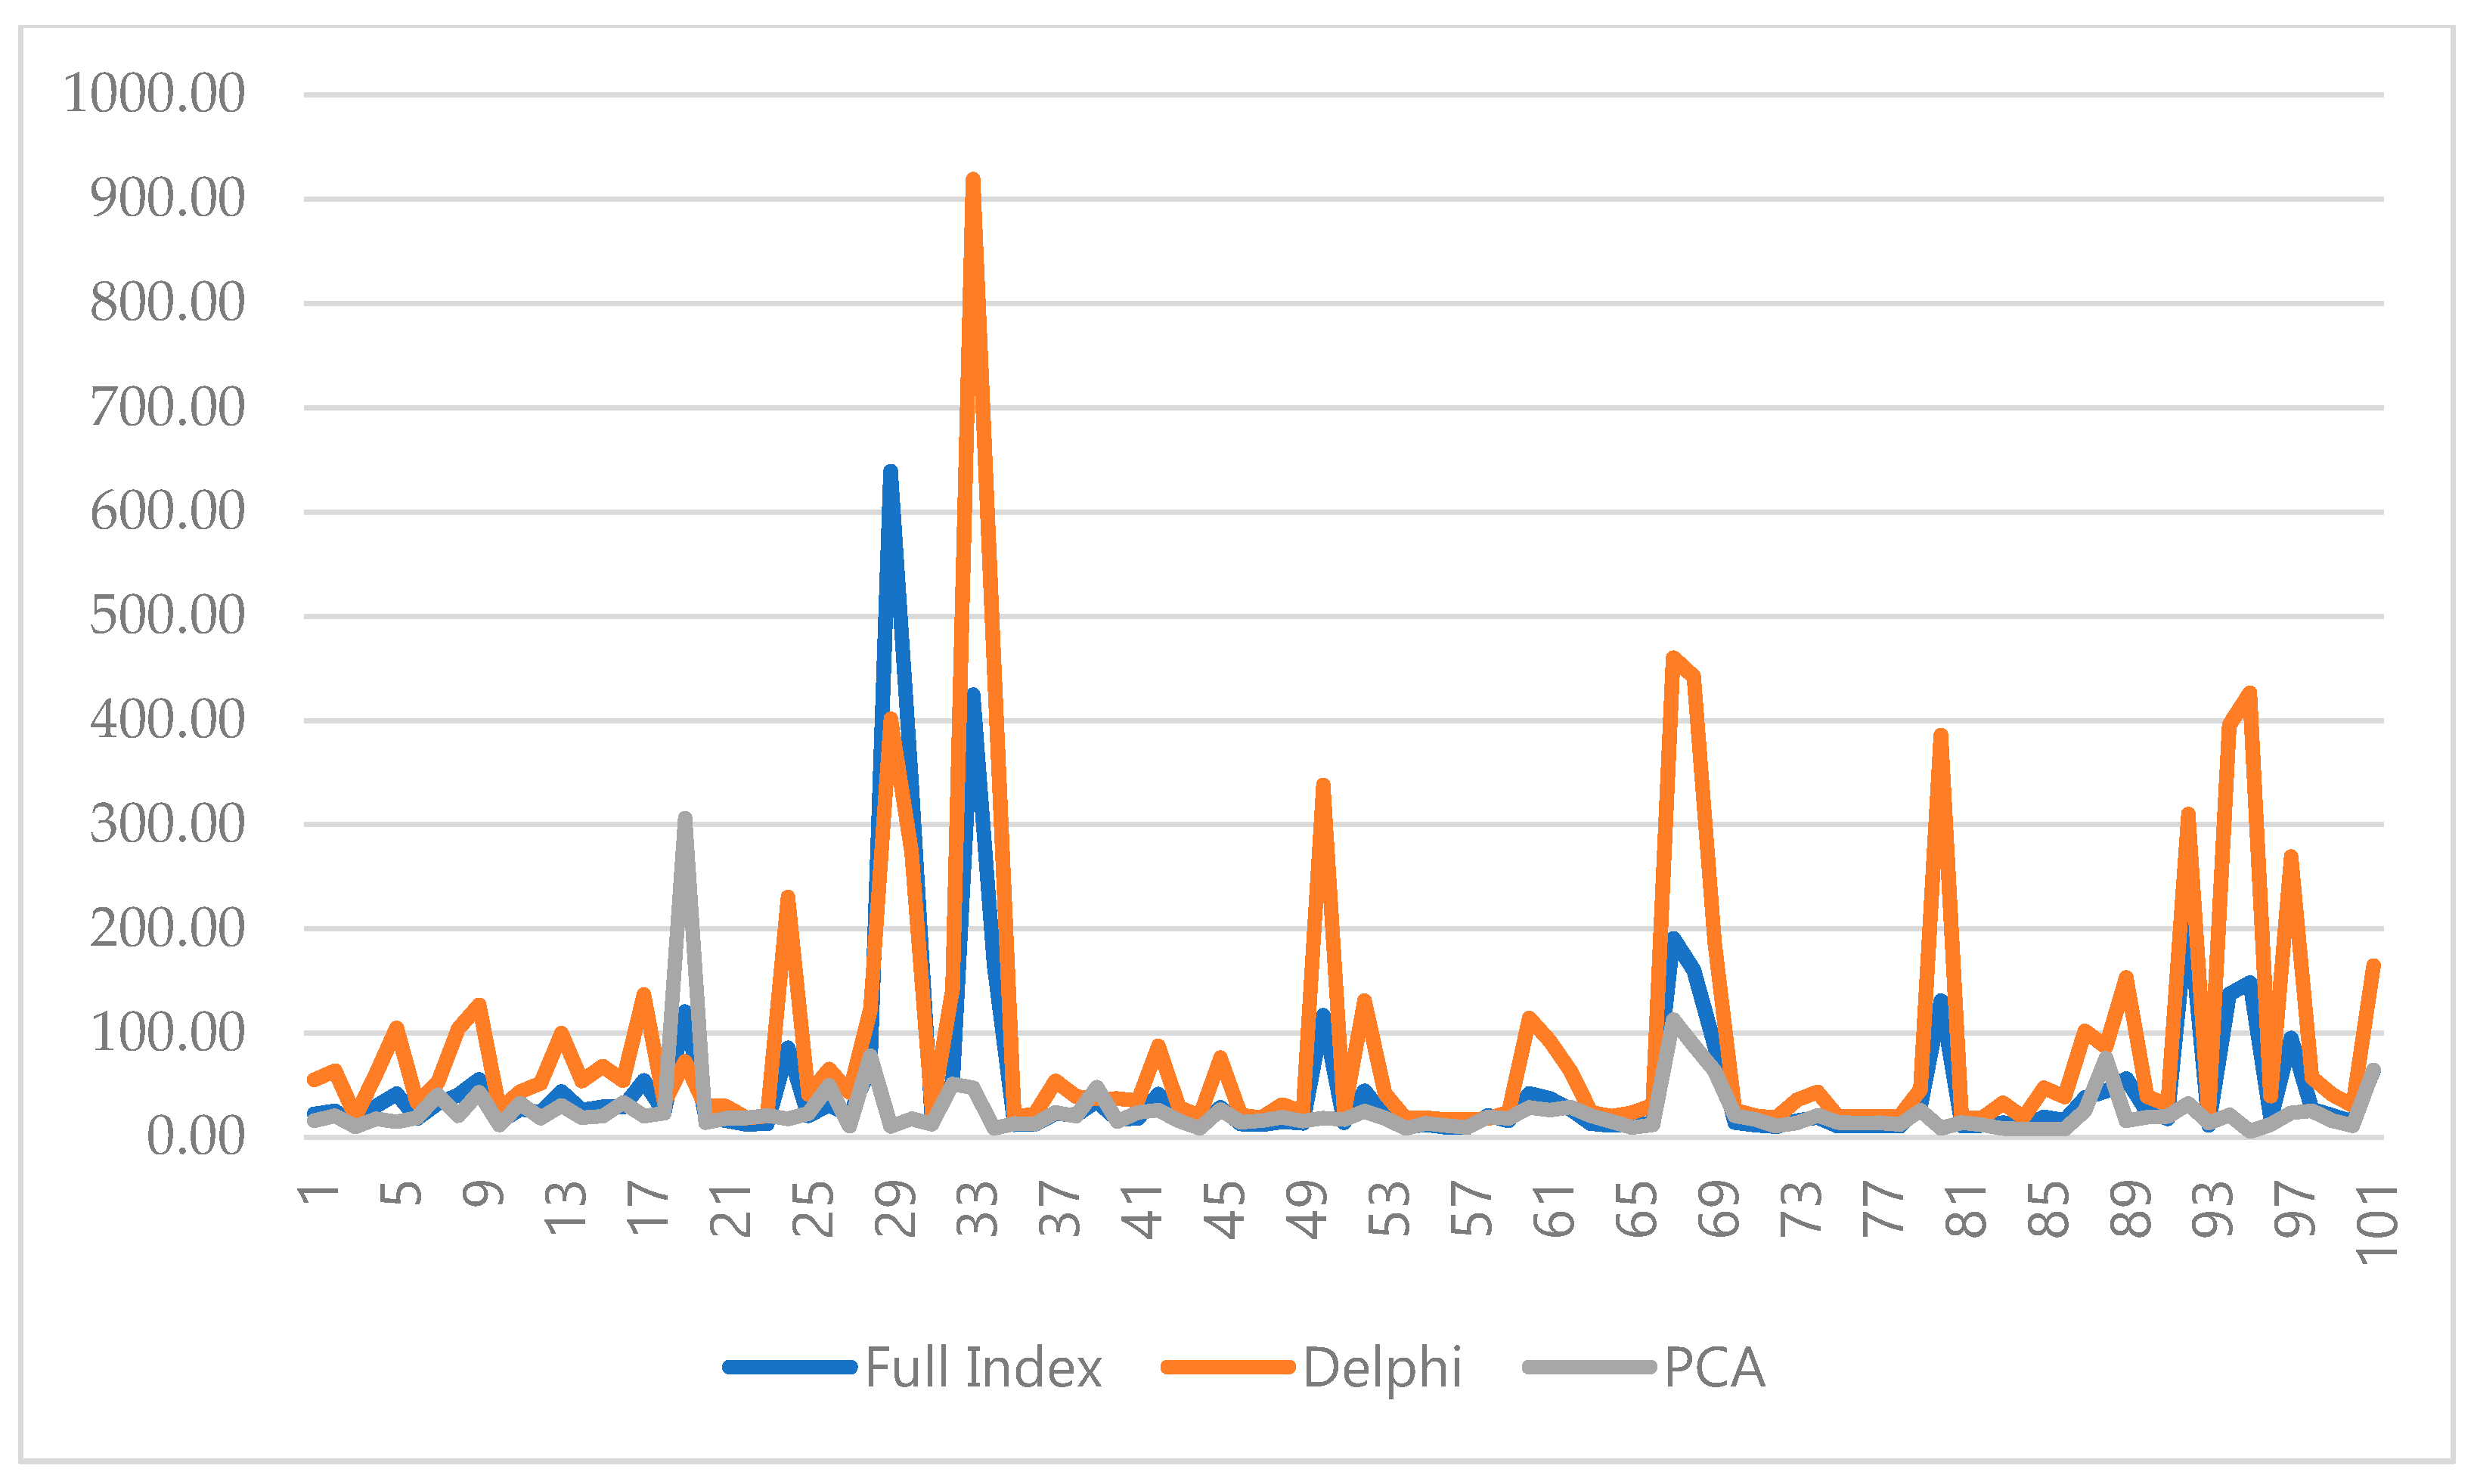
Among the three methods, the full index method was the most accurate because it comprehensively considered the thirty-eight water quality indices and all the pollutants in groundwater. Therefore, the full index method was used as the benchmark for comparison. Figure 4 shows the comparison of WQI obtained by the three methods, with 101 sample well numbers on the abscissa and WQI values on the ordinate. The blue curve is the WQI calculated by the full index method; the orange curve is the Delphi method WQI, and the gray curve is the PCA method WQI. We line up the values at each point, which makes it easier to see the similarities between the various methods. As can be seen from the figure, the WQI value obtained by PCA method is more similar to that obtained by the full index method. A comparison between the Delphi method and the full index method by calculating shows that the same rate of WQI evaluation results of the Delphi method was 37.62%, which is worse than that of the full index method because the single-factor exceeding rate of the indices selected in the Delphi method was higher. The same rate of WQI evaluation results of the PCA method was 77.23%, which is better than that of the full index method. This is because the selected indices comprehensively consider the presence of organic pollutants; the exceeding rate of organic pollutants was very low, and therefore, the comprehensive evaluation results were good. The PCA method was more accurate than the Delphi method in terms of the same rate of evaluation results. Thus, we conclude that it is reasonable and scientific to apply the multivariate statistical analysis method in WQI technology.
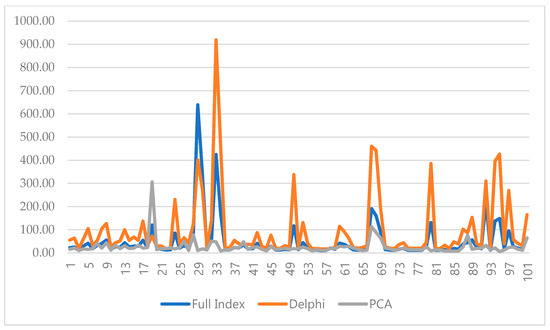
Figure 4.
The comparison of WQI values by the three methods.
4. Discussion
In this study, thirty-eight indices data from 101 sample wells in the Dawu water source area of China were analyzed, and the single factor method and WQI method were used to evaluate groundwater quality in this area. In the single factor water quality evaluation method, the weights of all indices are not considered. Even if only one of all indices exceed the standard and by a very small amount, the water quality is defined as exceeding the standard, and the evaluation results are one-sided. Therefore, this study adopted the WQI method for comprehensive evaluation.
In the index selection process of the WQI evaluation method, the full index method, the Delphi method, and the PCA method were adopted and the entropy method was used to determine the weight. Finally, the evaluation results were analyzed, and the scientific basis for the Delphi method and the PCA method were compared. Using the full index method, Class I sample wells accounted for 57.43%; using the Delphi method, these accounted for 28.71%; and using the PCA method, these accounted for 74.26%. Thus, from the three methods, the Class I and II sample wells had an average of 76.24%. Therefore, it may be concluded that the groundwater in the Dawu water source area generally has good quality and is potable. Selecting the full index method as the criterion, the same rate of WQI evaluation results of the Delphi method and the full index method was 37.62%, which was worse than that of the full index method. The same rate of PCA WQI evaluation was 77.23%, which was better than that of the full index method. Hence, the PCA method is more accurate than the Delphi method in terms of the same rate of evaluation results, and it is reasonable and scientific to apply the multivariate statistical analysis method and entropy weighting method in WQI technology.
Despite this, this study only carried out a comparative analysis on the detection data of the Dawu water source area; in the Delphi method, the selection of evaluation indices may consider more factors such as regional water quality background differences; more research is needed to determine whether the results of other groundwater or surface water assessments are consistent. At the same time, the large difference in the evaluation results between the full index method and the Delphi method also reminds scholars that they need to pay more attention to the rationality of the selection of indicators in the future research.
Author Contributions
Conceptualization, Z.L., H.Z., Z.C. and L.Z.; methodology, Z.L. and L.Z.; software, Z.L. and L.Z.; validation, H.Z., Z.C. and L.Z.; formal analysis, X.C. and X.L.; investigation, W.W. and L.C.; data curation, Z.L. and L.Z.; writing—original draft preparation, Z.L., H.Z., X.C., W.W., X.L., L.C. and L.Z.; writing—review and editing, Z.C. and L.Z.; supervision, Z.C. and L.Z.. All authors have read and agreed to the published version of the manuscript.
Funding
This paper has been supported by National Key Research and Development Program of China (Grant No. 2018YFF0213404).
Institutional Review Board Statement
Not applicable.
Informed Consent Statement
Not applicable.
Data Availability Statement
The data presented in this study are available on request from the corresponding author.
Acknowledgments
The authors thank the Zibo Water Resources Management Office, China, for its strong support. The authors also thank all the anonymous referees for their constructive comments and suggestions.
Conflicts of Interest
The authors declare no conflict of interest.
References
- Döll, P.; Fiedler, K. Global-scale modeling of groundwater recharge. Hydrol. Earth Syst. Sci. 2008, 12, 863–885. [Google Scholar] [CrossRef]
- Hou, D.; Li, G.; Nathanail, P. An emerging market for groundwater remediation in China: Policies, statistics, and future outlook. Front. Environ. Sci. Eng. 2018, 12. [Google Scholar] [CrossRef]
- MEE. Bulletin on the State of China’s Ecology and Environment, China; MEE: Beijing, China, 2019. [Google Scholar]
- Gao, Z.; Zhang, H.; Feng, J.; Lu, T.; Yang, L.; Sun, J.; Shi, M. Dynamic evolution of karst water levels and its controlling and influencing factors in Northern China: A case study in the Dawu water source area. Carbonates Evaporites 2020, 35. [Google Scholar] [CrossRef]
- Noori, R.; Berndtsson, R.; Hosseinzadeh, M.; Adamowski, J.F.; Abyaneh, M.R. A critical review on the application of the National Sanitation Foundation Water Quality Index. Environ. Pollut. 2019, 244, 575–587. [Google Scholar] [CrossRef] [PubMed]
- Horton, R.K. An index number system for rating water quality. J. Water Pollut. Control Fed. 1965, 37, 300–306. [Google Scholar]
- Brown, R.M.; McClelland, N.I.; Deininger, R.A.; Tozer, R.G. A water quality index—Do we dare? Water Sew Works 1970, 117, 339–343. [Google Scholar]
- Brown, R.M.; McClelland, N.I.; Deininger, R.A.; O’Connor, M. A Water Quality Index—Crashing the Psychological Barrier. Indic. Environ. Qual. 1972, 1, 173–178. [Google Scholar] [CrossRef]
- Brown, R.M.; McClelland, N.I.; Deininger, R.A.; Landwehr, J.M. Validating the WQI. In Proceedings of the National Meeting of American Society of Civil Engineers on WATER Resources Engineering, Washington, DC, USA, 29 January–2 February 1973. [Google Scholar]
- Deininger, R.A.; Maciunas, J.M. Water Quality Index for Public Water Supplies; University of Michigan: Ann Arbor, MI, USA, 1971. [Google Scholar]
- Linstone, H.A.; Murray, T. The Delphi Method: Techniques and Applications; Addison Wesley Reading: Boston, MA, USA, 1975. [Google Scholar]
- House, M.A. A water quality index for river management. J. Water Environ. Manag. 1989, 3, 336–344. [Google Scholar] [CrossRef]
- House, M.A. Water quality indices as indexs of ecosystem change. Environ. Monit. Assess. 1990, 5, 255–263. [Google Scholar] [CrossRef] [PubMed]
- Bouslah, S.; Djemili, L.; Houichi, L. Water quality index assessment of Koudiat Medouar Reservoir, northeast Algeria using weighted arithmetic index method. J. Water Land Dev. 2017, 35, 221–228. [Google Scholar] [CrossRef]
- MRC. An Assessment of Water Quality in the Lower Mekong Basin; MRC Technology Paper; Mekong River Commission: Vientiane, Laos, 2008; p. 70. [Google Scholar]
- Bhatt, J.P.; Pandit, M.K. A macro-invertebrate based new biotic index to monitor river quality. Curr. Sci. 2010, 99, 196–203. [Google Scholar]
- Lumb, A.; Sharma, T.C.; Bibeault, J.F. A Review of Genesis and Evolution of Water Quality Index (WQI) and Some Future Directions. Water Qual. Expo. Health 2011, 3, 11–24. [Google Scholar] [CrossRef]
- Machiwal, D.; Islam, A.; Kamble, T. Trends and probabilistic stability index for evaluating groundwater quality: The case of quaternary alluvial and quartzite aquifer system of India. J. Environ. Manag. 2019, 237, 457–475. [Google Scholar] [CrossRef] [PubMed]
- Mahapatra, S.S.; Sahu, M.; Patel, R.K.; Panda, B.N. Prediction of Water Quality Using Principal Component Analysis. Water Qual. Expo. Health 2012, 4, 93–104. [Google Scholar] [CrossRef]
- Fathy, S.A.H.; Hamid, F.F.A.; Shreadah, M.A.; Mohamed, L.A.; El-Gazar, M.G. Application of Principal Component Analysis for Developing Water Quality Index for Selected Coastal Areas of Alexandria Egypt. Resour. Environ. 2012, 2, 297–305. [Google Scholar] [CrossRef]
- Yotova, G.; Varbanov, M.; Tcherkezova, E.; Tsakovski, S. Water quality assessment of a river catchment by the composite water quality index and self-organizing maps. Ecol. Indic. 2021, 120, 106872. [Google Scholar] [CrossRef]
- NHC; SAC. Standard Examination Methods for Drinking Water; GB/T5750; NHC; SAC: Beijing, China, 2006.
- AQSIQ; SAC. Standards for Groundwater Quality; GT14848-2017; AQSIQ; SAC: Beijing, China, 2017. [Google Scholar]
- NHC; SAC. Standards for Drinking Water Quality; GB5749-2006; NHC; SAC: Beijing, China, 2006.
- The European Commission Environment. The Drinking Water Directive (DWD), Council Directive 98/83/EC; The European Commission Environment: Brussels, Belgium, 1998. [Google Scholar]
- WHO. Guidelines for Drinking-Water Quality, 4th ed.; World Health Organization: Geneva, Switzerland, 2011. [Google Scholar]
- Musa, H.D.; Yacob, M.R.; Abdullah, A.M.; Ishak, M.Y. Delphi Method of Developing Environmental Well-being Indexs for the Evaluation of Urban Sustainability in Malaysia. Procedia Environ. Sci. 2015, 30, 244–249. [Google Scholar] [CrossRef]
- Cheshmidari, M.N.; Ardakani, A.H.H.; Alipor, H.; Shojaei, S. Applying Delphi method in prioritizing intensity of flooding in Ivar watershed in Iran. Spat. Inf. Res. 2017, 25, 173–179. [Google Scholar] [CrossRef]
- Moreira, D.G.; Costello, J.T.; Brito, C.J.; Adamczyk, J.G.; Ammer, K.; Bach, A.J.; Costa, C.M.; Eglin, C.; Fernandes, A.A.; Fernández-Cuevas, I.; et al. Thermographic imaging in sports and exercise medicine: A Delphi study and consensus statement on the measurement of human skin temperature. J. Therm. Biol. 2017, 69, 155–162. [Google Scholar] [CrossRef]
- Strand, J.; Carson, R.T.; Navrud, S.; Ortiz-Bobea, A.; Vincent, J.R. Using the Delphi method to value protection of the Amazon rainforest. Ecol. Econ. 2017, 131, 475–484. [Google Scholar] [CrossRef]
- Varndell, W.; Fry, M.; Lutze, M.; Elliot, D. Use of the Delphi method to generate guidance in emergency nursing practice: A systematic review. Int. Emerg. Nurs. 2020, 100867. [Google Scholar] [CrossRef]
- Vega, M.; Pardo, R.; Barrado, E.; Debán, L. Assessment of seasonal and polluting effects on the quality of river water by exploratory data analysis. Water Res. 1998, 32, 3581–3592. [Google Scholar] [CrossRef]
- Liu, C.; Lin, K.; Kuo, Y. Application of factor analysis in the assessment of groundwater quality in a blackfoot disease area in Taiwan. Sci. Total Environ. 2003, 313, 77–89. [Google Scholar] [CrossRef]
- Simeonov, V.; Stratis, J.A.; Samara, C.; Zachariadis, G.; Voutsa, D.; Anthemidis, A.; Sofoniou, M.; Kouimtzis, T. Assessment of the surface water quality in Northern Greece. Water Res. 2003, 37, 4119–4124. [Google Scholar] [CrossRef]
- Singh, K.P.; Malik, A.; Mohan, D.; Sinha, S. Multivariate statistical techniques for the evaluation of spatial and temporal variations in water quality of Gomti River (India)—A case study. Water Res. 2004, 38, 3980–3992. [Google Scholar] [CrossRef] [PubMed]
- Trabelsi, R.; Zouari, K. Coupled geochemical modeling and multivariate statistical analysis approach for the assessment of groundwater quality in irrigated areas: A study from North Eastern of Tunisia. Groundw. Sustain. Dev. 2019, 8, 413–427. [Google Scholar] [CrossRef]
- Abdelaziz, S.; Gad, M.I.; El Tahan, A.H.M. Groundwater quality index based on, P.CA: Wadi El-Natrun; Egypt. J. Afr. Earth Sci. 2020, 172, 103964. [Google Scholar] [CrossRef]
- Bouderbala, A.; Remini, B.; Hamoudi, A.S.; Pulido-Bosch, A. Application of Multivariate Statistical Techniques for Characterization of Groundwater Quality in the Coastal Aquifer of Nador; Tipaza (Algeria). Acta Geophys. 2016, 64, 670–693. [Google Scholar] [CrossRef]
- Roberts, N.M.; Tikoff, B.; Davis, J.R.; Stetson-Lee, T. The utility of statistical analysis in structural geology. J. Struct. Geol. 2019, 125, 64–73. [Google Scholar] [CrossRef]
- Masoud, A.M.; Ali, M.H. Coupled multivariate statistical analysis and, WQI approaches for groundwater quality assessment in Wadi El-Assiuty downstream area; Eastern Desert; Egypt. J. Afr. Earth Sci. 2020, 172, 103982. [Google Scholar] [CrossRef]
- Suhas, S.; Chaudhary, J.K. A Comparative Study of Fuzzy Logic and, WQI for Groundwater Quality Assessment. Procedia Comput. Sci. 2020, 171, 1194–1203. [Google Scholar] [CrossRef]
- Zhang, H.; Cheng, S.; Li, H.; Fu, K.; Xu, Y. Groundwater pollution source identification and apportionment using, P.MF and, P.CA-APCA-MLR receptor models in a typical mixed land-use area in Southwestern China. Sci. Total Environ. 2020, 741, 140383. [Google Scholar] [CrossRef]
- Guido, R.C. A tutorial review on entropy-based handcrafted feature extraction for information fusion. Inf. Fusion 2018, 41, 161–175. [Google Scholar] [CrossRef]
- Cole, C. Calculating the information content of an information process for a domain expert using Shannon’s mathematical theory of communication-A preliminary analysis. Inf. Process. Manag. 1997, 33, 715–726. [Google Scholar] [CrossRef]
- Zou, Z.H.; Yun, Y.; Li, H.; Fu, K.; Xu, Y. Entropy method for determination of weight of evaluating indexs in fuzzy synthetic evaluation for water quality assessment. J. Environ. Sci. 2006, 18, 1020–1023. [Google Scholar] [CrossRef]
- Liang, Y.; Chen, W. A relative entropy method to measure non-exponential random data. Phys. Lett. A 2015, 379, 95–99. [Google Scholar] [CrossRef]
- Hasan, M.S.U.; Rai, A.K. Groundwater quality assessment in the Lower Ganga Basin using entropy information theory and GIS. J. Clean. Prod. 2020, 274, 123077. [Google Scholar] [CrossRef]
- Li, P.; Wu, J.; Qian, H.; Lyu, X.; Liu, H. Origin and assessment of groundwater pollution and associated health risk: A case study in an industrial park, northwest China. Environ. Geochem. Health 2014, 36, 693–712. [Google Scholar] [CrossRef]
- Qiu, W.H. Management Decision and Applied Entropy; China Machine Press: Beijing, China, 2002; pp. 193–196. [Google Scholar]
- Pan, G.; Xu, Y.; Yu, Z.; Song, S.; Zhang, Y. Analysis of river health variation under the background of urbanization based on entropy weight and matter-element model: A case study in Huzhou City in the Yangtze River Delta, China. Environ. Res. 2015, 139, 31–35. [Google Scholar] [CrossRef]
- Ma, Z.; Li, H.; Ye, Z.; Wen, J.; Hu, Y.; Liu, Y. Application of modified water quality index (WQI) in the assessment of coastal water quality in main aquaculture areas of Dalian, China. Mar. Pollut. Bull. 2020, 157, 111285. [Google Scholar] [CrossRef]
- Nong, X.; Shao, D.; Zhong, H.; Liang, J. Evaluation of water quality in the South-to-North Water Diversion Project of China using the water quality index (WQI) method. Water Res. 2020, 178, 115781. [Google Scholar] [CrossRef] [PubMed]
Publisher’s Note: MDPI stays neutral with regard to jurisdictional claims in published maps and institutional affiliations. |
© 2021 by the authors. Licensee MDPI, Basel, Switzerland. This article is an open access article distributed under the terms and conditions of the Creative Commons Attribution (CC BY) license (https://creativecommons.org/licenses/by/4.0/).

