1. Introduction
The study of tourism seasonality from the specific perspective of the accommodation sector has, to date, been unsatisfactorily studied in the academic literature from an empirical perspective. Nevertheless, since the construction of any form of new accommodation has a significant environmental impact generally, and especially on small islands territories, in-depth knowledge about those market segments with the highest propensity to select environmental-friendly forms of accommodations is critical.
For the impact of seasonality on destinations, clearly the economic impact is of particular importance. An economic rationale generally governs the development of tourist regions [
1]; with emphasis in most destinations on the high or “peak” season. However, due to its contribution to overcoming negative environmental effects, studying low-season characteristics may be a useful complement, since a reduced numbers of tourists could help preserve the destination’s natural resources more effectively.
Although seasonality in the Canary Islands is low, it is possible to distinguish two seasons: from November to Easter (high season), and from the end of Easter to October (low season). Due to its favorable climatic conditions, winter is included in the high season for the islands that comprise the Canaries. Nevertheless, domestic tourists have a remarkably diverse behavior with sociological and/or institutional reasons (such as school vacation patterns) explaining why summer continues to represent the “peak” season.
Small island territories generally are more fragile and suffer greater deterioration [
2,
3] than mainland destinations. Thus, since any kind of new accommodation building has a huge impact on small island territories, the question of which accommodation type is chosen by visitors may be of a particular interest to those determining environmental policy. In fact, as the natural resources are diverse so are the effects of tourism on them: highly disorganized land occupation (constructions of large blocks of hotels, apartments, restaurants, etc.) and waste generation, for example. In such instances, excessive development of the tourism “product” can undermine the offer itself, making the destinations less attractive to tourists.
Moreover, tourist activity is intensive in the consumption of space. Tourists and employees demand space for housing, restaurants, leisure venues, and at the same time consume scarce resources such as water in addition to using the land as a waste holder. Hence, with the mass-development and mass-consumption of tourism, there comes an excess of space consumption, with particular challenges for small island states in general.
Interestingly, as tourism is concentrated in areas of reduced size, there is usually a rapid and unorganized growth of private construction. In fact, by leaving development to the private sector, without appropriate regulations, a “free rider” problem can occur: the investors should cooperate with each other to prevent deterioration of the environment, but in reality, one investor will maximize its benefits if the others maintain the environment and overuse it. In situations such as this, market balance is achieved with a widespread overutilization of the common good, in this case the environment.
National parks are natural attractions globally that are of interest to a growing number of tourists [
4,
5]. Having the characteristics of protected areas, they provide a series of assets that contribute to the maintenance of biodiversity and environmental quality as well as elements that can be considered recreational, therapeutic, spiritual, cultural, artistic or educational [
6]. In addition to these intangible services provided by national parks, another set of tangible services such as guides, bar and restaurant services, mobility, security, etc., can be considered as well. These tangible aspects compose the park’s portfolio of services [
7]. Another key component to their attractiveness is a clear sky, protected in the specific context of Spain by a law developed for purposes unrelated to the national parks but rather to guarantee the quality of the astronomical observation at Izaña (Isla de Tenerife) and Roque de los Muchachos (Isla de la Palma). This feature can be an added attraction, and not a less important one, to its landscape created by an impressive geology, flora and endemic fauna.
The case focus of this study, the Canary Islands, receives annually six times the number of tourists as its total population [
8]. Due to the large number of tourist visits to the Canary Islands National Parks (CNP) (two out of three tourists) the development of control measures within the framework of the island’s tourism policy are necessary generally, and particularly with regard to the conservation of essential natural resources. Therefore, the development of a study where all the variables above (domestic/foreign visitors, accommodation type and seasonality) are included is a requirement to improve the decision-making process in the case of national parks in the specific context of the Canary Islands.
1.1. Tourism and Its Impact on the Environment
The relationship between sustainable tourism and the environment can be described as symbiotic. In fact, tourism production is nourished by the natural heritage on which it depends. In this sense, tourism has the capacity to generate external benefits from the environment, contributing to environmental protection and conservation. Indeed, we can observe how tourism makes the local population and tourists become more aware of environmental values. It can also serve as an instrument to finance the protection of natural areas [
9]. As stated by Ruiz [
10] (p. 348). “Sustainability implies a rational relationship between man and nature”. Sustainable tourism can be achieved by creating “bottom up” social systems interested in sharing experiences, ideas and resources [
11]. In this context, the regional scale has been recognized [
12] as being appropriate for the implementation of local participative actions aimed at the sustainable development of destinations. However, at the same time, the negative impacts of tourism should not be ignored, since they can gradually destroy the environmental resources on which tourism depends. In this sense, it is argued that tourism has become sensitive to and, simultaneously, dependent on a high-quality environment [
13].
Many tourist activities take place in fragile ecosystems, such as protected natural areas or small islands. An ecosystem is a geographical area that includes all living organisms (people, animals, plants and microorganisms), their physical environment (land, water and air) and the natural cycles that sustain them [
9]. However, the construction of hotels and recreational infrastructures generates sewage pollution, wastewater that pollutes rivers, lakes, or hinders marine biological cycles. In addition, many national parks globally are affected by traffic congestion and excessive numbers of visitors [
14]. Moreover, small islands are considered the most vulnerable ecosystems in the world [
15]. The physical impacts of tourism on these islands could lead to the degradation of their ecosystems that are valuable tourism assets with an abundance of their species.
1.2. Construction and Its Impact on the Environment
The construction sector is considered to be one with a high capacity to drive the economy. This sector is capable of stimulating economic growth due to its induced backward and forward effects on other sectors [
16,
17,
18,
19]. However, construction activities also have a dark side [
20] to the extent that the rapid expansion of construction can cause a variety of difficult-to-solve challenges mainly of a spatial (land occupation) and environmental nature [
19,
20,
21,
22,
23]. In this sense, a construction boom can lead to negative effects, such as the overproduction of building stock [
23] or the intensification of environmental deterioration through urban sprawl pollution and destruction of vegetation. In recent decades, the emphasis on the negative effects of construction has focused on environmental stress and sustainability issues. Specifically, the most considered effects have been the environmental degradation generated by pollution, the damage caused to natural resources and urban sprawl. Specifically, it is worth mentioning the destruction of flora and fauna, the use of materials harmful to human health, and carbon emissions caused by buildings and the particular methods of production and design [
19]. These negative effects have made the concept of sustainable construction flourish, which has become widespread and applied, especially in more developed countries [
24].
The concept of sustainable construction entails, among other aspects, the goal of reducing carbon emissions from buildings, the use of recycled materials and the use of construction techniques that have fewer harmful effects on the environment [
25,
26,
27]. These goals have been achieved by the governments of several developed countries through the implementation of plans based on “Green building” techniques and the implementation of environmental quality certifications [
28]. In addition to these specific measures, there are many communities that ask their governments to urgently adopt political actions such as institutional changes, or land use control measures to help reduce the negative effects of construction activities [
16,
20,
22,
27].
1.3. Seasonality
Considerable efforts have been made by tourism policymakers to reduce seasonality in many destinations. This is because it has been viewed as the reason for problems derived from peaking and overuse of facilities and resources. In fact, seasonality has been defined by Butler as a ‘temporal imbalance in the phenomenon of tourism, which may be expressed in terms of dimensions of such elements as visitor numbers, visitor expenditure, highway traffic and other forms of transportation, employment and admissions to attractions’ [
29] (p. 5). Therefore, looking for a better balance in the number of tourists coming along each year should be a tourism policy target. In this respect, and in order to measure the seasonality of tourist arrivals to a particular destination, a variety of qualitative terms can be used such as seasonal index or factors (using 12-month moving averages), Skewness, Kurtosis or Gini coefficient [
30]. In any case, the choice of measure will depend on the research question and the degree of detail required.
Regarding the reasons for seasonality, these can be found not only in natural factors, but also in institutional or social factors’ [
31,
32]. Referring to natural factors, one of the most studied by the literature is the climate [
1,
33,
34,
35], but there are other factors relating to social issues, sports seasons (ski, surf), and also to inertia and tradition [
29]. Destinations based on climate conditions as the main tourist attraction, for example ski [
36] or sun and sand tourism [
37,
38] suffer a structural seasonality problem. On the other hand, social norms and practices (vacation periods, religious pilgrimages, congresses and conventions) can play a determinant role in other destinations. In this respect, the characteristics of demand, in terms of the types of tourists and their countries of origin, for example, can generate clear seasonality practices [
39,
40,
41,
42].
Different studies have shown how tourists’ countries of origin explain the way they behave in terms of seasonality [
43,
44]. At the same time, only a few papers have focused the study of tourism seasonality from the perspective of the accommodation sector [
45,
46,
47]. Those studies have been oriented to the analysis of productivity, or the determinants of multi-destination tourism trips, being the accommodation an explanatory variable in the analysis, but not an outcome.
1.4. Tourism in Small Islands
Tourism to islands is second only to historical cities when it comes to visitation levels [
48] and this result is not about per capita visitation. However, small islands constitute fragile systems with high physical and socio-cultural complexity. The reduced size of the territory and the physical conditions of insularity increase their vulnerability and exposure, to a greater extent than a continental territory, of their social and natural systems to the impacts of natural agents or of local or visiting populations. In general, these islands have high biodiversity and unique landscapes. They also depend greatly on imported products and are subjected to growing pressure for the development of tourism. The above circumstances can deter employment in these small island territories as well as discouraging the use of similar construction and design methods for natural tourism that can be seen in continental territories [
15,
49,
50]. Therefore, due to the fragile system small islands constitutes, the concept of carrying capacity should be applied to the study of tourism [
51,
52,
53,
54,
55].
The availability of quality natural resources (landscape, pure atmosphere, clean sea water, etc.) and unique cultural assets are what determine the attractiveness of small islands in the context of the world tourism market. The development of the tourism sector, however, has an ambivalent impact. On the one hand, it generates economic resources for the local population, acting as an economic engine for small areas, such as islands. On the other hand, when tourism demand reaches levels of overcrowding, it contributes to a deterioration of natural resources, which, when excessive, generates adverse impacts in these territories. The problem is that as the tourist environment degrades this in turn affects the supply of tourist goods. This results in a displacement of tourism demand towards segments with fewer ecological impacts and less overcrowding, which subsequently leads to the deterioration in their environment.
1.5. Objectives and Research Questions
The primary objective of this research is to examine visitors’ accommodation choices when visiting national parks in the Canary Islands according to their domestic (Canary Island) resident or non-resident status and the impact of these choices on the preservation of the natural environment. Ultimately, the aim is to develop differentiated strategies for each group depending on their greater or lesser impact on the environment where they stay. In particular, the study aims to explore the most relevant environmental tourism policy recommendations for national parks in the Canary Islands and their insular environment. Indeed, the study of tourism seasonality from the perspective of the accommodation sector for resident visitors has been unsatisfactorily studied in the academic literature. In fact, no relevant paper has included the accommodation chosen by the tourist as a dependent variable when adding the season and place of residence as independent variables. Nevertheless, since the construction of any kind of new accommodation has significant impact on small island territories, the information about the market segments with the highest significance influence on certain types of accommodation for this kind of islands may be crucial.
With the general objective of achieving a better understanding of the application of a specific statistical technique, the multinomial logistic regression model (MLRM), the approaches set out above lead to the following specific objectives for this study:
- (1)
To achieve a better understanding of the relationship among the following variables and their categories: accommodation, country of origin and seasonality when studying the population of visitors to a national park.
- (2)
To better understand the influence of seasonality in the configuration of the different segments of the tourism markets currently visiting the national parks, distinguishing domestic (Canary Island) resident from non-resident visitors.
- (3)
To understand the perception of each segment of visitors on the preservation of natural resources
- (4)
To incorporate, for the first time, a MLRM (multinomial logistic regression model) as an effective and efficient method when analyzing the mentioned three variables—seasonality, accommodation type and resident/non-resident origin of the tourist.
- (5)
Finally, it is expected that this study leads to the development of appropriate plans aimed at achieving environmental objectives, through the control of the type of accommodations distribution throughout the year in the context of the Canary Islands.
Based on the above objectives, this research sets out to test the following hypotheses applicable to tourism market segmentation:
Hypothesis 1 (H1). It is possible to conduct a quantitative analysis of the seasonality of the accommodation used by the tourist, and particularly when differences in domestic (Canary Island) residents and non-resident visitors’ behavior is a main research topic.
Hypothesis 2 (H2). Seasonality has a strong influence on the accommodation type for the particular case of domestic (Canary Island) resident tourism.
Hypothesis 3 (H3). Domestic visitors (Canary Island residents) have a different perception of the natural resources preservation status in national parks.
Hypothesis 4 (H4). For those empirical studies in which no continuous variables are considered, choosing the accurate dependent (accommodation or preservation value) and independent variables (domestic/non-resident or seasonality) will be effective using a MLRM.
Of course, the effectiveness and efficiency are guaranteed as the researcher has enough data to apply the analysis to the point of achieving the research objectives. In the particular case of this paper, a representative sample of the total population of visitors to Canary Island national parks during the 2016–January 2020 period was used.
2. Materials and Methods
2.1. Theoretical Underpinning
The theory of planned behavior (TPB) is among the most cited social science theories that are used to explain behavior [
56] and one of the most widely applied theories in marketing research [
57]. TPB aims to develop the path toward behavioral intention by focusing on three primary components; these are an individual’s attitude toward a behavior (positive or negative predisposition or underlying attitude), their subjective norms (likelihood that significant others approve or disapprove of a particular behavior), and their perceived behavioral control (difficulty perceived in performing a behavior) [
58]. The theory has demonstrated its utility in predicting individuals’ intentions to engage in certain behaviors to varying degrees through the literature. For example, by using a meta-analysis, Han and Stoel [
59] identified significant (
p < 0.001) relationships among the TPB components of attitude and subjective norms with individuals’ purchase intentions. The theory has also been used to predict and evaluate socially responsible behaviors, such as sustainable behaviors [
60]; green hotel visitation [
61], energy conservation [
62], and sustainable transportation [
63] have all been examined. Moreover, within the marketing context, TPB may aid practitioners in furthering their understanding of their target market segments [
64].
People have varying types and degrees of wants and needs that cannot be fulfilled through any one particular marketing proposal [
65]. Therefore, marketers must develop ways to target their efforts toward certain groups, and segmentation is one method that can be used to achieve their goal. Market segmentation involves dissolving large, diverse consumer groups into smaller, more uniform clusters [
66]. Developing market segments affords marketers a more complete understanding of a particular group, which ultimately informs more direct and productive marketing initiatives [
67]. However, marketers need to identify how they would like to define and develop their target segments. Bases of segmentation exist for dividing groups within the marketing literature. For example, groups may be divided based on socio-demographics (generation, education), behavioral characteristics (involvement level, usage rate), or psychographic factors (lifestyle, i.e., adventure or relaxation) [
68]. People’s attitudes and behaviors can serve as bases for marketing segmentation [
69]; including behavioral and psychographic information allows marketers to develop a deeper understanding of their target market beyond basic demographic data [
64]. Therefore, TPB may help identify target market segments since it relies on individuals’ attitudes and behaviors to predict outcomes.
In addition, tourism research has long focused on what factors drive tourists’ travel decisions [
70]. Motivation has been identified as a primary driver of tourists’ travel behaviors [
71]. Over time, scholars have shaped and advanced the understanding of the role motivation plays in tourists’ decision-making processes (e.g., [
72]). Although various theoretical perspectives exist, the push-pull motivation framework has remained one of the dominant lenses through which travel motivation has been studied [
73,
74]. The framework can be used to uncover why tourists make certain destination-related decisions, such as visiting one destination over another [
75]. Push-pull motivation revolves around two primary concepts; push (personal desires and internal motives) and pull (external destination characteristics) [
74,
76]. Push factors include the need for adventure, fitness, health, knowledge, or relaxation [
77,
78]. Pull factors may revolve around the facility quality, staff demeanor, price [
73], entertainment value, or singularity [
78]. Multiple push and pull variables often play significant roles in driving different tourists’ motivation-driven behaviors [
79], including the decisions of nature-based tourists [
80], who demonstrate a range of motivations relative to their destination environment [
81].
2.2. Characteristics of Data Collection
This study is quantitative in nature, thus, in order to have a precise knowledge of visitors to the Canary Islands National Parks (CNP), a structured questionnaire divided into two sections was developed. A first section with questions aimed at obtaining information concerning the most outstanding characteristics of the population under study, among them, type of accommodation or place of residence. The second section includes all other questions aimed at collecting information related to the specific objectives of this research, such as season (high or low). An ad-hoc survey was then carried out from 2016 to January 2020, allowing a much more precise knowledge about the visitors to the parks. The visitors were interviewed in a face-to-face procedure for around 15 min.
The ad-hoc survey allowed us to obtain a much more precise knowledge of visitors to the NP, with the following composition: (1) Visitors from more than 20 countries, with the highest percentages of non-resident visitors being German and British; (2) Domestic tourism represented around one third of the total population of visitors.
On the other hand, and with respect to the team of interviewers, they were selected according to their language skills (English, Spanish, German, French and Russian), thus responding to the languages most frequently used by visitors to the Canarian National Parks as a whole. This allowed each respondent to be interviewed in his or her own language. Once selected, the interviewers were specifically trained to carry out the survey. For example, in the case of visits by organized groups or family or friends, the interview was carried out with a single member of the group or family unit and the interviews were distributed among the different visit points, according to the approximate frequency of visits to each point.
The interviewees were selected randomly using the simple random probabilistic sampling procedure, and were interviewed in situ in the different areas of the Canary Islands NP. For example, in the case of Teide National Park, interviews were conducted in the following areas: Cordada de García, in front of the Parador, Mirador del Llano de Ucanca, Parador de Turismo and in the Portillo area. For Caldera de Taburiente National Park, interviews were conducted at the Cumbrecita viewpoint, Roque de los Muchachos and the Barranco exit. In the case of Timanfaya National Park, visitors were interviewed at Echadero de los Camellos and Montañas de Fuego. In the case of Garajonay, visitors were interviewed at the main access points to the park.
Surveys were conducted in two phases during the period of 2016–2020. The first phase was conducted in the high season in winter and included Easter. The second was in late spring and early summer which is low season on the Canary Islands.
2.3. Variables
The variables considered in the analysis are of several types: economic (high/low season), travel characteristics (type of accommodation, National park visited), psychological (preservation perception) and geographical (country of residency of the tourist). In relation with the country of residency of the tourist, two different modalities are studied, domestic (Canary Island) residents and non-resident visitors. The outcome ‘type of accommodation’ is classified in four modalities: (1) hotel, (2) apartment, rural or rented houses, (3) own house, family or friend’s house and (4) cruise, camping and others (see
Table 1). Due to the low percentages of the remaining categories, we have grouped them in the last one due to the requirements of the statistical model regarding the availability of the data.
In reference to the type of accommodation and considering that any kind of new building will destroy the environment deeply and that ‘cruise, camping and others’ has an effect on the pollution, as well, it is possible to stablish a classification from the modality with the highest negative effect on the environment to the one with the lowest effect. Such an order will be as follows: (1) hotel, (2) apartment, rural cottage or rented houses, (3) cruise, camping and others and (4) own house, family or friend’s house.
In order to establish the previous classification, we have considered ‘new construction’ to be our limiting criterion, which is justified by the arguments collected by the authors in the literature review. In other words, this study parts from the idea that establishments that are already built and are not new touristic constructions generally have a lesser impact on the territory and its natural resources than those that are newly built with the sole purpose of touristic development. Indeed, hotels and apartment buildings built for tourism represent a greater impact at the moment of their construction in terms of occupancy and soil contamination than, for example, others that are simply rehabilitated for this purpose and that were already part of the local scenery. Following this logic, using private houses or family and friends as touristic accommodations would be the establishments with the least amount of impact on the environment.
For seasonality, following [
30] and in order to measure it for the Canary Islands,
Figure 1 shows that seasonality is not exclusively concentrated in the summer months, but is in fact distributed throughout the year, with March and October standing out above the rest. Furthermore, we can verify that the skewness is negative although quite low, approaching 0 (symmetry) for the last two years. Hence, the peaks would be found in the second half of the year. Regarding kurtosis, we realize that, over the years, its value increases, going from being platykurtic to leptokurtic. Therefore, the peaks would be accentuated over time, marking seasonality.
Another variable included in the analysis is the Canary Islands national parks, namely: Garajonay, Caldera Taburiente, Teide and Timanfaya (see
Figure 2). In Spain, there are diverse types of national parks (NPs), the Canary Island National Parks are some of these. However, even among the Canary Island NPs, you can find differences. For example, within the Teide, Garajonay and Caldera de Taburiente NPs going for walks and hiking in the parks are allowed. By contrast, in the Timanfaya NP it is forbidden to go hiking in order to preserve the lava landscape as a natural resource that is considered an important part of the island’s natural heritage by the local population. In relation to accommodation, there are some private buildings inside the parks, but relatively few and new constructions have been banned. Currently, some beds are offered by the public authorities in shelters—not privately owned—and in camping areas inside the parks. Nevertheless, the number of beds offered within the parks is limited due to the environmental impact they could have.
Finally, the variable preservation is in relation with the evaluation of natural resources preservation by the visitors (low, medium and high).
2.4. Sampling Technique
Simple random probabilistic sampling was used with 1671 surveys carried out and fieldwork organized in two phases. The first phase of interviews was made in the high season on the Islands, including the Easter period. The second phase in low season corresponded to late spring, summer and beginning of autumn. A reliability of ±2δ was achieved, as a function of the sample size,
n = 1671. The maximum estimation error of the proportions calculated on the total of main variables, under the assumption of dichotomy, appears in
Table 2.
Table 3 shows the sociodemographic profile of the participants that completed the survey and how they relate to the typical tourists expected in the Canary Islands. As domestic residents are our main research objective, visitors from the Canary Islands are included in the third category of ‘place of residence’ with a relevant proportion.
2.5. Analysis Technique: Multinomial Logistic Regression Model
Regarding an appropriate modeling method involving the relationship between a categorical outcome variable and a set of covariates, the multinomial logistic regression model represents an interesting option. This method has the advantages of being applicable to dependent binary or dichotomous variables. However, although the literature has a solid foundation in linear regression methodology, there is not much on this particular method of multinomial logistic regression model.
Although there are a few papers which apply the multinomial logistic regression model for segmenting tourism markets [
82,
83,
84,
85,
86,
87,
88,
89,
90], none has focused explicitly on the current relationship among accommodation type, season and country of origin of the tourists.
Therefore, the analysis technique applied is multinomial logistic regression model (MLRM). For this technique to estimate parameters, a general method called maximum likelihood is used. In order to apply this method a likelihood function must be built, with the resulting estimators being those which agree most closely with the observable data. Following model fitting, the first task to begin with is to evaluate its adequacy. To do this, whether the independent variable is ‘significantly’ related to the dependent one is analyzed, and whether the predicted values are an accurate representation of the observed values, i.e., the goodness-of-fit. To proceed with the goodness-of-fit analysis, the logistic regression is based on the log likelihood function [
91].
In the following section, the distribution of the preservation value of the natural resources of the Canaries National Parks will be studied for residents and non-resident. After being calculated, a crossing or contingency of tables of a new combined variable—SEAS_RESID—with ‘type of accommodation’, a multinomial logistic regression model is applied in order to identify the actual role of season, place of residence and accommodation establishment used for the visitors to the parks.
3. Results
3.1. Canary Islands National Parks
The Canary Islands National Parks (CNP) are unique places with two contradictory features: they are the islands’ main tourist attraction and, therefore, are very much in demand by visitors and, conversely, as an organization, it has to combine this reality with its main function, which is to preserve the implicit value of being a protected area. These peculiarities are two sides of the same coin: if the park is attractive, people want to see it. Therefore, the challenge that the CNP must face is to maintain and even increase its attractiveness as a natural resource, and to turn the landscape’s singularity into something profitable while making it compatible with its nature as a protected area; in short, to place national parks within a sustainable tourism development model.
At the current moment in time, the four national parks in the Canaries are experiencing the largest volume of visitors per region in Spain. Thus, the importance of the visits to CNP can be better appreciated when compared to the other Spanish National Parks (see
Table 4). The Canaries National Parks are undoubtedly the most visited parks in Spain. For the period between 2010 and 2017 there is a noticeable increase in the number of visits, which could be related to the development of the economy as well as other international circumstances. All this leads to an outstanding recovery in 2017.
Considering its protected status, the CNP’s visitor capacity must be compatible with the wider sustainability of the area. Therefore, in order to manage the park efficiently, it is necessary to abide by the principals of sustainability. This circumstance means that any profitability strategies designed for the CNP must have access to complete information about its visitors. Additionally, it must be taken into account that the impact of the daily flow of tourists to the park is not only within its boundaries but also before arriving and in its transit areas. For this reason, it is important to consider the externalities or dragging effects generated by a visit to the park.
Therefore, in order to analyze the park’s impact, we will consider the effect of visitors in the trip from their place of residence (temporary, in the case of tourists) to the park and their return; that is, quantifying the direct effect on nearby populations. Along the way, in the group of nearby towns, we can distinguish the municipalities visitors will contact before entering the park from those that are part of the CNP itself. Moreover, we will also consider visitors’ points of departure: touristic and non-touristic areas. These locations are where they normally stay in the island either in tourist establishments, their own homes, or those of family members or friends, in addition to cases of accommodation on cruise ships and in camping areas.
Finally, visitors who can go on an excursion or even stay in a CNP establishment can be classified into several groups: local population, from the island, tourists from other Canary Islands, the mainland or the Balearic Islands and, finally, international tourists. Some of the CNP contains accommodation establishments inside (Parador hotel, shelters, or camping area, for example). Based on the relevance of this natural resource in the islands’ touristic offer, this study includes some specific notes about visitors, particularly when they are tourists.
3.1.1. National Parks and the Characteristics of the Tourism in the Canary Islands
Tourists travel from their place of residence to tourist destinations attracted by the destination’s attraction system (pull motivations). Each destination offers a set of features that comprise [
92] the attraction system, among which there can be heritage elements and natural resources that are a key component for different types of tourism: green tourism, ecological tourism, scientific tourism, tourism of nature, among others.
Although the 2008 economic crisis had an impact on tourism, slowing down the entry of visitors to the Canary Islands territory (the evolution from 2010 to 2017 is shown in the
Table 5), in recent years there has been some recovery: a total of 14,214,222 entries for the year 2017 arriving on all seven islands, which represents a 34.89% increase compared to the year 2010.
Visitors to the CNP comprised 52.16% of the total number of tourists in 2017. This ratio shows the CNP’s attractiveness quite clearly. However, the ratio of tourists coming to the island and visiting the CNP was lower in 2010 (45.93%). This circumstance calls for a differentiated and not strictly touristic study for the park’s natural resources since the data contained in the table refers to tourists arriving at the airport on direct international flights. Therefore, this data does not include other visitor segments such as Mainland or Balearic visitors (the most affected during the crisis), local visitors, visitors from other islands, or those arriving by ship, in the case of cruise ships, for example.
In fact, as we can see in
Table 6, the number of tourists arriving in the Canaries on direct international flights increased 7.2% in the year 2017 compared to the previous year 2016. In contrast, the number of visits to the parks during this period only increased by 3.5%. Thus, this data indicates that the number of visits to the park is closely linked to segments that are not necessarily international.
3.1.2. Tourism Intensity
The situation described above in relation with the number of visits relates to the study of the park’s heritage value and its carrying capacity.
Table 7 shows the evolution of the ratio number of visitors per area unit for the CNP from 2010 to 2017.
As can be seen in
Table 7 the ratio of visitors by hectare has been increasing considerably from 2010 (147.7) to 2017 (226.1). Conversely, the rate of bed capacity for tourist accommodation per square kilometer (see
Table 8) shows the importance of touristic bed capacity per area unit for each of the islands containing national parks during the 2010–2017 period. Lanzarote (Timanfaya National Park) and Tenerife (El Teide National Park) are the islands with the highest ratio.
The value of the CNP as a natural resource in terms of the heritage it represents for future generations is a responsibility for its managing authorities to conserve under the framework of sustainable resource management, especially when considering national parks’ limited visitor quota due to their status of geographically protected areas. Surpassing a certain number of visitors leads to external diseconomies (congestion, environmental impact, etc.) and, subsequently, to the managing authorities having to face the difficult situation of having to solve the contradiction of a socially-demanded increase in visits and the need to protect the environment.
Summing up the previously discussed issues, this study will encompass the following aspects: The segmentation of the visitor population to the CNP based on their place of residence, domestic or non-resident visitors, the accommodation establishment, and the season they come. This choice is based on the idea that the aforementioned variables have an important effect on the environment and, consequently, on the natural resources of the Canary Islands both within and outside the national parks.
3.2. Distribution of the Preservation Value for Residents and Non-Resident
The survey included a question on the preservation value visitors assigned to the preservation level of the natural resources in the CNP. The range of possible answers was established in a scale from 1 as the lowest valued to 10 the highest one. The results contained in
Figure 3 and
Figure 4 indicate that all the visitors consider the preservation level of the natural resources high. However, some different answers between resident and non-residents were found. Interestingly, the comparison of the level of preservation for these two groups shows significantly differences between the two average values with
p = 0.000 < 0.05, being the preservation value of resident lower than the non-resident one.
On the other hand, the comparison of the preservation value among the four parks indicates a different result for the place of residence of the visitors, as well (see
Figure 5).
Regarding the valuation for each park, the lowest rated by residents is El Teide and the highest Timanfaya. Non-residents agree with residents that they rated Timanfaya the highest value; they assigned the worst rating to the preservation status of Garajonay. Then, the worst valued park by residents and non-residents is El Teide, precisely the one with the largest influx of visitors (see
Table 1); in fact, it is not only by far the most visited national park in the Canary Islands, but also in Spain as explained in the previous sections.
3.2.1. Accommodation Inside
For the Canaries National Parks, visitors are allowed to stay within the parks. In fact, there is a four-star hotel called El Parador (El Teide), own houses, family or friends’ houses (Caldera de Taburiente, El Teide), camping areas (Caldera de Taburiente, El Teide, Garajonay) and a shelter (El Teide).
The percentage of total visitors sleeping within the parks is of 14.3% (see
Table 9).
In proportion to the total of each group, the percentage of resident visitors staying within the parks is significantly higher than the percentage of non-resident visitors: 26.91% for residents sleeping within the park and 11.26% for non-residents (see
Figure 6).
Results show that all the visitors consider the preservation level of the natural resources to be high. However, different answers are found between visitors staying outside the parks and those sleeping inside. Actually, the comparison of the level of preservation for visitors accommodated inside (8.27) is lower than the valuation for visitors sleeping outside the parks (8.66). Indeed, the comparison shows significantly differences between the two average values with p = 0.000 < 0.05. Visitors staying outside better assess the conservation status of the park’s natural resources and the proportion of those staying within the park is superior in the case of residents.
In short, resident visitors value the conservation status of the park’s natural resources at a lower level and are more often housed in establishments located inside the parks. Perhaps by staying longer and touring the parks have a closer idea of the conservation of natural resources within the park. Non-residents basically stay in the park for only a few hours.
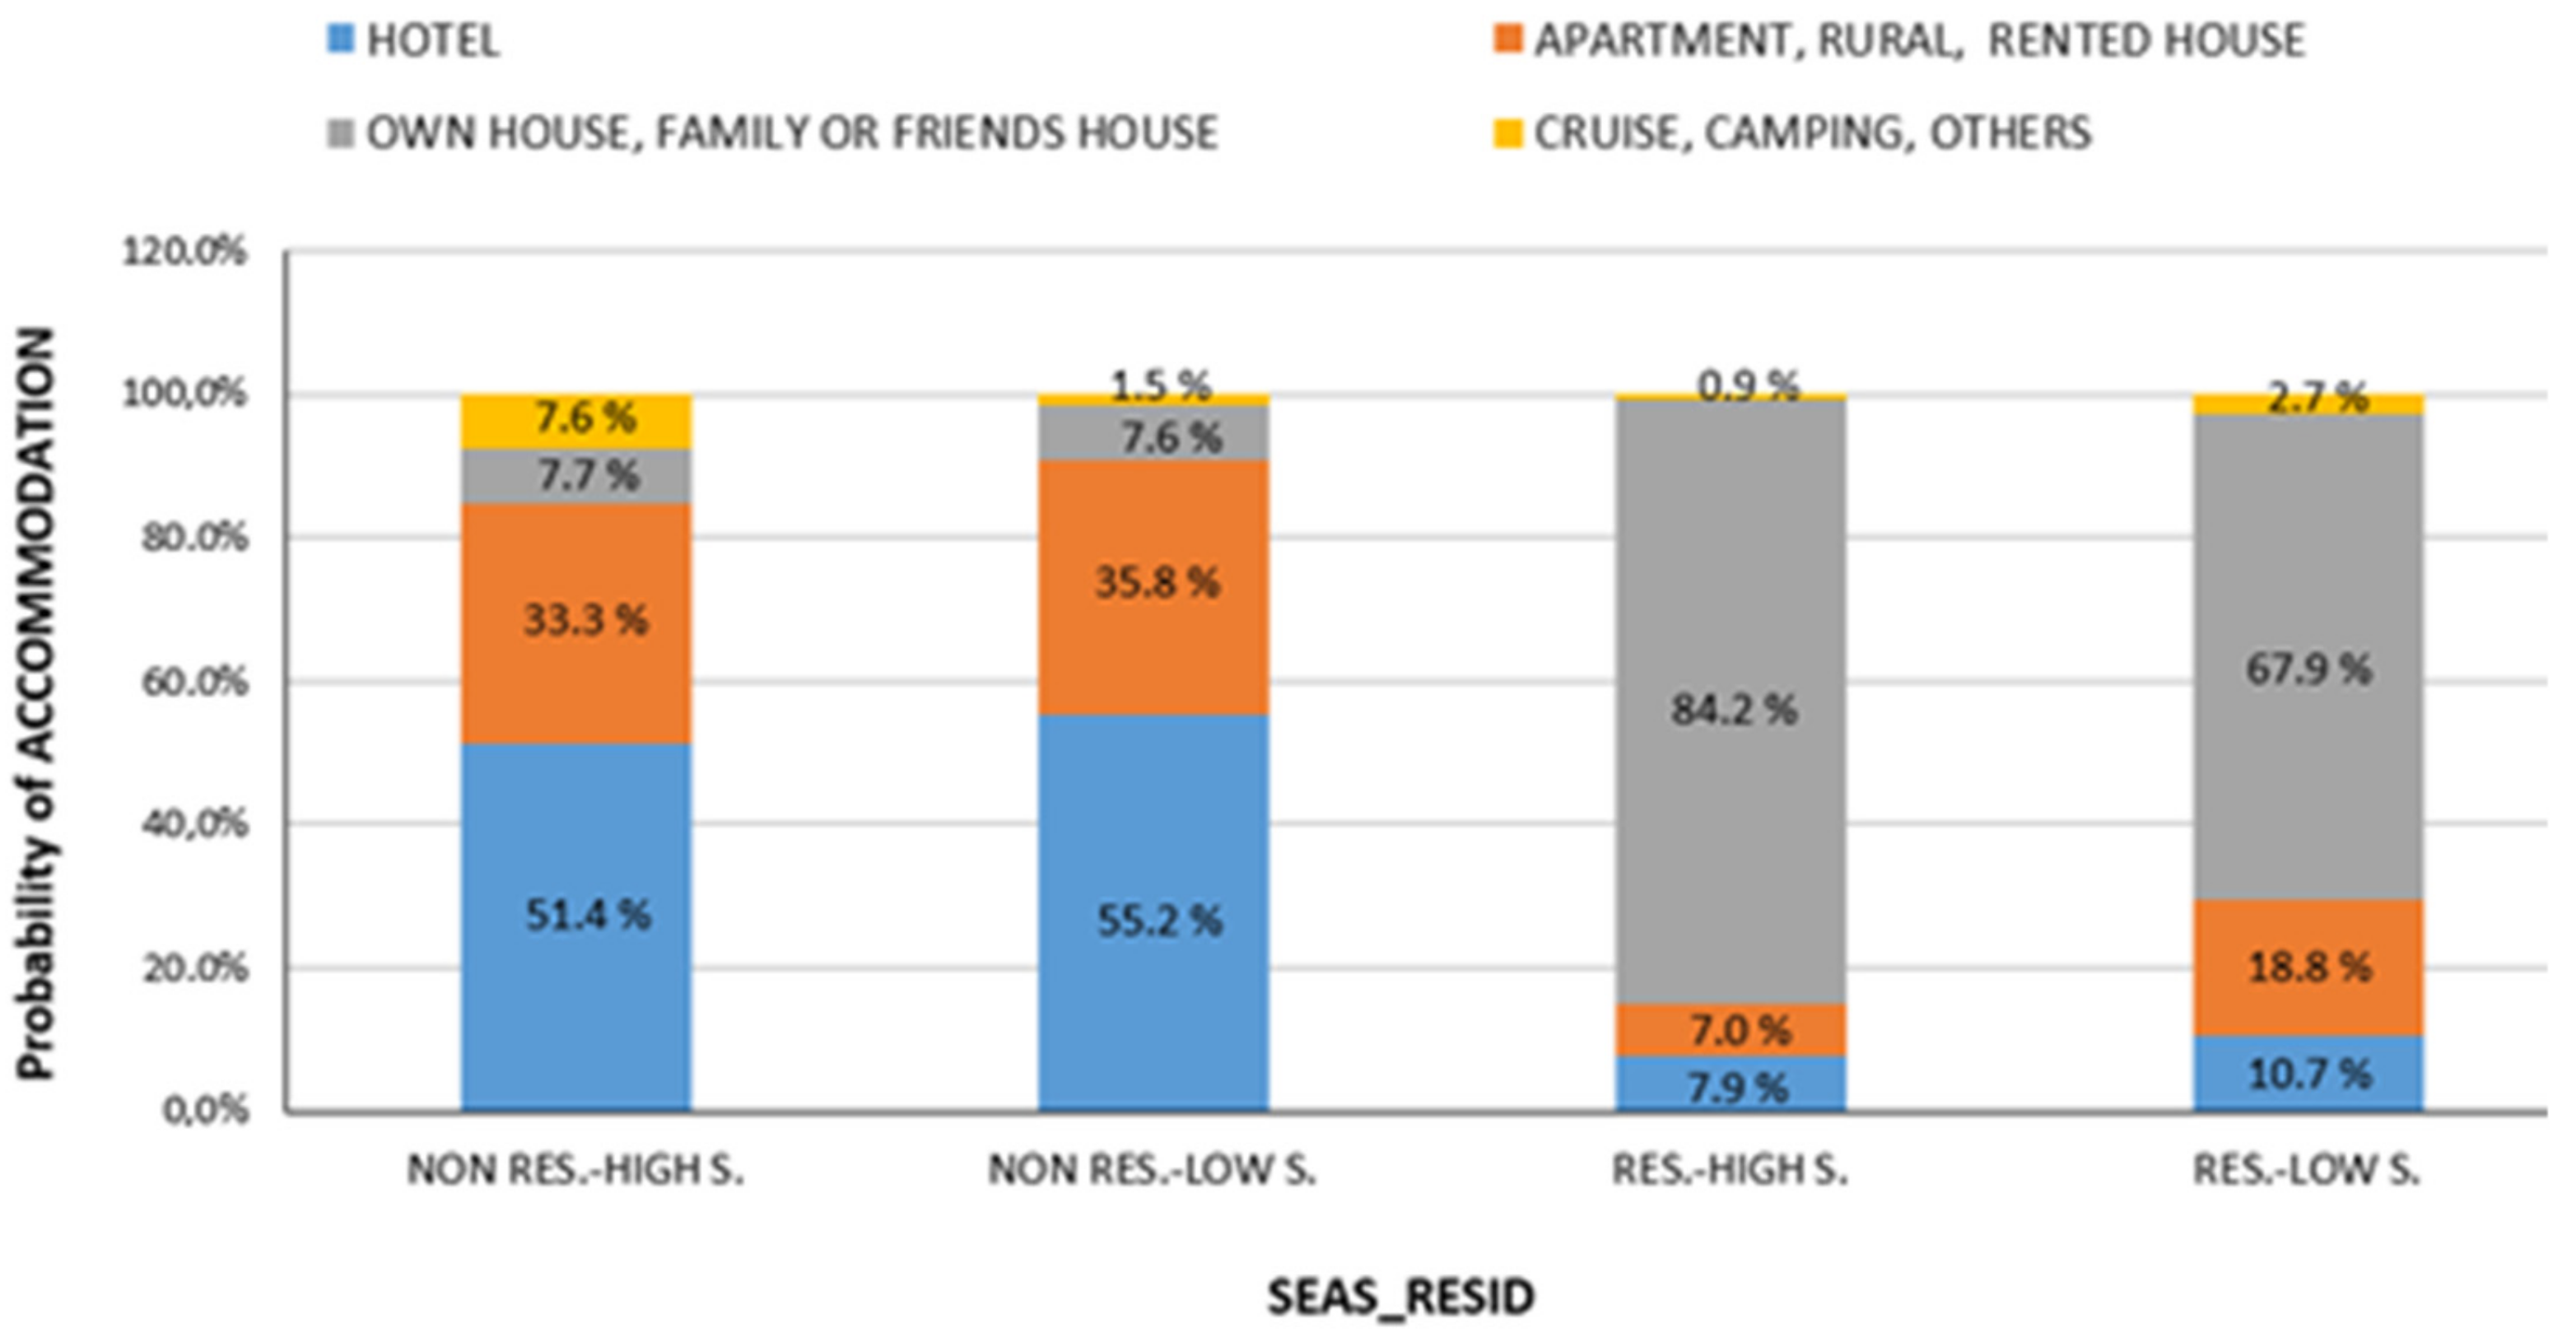
3.2.2. Crossing or Contingency Tables of SEAS_RESID with Type of Accommodation
In searching for the role played by seasonality in domestic or non-resident visitors to the CNPs, the dependent variables considered in the multinomial logistic regression model calculated have been accommodation. In terms of independent variables, we have chosen to create a variable that combines seasonality (high and low) with the resident or non-resident nature of a tourist. Moreover, after adding the variable ‘season’ the independent variable chosen has been renamed SEAS_RESID with the following categories: non-resident—high season, non-resident—low season, resident—high season and resident—low season. Its frequency distribution appears in
Table 10.
We have merged some categories of the variable type of accommodation to avoid null frequencies in the cells of the crossing or contingency tables with SEAS_RESID. So, the final structure of the variable includes the following four categories: (1) hotels (all categories); (2) apartment, rural cottage, rental house; (3) own house, family or friend’s house; (4) cruise, camping and others. The resulting crossing or contingency tables of SEAS_RESID with ‘type of accommodation’ is shown in
Figure 7.
In
Figure 7 we can observe that for residents ‘own house, family or friend’s house’ is by far the most frequent category relative to the next one, ‘apartment, rural, or rented house’, and hotels are at a far third place. Despite the weight of ‘own house, family or friends’ house’ for this resident segment, it should be mentioned that different behaviors can be observed in this contingency chart between residents who visit the parks during the high and the low season: the latter use more often ‘own house, family or friend’s house’, whereas for the former, hotels are the establishment used more often.
Regarding non-residents, there are no notable differences between high and low season visitors, but the lesser relevance of the ‘cruise, camping, others’ category should be noted for non-residents coming during the low season. For the other categories, their use is nearly the same as that of non-residents.
3.2.3. Results from the Multinomial Logistic Regression Model Application
A multinomial logistic regression model was performed for Type of accommodation (dependent variable) on SEAS_RESID (independent variable coded using dummies).
The test included in
Table 11 shows that the independent variable, SEAS_RESID, is statistically significant (with a value of Chi-square of 1357.587 and a value
p = 0.000 ≤ 0.05). Therefore, the influence of SEAS_RESID on Type of accommodation has been confirmed. In reference to the quality of the MLRM, we also get high values (0.557 and 0.594) for the pseudo R-Squared, so the model seems to be a good fit. In this case, the percentage of correct classifications of the Type of accommodation for each category of SEAS_RESID achieves a reasonable value of 57.8%.
To interpret the regression parameters more easily, we consider the MLRM without intercept (see
Table 12). All the odds ratios and the estimated probabilities of each category of the dependent variable ‘type of accommodation’ appears in
Table 13 and
Figure 8.
From the analysis of the previous results, we can conclude that:
For non-resident visitors, there is no seasonality effect on the type of accommodation because the probabilities (and also the odds ratio) are very similar for the high and low seasons. For these visitors, the most probable type of accommodation is a hotel (nearly 50%). This probability is approximately two times greater than the probability of ‘apartment, rural cottage or rented house’ (see the odds ratio for p1/p2 in
Table 13).
The behavior of resident visitors seems to be very different because the most probable type of accommodation is ‘own house, family or friend’s house’. In this case, the seasonality effect appears when we compare, for example, the probability of this category, p3, with, for example, p1 (hotel) and p2 (apartment, rural cottage and rented house). In the low season, the probability of ‘hotel’ and ‘apartment, rural cottage and rented house’ is 29.5% (see the odds ratios for p1/p3 and p2/p3, respectively). However, in the high season, the probability of ‘hotel’, and ‘apartment, rural cottage and rented house’ is only 14.9%. Therefore, we can conclude that the domestic visitor considerably increases the probability of selecting another type of accommodation such as ‘hotel’ or ‘apartment, rural cottage and rented house’ when changing from the high to low season, instead of ‘own or friend’s/family’s house’.
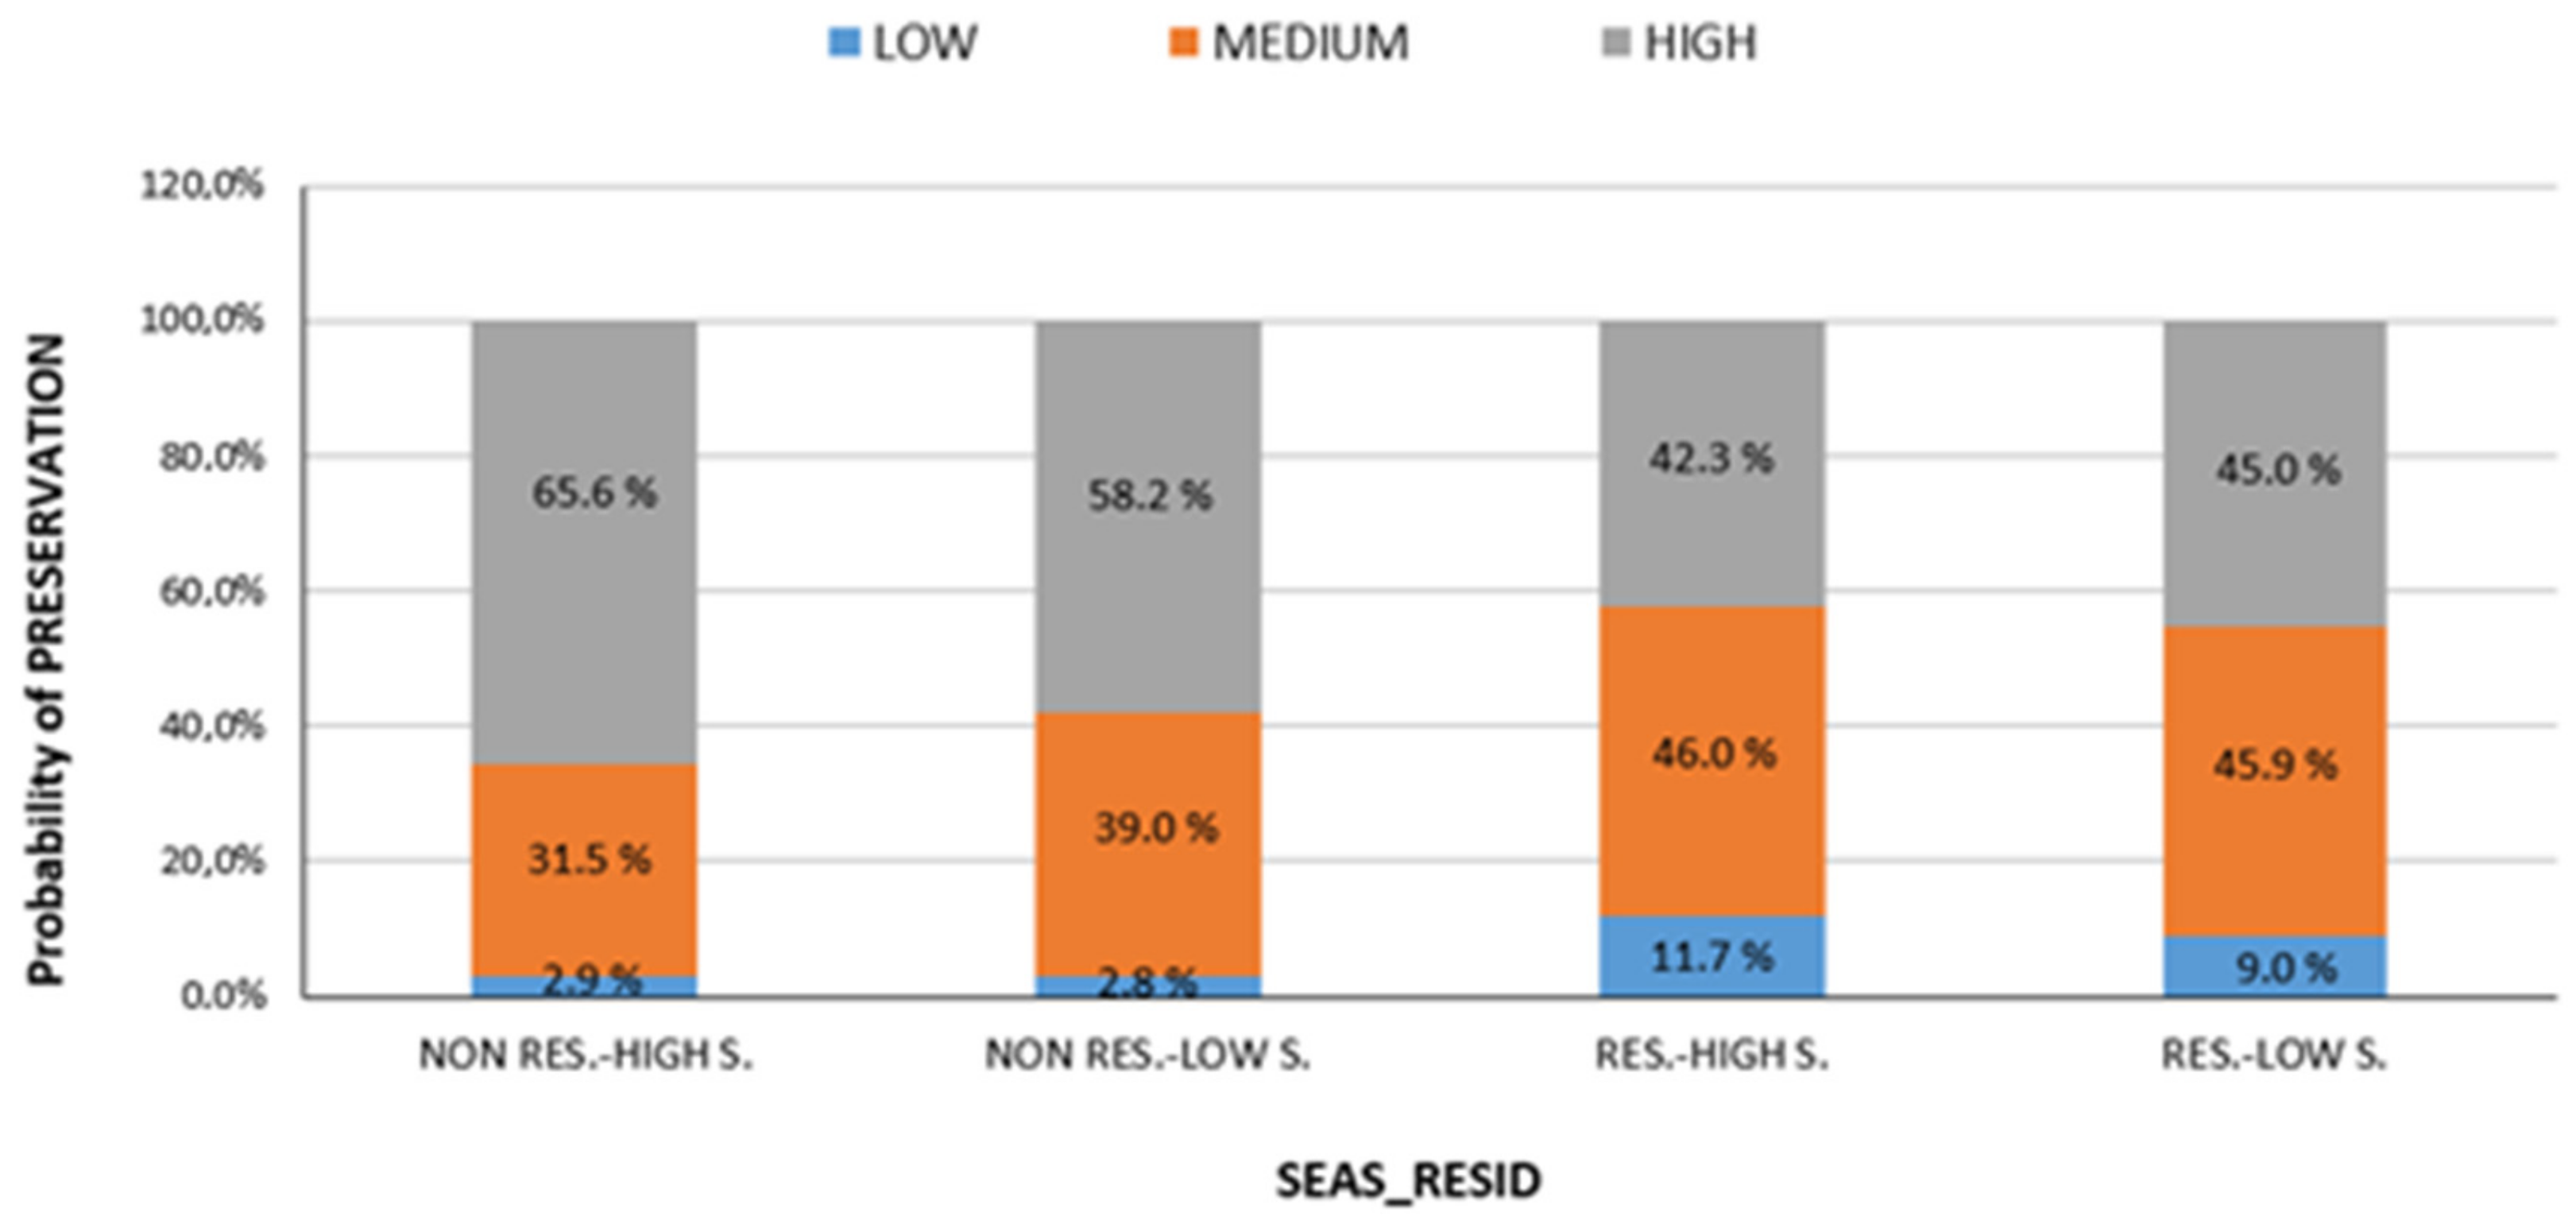
A multinomial logistic regression model was also performed for preservation as dependent variable on SEAS_RESID (independent variable coded using dummies).
The test included in
Table 14 shows that the independent variable, SEAS_RESID, is statistically significant (with a value of Chi-square of 999.980 and a value
p = 0.000 ≤ 0.05). Therefore, the influence of SEAS_RESID on Preservation has been confirmed. In reference to the quality of the MLRM, we also get high values (0.454 and 0.510) for the pseudo R-Squared, thus the model seems to be quite a good fit, as well. In this case, the percentage of correct Preservation classifications for each category of SEAS_RESID reaches a value of 59.7%. Considering the MLRM without interception (see
Table 15) results odds ratios and estimated probabilities for each category of the dependent variable “preservation”, as it is shown in
Table 16 and
Figure 9.
The column p3 (high)/p2 (medium) reflects that:
For residents, there is no effect of seasonality on the higher preservation scores, as the probability that they will value preservation with a medium and high score in the high and low seasons is quite similar (odd-ratio close to 1).
In the case of non-residents, differences do exist. To begin with, the probability that they value conservation with a high rating is 50% superior to the medium rating in the low season and 100% in the high season. Therefore, the season does have an important influence.
Therefore, non-residents who visit the destination in high season are those who give the best rating to the state of preservation of the parks’ natural resources. Residents who visit the parks in high season, on the other hand, are the ones who give the lowest value to the state of conservation of the parks. This shows a very different perception of the state of conservation of natural resources according to the geographical origin of the visitors.
4. Discussion and Conclusions
The results achieved draw attention to the existence of a potential conflict of objectives. The availability of a range of quality natural resources determines the attraction of an area in the context of tourist markets. However, the development of the tourism sector and the construction of buildings that it entails, have an ambivalent impact. On the one hand, tourism creates employment and generates economic income, improving the quality of life of the local population. On the other hand, the development of this sector, when it reaches levels of mass tourism development, results in a deterioration of natural resources leading markets to an adverse selection.
The influence of seasonality for domestic or non-resident visitors on variables such as “accommodation” and “preservation” has scarcely been tackled from an empirical perspective. Therefore, the focus on the accommodation or preservation as the dependent variable with the two others (season and place of residence) as explicative ones is an important contribution of this analysis. In this sense, looking for the best methodological approach to overcome the above difficulties, the multinomial logistic regression model (MLRM) may offer an effective solution.
The main contribution of this paper is determining differences in behavior between domestic (Canary Island) visitors and non-resident visitors. For example, the results confirm that residents who visit the parks in high season tend to give the lowest values to the state of the parks’ conservation. By contrast, non-residents who visit the parks in high season give the highest values for their conservation. This shows the very different perceptions of the state of conservation of natural resources according to the geographical origin of the visitors. This result would not be possible in an analysis without segmenting the tourism market by the domestic/non-resident variable. Likewise, the success of the analysis to segment using the domestic/non-resident variable in a destination with a low seasonality is another important contribution of this paper. In fact, no previous relevant papers have been found with these results.
The resulting fitted model is interpreted within the context of a specific applied problem, analyzing the seasonality for domestic or non-resident visitors, considering the role played by “accommodation” chosen by visitors to the CNP. Indeed, the important role found for accommodation by season in the results has been useful for determining the characteristics that seasonality adds to this specific variable. This is of a high importance due to the difficulty of finding significant data for low season in the majority of tourism destinations.
Based on the results obtained, the main conclusion is as follows:
The first hypothesis is fulfilled. Therefore, it is possible to perform a quantitative analysis of the seasonality of the accommodation used by tourists, particularly when differences in domestic and non-resident visitors’ behavior is the main research topic. The second hypothesis is confirmed as well, as seasonality has a strong influence on accommodation type for the case of domestic tourism. Moreover, domestic visitors have different perceptions of the natural resource conservation status in national parks. The influence of the variables season/resident–non-resident on conservation has been confirmed and residents who visit the parks in high season are the ones who give the lowest value to the parks’ conservation state. Therefore, the third hypothesis is also fulfilled. Finally, the fourth hypothesis is tested for those empirical studies in which no continuous variables are considered, choosing the accurate dependent (accommodation or preservation value) and independent variables (domestic/non-resident or season) will be effective using a MLRM.
This analysis can lead to the development of appropriate actions aimed at achieving environmental objectives, through the control of type of accommodation distribution throughout the year in a destination. In fact, the results highlight the important influence of season for domestic visitors to the Canary Island national parks when choosing type of accommodation. In sum, and for this particular segment, ‘own house, family or friend’s house’ are used in the high season and ‘hotel’ or ‘apartment, rural cottage and rented house’ in the low one. However, and by contrast, for the non-resident segment, no significant seasonality effect on choosing an accommodation was observed, for these visitors, the most probable type of accommodation is a hotel during all the year. As a relevant result, too, it is important to consider the different value residents assess to the preservation level of natural resources, lower in high season. Of special significance is the case of visitors that stay inside the parks, those have very deep information on the level of preservation of the natural resources, and its valuation is lower than visitors sleeping outside the parks.
Policy Recommendations
In light of these results, it should be reminded that the main objective of this research is to understand the national park visitors’ use of touristic accommodation according to their resident or non-resident status and its value of the natural resources preservation. Ultimately, the aim is to develop differentiated strategies for each group depending on their greater or lesser impact on the environment where they stay and their perceptions.
In the analysis we have introduced the role of seasonality based on the idea that the different segments’ behavior would differ according to each season, and the results have confirmed this theory. The application of the logit model has clearly shown that non-residents follow a similar pattern during the high and low season, staying mostly in hotels. In contrast, residents behave differently during each season.
Furthermore, seasonality can indeed be seen as a conditioning factor for domestic visitors to the island when choosing an accommodation establishment. Thus, when developing a set of environmental policies for tourism where the visitors to this touristic natural resource are considered (referring to national parks), policymakers will have to elaborate a single strategy to be applied throughout the year for non-residents on one hand, and on the other, different measures for domestic visitors depending on the season.
Starting from a general principle of non-application to small islands, such as similar use of natural tourism policies as in continental territories, the analysis allows us to reflect on the most relevant environmental tourism policy recommendations for national parks located in small islands and their insular environment in general. Such recommendations could include:
Domestic visitors who visit the national parks in high season use their own/family/friends’ houses, which are considered non-polluting accommodation. So, promotional plans for domestic tourism to national parks and the islands in high season should promote staying mostly in establishments that are not newly built or in ones with the least impact on water, air and land pollution levels. This would be the most recommended segment from an environmental standpoint. However, domestic visitors that come to the national parks in low season should be included in promotional plans too, as they contribute to balancing the number of visits throughout the year. They stay more frequently in apartments, rural or rented houses. Some of these buildings may have environmental impacts as they have involved new construction while some others have not. The latter is the case of rural cottages, which are usually renovated buildings. Therefore, for these types of visitors, the promotion strategy should be to encourage them to choose less or non-polluting accommodation.
Additionally, not only promotional actions, but other kinds of measures could be implemented. For example, tax incentives and subsidies for entrepreneurs that decide to renovate rural houses and offer them as tourist accommodation could be provided. For both domestic and non-resident visitor segments, regulations that forbid the construction of new tourist accommodations with a high land consumption could be implemented. This is particularly important in small islands where the land is a limited resource.
Moreover, there could be initiatives for the use of camping and shelters in low season. In high season, given the abundant number of visitors staying within the park, this measure would not be possible due to its potential environmental impact. Thus, these initiatives could be managed in the low season by offering new places in camping or shelters in the areas surrounding the national parks or by giving incentives or special services. The incentives could be related to free or discounted bed offers, for example. The new services could include, among others, free security services in the camps or shelters.
For both domestic and non-resident segments and specifically for high season visitors, a fine could be imposed for behaviors that generate negative environmental impacts. Examples of these kinds of undesirable behaviors could be stepping on the lava in the Timanfaya or El Teide NPs or camping without the required authorization in La Caldera National Park.
The results show that domestic visitors staying within the parks give the lowest value to the conservation status of natural resources. Perhaps by staying longer and touring the parks, visitors have a better idea of the conservation of the natural resources within the parks. This is true to the extent that those who stay in the park will have a better knowledge of the state of conservation of the natural resources since they tour the parks. Therefore, it would be important to carry out periodic surveys of this second group on their assessment of the park. The survey would also allow us to know their demands for services from the parks’ management bodies.
Moreover, it would be worthwhile implementing some general recommendations based on the idea of sustainable buildings, as established in the literature review. Development of plans aimed at rehabilitation rather than the new construction of hotel and non-hotel establishments in the Islands. Encouragement of the evolution of the construction sector on the Islands towards ‘green building’ models, based on the use of non-polluting materials and the use of energy efficient production processes. Promotion of environmental awareness, tilting the demand for tourism accommodation towards those buildings that have been built with clean technologies.
Indeed, tourism is not as certain behaviors seem to suppose, an economic activity without maintenance costs. In addition to the infrastructures, maintenance and conditioning services are needed that also prevent deterioration of the natural environment.
For the future, deeper and more sustained research into the accommodation sector and its contributions to tourism more broadly need to be investigated, as does the role accommodation does, or more likely can, contribute to the wider sustainability of destinations. No longer can accommodation be managed, or researched, in isolation, with it representing a core and integral component of the wider tourism system. By way of example: local lodging establishments such as AirBnB have been banned by the Canary Islands government during most of the period when we were doing the research. However, rural houses are legal forms of the accommodation establishment, and they have had reasonable occupation rates during the COVD19 crisis. Therefore, it would be beneficial for future research to provide some details on the complementarity of local accommodation facilities with local life: the level at which they are shared with the local population, which is obviously essential for their environmental impact and the sustainability of tourism as a whole. In this way, there are more than just economic reasons involved in choosing between high or low season, there are also social ones. As an example, in high season, domestic visitors use their own/family/friends’ houses. This is mainly because in high season, such as winter and Easter, social habits among the local population give rise to visits to their family and friends for vacations.


