
Glycosylation Biomarkers Associated with Age-Related Diseases and Current Methods for Glycan Analysis


Abstract
:1. Introduction
2. Glycans Associated with Ageing and Age-Related Diseases
2.1. Chronological Ageing
2.2. Neurodegenerative Diseases
2.3. Cancer
2.4. Type 2 Diabetes Mellitus
2.5. Metabolic Syndrome and Related Diseases
2.6. Chronic Inflammatory Diseases
3. Glycomics Techniques
3.1. Sample Preparation
3.2. Determination Techniques
3.2.1. Fluorescence Detection
Lectin-Based Microarray
Liquid Chromatography
Capillary Electrophoresis
3.2.2. Mass Spectrometry Detection
Matrix-Assisted Laser Desorption/Ionisation Mass Spectrometry
Liquid Chromatography Coupled to Mass Spectrometry
MS Fragmentation Methods
Sialic Acid Containing Glycan Analysis
Isotopic Labelling
Ion Mobility
MS Analysis Tools
3.2.3. Nuclear Magnetic Resonance
4. Conclusions
Author Contributions
Funding
Institutional Review Board Statement
Informed Consent Statement
Data Availability Statement
Acknowledgments
Conflicts of Interest
References
- Van Den Steen, P.; Rudd, P.M.; Dwek, R.A.; Opdenakker, G. Concepts and principles of O-linked glycosylation. Crit. Rev. Biochem. Mol. Biol. 1998, 33, 151–208. [Google Scholar] [CrossRef]
- Miura, Y.; Endo, T. Glycomics and glycoproteomics focused on aging and age-related diseases—Glycans as a potential biomarker for physiological alterations. Biochim. Biophys. Acta Gen. Subj. 2016, 1860, 1608–1614. [Google Scholar] [CrossRef]
- Woodin, C.L.; Maxon, M.; Desaire, H. Software for automated interpretation of mass spectrometry data from glycans and glycopeptides. Analyst 2014, 138, 2793–2803. [Google Scholar] [CrossRef] [Green Version]
- Ohtsubo, K.; Marth, J.D. Glycosylation in cellular mechanisms of health and disease. Cell 2006, 126, 855–867. [Google Scholar] [CrossRef] [Green Version]
- Dennis, J.W.; Granovsky, M.; Warren, C.E. Protein glycosylation in development and disease. BioEssays 1999, 21, 412–421. [Google Scholar] [CrossRef]
- Handerson, T.; Camp, R.; Harigopal, M.; Rimm, D.; Pawelek, J. B1,6-branched oligosaccharides are increased in lymph node metastases and predict poor outcome in breast carcinoma. Clin. Cancer Res. 2005, 11, 2969–2974. [Google Scholar] [CrossRef] [PubMed] [Green Version]
- Anugraham, M.; Jacob, F.; Nixdorf, S.; Everest-dass, A.V.; Heinzelmann-schwarz, V.; Packer, N.H. Specific glycosylation of membrane proteins in epithelial ovarian cancer cell lines: Glycan structures reflect gene expression and DNA methylation status. Mol. Cell Proteomics 2014, 13, 2213–2232. [Google Scholar] [CrossRef] [PubMed] [Green Version]
- Li, X.; Wang, H.; Russell, A.; Cao, W.; Wang, X.; Ge, S.; Zheng, Y.; Guo, Z.; Hou, H.; Song, M.; et al. Type 2 diabetes mellitus is associated with the immunoglobulin G n-glycome through putative proinflammatory mechanisms in an Australian population. OMICS 2019, 23, 631–639. [Google Scholar] [CrossRef] [PubMed] [Green Version]
- Lemmers, R.F.H.; Vilaj, M.; Urda, D.; Agakov, F.; Šimurina, M.; Klaric, L.; Rudan, I.; Campbell, H.; Hayward, C.; Wilson, J.F.; et al. IgG glycan patterns are associated with type 2 diabetes in independent European populations. Biochim. Biophys. Acta Gen. Subj. 2017, 1861, 2240–2249. [Google Scholar] [CrossRef] [PubMed]
- Kailemia, M.J.; Park, D.; Lebrilla, C.B. Glycans and glycoproteins as specific biomarkers for cancer. Anal. Bioanal. Chem. 2017, 409, 395–410. [Google Scholar] [CrossRef] [PubMed]
- Vanhooren, V.; Dewaele, S.; Libert, C.; Engelborghs, S.; De Deyn, P.P.; Toussaint, O.; Debacq-Chainiaux, F.; Poulain, M.; Glupczynski, Y.; Franceschi, C.; et al. Serum N-glycan profile shift during human ageing. Exp. Gerontol. 2010, 45, 738–743. [Google Scholar] [CrossRef] [PubMed] [Green Version]
- Franceschi, C.; Garagnani, P.; Morsiani, C.; Conte, M.; Santoro, A.; Grignolio, A.; Monti, D.; Capri, M.; Salvioli, S. The continuum of aging and age-related diseases: Common mechanisms but different rates. Front. Med. 2018, 5. [Google Scholar] [CrossRef] [PubMed] [Green Version]
- López-Otín, C.; Blasco, M.A.; Partridge, L.; Serrano, M.; Kroemer, G. The hallmarks of aging Europe PMC funders group. Cell 2013, 153, 1194–1217. [Google Scholar] [CrossRef] [PubMed] [Green Version]
- Minuti, A.; Patrone, V.; Giuberti, G.; Spigno, G.; Pietri, A.; Battilani, P.; Ajmone Marsan, P. Nutrition and ageing. Stud. Health Technol. Inform. 2014, 203, 112–121. [Google Scholar] [CrossRef]
- Kim, T.; Xie, Y.; Li, Q.; Artegoitia, V.M.; Lebrilla, C.B.; Keim, N.L.; Adams, S.H.; Krishnan, S. Diet affects glycosylation of serum proteins in women at risk for cardiometabolic disease. Eur. J. Nutr. 2021. [Google Scholar] [CrossRef]
- Vreeker, G.C.M.; Wuhrer, M. Reversed-phase separation methods for glycan analysis. Anal. Bioanal. Chem. 2017, 409, 359–378. [Google Scholar] [CrossRef] [Green Version]
- Geyer, H.; Geyer, R. Strategies for analysis of glycoprotein glycosylation. Biochim. Biophys. Acta Proteins Proteomics 2006, 1764, 1853–1869. [Google Scholar] [CrossRef] [PubMed]
- Wuhrer, M.; Deelder, A.M.; Hokke, C.H. Protein glycosylation analysis by liquid chromatography-mass spectrometry. J. Chromatogr. B Anal. Technol. Biomed. Life Sci. 2005, 825, 124–133. [Google Scholar] [CrossRef]
- Testa, R.; Vanhooren, V.; Bonfigli, A.R.; Boemi, M.; Olivieri, F.; Ceriello, A.; Genovese, S.; Spazzafumo, L.; Borelli, V.; Bacalini, M.G.; et al. N-Glycomic changes in serum proteins in type 2 diabetes mellitus correlate with complications and with metabolic syndrome parameters. PLoS ONE 2015, 10, 1–16. [Google Scholar] [CrossRef] [Green Version]
- Nilsson, A.; Santoro, A.; Franceschi, C.; Kadi, F. Detrimental links between physical inactivity, metabolic risk and N-glycomic biomarkers of aging. Exp. Gerontol. 2019, 124, 110626. [Google Scholar] [CrossRef]
- Wang, H.; Li, X.; Wang, X.; Liu, D.; Zhang, X.; Cao, W.; Zheng, Y.; Guo, Z.; Li, D.; Xing, W.; et al. Next-generation (glycomic) biomarkers for cardiometabolic health: A community-based study of immunoglobulin G N-glycans in a chinese han population. Omi. A J. Integr. Biol. 2019, 23, 1–11. [Google Scholar] [CrossRef] [Green Version]
- Vanhooren, V.; Desmyter, L.; Liu, X.E.; Cardelli, M.; Franceschi, C.; Federico, A.; Libert, C.; Laroy, W.; Dewaele, S.; Contreras, R.; et al. N-glycomic changes in serum proteins during human aging. Rejuvenation Res. 2007, 10, 521–531. [Google Scholar] [CrossRef]
- Šimurina, M.; de Haan, N.; Vučković, F.; Kennedy, N.A.; Štambuk, J.; Falck, D.; Trbojević-Akmačić, I.; Clerc, F.; Razdorov, G.; Khon, A.; et al. Glycosylation of immunoglobulin g associates with clinical features of inflammatory bowel diseases. Gastroenterology 2018, 154, 1320–1333. [Google Scholar] [CrossRef]
- Lundström, S.L.; Yang, H.; Lyutvinskiy, Y.; Rutishauser, D.; Herukka, S.K.; Soininen, H.; Zubarev, R.A. Blood plasma IgG Fc glycans are significantly altered in Alzheimer’s disease and progressive mild cognitive impairment. J. Alzheimer Dis. 2014, 38, 567–579. [Google Scholar] [CrossRef]
- Ge, S.; Wang, Y.; Song, M.; Li, X.; Yu, X.; Wang, H.; Wang, J.; Zeng, Q.; Wang, W. Type 2 diabetes mellitus: Integrative analysis of multiomics data for biomarker discovery. Omi. A J. Integr. Biol. 2018, 22, 514–523. [Google Scholar] [CrossRef]
- Kawaguchi-Sakita, N.; Kaneshiro-Nakagawa, K.; Kawashima, M.; Sugimoto, M.; Tokiwa, M.; Suzuki, E.; Kajihara, S.; Fujita, Y.; Iwamoto, S.; Tanaka, K.; et al. Serum immunoglobulin G Fc region N-glycosylation profiling by matrix-assisted laser desorption/ionization mass spectrometry can distinguish breast cancer patients from cancer-free controls. Biochem. Biophys. Res. Commun. 2016, 469, 1140–1145. [Google Scholar] [CrossRef] [PubMed] [Green Version]
- Leeflang, B.R.; Vliegenthart, J.F.G. Glycoprotein analysis: Using nuclear magnetic resonance. Encycl. Anal. Chem. 2012, 1–14. [Google Scholar] [CrossRef] [Green Version]
- Harvey, D.J. Identification of protein-bound carbohydrates by mass spectrometry. Proteomics 2001, 1, 311–328. [Google Scholar] [CrossRef]
- Mariño, K.; Bones, J.; Kattla, J.J.; Rudd, P.M. A systematic approach to protein glycosylation analysis: A path through the maze. Nat. Chem. Biol. 2010, 6, 713–723. [Google Scholar] [CrossRef] [PubMed]
- Jensen, P.H.; Kolarich, D.; Packer, N.H. Mucin-type O-glycosylation—Putting the pieces together. FEBS J. 2010, 277, 81–94. [Google Scholar] [CrossRef] [PubMed]
- Kennedy, B.K.; Berger, S.L.; Brunet, A.; Campisi, J.; Cuervo, A.M.; Epel, E.S.; Franceschi, C.; Lithgow, G.J.; Moritomo, R.I.; Pessin, J.E.; et al. Aging: A common driver of chronic diseases and a target for novel interventions. Cell 2014, 159, 709–713. [Google Scholar] [CrossRef] [Green Version]
- Dall’Olio, F.; Vanhooren, V.; Chen, C.C.; Slagboom, P.E.; Wuhrer, M.; Franceschi, C. N-glycomic biomarkers of biological aging and longevity: A link with inflammaging. Ageing Res. Rev. 2013, 12, 685–698. [Google Scholar] [CrossRef] [PubMed] [Green Version]
- Everest-Dass, A.V.; Moh, E.S.X.; Ashwood, C.; Shathili, A.M.M.; Packer, N.H. Human disease glycomics: Technology advances enabling protein glycosylation analysis–part 2. Expert Rev. Proteomics 2018, 15, 341–352. [Google Scholar] [CrossRef] [PubMed]
- Rudman, N.; Gornik, O.; Lauc, G. Altered N-glycosylation profiles as potential biomarkers and drug targets in diabetes. FEBS Lett. 2019, 593, 1598–1615. [Google Scholar] [CrossRef] [Green Version]
- Kizuka, Y.; Kitazume, S.; Taniguchi, N. N-glycan and Alzheimer’s disease. Biochim. Biophys. Acta Gen. Subj. 2017, 1861, 2447–2454. [Google Scholar] [CrossRef]
- Konjevod, M.; Tudor, L.; Svob Strac, D.; Nedic Erjavec, G.; Barbas, C.; Zarkovic, N.; Nikolac Perkovic, M.; Uzun, S.; Kozumplik, O.; Lauc, G.; et al. Metabolomic and glycomic findings in posttraumatic stress disorder. Prog. Neuro-Psychopharmacol. Biol. Psychiatry 2019, 88, 181–193. [Google Scholar] [CrossRef]
- Hu, M.; Lan, Y.; Lu, A.; Ma, X.; Zhang, L. Progress in Molecular Biology and Translational Science, 1st ed.; Elsevier: Amsterdam, The Netherlands, 2019; pp. 1–24. [Google Scholar]
- Zhang, M.; Dou, H.; Yang, D.; Shan, M.; Li, X.; Hao, C.; Zhang, Y.; Zeng, P.; He, Y.; Liu, Y.; et al. Retrospective Analysis of Glycan-related Biomarkers Based on Clinical Laboratory Data in Two Medical Centers During the Past 6 Years. Prog Mol Biol Transl Sci 2019, 162, 141–163. [Google Scholar] [CrossRef]
- Nimmerjahn, F.; Anthony, R.M.; Ravetch, J.V. Agalactosylated IgG antibodies depend on cellular Fc receptors for in vivo activity. Proc. Natl. Acad. Sci. USA 2007, 104, 8433–8437. [Google Scholar] [CrossRef] [Green Version]
- Russell, A.C.; Šimurina, M.; Garcia, M.T.; Novokmet, M.; Wang, Y.; Rudan, I.; Campbell, H.; Lauc, G.; Thomas, M.G.; Wang, W. The N-glycosylation of immunoglobulin G as a novel biomarker of Parkinson’s disease. Glycobiology 2017, 27, 501–510. [Google Scholar] [CrossRef]
- Arnold, J.N.; Wormald, M.R.; Sim, R.B.; Rudd, P.M.; Dwek, R.A. The impact of glycosylation on the biological function and structure of human immunoglobulins. Ann. Rev. Immunol. 2007, 25, 21–50. [Google Scholar] [CrossRef] [PubMed]
- Shade, K.-T.; Anthony, R. Antibody glycosylation and inflammation. Antibodies 2013, 2, 392–414. [Google Scholar] [CrossRef] [Green Version]
- Pučić, M.; Knežević, A.; Vidič, J.; Adamczyk, B.; Novokmet, M.; Polašek, O.; Gornik, O.; Šupraha-Goreta, S.; Wormald, M.R.; Redžic, I.; et al. High throughput isolation and glycosylation analysis of IgG-variability and heritability of the IgG glycome in three isolated human populations. Mol. Cell. Proteomics 2011, 10, 1–15. [Google Scholar] [CrossRef] [Green Version]
- Parekh, R.; Isenberg, D.; Rook, G.; Roitt, I.; Dwek, R.; Rademacher, T. A comparative analysis of disease-associated changes in the galactosylation of serum IgG. J. Autoimmun. 1989, 2, 101–114. [Google Scholar] [CrossRef]
- Dotz, V.; Wuhrer, M. N-glycome signatures in human plasma: Associations with physiology and major diseases. FEBS Lett. 2019, 593, 2966–2976. [Google Scholar] [CrossRef] [Green Version]
- Fontana, L.; Partridge, L.; Longo, V.D. Extending healthy life span—From yeast to humans. Science 2010, 328, 321–326. [Google Scholar] [CrossRef] [PubMed] [Green Version]
- Committee on Assessing the Importance and Impact of Glycomics and Glycosciences. Transforming Glycoscience: A Roadmap for the Future; National Academies Press: Washington, DC, USA, 2012. [Google Scholar] [CrossRef]
- Krištić, J.; Vučković, F.; Menni, C.; Klarić, L.; Keser, T.; Beceheli, I.; Pučić-Baković, M.; Novokmet, M.; Mangino, M.; Thaqi, K.; et al. Glycans are a novel biomarker of chronological and biological ages. J. Gerontol. Ser. A Biol. Sci. Med. Sci. 2014, 69, 779–789. [Google Scholar] [CrossRef] [Green Version]
- Yu, X.; Wang, Y.; Kristic, J.; Dong, J.; Chu, X.; Ge, S.; Wang, H.; Fang, H.; Gao, Q.; Liu, D.; et al. Profiling IgG N-glycans as potential biomarker of chronological and biological ages: A community-based study in a Han Chinese population. Medicine 2016, 95, 1–10. [Google Scholar] [CrossRef] [PubMed]
- Šunderić, M.; Križáková, M.; Malenković, V.; Ćujić, D.; Katrlík, J.; Nedić, O. Changes due to ageing in the glycan structure of α-2-macroglobulin and its reactivity with ligands. Protein J. 2019, 38, 23–29. [Google Scholar] [CrossRef]
- Calvert, L.; Atkinson, H.; Berry, L.; Chan, A. Age-dependent variation in glycosylation features of α-2-macroglobulin. Cell Biochem. Biophys. 2019, 77, 335–342. [Google Scholar] [CrossRef]
- Robajac, D.; Masnikosa, R.; Nemčovič, M.; Križáková, M.; Belická Kluková, Ľ.; Baráth, P.; Katrlík, J.; Nedić, O. Glycoanalysis of the placental membrane glycoproteins throughout placental development. Mech. Ageing Dev. 2019, 183. [Google Scholar] [CrossRef]
- Wide, L.; Eriksson, K. Unique pattern of N-glycosylation, sialylation, and sulfonation on TSH molecules in serum of children up to 18 months. J. Clin. Endocrinol. Metab. 2019, 104, 4651–4659. [Google Scholar] [CrossRef]
- Donovan, M.; Bernard, D.; Simonetti, L.; Cavusoglu, N.; Rudd, P.; Duke, R. Skin glycomics—Characterization of the N-glycome in the stratum corneum of aged and dry skin. J. Investig. Dermatol. 2019, 139. [Google Scholar] [CrossRef] [Green Version]
- Baković, M.P.; Selman, M.H.J.; Hoffmann, M.; Rudan, I.; Campbell, H.; Deelder, A.M.; Lauc, G.; Wuhrer, M. High-throughput IgG Fc N-glycosylation profiling by mass spectrometry of glycopeptides. J. Proteome Res. 2013, 12, 821–831. [Google Scholar] [CrossRef] [Green Version]
- Ruhaak, L.R.; Uh, H.W.; Beekman, M.; Koeleman, C.A.M.; Hokke, C.H.; Westendorp, R.G.J.; Wuhrer, M.; Houwing-Duistermaat, J.J.; Slagboom, P.E.; Deelder, A.M. Decreased levels of bisecting GLcNAc glycoforms of IgG are associated with human longevity. PLoS ONE 2010, 5, e12566. [Google Scholar] [CrossRef] [PubMed] [Green Version]
- Reiding, K.R.; Ruhaak, L.R.; Uh, H.; Bouhaddani, S.; Van Den Akker, E.B.; Plomp, R.; Mcdonnell, L.A.; Houwing-duistermaat, J.J.; Slagboom, P.E.; Beekman, M.; et al. Human Plasma N-glycosylation as analyzed by matrix-assisted laser desorption/ionization-fourier transform ion cyclotron resonance-MS associates with markers of inflammation and metabolic health. Mol. Cell Proteomics 2017, 16, 228–242. [Google Scholar] [CrossRef] [Green Version]
- Ruhaak, L.R.; Koeleman, C.A.M.; Uh, H.W.; Stam, J.C.; van Heemst, D.; Maier, A.B.; Houwing-Duistermaat, J.J.; Hensbergen, P.J.; Slagboom, P.E.; Deelder, A.M.; et al. Targeted biomarker discovery by high throughput glycosylation profiling of human plasma α1-antitrypsin and immunoglobulin A. PLoS ONE 2013, 8, e73082. [Google Scholar] [CrossRef] [Green Version]
- Ding, N.; Sun, H.N.; Sun, W.; Qu, Y.; Liu, X.; Yao, Y.; Liang, X.; Chen, C.C.; Li, Y. Human serum N-glycan profiles are age and sex dependent. Age Ageing 2011, 40, 568–575. [Google Scholar] [CrossRef] [PubMed] [Green Version]
- De Haan, N.; Reiding, K.R.; Driessen, G.; Van Der Burg, M.; Wuhrer, M. Changes in healthy human IgG Fc-glycosylation after birth and during early childhood. J. Proteome Res. 2016, 15, 1853–1861. [Google Scholar] [CrossRef] [PubMed]
- Berry, L.R.; Van Walderveen, M.C.; Atkinson, H.M.; Chan, A.K.C. Comparison of N-linked glycosylation of protein C in newborns and adults. Carbohydr. Res. 2013, 365, 32–37. [Google Scholar] [CrossRef] [PubMed]
- Edelberg, J.M.; Enghild, J.J.; Pizzo, S.V.; Gonzalez-Gronow, M. Neonatal plasminogen displays altered cell surface binding and activation kinetics: Correlation with increased glycosylation of the protein. J. Clin. Investig. 1990, 86, 107–112. [Google Scholar] [CrossRef] [Green Version]
- Kim, B.S.; Choi, C.W.; Shin, H.; Jin, S.P.; Bae, J.S.; Han, M.; Seo, E.Y.; Chun, J.; Chung, J.H. Comparison of the gut microbiota of centenarians in longevity villages of South Korea with those of other age groups. J. Microbiol. Biotechnol. 2019, 29, 429–440. [Google Scholar] [CrossRef] [PubMed]
- Wang, W.; Gopal, S.; Pocock, R.; Xiao, Z. Glycan mimetics from natural products: New therapeutic opportunities for neurodegenerative disease. Molecules 2019, 24, 4604. [Google Scholar] [CrossRef] [PubMed] [Green Version]
- Alzheimer’s Associaton Report. 2020 Alzheimer’s disease facts and figures. Alzheimer Dement. 2020, 16, 391–460. [CrossRef] [PubMed]
- Duyckaerts, C.; Delatour, B.; Potier, M.C. Classification and basic pathology of Alzheimer disease. Acta Neuropathol 2009, 118, 5–36. [Google Scholar] [CrossRef]
- Deane, R.; Yan, S.D.; Submamaryan, R.K.; Larue, B.; Jovanovic, S.; Hogg, E.; Welch, D.; Manness, L.; Lin, C.; Yu, J.; et al. Rage mediates amyloid-β peptide transport across the blood-brain barrier and accumulation in brain. Nat. Med. 2003, 9, 907–913. [Google Scholar] [CrossRef]
- Edri-Brami, M.; Rosental, B.; Hayoun, D.; Welt, M.; Rosen, H.; Wirguin, I.; Nefussy, B.; Drory, V.E.; Porgador, A.; Lichtenstein, R.G. Glycans in sera of amyotrophic lateral sclerosis patients and their role in killing neuronal cells. PLoS ONE 2012, 7, e35772. [Google Scholar] [CrossRef]
- Costa, J.; Streich, L.; Pinto, S.; Pronto-Laborinho, A.; Nimtz, M.; Conradt, H.S.; de Carvalho, M. Exploring cerebrospinal fluid IgG N-glycosylation as potential biomarker for amyotrophic lateral sclerosis. Mol. Neurobiol. 2019, 56, 5729–5739. [Google Scholar] [CrossRef] [PubMed]
- Gonçalves, M.; Tillack, L.; de Carvalho, M.; Pinto, S.; Conradt, H.S.; Costa, J. Phosphoneurofilament heavy chain and N-glycomics from the cerebrospinal fluid in amyotrophic lateral sclerosis. Clin. Chim. Acta 2015, 438, 342–349. [Google Scholar] [CrossRef]
- Váradi, C.; Nehéz, K.; Hornyák, O.; Viskolcz, B.; Bones, J. Serum N-glycosylation in Parkinson’s disease: A novel approach for potential alterations. Molecules 2019, 24, 2220. [Google Scholar] [CrossRef] [Green Version]
- Kanninen, K.; Goldsteins, G.; Auriola, S.; Alafuzoff, I.; Koistinaho, J. Glycosylation changes in Alzheimer’s disease as revealed by a proteomic approach. Neurosci. Lett. 2004, 367, 235–240. [Google Scholar] [CrossRef]
- Hovden, H.; Frederiksen, J.L.; Pedersen, S.W. Immune system alterations in amyotrophic lateral sclerosis. Acta Neurol. Scand. 2013, 128, 287–296. [Google Scholar] [CrossRef] [PubMed] [Green Version]
- Vanhooren, V.; Liu, X.E.; Franceschi, C.; Gao, C.F.; Libert, C.; Contreras, R.; Chen, C. N-glycan profiles as tools in diagnosis of hepatocellular carcinoma and prediction of healthy human ageing. Mech. Ageing Dev. 2009, 130, 92–97. [Google Scholar] [CrossRef] [PubMed]
- Kyselova, Z.; Mechref, Y.; Kang, P.; Goetz, J.A.; Dobrolecki, L.E.; Sledge, G.W.; Schnaper, L.; Hickey, R.J.; Malkas, L.H.; Novotny, M.V. Breast cancer diagnosis and prognosis through quantitative measurements of serum glycan profiles. Clin. Chem. 2008, 54, 1166–1175. [Google Scholar] [CrossRef] [Green Version]
- Hamid, U.M.A.; Royle, L.; Saldova, R.; Radcliffe, C.M.; Harvey, D.J.; Storr, S.J.; Pardo, M.; Antrobus, R.; Chapman, C.J.; Zitzmann, N.; et al. A strategy to reveal potential glycan markers from serum glycoproteins associated with breast cancer progression. Glycobiology 2008, 18, 1105–1118. [Google Scholar] [CrossRef] [PubMed] [Green Version]
- An, H.; Miyamoto, S.; Lancaster, K.S.; Kirmiz, C.; Li, B.; Lam, K.S.; Leiserowitz, G.S.; Lebrilla, C.B. Profiling of glycans in serum for the discovery of potential biomarkers for ovarian cancer. J. Proteome Res. 2006, 5, 1626–1635. [Google Scholar] [CrossRef]
- Alley, R., Jr.; Novotny, M. Glycomic analysis of sialic acid linkages in glycans derived from blood serum glycoproteins. J. Proteome Res. 2010, 9, 761–771. [Google Scholar] [CrossRef] [Green Version]
- Liu, L.; Yan, B.; Huang, J.; Gu, Q.; Wang, L.; Fang, M.; Jiao, J.; Yue, X. The identification and characterization of novel N-glycan-based biomarkers in gastric cancer. PLoS ONE 2013, 8, e77821. [Google Scholar] [CrossRef] [PubMed] [Green Version]
- Drabik, A.; Bodzon-Kulakowska, A.; Suder, P.; Silberring, J.; Kulig, J.; Sierzega, M. Glycosylation changes in serum proteins identify patients with pancreatic cancer. J. Proteome Res. 2017, 16, 1436–1444. [Google Scholar] [CrossRef]
- Hu, Y.; Ferdosi, S.; Kapuruge, E.P.; Diaz de Leon, J.A.; Stücker, I.; Radoï, L.; Guénel, P.; Borges, C.R. Diagnostic and prognostic performance of blood plasma glycan features in the women epidemiology lung cancer (WELCA) Study. J. Proteome Res. 2019, 18, 3985–3998. [Google Scholar] [CrossRef]
- Penezić, A.; Križakova, M.; Miljuš, G.; Katrlik, J.; Nedić, O. Diagnostic potential of transferrin glycoforms—A lectin-based protein microarray approach. Proteomics Clin. Appl. 2019, 13, 1–8. [Google Scholar] [CrossRef] [PubMed]
- Qiu, Y.; Patwa, T.H.; Xu, L.; Shedden, K.; Misek, D.E.; Jin, G.; Ruffin, M.T.; Turgeon, D.K.; Synal, S.; Marcon, N.; et al. Plasma glycoprotein profiling for colorectal cancer biomarker identification by lectin glycoarray and lectin blot. J. Proteome Res. 2009, 7, 1693–1703. [Google Scholar] [CrossRef] [Green Version]
- Zhao, Y.P.; Ruan, C.P.; Wang, H.; Hu, Z.Q.; Fang, M.; Gu, X.; Ji, J.; Zhao, J.Y.; Gao, C.F. Identification and assessment of new biomarkers for colorectal cancer with serum N-glycan profiling. Cancer 2012, 118, 639–650. [Google Scholar] [CrossRef]
- Šunderić, M.; Šedivá, A.; Robajac, D.; Miljuš, G.; Gemeiner, P.; Nedić, O.; Katrlík, J. Lectin-based protein microarray analysis of differences in serum alpha-2-macroglobulin glycosylation between patients with colorectal cancer and persons without cancer. Biotechnol. Appl. Biochem. 2016, 63, 457–464. [Google Scholar] [CrossRef]
- De Leoz, M.L.A.; An, H.J.; Kronewitter, S.; Kim, J.; Beecroft, S.; Vinall, R.; Miyamoto, S.; De Vere White, R.; Lam, K.S.; Lebrilla, C. Glycomic approach for potential biomarkers on prostate cancer: Profiling of N-linked glycans in human sera and pRNS cell lines. Dis. Markers 2008, 25, 243–258. [Google Scholar] [CrossRef] [Green Version]
- Bereman, M.S.; Williams, T.I.; Muddiman, D.C. Development of a nanolc ltq orbitrap mass spectrometric method for profiling glycans derived from plasma from healthy, benign tumor control, and epithelial ovarian cancer patients. Anal. Chem. 2009, 81, 1130–1136. [Google Scholar] [CrossRef] [PubMed] [Green Version]
- Takahashi, S.; Sugiyama, T.; Shimomura, M.; Kamada, Y.; Fujita, K.; Nonomura, N.; Miyoshi, E.; Nakano, M. Site-specific and linkage analyses of fucosylated N-glycans on haptoglobin in sera of patients with various types of cancer: Possible implication for the differential diagnosis of cancer. Glycoconj. J. 2016, 33, 471–482. [Google Scholar] [CrossRef] [Green Version]
- Miyoshi, E.; Moriwaki, K.; Nakagawa, T. Biological function of fucosylation in cancer biology. J. Biochem. 2008, 143, 725–729. [Google Scholar] [CrossRef] [PubMed]
- Li, Q.; Li, G.; Zhou, Y.; Zhang, X.; Sun, M.; Jiang, H.; Yu, G. Comprehensive N-glycome profiling of cells and tissues for breast cancer diagnosis. J. Proteome Res. 2019, 18, 2559–2570. [Google Scholar] [CrossRef]
- Adua, E.; Memarian, E.; Russell, A.; Trbojević-Akmačić, I.; Gudelj, I.; Jurić, J.; Roberts, P.; Lauc, G.; Wang, W. High throughput profiling of whole plasma N-glycans in type II diabetes mellitus patients and healthy individuals: A perspective from a Ghanaian population. Arch. Biochem. Biophys. 2019, 661, 10–21. [Google Scholar] [CrossRef]
- Dotz, V.; Lemmers, R.F.H.; Reiding, K.R.; Hipgrave Ederveen, A.L.; Lieverse, A.G.; Mulder, M.T.; Sijbrands, E.J.G.; Wuhrer, M.; van Hoek, M. Plasma protein N-glycan signatures of type 2 diabetes. Biochim. Biophys. Acta Gen. Subj. 2018, 1862, 2613–2622. [Google Scholar] [CrossRef] [PubMed] [Green Version]
- Connelly, M.A.; Gruppen, E.G.; Wolak-Dinsmore, J.; Matyus, S.P.; Riphagen, I.J.; Shalaurova, I.; Bakker, S.J.L.; Otvos, J.D.; Dullaart, R.P.F. GlycA, a marker of acute phase glycoproteins, and the risk of incident type 2 diabetes mellitus: Prevend study. Clin. Chim. Acta 2016, 452, 10–17. [Google Scholar] [CrossRef] [Green Version]
- Grundy, S.M.; Hansen, B.; Smith, S.C.; Cleeman, J.I.; Kahn, R.A. Clinical management of metabolic syndrome. Arterioscler. Thromb. Vasc. Biol. 2004, 24, 551–556. [Google Scholar] [CrossRef] [Green Version]
- Lu, J.P.; Knežević, A.; Wang, Y.X.; Rudan, I.; Campbell, H.; Zou, Z.K.; Lan, J.; Lai, Q.X.; Wu, J.J.; He, Y.; et al. Screening novel biomarkers for metabolic syndrome by profiling human plasma N-glycans in Chinese Han and Croatian populations. J. Proteome Res. 2011, 10, 4959–4969. [Google Scholar] [CrossRef]
- Gao, Q.; Dolikun, M.; Štambuk, J.; Wang, H.; Zhao, F.; Yiliham, N.; Wang, Y.; Trbojević-Akmačić, I.; Zhang, J.; Fang, H.; et al. immunoglobulin G N-glycans as potential postgenomic biomarkers for hypertension in the Kazakh population. Omi. A J. Integr. Biol. 2017, 21, 380–389. [Google Scholar] [CrossRef] [PubMed]
- Wang, Y.; Klarić, L.; Yu, X.; Thaqi, K.; Dong, J.; Novokmet, M.; Wilson, J.; Polasek, O.; Liu, Y.; Krištić, J.; et al. The association between glycosylation of immunoglobulin G and hypertension. Medicine 2016, 95, 1–11. [Google Scholar] [CrossRef]
- Liu, J.; Dolikun, M.; Štambuk, J.; Trbojević-Akmačić, I.; Zhang, J.; Wang, H.; Zheng, D.; Zhang, X.; Peng, H.; Zhao, Z.; et al. The association between subclass-specific IgG Fc N-glycosylation profiles and hypertension in the Uygur, Kazak, Kirgiz, and Tajik populations. J. Hum. Hypertens. 2018, 32, 555–563. [Google Scholar] [CrossRef] [Green Version]
- Menni, C.; Gudelj, I.; MacDonald-Dunlop, E.; Mangino, M.; Zierer, J.; Bešić, E.; Joshi, P.K.; Trbojević-Akmačić, I.; Chowienczyk, P.J.; Spector, T.D.; et al. Glycosylation profile of immunoglobulin g is cross-sectionally associated with cardiovascular disease risk score and subclinical atherosclerosis in two independent cohorts. Circ. Res. 2018, 122, 1555–1564. [Google Scholar] [CrossRef] [PubMed]
- Barrios, C.; Zierer, J.; Gudelj, I.; Stambuk, J.; Ugrina, I.; Rodríguez, E.; Soler, M.J.; Pavic, T.; Simurina, M.; Keser, T.; et al. Glycosylation profile of IgG in moderate kidney dysfunction. J. Am. Soc. Nephrol. 2016, 27, 933–941. [Google Scholar] [CrossRef] [PubMed] [Green Version]
- Liu, D.; Chu, X.; Wang, H.; Dong, J.; Ge, S.Q.; Zhao, Z.Y.; Peng, H.L.; Sun, M.; Wu, L.J.; Song, M.S.; et al. The changes of immunoglobulin G N-glycosylation in blood lipids and dyslipidaemia. J. Transl. Med. 2018, 16, 1–10. [Google Scholar] [CrossRef] [PubMed]
- Wilson, P.W.F.; D’Agostino, R.B.; Parise, H.; Sullivan, L.; Meigs, J.B. Metabolic syndrome as a precursor of cardiovascular disease and type 2 diabetes mellitus. Circulation 2005, 112, 3066–3072. [Google Scholar] [CrossRef]
- North, B.J.; David, A. Sinclair the intersection between aging and cardiovascular disease. Circ. Res. 2012, 110, 1097–1108. [Google Scholar] [CrossRef]
- Vasudevan, A.R.; Ballantyne, C.M. Cardiometabolic risk assessment: An approach to the prevention of cardiovascular disease and diabetes mellitus. Clin. Cornerstone 2005, 7, 7–16. [Google Scholar] [CrossRef]
- Umaña, P.; Jean-Mairet, J.; Moudry, R.; Amstutz, H.; Bailey, J.E. Engineered glycoforms of an antineuroblastoma IgG1 with optimized antibody-dependent cellular cytotoxic activity. Nat. Biotechnol. 1999, 17, 176–180. [Google Scholar] [CrossRef] [PubMed]
- Willerson, J.T.; Ridker, P.M. Inflammation as a cardiovascular risk factor. Circulation 2004, 109, 2–11. [Google Scholar] [CrossRef] [PubMed] [Green Version]
- Böhm, S.; Schwab, I.; Lux, A.; Nimmerjahn, F. The role of sialic acid as a modulator of the anti-inflammatory activity of IgG. Semin. Immunopathol. 2012, 34, 443–453. [Google Scholar] [CrossRef]
- Tenenbaum, A.; Klempfner, R.; Fisman, E.Z. Hypertriglyceridemia: A too long unfairly neglected major cardiovascular risk factor. Cardiovasc. Diabetol. 2014, 13, 1–10. [Google Scholar] [CrossRef]
- Buford, T.W. Hypertension and aging. Ageing Res. Rev. 2016, 96–111. [Google Scholar] [CrossRef] [Green Version]
- Trbojevic Akmacic, I.; Ventham, N.T.; Theodoratou, E.; Vučković, F.; Kennedy, N.A.; Krištić, J.; Nimmo, E.R.; Kalla, R.; Drummond, H.; Štambuk, J.; et al. Inflammatory bowel disease associates with proinflammatory potential of the immunoglobulin G glycome. Inflamm. Bowel Dis. 2015, 21, 1237–1247. [Google Scholar] [CrossRef] [PubMed] [Green Version]
- El Nahas, A.M.; Bello, A.K. Chronic kidney disease: The global challenge. Lancet 2005, 365, 331–340. [Google Scholar] [CrossRef]
- Clerc, F.; Novokmet, M.; Dotz, V.; Reiding, K.R.; de Haan, N.; Kammeijer, G.S.M.; Dalebout, H.; Bladergroen, M.R.; Vukovic, F.; Rapp, E.; et al. Plasma N-glycan signatures are associated with features of inflammatory bowel diseases. Gastroenterology 2018, 155, 829–843. [Google Scholar] [CrossRef] [PubMed] [Green Version]
- Schultz, M.J.; Swindall, A.F.; Bellis, S.L. Regulation of the metastatic cell phenotype by sialylated glycans. Cancer Metastasis Rev. 2012, 31, 501–518. [Google Scholar] [CrossRef] [PubMed] [Green Version]
- Dalziel, M.; Crispin, M.; Scanlan, C.N.; Zitzmann, N.; Dwek, R.A. Emerging principles for the therapeutic exploitation of glycosylation. Science 2014, 343. [Google Scholar] [CrossRef]
- Shinzaki, S.; Iijima, H.; Nakagawa, T.; Egawa, S.; Nakajima, S.; Ishii, S.; Irie, T.; Kakiuchi, Y.; Nishida, T.; Yasumaru, M.; et al. IgG oligosaccharide alterations are a novel diagnostic marker for disease activity and the clinical course of inflammatory bowel disease. Am. J. Gastroenterol. 2008, 103, 1173–1181. [Google Scholar] [CrossRef] [PubMed]
- Pasek, M.; Duk, M.; Podbielska, M.; Sokolik, R.; Szechiński, J.; Lisowska, E.; Krotkiewski, H. Galactosylation of IgG from rheumatoid arthritis (RA) patients—Changes during therapy. Glycoconj. J. 2006, 23, 463–471. [Google Scholar] [CrossRef]
- Gudelj, I.; Salo, P.P.; Trbojević-Akmačić, I.; Albers, M.; Primorac, D.; Perola, M.; Lauc, G. Low galactosylation of IgG associates with higher risk for future diagnosis of rheumatoid arthritis during 10 years of follow-up. Biochim. Biophys. Acta Mol. Basis Dis. 2018, 1864, 2034–2039. [Google Scholar] [CrossRef] [PubMed]
- Magorivska, I.; Döncző, B.; Dumych, T.; Karmash, A.; Boichuk, M.; Hychka, K.; Mihalj, M.; Szabó, M.; Csánky, E.; Rech, J.; et al. Glycosylation of random IgG distinguishes seropositive and seronegative rheumatoid arthritis. Autoimmunity 2018, 51, 111–117. [Google Scholar] [CrossRef] [PubMed]
- Ercan, A.; Cui, J.; Chatterton, D.E.W.; Deane, K.D.; Hazen, M.M.; Brintnell, W.; Donnell, C.I.O.; Derber, L.A.; Weinblatt, M.E.; Nancy, A.; et al. IgG galactosylation aberrancy precedes disease onset, correlates with disease activity and is prevalent in autoantibodies in rheumatoid arthritis. Arthritis Rheum. 2010, 62, 2239–2248. [Google Scholar] [CrossRef] [PubMed] [Green Version]
- Gindzienska-Sieskiewicz, E.; Klimiuk, P.A.; Kisiel, D.G.; Gindzienski, A.; Sierakowski, S. The changes in monosaccharide composition of immunoglobulin G in the course of rheumatoid arthritis. Clin. Rheumatol. 2007, 26, 685–690. [Google Scholar] [CrossRef] [PubMed]
- Sebastian, A.; Alzain, M.A.; Asweto, C.O.; Song, H.; Cui, L.; Yu, X.; Ge, S.; Dong, H.; Rao, P.; Wang, H.; et al. Glycan biomarkers for rheumatoid arthritis and its remission status in Han Chinese patients. Omi. A J. Integr. Biol. 2016, 20, 343–351. [Google Scholar] [CrossRef] [Green Version]
- Huffman, J.E.; Pučić-Baković, M.; Klarić, L.; Hennig, R.; Selman, M.H.J.; Vučković, F.; Novokmet, M.; Krištić, J.; Borowiak, M.; Muth, T.; et al. Comparative performance of four methods for high-throughput glycosylation analysis of immunoglobulin G in genetic and epidemiological research. Mol. Cell. Proteomics 2014, 13, 1598–1610. [Google Scholar] [CrossRef] [Green Version]
- Fernandes-Cerqueira, C.; Renard, N.; Notarnicola, A.; Wigren, E.; Gräslund, S.; Zubarev, R.A.; Lundberg, I.E.; Lundström, S.L. Patients with anti-Jo1 antibodies display a characteristic IgG Fc-glycan profile which is further enhanced in anti-Jo1 autoantibodies. Sci. Rep. 2018, 8, 1–11. [Google Scholar] [CrossRef] [PubMed]
- Lee, D.M.; Weinblatt, M.E. Rheumatoid arthritis. Lancet. 2001, 358, 903–911. [Google Scholar] [CrossRef]
- Mastrangelo, A.; Colasanti, T.; Barbati, C.; Pecani, A.; Sabatinelli, D.; Pendolino, M.; Truglia, S.; Massaro, L.; Mancini, R.; Miranda, F.; et al. The role of posttranslational protein modifications in rheumatological diseases: Focus on rheumatoid arthritis. J. Immunol. Res. 2015, 2015. [Google Scholar] [CrossRef] [PubMed] [Green Version]
- Albrecht, S.; Unwin, L.; Muniyappa, M.; Rudd, P.M. Glycosylation as a marker for inflammatory arthritis. Cancer Biomarkers 2014, 14, 17–28. [Google Scholar] [CrossRef]
- Parekh, R.B.; Dwek, R.A.; Sutton, B.J.; Fernandes, D.L.; Leung, A.; Stanworth, D.; Rademacher, T.W.; Mizuochi, T.; Taniguchi, T.; Matsuta, K.; et al. Association of rheumatoid arthritis and primary osteoarthritis with changes in the glycosylation pattern of total serum IgG. Nature 1985, 316, 452–457. [Google Scholar] [CrossRef] [PubMed]
- Johnson, C.; Pinal-Fernandez, I.; Parikh, R.; Paik, J.; Albayda, J.; Mammen, A.L.; Christopher-Stine, L.; Danoff, S. Assessment of mortality in autoimmune myositis with and without associated interstitial lung disease. Lung 2016, 194, 733–737. [Google Scholar] [CrossRef] [PubMed]
- Han, L.; Costello, C. Mass spectrometry of glycans. Biochemistry 2013, 78, 710–720. [Google Scholar] [CrossRef] [PubMed] [Green Version]
- Hirabayashi, J.; Yamada, M.; Kuno, A.; Tateno, H. Lectin microarrays: Concept, principle and applications. Chem. Soc. Rev. 2013, 42, 4443–4458. [Google Scholar] [CrossRef]
- Zhang, L.; Luo, S.; Zhang, B. The use of lectin microarray for assessing glycosylation of therapeutic proteins. MAbs 2016, 8, 524–535. [Google Scholar] [CrossRef] [Green Version]
- Zhang, Y.; Peng, Y.; Yang, L.; Lu, H. Advances in sample preparation strategies for MS-based qualitative and quantitative N-Glycomics. Trends Anal. Chem. 2017, 99, 34–46. [Google Scholar] [CrossRef]
- Xiao, K.; Han, Y.; Yang, H.; Lu, H.; Tian, Z. Mass spectrometry-based qualitative and quantitative N-glycomics: An update of 2017–2018. Anal. Chim. Acta 2019, 1091, 1–22. [Google Scholar] [CrossRef]
- Takasaki, S.; Mizuochi, T.; Kobata, A. Hydrazinolysis of asparagine-linked sugar chains to produce free oligosaccharides. Methods Enzymol. 1982, 83, 263–268. [Google Scholar] [CrossRef] [PubMed]
- Rasilo, M.; Renkonen, O. Mild alkaline borohydride treatment liberates N-acetylglucosamine linked oligosaccharide chains of glycoproteins. FEBS Lett. 1981, 135, 38–42. [Google Scholar] [CrossRef] [Green Version]
- Maley, F.; Trimble, R.B.; Tarentino, A.L.; Plummer, T.H., Jr. Characterization of glycoproteins and their associated oligosaccharides through the use of endoglycosidases. Anal. Biochem. 1989, 204, 195–204. [Google Scholar] [CrossRef]
- Lauber, M.A.; Yu, Y.; Brousmiche, D.W.; Hua, Z.; Koza, S.M.; Magnelli, P.; Guthrie, E.; Taron, C.H.; Fountain, K.J. Rapid preparation of released N-glycans for HILIC analysis using a labeling reagent that facilitates sensitive fluorescence and ESI-MS detection. Anal. Chem. 2015, 87, 5401–5409. [Google Scholar] [CrossRef]
- Sandoval, W.N.; Arellano, F.; Arnott, D.; Raab, H.; Vandlen, R.; Lill, J.R. Rapid removal of N-linked oligosaccharides using microwave assisted enzyme catalyzed deglycosylation. Int. J. Mass Spec. 2007, 259, 117–123. [Google Scholar] [CrossRef]
- Szabo, Z.; Karger, B.L. Rapid release of N-linked glycans from glycoproteins by pressure-cycling technology. Anal. Chem. 2010, 82, 2588–2593. [Google Scholar] [CrossRef] [Green Version]
- Palm, A.K.; Novotny, M.V. A monolithic PNGase F enzyme microreactor enabling glycan mass mapping of glycoproteins by mass spectrometry. Rapid Commun Mass Spectrom. 2005, 19, 1730–1738. [Google Scholar] [CrossRef] [PubMed]
- Song, T.; Aldredge, D.; Lebrilla, C.B. A Method for in-depth structural annotation of human serum glycans that yields biological variations. Anal. Chem. 2017, 87, 7754–7762. [Google Scholar] [CrossRef] [Green Version]
- Fanayan, S.; Hincapie, M.; Hancock, W.S. Using lectins to harvest the plasma/serum glycoproteome. Electrophoresis 2012, 33, 1746–1754. [Google Scholar] [CrossRef]
- Etxebarria, J.; Calvo, J.; Martin-Lomas, M.; Reichardt, N.C. Lectin-array blotting: Profiling protein glycosylation in complex mixtures. ACS Chem. Biol. 2012, 7, 1729–1737. [Google Scholar] [CrossRef]
- Ribeiro, J.P.; Mahal, L.K. Dot by dot: Analyzing the glycome using lectin microarrays João. Curr. Opin. Chem. Biol. 2013, 17, 1–9. [Google Scholar] [CrossRef] [Green Version]
- Keser, T.; Pavić, T.; Lauc, G.; Gornik, O. Comparison of 2-aminobenzamide, procainamide and RapiFluor-MS as derivatizing agents for high-throughput HILIC-UPLC-FLR-MS N-glycan analysis. Front. Chem. 2018, 6, 1–12. [Google Scholar] [CrossRef] [PubMed]
- Alpert, A.J. Hydrophilic-interaction chromatography for the separation of peptides, nucleic acids and other polar compounds. J. Chromatogr. A 1990, 499, 177–196. [Google Scholar] [CrossRef]
- Takegawa, Y.; Deguchi, K.; Ito, H.; Keira, T.; Nakagawa, H.; Nishimura, S.I. Simple separation of isometric sialylated N-glycopeptides by a zwitterionic type of hydrophilic interaction chromatography. J. Sep. Sci. 2006, 29, 2533–2540. [Google Scholar] [CrossRef]
- Buszewski, B.; Noga, S. Hydrophilic interaction liquid chromatography (HILIC)-a powerful separation technique. Anal. Bioanal. Chem. 2012, 402, 231–247. [Google Scholar] [CrossRef] [Green Version]
- Wuhrer, M.; Boer, A.R.; Deelder, A. Structural glycomics using hydrophilic interaction chromatography (HILIC) with mass spectrometry. Mass Spectrom. Rev. 2009, 28, 192–206. [Google Scholar] [CrossRef]
- Takahashi, N. Three-dimensional mapping of N-linked oligosaccharides using anion-exchange, hydrophobic and hydrophilic interaction modes of high-performance liquid chromatography. J. Chromatogr. A 1996, 720, 217–225. [Google Scholar] [CrossRef]
- El Rassi, Z. Carbohydrate Analysis: High Performance Liquid Chromatography and Capillary Electrophoresis, 1st ed.; Elsevier: Amsterdam, The Netherlands, 1994. [Google Scholar]
- Zhou, S.; Veillon, L.; Dong, X.; Huang, Y.; Mechref, Y. Direct comparison of derivatization strategies for LC-MS/MS analysis of N-glycans. Analyst 2017, 142, 4446–4455. [Google Scholar] [CrossRef] [PubMed]
- Ruhaak, L.R.; Deelder, A.M.; Wuhrer, M.; Zauner, G.; Bruggink, C.; Huhn, C. Glycan labeling strategies and their use in identification and quantification. Anal. Bioanal. Chem. 2010, 397, 3457–3481. [Google Scholar] [CrossRef] [PubMed] [Green Version]
- Cohen, S.A.; Michaud, D.P. Synthesis of a fluorescent derivatizing reagent,6-aminoquinolyl-N-hydroxysuccinimidyl carbamate, and its application forthe analysis of hydrolysate amino acids via high-performance liquidchromatography. Anal. Biochem. 1993, 211, 279–287. [Google Scholar] [CrossRef]
- Wu, Y.; Sha, Q.; Wang, C.; Liu, B.; Wang, S.; Liu, X. Development of a filter-aided extraction method coupled with glycosylamine labeling to simplify and enhance high performance liquid chromatography-based N-glycan analysis. J. Chromatogr. A 2019, 1600, 105–111. [Google Scholar] [CrossRef] [PubMed]
- Lu, G.; Crihfield, C.L.; Gattu, S.; Veltri, L.M.; Holland, L.A. Capillary electrophoresis separations of glycans. Chem. Rev. 2018, 118, 7867–7885. [Google Scholar] [CrossRef] [PubMed] [Green Version]
- Donczo, B.; Szarka, M.; Tovari, J.; Ostoros, G.; Csanky, E.; Guttman, A. Molecular glycopathology by capillary electrophoresis: Analysis of the N-glycome of formalin-fixed paraffin-embedded mouse tissue samples. Electrophoresis 2017, 38, 1–7. [Google Scholar] [CrossRef]
- Guttman, A. High-resolution carbohydrate profiling by capillary gel electrophoresis. Nature 1996, 380, 461–462. [Google Scholar] [CrossRef]
- Mahan, A.E.; Tedesco, J.; Dionne, K.; Baruah, K.; Cheng, H.D.; De Jager, P.L.; Barouch, D.H.; Suscovich, T.; Ackerman, M.; Cripsin, M.; et al. A method for high-throughput, sensitive analysis of IgG Fc and Fab glycosylation by capillary electrophoresis. J. Immunol. Methods 2015, 417, 34–44. [Google Scholar] [CrossRef] [Green Version]
- Reusch, D.; Haberger, M.; Kailich, T.; Heidenreich, A.K.; Kampe, M.; Bulau, P.; Wuhrer, M. High-throughput glycosylation analysis of therapeutic immunoglobulin G by capillary gel electrophoresis using a DNA analyzer. MAbs 2014, 6, 185–196. [Google Scholar] [CrossRef] [Green Version]
- Adamczyk, B.; Tharmalingam-Jaikaran, T.; Schomberg, M.; Szekrényes, Á.; Kelly, R.M.; Karlsson, N.G.; Guttman, A.; Rudd, P.M. Comparison of separation techniques for the elucidation of IgG N-glycans pooled from healthy mammalian species. Carbohydr. Res. 2014, 389, 174–185. [Google Scholar] [CrossRef] [Green Version]
- Vanhooren, V.; Laroy, W.; Libert, C.; Chen, C. N-Glycan profiling in the study of human aging. Biogerontology 2008, 9, 351–356. [Google Scholar] [CrossRef]
- Echeverria, B.; Etxebarria, J.; Ruiz, N.; Hernandez, Á.; Calvo, J.; Haberger, M.; Reusch, D.; Reichardt, N.C. Chemo-enzymatic synthesis of 13C labeled complex N-glycans as internal standards for the absolute glycan quantification by mass spectrometry. Anal. Chem. 2015, 87, 11460–11467. [Google Scholar] [CrossRef] [PubMed]
- Smith, J.; Mittermayr, S.; Váradi, C.; Bones, J. Quantitative glycomics using liquid phase separations coupled to mass spectrometry. Analyst 2017, 142, 700–720. [Google Scholar] [CrossRef]
- Chen, J.E.; Glover, G.H. Functional magnetic resonance imaging methods. Neuropsychol. Rev. 2016, 25, 289–313. [Google Scholar] [CrossRef] [Green Version]
- Zhou, S.; Hu, Y.; DeSantos-Garcia, J.L.; Mechref, Y. Quantitation of permethylated N-glycans through multiple-reaction monitoring (MRM) LC-MS/MS. J. Am. Soc. Mass Spectrom. 2015, 26, 596–603. [Google Scholar] [CrossRef] [Green Version]
- Wu, S.; Salcedo, J.; Tang, N.; Waddell, K.; Grimm, R.; German, J.B.; Lebrilla, C.B. Employment of tandem mass spectrometry for the accurate and specific identification of oligosaccharide structures. Anal. Chem. 2012, 84, 7456–7462. [Google Scholar] [CrossRef] [PubMed] [Green Version]
- Sandra, K.; Devreese, B.; Van Beeumen, J.; Stals, I.; Claeyssens, M. The Q-Trap mass spectrometer, a novel tool in the study of protein glycosylation. J. Am. Soc. Mass Spectrom. 2004, 15, 413–423. [Google Scholar] [CrossRef] [Green Version]
- Zhou, W.; Hakansson, K. Structural characterization of carbohydrates by fourier transform tandem mass spectrometry. Curr. Proteomics 2011, 8, 297–308. [Google Scholar] [CrossRef] [Green Version]
- Mechref, Y.; Novotny, M.V.; Krishnan, C. Structural characterization of oligosaccharides using MALDI-TOF/TOF tandem mass spectrometry. Anal. Chem. 2003, 75, 4895–4903. [Google Scholar] [CrossRef] [PubMed]
- Leymarie, N.; Zaia, J. Effective use of mass spectrometry for glycan and glycopeptide structural analysis. Anal. Chem. 2012, 84, 3040–3048. [Google Scholar] [CrossRef] [PubMed] [Green Version]
- Dell, A. Glycoprotein structure determination by mass spectrometry. Science 2002, 291, 2351–2356. [Google Scholar] [CrossRef] [PubMed]
- Wang, C.; Li, J.; Yao, S.; Guo, Y.; Xia, X. High-sensitivity matrix-assisted laser desorption/ionization Fourier transform mass spectrometry analyses of small carbohydrates and amino acids using oxidized carbon nanotubes prepared by chemical vapor deposition as matrix. Anal. Chim. Acta 2007, 604, 158–164. [Google Scholar] [CrossRef] [PubMed]
- Harvey, D.J. Analysis of carbohydrates and glycoconjugates by matrix-assisted laser desorption/ionization mass spectrometry: An update for 2007–2008. Mass Spectrom. Rev. 2012, 31, 183–311. [Google Scholar] [CrossRef]
- Borowsky, A.D.; Clowers, B.H.; Lebrilla, C.B.; Miyamoto, S.; Ferrige, A.; An, H.J.; Lam, K.S.; Kirmiz, C.; Li, B.; Alecio, R.; et al. A serum glycomics approach to breast cancer biomarkers. Mol. Cell. Proteomics 2006, 6, 43–55. [Google Scholar] [CrossRef] [Green Version]
- Huang, C.; Yan, J.; Zhan, L.; Zhao, M.; Zhou, J. Linkage and sequence analysis of neutral oligosaccharides by negative-ion MALDI tandem mass spectrometry with laser-induced dissociation. Anal. Chim. Acta 2019, 1071, 25–35. [Google Scholar] [CrossRef] [PubMed]
- Briggs, M.T.; Kuliwaba, J.S.; Muratovic, D.; Everest-Dass, A.V.; Packer, N.H.; Findlay, D.M.; Hoffmann, P. MALDI mass spectrometry imaging of N-glycans on tibial cartilage and subchondral bone proteins in knee osteoarthritis. Proteomics 2016, 16, 1736–1741. [Google Scholar] [CrossRef]
- Angel, P.M.; Mehta, A.; Norris-Caneda, K.; Drake, R.R. MALDI imaging mass spectrometry of N-glycans and tryptic peptides from the same formalin-fixed, paraffin-embedded tissue section. Methods Mol. Biol. 2018, 1788, 225–241. [Google Scholar] [CrossRef]
- Zhou, S.; Wooding, K.; Mechref, Y. Analysis of permethylated glycan by liquid chromatography (LC) and mass spectrometry (MS). Methods Mol. Biol. Glycomics Methods Protoc. 2017, 1503, 83–96. [Google Scholar] [CrossRef] [Green Version]
- Grünwald-Gruber, C.; Thader, A.; Maresch, D.; Dalik, T.; Altmann, F. Determination of true ratios of different N-glycan structures in electrospray ionization mass spectrometry. Anal. Bioanal. Chem. 2017, 409, 2519–2530. [Google Scholar] [CrossRef] [Green Version]
- Bruins, A.P. Mechanistic aspects of electrospray ionization. J. Chromatogr. A 1998, 794, 345–357. [Google Scholar] [CrossRef]
- Wuhrer, M.; Koeleman, C.A.; Deelder, A.M. Two-Dimensional HPLC Separation with reverse-phase-nano-LC-MS/MS for the characterization of glycan pools after labeling with 2-aminobenzamide. Glycomics Methods Protoc. 2009, 534, 133–145. [Google Scholar] [CrossRef]
- Wuhrer, M.; Koeleman, C.A.M.; Fitzpatrick, J.M.; Hoffmann, K.F.; Deelder, A.M.; Hokke, C.H. Gender-specific expression of complex-type N-glycans in schistosomes. Glycobiology 2006, 16, 991–1006. [Google Scholar] [CrossRef]
- Kozak, R.P.; Tortosa, C.B.; Fernandes, D.L.; Spencer, D.I.R. Comparison of procainamide and 2-aminobenzamide labeling for profiling and identification of glycans liquid chromatography with fluorescence detection coupled to electrospray ionization-mass spectrometry. Anal. Biochem. 2015, 486, 38–40. [Google Scholar] [CrossRef] [PubMed]
- Li, B.; An, H.J.; Hedrick, J.L.; Lebrilla, C.B. Collision-induced dissociation tandem mass spectrometry for structural elucidation of glycans. Methods Mol. Biol. Glycomics Methods Protoc. 2009, 534, 75–89. [Google Scholar] [CrossRef]
- Sleno, L.; Volmer, D.A. Ion activation methods for tandem mass spectrometry. J. Mass Spectrom. 2004, 39, 1091–1112. [Google Scholar] [CrossRef]
- Domon, B.; Costello, C.E. A systematic nomenclature for carbohydrate fragmentations in FAB-MS/MS spectra of glycoconjugates. Glycoconj. J. 1988, 5, 397–409. [Google Scholar] [CrossRef]
- Zhou, S.; Dong, X.; Veillon, L.; Huang, Y.; Mechref, Y. LC-MS/MS analysis of permethylated N-glycans facilitating isomeric characterization. Anal. Bioanal Chem. 2017, 409, 453–466. [Google Scholar] [CrossRef]
- Wang, P. Altered glycosylation in cancer: Sialic acids and sialyltransferases. J. Cancer Mol. 2005, 1, 73–81. [Google Scholar] [CrossRef]
- Wada, Y.; Azadi, P.; Costello, C.E.; Dell, A.; Dwek, R.A.; Geyer, H.; Geyer, R.; Kakehi, K.; Karlsson, N.G.; Kato, K.; et al. Comparison of the methods for profiling glycoprotein glycans—HUPO human disease glycomics/proteome initiative multi-institutional study. Glycobiology 2007, 17, 411–422. [Google Scholar] [CrossRef] [PubMed] [Green Version]
- Mechref, Y.; Hu, Y.; Desantos-Garcia, J.L.; Hussein, A.; Tang, H. Quantitative glycomics strategies. Mol. Cell. Proteomics 2013, 12, 874–884. [Google Scholar] [CrossRef] [Green Version]
- Hu, Y.; Borges, C.R. A spin column-free approach to sodium hydroxide-based glycan permethylation. Analyst 2017, 142, 2748–2759. [Google Scholar] [CrossRef]
- Powell, A.K.; Harvey, D.J. Stabilization of sialic acids in N-linked oligosaccharides and gangliosides for analysis by positive ion matrix-assisted laser desorption/ionization mass spectrometry. Rapid Commun. Mass Spectrom. 1996, 10, 1027–1032. [Google Scholar] [CrossRef]
- Kita, Y.; Miura, Y.; Furukawa, J.; Nakano, M.; Shinohara, Y.; Ohno, M.; Takimoto, A.; Nishimura, S.I. Quantitative glycomics of human whole serum glycoproteins based on the standardized protocol for liberating N-glycans. Mol. Cell. Proteomics 2007, 6, 1437–1445. [Google Scholar] [CrossRef] [Green Version]
- Wheeler, S.F.; Domann, P.; Harvey, D.J. Derivatization of sialic acids for stabilization in matrix-assisted laser desorption/ionization mass spectrometry and concomitant differentiation of α(2 --> 3)- and α(2 --> 6)-isomers. Rapid Commun. Mass Spectrom. 2009, 23, 303–312. [Google Scholar] [CrossRef]
- Reiding, K.R.; Blank, D.; Kuijper, D.M.; Deelder, A.M.; Wuhrer, M. High-throughput profiling of protein N-glycosylation by MALDI-TOF-MS employing linkage-specific sialic acid esterification. Anal. Chem. 2014, 86, 5784–5793. [Google Scholar] [CrossRef] [PubMed]
- Toyoda, M.; Ito, H.; Matsuno, Y.K.; Narimatsu, H.; Kameyama, A. Quantitative derivatization of sialic acids for the detection of sialoglycans by MALDI MS. Anal. Chem. 2008, 80, 5211–5218. [Google Scholar] [CrossRef] [PubMed]
- Gil, G.; Iliff, B.; Cerny, R.; Velander, W.H.; Van Cott, K.E. High throughput quantification of N-glycans using one-pot sialic acid modification and matrix assisted laser desorption ionization time of flight mass spectrometry. Anal. Chem. 2010, 82, 6613–6620. [Google Scholar] [CrossRef] [PubMed] [Green Version]
- De Haan, N.; Reiding, K.R.; Haberger, M.; Reusch, D.; Falck, D.; Wuhrer, M. Linkage-specific sialic acid derivatization for MALDI-TOF-MS profiling of IgG glycopeptides. Anal. Chem. 2015, 87, 8284–8291. [Google Scholar] [CrossRef]
- Sekiya, S.; Wada, Y.; Tanaka, K. Derivatization for stabilizing sialic acids in MALDI-MS. Society 2005, 77, 4962–4968. [Google Scholar] [CrossRef]
- Cummings, R.D.; Pierce, J.M. Handbook of Glycomics; Elsevier: Amsterdam, The Netherlands, 2009. [Google Scholar]
- Kailemia, M.J.; Ruhaak, L.R.; Lebrilla, C.B.; Amster, I.J. Oligosaccharide analysis by mass spectrometry: A review of recent developments. Anal. Chem. 2015, 86, 196–212. [Google Scholar] [CrossRef] [Green Version]
- Kohler, J.J.; Patrie, S.M. Mass Spectrometry of Glycoproteins: Methods and Protocols. Springer Protoc.: Berlin/Heidelberg, Germany, 2013; pp. 197–215. [Google Scholar]
- Kang, P.; Mechref, Y.; Kyselova, Z.; Goetz, J.A.; Novotny, M.V. Comparative glycomic mapping through quantitative permethylation and stable-isotope labeling. Anal. Chem. 2007, 79, 6064–6073. [Google Scholar] [CrossRef] [PubMed]
- Ma, H.; Miao, X.; Ma, Q.; Zheng, W.; Zhou, H.; Jia, L. Functional roles of glycogene and N-glycan in multidrug resistance of human breast cancer cells. IUBMB Life 2013, 65, 409–422. [Google Scholar] [CrossRef] [PubMed]
- Atwood, J.A.; Cheng, L.; Alvarez-manilla, G.; Warren, N.L.; York, W.S.; Orlando, R. Quantitation by isobaric labeling: Applications to glycomics James. J. Proteome Res. 2008, 7, 367–374. [Google Scholar] [CrossRef] [PubMed]
- Apte, A.; Meitei, N.S. Bioinformatics in glycomics: Glycan characterization with mass spectrometric data using SimGlycan. Methods Mol. Biol. 2010, 600, 269–281. [Google Scholar] [CrossRef] [PubMed]
- Morrison, K.A.; Clowers, B.H. Contemporary glycomic approaches using ion mobility–mass spectrometry. Curr. Opin. Chem. Biol. 2018, 42, 119–129. [Google Scholar] [CrossRef] [PubMed]
- Barroso, A.; Giménez, E.; Konijnenberg, A.; Sancho, J.; Sanz-Nebot, V.; Sobott, F. Evaluation of ion mobility for the separation of glycoconjugate isomers due to different types of sialic acid linkage, at the intact glycoprotein, glycopeptide and glycan level. J. Proteomics 2018, 173, 22–31. [Google Scholar] [CrossRef] [Green Version]
- Ruotolo, B.T.; Benesch, J.L.P.; Sandercock, A.M.; Hyung, S.J.; Robinson, C.V. Ion mobility-mass spectrometry analysis of large protein complexes. Nat. Protoc. 2008, 3, 1139–1152. [Google Scholar] [CrossRef] [Green Version]
- Bush, M.F.; Hall, Z.; Giles, K.; Hoyes, J.; Robinson, C.V.; Ruotolo, B.T. Collision cross sections of proteins and their complexes: A calibration framework and database for gas-phase structural biology. Anal. Chem. 2010, 82, 9557–9565. [Google Scholar] [CrossRef]
- Campbell, M.P.; Royle, L.; Radcliffe, C.M.; Dwek, R.A.; Rudd, P.M. GlycoBase and autoGU: Tools for HPLC-based glycan analysis. Bioinformatics 2008, 24, 1214–1216. [Google Scholar] [CrossRef]
- Deshpande, N.; Jensen, P.H.; Packer, N.H.; Kolarich, D. GlycoSpectrumScan: Fishing glycopeptides from MS spectra of protease digests of human colostrum sIgA research articles. J. Proteome Res. 2010, 9, 1063–1075. [Google Scholar] [CrossRef]
- Lohmann, K.K.; von der Lieth, C.W. GlycoFragment and GlycoSearchMS: Web tools to support the interpretation of mass spectra of complex carbohydrates. Nucleic Acids Res. 2004, 32, 261–266. [Google Scholar] [CrossRef] [PubMed] [Green Version]
- Fellenberg, M.; Behnken, H.N.; Nagel, T.; Wiegandt, A.; Baerenfaenger, M.; Meyer, B. Glycan analysis: Scope and limitations of different techniques—A case for integrated use of LC-MS(/MS) and NMR techniques. Anal. Bioanal. Chem. 2013, 405, 7291–7305. [Google Scholar] [CrossRef]
- Hizal, D.B.; Wolozny, D.; Colao, J.; Jacobson, E.; Tian, Y.; Krag, S.S.; Betenbaugh, M.J.; Zhang, H. Glycoproteomic and glycomic databases. Clin. Proteomics 2014, 11, 1–10. [Google Scholar] [CrossRef] [Green Version]
- Functional Glycomics Gateway. Available online: http://www.functionalglycomics.org/ (accessed on 15 May 2020).
- Ranzinger, R.; Herget, S.; Wetter, T.; Von der Lieth, W. GlycomeDB—Integration of open-access carbohydrate structure databases. BMC Bioinform. 2008, 9, 1–13. [Google Scholar] [CrossRef] [PubMed] [Green Version]
- Cooper, C.A.; Joshi, H.J.; Harrison, M.J.; Wilkins, M.R.; Packer, N.H. GlycoSuiteDB: A curated relational database of glycoprotein glycan structures and their biological sources. Nucleic Acids Res. 2003, 31, 511–513. [Google Scholar] [CrossRef] [PubMed] [Green Version]
- Von Der Lieth, C.W.; Freire, A.A.; Blank, D.; Campbell, M.P.; Ceroni, A.; Damerell, D.R.; Dell, A.; Dwek, R.A.; Ernst, B.; Fogh, R.; et al. EUROCarbDB: An open-access platform for glycoinformatics. Glycobiology 2011, 21, 493–502. [Google Scholar] [CrossRef]
- Hirabayashi, J.; Tateno, H.; Shikanai, T.; Aoki-Kinoshita, K.F.; Narimatsu, H. The lectin frontier database (LfDB), and data generation based on frontal affinity chromatography. Molecules 2015, 20, 951–973. [Google Scholar] [CrossRef] [Green Version]
- Johannes, F.G.; Vliegenthart, L.D.; van Halbeek, H. High-resolution, 1H-nuclear magnetic resonance spectrometry as a tool in the structural analysis of carbohydrates related to glycoproteins. Adv. Carbohydr. Chem. Biochem. 1983, 41. [Google Scholar]
- Kam, R.K.T.; Poon, T.C.W. The potentials of glycomics in biomarker discovery. Clin. Proteomics 2008, 4, 67–79. [Google Scholar] [CrossRef] [Green Version]


| Sample Type | Glycan Alteration | Technique | Sample Treatment | Citation |
|---|---|---|---|---|
| Serum | Increase in under-galactosylated glycans and decrease in a core α-1,6-fucosylated bigalactosylated biantennary structure in individuals with more than 40–50 years of age. | DSA-FACE | Purification of immunoglobulins with protein L, denaturation, n-glycan release with PNGase F, sialidase treatment and APTS labelling. | [22] |
| Plasma | Increase of non-galactosylated glycans (A2 and FA2) and decrease of digalactosylated glycans (A2G2, FA2G2, A2BG2 and FA2BG2). Monogalactosylated glycans increase or decrease depending on the position of the galactose and the presence of bisecting GlcNAc. | HILIC-FLR | IgG isolation using protein G monolithic plates, “in gel” n-glycan release with PNGase F and 2-AB labelling. | [48] |
| Plasma | Non-galactosylated (A2, FA2 and FA2B) and monogalactosylated (FA2(6)BG1 and FA2(3)BG1) glycans steadily increase with age, compared to digalactosylated glycans (A2BG2, FA2G2, FA2G2S1 and FA2BG2S2) which decrease. | HPLC-FLR/MS | IgG isolation using protein G monolithic plates, denaturation, “in solution” n-glycan release, 2-AB labelling and HILIC-SPE purification. | [49] |
| Serum | Increased α2,6 sialic acid, mannose, n-acetylglucosamine and multiantennary complex type n-glycans. | Lectin-Based Protein Microarray | Isolation of α2M using a Co-Immunoprecipitation Kit, incubation with 8 different lectins and labelling with CF647-streptavidin conjugate. | [50] |
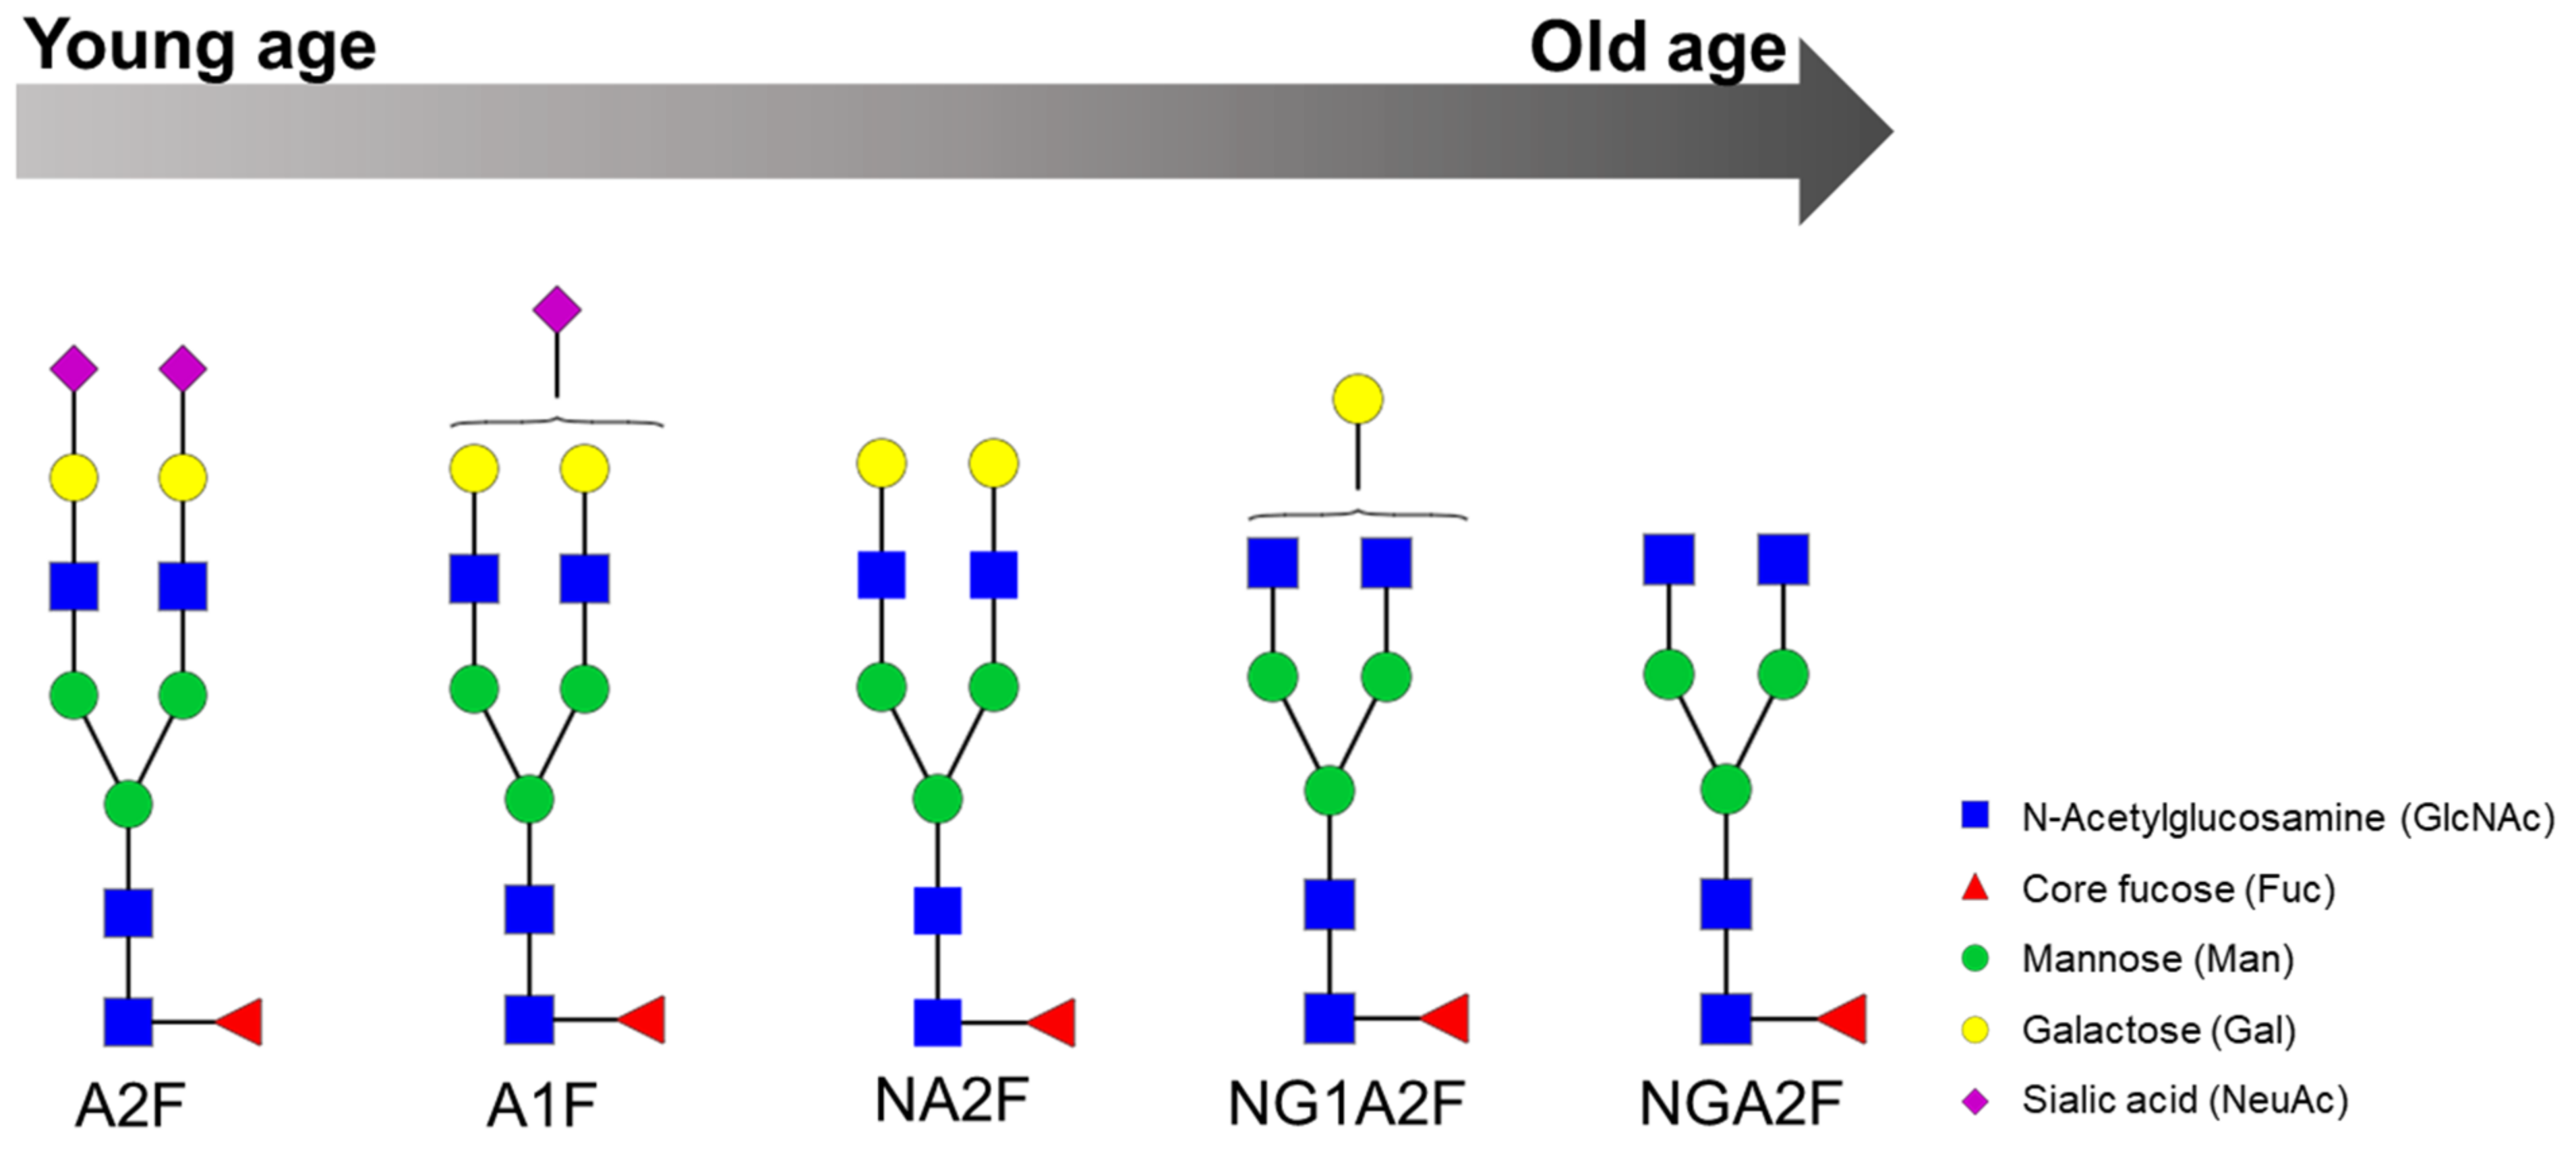
| Serum | The log of the ratio of two glycans (NGA2F and NA2F), named GlycoAgeTest, remains steady up to the age of 40 years and thereafter gradually increases. Patients with dementia or Cockayne syndrome have a higher GlycoAgeTest level than age-matched healthy individuals. | DSA-FACE | Denaturation, n-glycan release with PNGase F, APTS labelling and desialylation. | [11] |
| Plasma | Significant differences in glycan microheterogeneity, with an increased sialic acid content released from newborn umbilical cord (NUCP) α-2-macroglobulin (A2M). | FACE | Neuraminidase digestion, and use of electrophoresis, Western blotting and immunostaining to determine the degree of sialylation and terminal galactosylation. n-glycan profile: A2M purification with immunoprecipitation, denaturation, n-glycan release with PNGase F, protein precipitation, evaporation and 7-amino-1,3-naphthalenedisulfonic acid (ANDS) labelling. | [51] |
| Placenta | Differences in the abundance of high mannose n-glycans, 2- sialylated biantennary n-glycans, 3- (core)fucosylated biantennary n-glycans, 4- highly fucosylated n-glycans, 5- bisected n-glycans and 6- multiantennary n-glycans. | MALDI-TOF MS | Denaturation, reduction, alkylation, n-glycan release with PNGase F, glycan purification with porous graphic carbon columns, permethylation for the stabilisation of sialic acids, further purification with C18 columns and mixture with 2,5-DHB matrix. | [52] |
| Serum and pituitary extracts | Most TSH molecules are low-n-glycosylated, highsulfonated and low-sialylated in children up to 18 months, compared with older children and adults. The degree of n-glycosylation is similar in serum and pituitary extracts up to 3 months of age and after that is higher in serum than in pituitary extracts. | Competitive binding radioimmunoassay and noncompetitive time-resolved sandwich fluoroimmunoassay | Use of electrophoresis to measure frequencies of glycoforms and neuraminidase treatment to determine sialic acids in serum and pituitary extracts. Homogenisation of pituitary extracts and quantification of TSH with the two immunoassays. | [53] |
| Skin | Significant quantitative decreases in high mannose glycans in aged skin. | HILIC-FLR | - | [54] |
| Plasma | Galactosylation and sialylation decrease with increasing age and show significant sex dependence. Females in their 45 to 60 years show the most prominent drop in the levels of galactosylated and sialylated glycoforms. The incidence of bisecting n-acetylglucosamine increases in younger individuals and reaches a plateau at older age. | MALDI-TOF-MS and HILIC-FLR | IgG isolation using protein G monolithic plates. n-glycan release with PNGase F and 2-AB labelling. | [55] |
| Plasma | Galactosylation tends to decrease with age as di-galactosylated glycopeptides are less abundant in older participants, while nongalactosylated glycopeptides are more abundant in older participants. | MALDI-TOF-MS | Glycopeptides: IgG isolation using a protein A affinity purification step, trypsin digestion and purification with C18-SPE plate and mixture with a-cyano-4-hydroxy-cinnamic acid matrix | [56] |
| Plasma | Bisection, galactosylation, sialylation of diantennary species and tetraantennary species, as well as the size of high-mannose species are important plasma characteristics associated with inflammation and metabolic health. | MALDI-FTICR-MS | Protein denaturation, n-glycan release with PNGase F, 2-aminobenzoic acid (2-AA) labelling, HILIC-SPE purification and carbon-SPE desalting. | [57] |
| Plasma | Glycosylation patterns of α1-antitrypsin (αAT) enriched fractions are associated with chronological age and differ between females and males. Pronounced differences exist between males and females in the glycosylation profiles of immunoglobulin A enriched fractions. | CE-LIF | Protein denaturation, n-glycan release with PNGase F, APTS labelling and HILIC-SPE purification. | [58] |
| Serum | Age-related changes are observed in n-glycans NGA2F, NGA2FB and NA2F (agalactosylated core-α-1,6-fucosylated biantennary glycan, core-α-1,6-fucosylated bisecting biantennary glycan and bigalactosylated core-α-1,6-fucosylated biantennary glycan, respectively). Furthermore, fucosylation of n-glycans is significantly different between men and women: more core-α-1,6-fucosylated glycans are detected in women, whereas more branching-α-1,3-fucosylated n-glycans are seen in men. | DSA-FACE | Protein denaturation, n-glycan release with PNGase F, sialidase treatment (neuraminidase) and APTS labelling. | [59] |
| Disease | Sample Type | Glycan Alteration | Technique | Sample Treatment | Citation |
|---|---|---|---|---|---|
| Alzheimer’s disease | Plasma | Lower abundance of complex galactosylated and sialylated forms in patients with AD. | NanoLC-MS/MS (Orbitrap) | Reduction, alkylation, trypsin digestion and sialidase digestion. | [24] |
| Amyotrophic lateral sclerosis | Serum | High levels of sialylated glycans and low levels of core fucosylated glycans in patients with ALS, compared to healthy volunteer sera. | MALDI-TOF MS, HPLC-FLR | IgG purification with protein G beads, reduction, IgG separation with SDS-PAGE, n-glycan release with PNGase F, n-glycan extraction from gel pieces, decontamination with ion-exchange resin, 2-AB labelling and further exoglycosidase digestion. Desalting and mixture with DHB for MALDI-TOF MS analysis. | [68] |
| Amyotrophic lateral sclerosis | Cerebrospinal fluid | Detection of diantennary n-glycans predominantly with proximal fucose and some bisecting GlcNAc; agalacto-, mono- and digalactosylated as well as α2,6-sialylated structures in ALS patients. Furthermore, increased levels of galactosylated structures in ALS patients. | HPLC-FLR, MALDI-TOF-MS | IgG isolation with protein G cartridge, evaporation, protein precipitation and denaturation, n-glycan release with PNGase F, purification with porous graphitic carbon cartridges, evaporation and 2-AB labelling. Further exoglycosidase treatment for structure elucidation. Mixture with DHB for MALDI-TOF-MS analysis. | [69] |
| Amyotrophic lateral sclerosis | Cerebrospinal fluid | Determination of complex diantennary structures with sialic acid in α2,3- and α2,6-linkage, bisecting n-acetylglucosamine-containing structures as well as peripherally 30 fucosylated structures. Increase of monosialylated diantennary glycans A2G2S(6)1 and FA2G2S(3)1 in ALS. | HPLC-FLR, RP-HPLC/MS/MS | Protein precipitation, denaturation, reduction, trypsin digestion, purification with C18 cartridges, evaporation, n-glycan release with PNGase F, separation and desalting of n-glycans with C18 and porous graphitic carbon cartridges, respectively. 2-AB labelling and purification by gel filtration. Further exoglycosidase treatment for structure elucidation. | [70] |
| Parkinson’s disease | Plasma | PD patients showed a reduced relative abundance of a high-mannose n-glycan structure, a monosialylated n-glycan structure and a core fucosylated monosialylated n-glycan structure with an additional fucose attached to one antenna, as well as an increased relative abundance of a core fucosylated monogalactosylated n-glycan structure. | HILIC-FLR | IgG isolation using protein G monolithic plates, evaporation, denaturation, n-glycan release with PNGase F, 2-AB labelling and HILIC-SPE purification. | [40] |
| Parkinson’s disease | Serum | Low sialylation and increased fucosylation is increased in PD patients on tri-antennary glycans with 2 and 3 terminal sialic acids. | CE-MS/MS | Denaturation, reduction, alkylation, n-glycan release with PNGase, filtering, evaporation, hydrolysis of the glycosylamines, 2-AA labelling and HILIC purification. | [71] |
| Disease | Sample Type | Glycan Alteration | Technique | Treatment | Citation |
|---|---|---|---|---|---|
| Hepatocellular carcinoma | Serum | One triantennary glycan (NA3Fb) is correlated with tumour stage in HCC patients. | DSA-FACE | Purification of immunoglobulins with protein L, denaturation, n-glycan release with PNGase F, sialidase treatment and APTS labelling. | [74] |
| Breast cancer | Serum | Increases in sialylation and fucosylation of glycan structures appear to be indicative of cancer progression. Changes in the relative intensities of 8 n-glycans are characteristic of breast cancer (n-glycans sialylated to a different degree (mono-, di-, tri- and tetrasialylated) and 5 of these structures are fucosylated (2 of them difucosylated)). | MALDI-MS | Reduction, alkylation, trypsin digestion, n-glycan release with PNGase F, purification with activated charcoal microcolumns, permethylation and mixture with 2,5-DHB matrix. | [75] |
| Breast cancer | Serum | Increase in siaylation and changes in fucosylation in breast cancer patient sera compared to that from controls. Furthermore, patients show elevated levels of the sLex-carrying triantennary structure, A3FG1, derived from the monofucosylated trisialylated triantennary n-glycan (A3FG3S3). | CapLC-QTOF | In-gel n-glycan release with PNGase F and 2AB labelling/reduction, alkylation, n-glycan release with PNGase F and in-gel trypsin digestion. | [76] |
| Breast cancer | Serum | Presence of 15 unique serum glycan markers in all patients but absent in normal individuals. | MALDI-FT-ICR | β-elimination, glycan purification with a graphitised carbon cartridge and mixture with a DHB and DHAP matrix. | [77] |
| Breast cancer | Serum | Increased levels of α2,3 sialylation in breast cancer samples. | MALDI-TOF-MS | Trypsin digestion, denaturation, reduction, n-glycan release with PNGase F, purification with C18 micro-spin columns and Graphite micro-spin columns, sialic acid amidation and clean-up and solid-phase permethylation | [78] |
| Breast cancer | Serum | Breast cancer patients exhibit a characteristic pattern of IgG Fc region n-glycosylation. | MALDI-MS | IgG isolation, SDS-PAGE, enzymatic glycan release, methylamidation of n-glycan sialic acid and AQ-labeling. | [26] |
| Gastric cancer | Serum | 9 n-glycan structures altered and decrease of core-fucosylated structures. | DSA-FACE | Enzymatic glycan release, 8-aminonaphthalene-1,3,6-trisulfonic acid disodium salt (ANTS) labelling and sialidase digestion. | [79] |
| Pancreatic cancer | Serum | Aberrant glycosylation in four proteins (LIFR, CE350, VP13A, HPT) found in sera from pancreatic cancer patients compared to those of controls. | NanoLC-MS/MS | Immunodepletion, incubation with PHA-L lectin, reduction, alkylation, PNGase F and trypsin digestion. | [80] |
| Lung cancer | Plasma and serum | Significant elevation of α2−6 sialylation, β1−4 branching, β1−6 branching, antennary fucosylation and total n-glycosylation level in almost every stage of lung cancer relative to control groups. | GC-MS | Permethylation, nonreductive release, purification, hydrolysis, reduction and acetylation. | [81] |
| Colorectal cancer | Serum | Increased degree of fucosylation in CRC patients. | Lectin Based Protein Microarray | Transferrin isolation, incubation with fourteen biotinylated lectins, wash with PBST and exposition to CF647-streptavidin conjugate. | [82] |
| Colorectal cancer | Plasma | Increased levels of sialylation and fucosylation. | Lectin blot analysis | Delipidation, immunodepletion and incubation with agarose-bound lectins. | [83] |
| Colorectal cancer | Serum | Decreased levels of total core fucose residues. | DSA-FACE | Enzymatic glycan release, 8-Aminonaphthalene-1,3,6-trisulfonic acid disodium salt (ANTS) labelling and sialidase digestion. | [84] |
| Colorectal cancer | Serum | Increased α2,6Sia, GlcNAc and mannose (Man) residues, as well as increased multiantennary complex type n-glycans. | Lectin Based Protein Microarray | α2M isolation by immunoprecipitation, incubation with set of lectins and streptavidin labelling. | [85] |
| Prostate cancer | Serum | Four high-mannose (Man6-Man9) type, one neutral and one acidic complex-type glycans are down-regulated in the patient group while one acidic complex-type glycan is up-regulated in the patient group with active disease. | MALDI-FT-ICR | Denaturation, enzymatic release, ethanol precipitation and SPE purification. | [86] |
| Ovarian cancer | Plasma | Up-regulated fucosylated glycans in healthy samples when compared to cancerous and benign tumour control samples. | MALDI-FT-ICR MS and NanoLC-MS/MS (Orbitrap) | Dialysis, b-elimination, SPE with graphitised carbon cartridges and pronase digestion. | [87] |
| Cancer | Serum | Significantly increased monofucosylated n-glycans at all glycosylation sites in all cancer samples. Increased core-type fucosylated n-glycans in gastroenterological cancer samples, increased core-type fucosylated n-glycan in prostate cancer samples and increased Lewis-type fucosylated n-glycan in metastatic prostate cancer and gastroenterological cancer. | HPLC-MS | Haptoglobin purification, reduction, alkylation, lysylendopeptidase, trypsin and endoprotease Glu-C digestion, affinity separation with Sepharose CL4B and desialylation. | [88] |
| Sample Type | Glycan Alteration | Technique | Treatment | Citation |
|---|---|---|---|---|
| Plasma | Decreased agaloctosylated glycans without galactose and increased monogalactosylated glycans and fucosylated structures with bisecting GlcNAc. | HPLC-FLR | IgG isolation using protein G monolithic plates, “in solution” and “in gel” glycan release and labelling using PNGase F and 2-aminobenzamide (2-AB), respectively. | [8] |
| Plasma | Decreased galactosylation and sialyation, increase in fucosylated structures with bisecting GlcNAc and decrease in fucosylated structures without bisecting GlcNAc. | HPLC-FLR | IgG isolation using protein G monolithic plates, denaturation, glycan release, 2-AB labelling and HILIC-SPE purification. | [9] |
| Serum | Reduced α(1,6)-linked arm monogalactosylated and core-fucosylated diantennary n-glycans (NG1[6]A2F). | DSA-FACE | Denaturation, n-glycan release with PNGase F, APTS labelling and sialidase digestion. | [19] |
| Plasma | Decreased galactosylated glycan structures and increased agalactosylated glycan structures. | HPLC-FLR | IgG isolation using protein G monolithic plates, denaturation, “in solution” glycan release, 2-AB labelling and HILIC-SPE purification. | [25] |
| Plasma | Compared to controls, T2DM patients show decreased core fucosylated glycans, decreased levels of low-branching and increased levels of high branching plasma n-glycans, as well as statistically significantly increased levels of di (S2) and trisialylated (S3) plasma n-glycans. | HILIC-FLR | Denaturation, n-glycan release with PNGase F, 2-AB labelling and HILIC-SPE purification. | [91] |
| Plasma | Eighteen glycosylation features are significantly associated with T2DM. Fucosylation and bisection of diantennary glycans are decreased in diabetes, α2,6-linked sialylation is increased and α2,3-linked sialylation of triantennary glycans is decreased. | MALDI-TOF MS | Denaturation, n-glycan release with PNGase F, ethyl-esterification of sialic acids, purification with GHP membrane plate and mixture with super-DHB matrix. | [92] |
| Plasma | GlycA, a glycoprotein biomarker, is associated with incident T2DM. | NMR | Separation of proteins from lipoproteins with the addition of sodium bromide and further centrifugation and filtering with 10 kDa filters. | [93] |
| Disease | Sample Type | Glycan Alteration | Technique | Treatment | Citation |
|---|---|---|---|---|---|
| Metabolic Syndrome | Plasma | Specific n-glycan structural features (trigalactosylated, biantennary, triantennar, core-fucosylate, monosialylated, disialylated and trisialylated glycans) are significantly correlated with MetS related risk factors. | HILIC-FLR | Reduction, n-glycan release with PNGase F, 2AB labelling and sialydase digestion. | [95] |
| Metabolic Syndrome | Serum | Significantly elevated levels of NGA2FB and NA3F and lower level of the α(1,6)-arm monogalactosylated glycan (NG1A2F) in women with MetS. | DSA-FACE | Denaturation, n-glycan release with PNGase F, APTS labelling and sialidase digestion. | [20] |
| Hypertension | Plasma | Decrease of galactosylation in IgG subclasses IgG1, IgG2/3 and IgG4 with increasing blood pressure. | NanoHPLC-MS | IgG isolation using protein G monolithic plates, trypsin digestion, reverse-phase desalting and purification. | [96] |
| Hypertension | Plasma | Five glycans (IgG with digalactosylated glycans) significantly differ in participants with prehypertension or hypertension compared to those with normal blood pressure, while 17 other glycan traits significantly differ in participants with hypertension compared to those of normal blood pressure. | HILIC-FLR | “In solution” denaturation, “in gel” enzymatic glycan release with PNGase F and 2-aminobenzamide labelling. | [97] |
| Hypertension | Plasma | Ten IgG n-glycan traits (i.e., IgG1G0F, IgG2G0F, IgG2G1FN, IgG2G1FS, IgG2G2S, IgG4G0F, IgG4G1FS, IgG4G1S, IgG4G2FS and IgG4G2N) representing galactosylation and sialylation are significantly associated with hypertension. | NanoRP-HPLC-MS | IgG isolation by affinity chromatography and trypsin digestion. | [98] |
| Cardiometabolic disease | Plasma | Two agalactosylated glycans and a glycan containing a bisecting GlcNAc are significantly higher in participants with MetS compared to controls, whereas a higher level of a digalactosylated n-glycan is present in participants without MetS. | HILIC-MS | IgG isolation using protein G monolithic plates, denaturation, “in solution” n-glycan release, 2-AB labelling and HILIC-SPE purification. | [21] |
| Atherosclerotic cardiovascular disease | Serum | A large number of n-glycan traits related to core-fucose and bisecting GlcNAc are strongly associated with atherosclerotic plaque. One specific trait related to the sialylated n-glycan appears to be strongly negatively related to circulating VLDL and is supportive of a role of IgG glycosylation in VLDL metabolism and arterial lesion formation also in humans. | HILIC-FLR | IgG isolation using protein G monolithic plates, denaturation, n-glycan release with PNGase F, 2-AB labelling and HILIC-SPE purification. | [99] |
| Chronic kidney disease | Plasma | Altered glycans with galactosylation, sialylation and bisecting n-acetylglucosamine features. | HPLC-FLR | IgG isolation using protein G monolithic plates, denaturation, glycan release, 2-AB labelling and HILIC-SPE purification. | [100] |
| Dyslipidaemia | Plasma | Possible association between blood lipids and the loss of galactose and sialic acid. Moreover, the addition of bisecting GlcNAcs might be related to the chronic inflammation accompanied with the development and procession of dyslipidaemia. | HILIC–UPLC | IgG isolation using protein G monolithic plates, “in solution” n-glycan release with PNGase F and 2-AB labelling. | [101] |
| Disease | Sample Type | Glycan alteration | Technique | Treatment | Citation |
|---|---|---|---|---|---|
| Inflammatory bowel disease | Plasma | Lower levels of IgG galactosylation compared to controls. | nanoLC-MS | IgG purification by Protein G affinity chromatography and tryptic digestion. | [23] |
| Inflammatory bowel disease | Serum | Decreased IgG galactosylation and proportion of sialylated structures. | HILIC-UPLC | IgG isolation using protein G monolithic plates, denaturation, “in solution” denaturation, n-glycan release with PNGase F, 2-AB labelling and HILIC-SPE purification. | [110] |
| Inflammatory Bowel Diseases | Plasma | Higher abundance of large-size glycans in IBD patients compared with controls, a decreased relative abundance of hybrid and high-mannose structures, lower fucosylation, lower galactosylation and higher sialylation (α2,3- and α2,6-linked). | MALDI-TOF-MS | Denaturation, n-glycan release with PNGase F, esterification of sialic acids, HILIC purification with a GHP membrane and mixture with super-DHB matrix or DHB matrix. | [112] |
| Inflammatory Bowel Disease | Serum | The agalactosyl fraction of the fucosylated IgG oligosaccharides is significantly greater in IBD patients compared to healthy volunteers. The extent of agalactosylation of IgG correlates with disease activity of IBD and is a potentially effective diagnostic marker for IBD. | RP HPLC-FLR | IgG purification using protein G sepharose, n-glycan release with PNGase F and 2-aminopyridine labelling. | [115] |
| Rheumatoid arthritis | Serum | Treatment with methotrexate or/and Remicade indicates an increase of IgG galactosylation. | Modified ELISA-plate test, biosensor BIAcore, GC-MS | Isolation of IgG by affinity chromatography on Protein A-Sepharose column, protein denaturation, reduction and dialysis. Hydrolysation, evaporation and neutralisation for GC-MS analysis. Elisa-plate test: Reduction of purified IgG, interaction with two lectins and ExtrAvidin-AP conjugation. Biosensor BIAcore: Lectin immobilisation and measurement of the binding. | [116] |
| Rheumatoid arthritis | Serum | Peaks of glycans with agalactosylated glycan structures are increased in Rheumatoid arthritis cases. | HILIC -FLR | IgG isolation using protein G monolithic plates, denaturation, n-glycan release with PNGase F, 2-AB labelling and HILIC-SPE purification. | [117] |
| Rheumatoid arthritis | Serum | Statistically significant increases in bisecting glycans FA2BG2 and FABG2S1 seropositive RA, accompanied by decrease of bisecting monogalactosylated glycan FA2[6]G1 and non-bisecting monosialylated glycan FA2[3]G1S1. | CE-LIF | Isolate IgG with protein A microwell plate, n-glycan release with PNGase F, APTS labelling and clean-up. | [118] |
| Rheumatoid arthritis | Serum | Aberrant galactosylation of IgG in RA compared to healthy controls. Significant correlation between levels of aberrant IgG galactosylation and disease activity (higher in females than males). | HPLC-FLR | Purify IgG using a protein G HP column, reduce, alkylate and immobilise in SDS-polyacrylamide gel matrix. Release glycans with PNGase F and label with 2-aminobenzamide | [119] |
| Rheumatoid arthritis | Serum | Patients with RA have a decrease in galactose content in IgG, which is associated with the disease activity, disease duration and stage of joint destruction. | GC | Purification of IgG, evaluation of neutral monosaccharides through phenolsulfuric acid method, methanolysis and silylation. | [120] |
| Rheumatoid Arthritis | Plasma | Structure GP1 (agalactosylated glycan) might have potential as a putative biomarker for RA in the Han Chinese population, while the change in IgG glycosylation shows association with the RA active and remission states. | HPLC-FLR | IgG isolation with protein G plate, reduction, alkylation, in-gel n-glycan release with PNGase F, 2-AB labelling, SPE purification. | [121,122] |
| Idiopathic inflammatory myopathies | Serum | IIM patients contain less galactosylated epitopes compared to healthy controls and the Fc-glycan profile of Jo1+ patients contains less bisected and afucosylated glycans compared to Jo1− patients. | nanoRP-LC-MS/MS (Orbitrap) | Glycopeptides: IgG isolation, reduction, alkylation, trypsin digestion, desalting with C18 plates and evaporation. | [123] |
Publisher’s Note: MDPI stays neutral with regard to jurisdictional claims in published maps and institutional affiliations. |
© 2021 by the authors. Licensee MDPI, Basel, Switzerland. This article is an open access article distributed under the terms and conditions of the Creative Commons Attribution (CC BY) license (https://creativecommons.org/licenses/by/4.0/).
Share and Cite
Paton, B.; Suarez, M.; Herrero, P.; Canela, N. Glycosylation Biomarkers Associated with Age-Related Diseases and Current Methods for Glycan Analysis. Int. J. Mol. Sci. 2021, 22, 5788. https://doi.org/10.3390/ijms22115788
Paton B, Suarez M, Herrero P, Canela N. Glycosylation Biomarkers Associated with Age-Related Diseases and Current Methods for Glycan Analysis. International Journal of Molecular Sciences. 2021; 22(11):5788. https://doi.org/10.3390/ijms22115788
Chicago/Turabian StylePaton, Beatrix, Manuel Suarez, Pol Herrero, and Núria Canela. 2021. "Glycosylation Biomarkers Associated with Age-Related Diseases and Current Methods for Glycan Analysis" International Journal of Molecular Sciences 22, no. 11: 5788. https://doi.org/10.3390/ijms22115788