Article

Characterisation of Organic Matter and Its Transformation Processes in On-Site Wastewater Effluent Percolating through Soil Using Fluorescence Spectroscopic Methods and Parallel Factor Analysis (PARAFAC)

1
Department of Civil, Structural and Environmental Engineering, Trinity College Dublin, D02 PN40 Dublin, Ireland
2
Mathematics Applications Consortium for Science and Industry (MACSI), University of Limerick, V94 T9PX Limerick, Ireland
*
Author to whom correspondence should be addressed.
Water 2021, 13(19), 2627; https://doi.org/10.3390/w13192627
Submission received: 30 June 2021 / Revised: 20 September 2021 / Accepted: 21 September 2021 / Published: 24 September 2021
(This article belongs to the Special Issue On-Site Wastewater Treatment)

Abstract

:
This research has used fluorescence spectroscopy and parallel factor analysis (PARAFAC) in order to characterize dissolved organic matter in septic tank effluent, as it passes through the biomat/biozone, infiltrating into the unsaturated zone beneath domestic wastewater treatment systems (DWWTSs). Septic tank effluent and soil moisture samples from the percolation areas of two DWWTSs have been analyzed using fluorescence excitation–emission spectroscopy. Using PARAFAC analysis, a six-component model was obtained whereby individual model components could be assigned to humified organic matter, fluorescent whitening compounds (FWCs), and protein-like compounds. This has shown that fluorescent dissolved organic matter (FDOM) in domestic wastewater was dominated by protein-like compounds and FWCs and that, with treatment in the percolation area, protein-like compounds and FWCs are removed and contributions from terrestrially derived (soil) organic decomposition compounds increase, leading to a higher degree of humification and aromaticity. The results also suggest that the biomat is the most important element determining FDOM removal and consequently affecting DOM composition. Furthermore, no significant difference was found in the FDOM composition of samples from the percolation area irrespective of whether they received primary or secondary effluent. Overall, the tested fluorometric methods were shown to provide information about structural and functional properties of organic matter which can be useful for further studies concerning bacterial and/or virus transport from DWWTSs.

1. Introduction

In many countries (e.g., USA and Ireland), rural areas rely heavily on on-site domestic wastewater treatment systems (DWWTSs), which typically consist of a septic tank or packaged secondary treatment system followed by a percolation area [1,2]. The underlying soil/subsoil into which the wastewater effluent percolates provides a critical zone with respect to the protection of water resources from both a public health as well as broader environmental perspectives. The key to effective on-site treatment is to maintain an unsaturated subsoil through which the effluent can percolate freely and wherein chemical and microbiological contaminants will be attenuated to an acceptable level before they reach the groundwater [3].
The biomat/biozone which develops in the soil directly beneath the infiltrative surface of the percolation trenches acts to regulate the hydraulic and contaminant pollutant loading through the interface [4,5]. The nature and extent of the biomat formation has received some targeted research, with studies indicating that it is an integral component determining contaminant attenuation in the percolation areas of DWWTSs [6,7,8,9,10]. Most studies have focused on studying the mechanism of soil clogging which has provided some information about the types of organic matter (OM) found in DWWTSs. In the biomat, the enhanced biological processes involve the production of microbial cells and organic by-products (e.g., extracellular polymeric substances) from stimulated microbial growth and decay [11,12]. Research has also suggested that the cyclical aerobic–anaerobic conditions stimulated during subsurface infiltration may support microbial formation and accumulation of complex organic material within the biomat [8,13]. Non-humified (i.e., polysaccharides) and less-humified (i.e., fulvic acid) carbonaceous materials have generally been found in lower concentrations relative to the more humified carbonaceous materials (i.e., humic acid and humin) which traditionally have been considered to contain more complex molecular structures that are slower to biodegrade. As a result, less degradable materials can accumulate in soil pores and become a key agent responsible for long-term soil clogging [13]. It should be noted that there is an ongoing debate as to what terms such as humic substances actually refer to, with the more traditional view of it representing large-molecular-size and persistent compounds left from the decomposition process being challenged and that, in reality, soil organic matter should be viewed more as a continuum of decomposition products [14]. Others prefer to retain the use of such terms but recognize the need for them to be defined more accurately [15].
However, the exact nature of the dissolved organic matter (DOM) that either pass through or are released from the biomat has received little research, even though it is critical to other contaminant processes such as nitrogen cycling [7,16] and pathogen/viral transport [17,18,19,20,21,22,23]. Previous studies have assumed that OM facilitates microorganism transport by competing with bacteria (for example) for sediment sorption sites [23,24,25]. However, interactions are more complex, are dependent on the type and chemical characteristics of OM as well as on the type of bacterium or virus, and are further affected by other environmental conditions (e.g., pH) and inorganic constituents [20,21,23]. Moreover, DOM consists of a complex mixture of organic compounds with different chemical characteristics.
Fluorescence has become a popular tool for scientists and engineers to study and monitor the concentration and composition of fluorescent dissolved organic matter (FDOM) in wastewater and aquatic systems [26,27,28,29,30,31,32]. Distinctive peaks in excitation–emission Matrices (EEMs) can provide indications of sources, behavior, and biogeochemical cycling of FDOM and represent a potentially powerful tool to monitor compositional changes in DOM [30]. Because of the heterogeneous nature of DOM comprising compounds with a variety of complex chemical structures, spectral overlapping and peak shifting and broadening often occurs, making it difficult to identify and interpret spectral signatures. However, parallel factor (PARAFAC) analysis has evolved as a technique for resolving the spectral overlapping of FDOM.
In this study, fluorometric methods combined with PARAFAC analysis have been used to characterize FDOM in the percolation area of DWWTSs. This research demonstrates the type of information that can be obtained from these methods about the transformation of organics in the effluent as they pass through the biomat and infiltrate into the unsaturated zone beneath, which should allow further insights into linked contaminant attenuation and transformation processes.

2. Materials and Methods

2.1. Study Sites and Sampling

Samples were taken from two very similar DWWTSs with percolation areas in high to moderate permeability subsoils consisting of tills derived mainly from limestone. On-site falling head percolation tests, known nationally as the t-test [33], were used to determine the permeability of the subsoils at the level of the infiltrative surface in the percolation trenches. Site 1 was constructed in September 2015 and received effluent from a single household with four occupants. The subsoil was of relatively high permeability (t-value 13.0 min/25 mm, Ksat = 32.2 cm/d) and was classified as sandy LOAM according to British Standard BS 5930 [34]. Site 2 was constructed in April 2016 and also received effluent from a single four-person household. Effluent was discharged into a subsoil of moderate permeability (T-value 35.6 min/25 mm, Ksat = 11.4 cm/d), which had a higher silt and clay fraction (44% and 17.5%) than Site 1 (30% and 11.5%) and was classified as sandy silt LOAM. The sites had been set up such that half of the percolation area at each site (2 trenches) was receiving primary effluent (PE) from a septic tank while the other two trenches at each site were receiving secondary treated effluent (SE) from a small, packaged treatment plant (a coconut husk filter with intermittent pumped flow at Site 1 and a rotating biological contactor with continuous gravity flow at Site 2)—see schematic diagram in Figure S1. Primary and secondary effluent samples were taken and soil moisture samples were extracted from different depths across the percolation areas via suction lysimeters (Soilmoisture Equipment Corp., Goleta, CA, USA). A vacuum of approximately 0.5 bar was applied to the lysimeters using a hand pump in order to collect percolating effluent (and rainfall recharge) from a horizontal depth plane within the vadose zone over a 24-h time frame. A total of 16 effluent samples (8 PE and 8 SE) and 65 soil moisture samples (34 from PE trenches and 31 from SE trenches) were taken in August 2016 and in February, March, and July 2017. The sampling depths, in which lysimeters were installed, ranged from 10 to 55 cm below the infiltrative surface at the base of the trenches. Most samples were taken within 1 to 15 m along the 20 m long trenches, except for one control sample was taken at 17.5 m which was known to be outside of the zone receiving effluent.
Samples for fluorometric analysis were kept in amber glass bottles to protect them from UV light. Water samples were filtered using 0.45-µm syringe filters (Sartorius Minisart RC) and refrigerated until spectral analysis later that same day. The DOC for all samples was determined using the high temperature combustion method (TOC-L, Shimadzu). Carbonates were removed as CO2 by sparging the acidified (HCl) sample.
All analyses were also carried out on Suwannee River Natural Organic Matter (SR-NOM, International Humic Substances Society, IHSS, RO isolation, Catalog #2R101N), which is commonly used as a reference for natural organic matter. For these samples, a solution at a concentration of 14 mg/L was prepared in distilled water.

2.2. Spectral Analysis

A LS55 Fluorescence Spectrometer (Perkin Elmer, Waltham, MA, USA) and a 10 × 10 mm Suprasil quartz cuvette (Hellma Analytics, Müllheim, Germany) were used for the fluorescence measurement. A slit width of 10 nm was used for all scans. Raw excitation–emission matrices (EEMs) were recorded at excitation wavelengths of λex = 230–455 nm in 5-nm increments and emission wavelengths of λem = 290–700 nm in 0.5 nm increments. For later correction, blank EEMs (as above) and Raman peak scans (λex = 275 nm, λem = 285–450 nm) of distilled water were collected daily. For the determination of humification and fluorescence indices, single emission scans were taken at λex = 254 nm, λem = 280–500 nm, λex = 370 nm, and λem = 400–700 nm.
Absorption spectra (λ = 230–700 nm in 1 nm intervals) were recorded using a Lambda 35 UV-Vis spectrometer (Perkin Elmer) and were corrected using distilled water as a blank. For all samples, the same dilutions as for the EEM recordings were analyzed and the same cuvettes were used.
A subset of unfiltered samples were also analyzed for the presence of fluorescent whitening compounds (FWCs) using the photodecay method described in Dubber and Gill [33]. The photodecay of the samples was measured in triplicate (and occasional verification with further 2 replicates). The ratio of the fluorescence signal reduction observed after 1 min to the reduction after 10 min of UV exposure was determined and samples with a ratio (1/10 min) > 0.25 are considered to contain FWCs [35]. See Figure S2 in the Supplemental Information for a schematic of the analytical procedure.

2.3. Data Processing and Analysis

2.3.1. PARAFAC Analysis

Using MATLAB R2016b and the toolbox drEEM 0.2.0 [36], data of all recorded EEMs were imported and arranged into a trilinear multi-way data array. Before performing the PARAFAC analysis, the dataset was pre-processed, corrected, and normalized according to the methods described by Murphy et al. [36]. A spectral correction of the raw instrument data in order to correct systematic biases was not necessary as this is done automatically by the LS55 fluorometer using an instrument specific correction matrix. However, in order to correct the data for inner filtering effects, the sample’s absorbance spectrums were used. In another pre-processing step, the data from Raman bands and Rayleigh scatter peaks were excised from the EEMs. Using the smootheem function (drEEM 0.2.0 toolbox), the missing data from secondary Rayleigh scatter and Raman peaks were interpolated. Finally, the data were normalized using the respective tool supplied with the drEEM toolbox which divides the data by the sum of the squared value of all variables for the sample.
PARAFAC models with four to seven components were computed for the EEMs. The number of components in the final PARAFAC model was selected based on the residual analysis. A further increase in the number of components was not considered where the sum of squared residuals in the excitation and emission scans showed only little improvement. The model was then validated using the split-half analysis, as described by Murphy et al. [36].

2.3.2. Fluorescence Indices

From the single fluorescence emission scans, the humification index HI [37] and the fluorescence index FI [29] were determined using Equations (1) and (2), respectively.
H I = 435 480 F 254 , λ e m d λ e m 300 345 F 254 , λ e m d λ e m
F I = F 370 , 450 F 370 , 500

2.3.3. Principal Component Analysis (PCA)

A principal component analysis (PCA) was performed for all effluent and trench samples using the proportions of the 6 contributing fluorophores described by the PARAFAC analysis. The analysis was carried out using SPSS 22 with a covariance matrix and varimax rotation. The extraction of factors was performed based on an Eigenvalue > 1. Factor loadings for the variables as well as objective scores for each sample were extracted to create component plots and biplots, respectively.

3. Results

3.1. PARAFAC Analysis

From the PARAFAC analysis, a validated six-component model was obtained (Figure 1).
The proportional contribution of the PARAFAC model components C1 and C3 are positively correlated with the HI (r (84) = 0.66 and 0.74, respectively, with p < 0.001, see also Figure S3) so that these components can be assigned to sources with a high degree of humification. The fluorescence peak of aquatic humic-like material, observed in both marine and terrestrial FDOM, has been previously described to be at Ex/Em = 260/380–460 nm and 350/420–480 nm [38] which compares well with the excitation–emission maxima of C1 (Figure 1). However, fluorescence spectra maxima of soil samples have been observed at longer wavelengths than those of the aquatic samples [39]. This red shift is attributed to the presence of high-molecular weight fractions, electron-withdrawing substituents, and a higher degree of conjugation in the organic material [39]. The EEM of PARAFAC component C3 (Em/Ex 255/484 nm & 390/484 nm) has characteristics very similar to EEMs recorded for soil-derived humic acids (Em/Ex < 300/500 nm & 420/500 nm) and fulvic acid (Em/Ex 305/423 nm & 360/457 nm) [39,40], so that it can be assigned to condensed, aromatic, and chemically stable humic substances with soil as their likely source. Suwannee River NOM is isolated from a river in the US where terrestrial plant and soil OM are the dominant precursor sources of DOM and, hence, is representative of a terrestrially derived humic substances [29]. However, according to the IHSS, decomposing vegetation is believed to provide most of the DOC to its waters. C1 and C3 of the PARAFAC model represent 55.5% and 26.6%, respectively, of the fluorescent OM in the Suwannee River NOM samples which supports the assignment of these compounds to aquatic/terrestrial plant and soil humic substances, respectively. Furthermore, these two components or a combination of these peaks correspond well to humic-like PARAFAC components reported in earlier studies that applied these methods in aquatic environments such as watersheds and estuaries [32,41].
The PARAFAC component C4 exhibits fluorescence maxima at shorter excitation and emission wavelengths than C1 and C3, indicative of compounds with lower MW and aromaticity compared to humic-like compounds, which have been attributed in past studies to fulvic-like compounds [31,40]. The Ex/Em maxima of C4 indicates a higher contribution of microbially derived organic compounds whose emission maxima have been observed at shorter wavelengths as compared to the terrestrially derived intermediate breakdown organic substances [28,29] and so are likely to be derived from organics in the effluent.
The Ex/Em spectra of C5 indicates that this component could be a protein-like compound. Free tyrosine (tyr) has an Ex/Em maximum at 275/310 nm but tryptophan (trp) is also excited at 275 nm and emits at 340 nm [38]. Previous studies found that intact proteins containing both tyr and trp residues are generally dominated by trp fluorescence due to the higher quantum yield [42]. It was also shown that, in denatured proteins, trp emission is blue-shifted relative to its regular emission signal which would then consequently overlap with the tyr signal [42]. It appears that the PARAFAC analysis was not powerful enough to clearly distinguish between these two protein-like fluorophores and, as a result, C5 would represent a mix of these two protein-like compounds. However, trp has a second absorption maximum at 290–295 nm at which tyr has a much lower extinction coefficient [43] so that, at this excitation wavelength and an emission wavelength of around 350 nm, the observed fluorescence signal would be attributed only to trp, which is represented by component C6 in the PARAFAC model.
The PARAFAC component C2 has its Ex/Em peak at the exact same position (350/425 nm) as the fluorescent whitening compound DSBP (Distyrylbiphenylsulfonate), which is frequently and predominantly used in liquid washing detergents [33]. In this study, a subset of effluent and percolation trench samples was also analyzed for the presence of FWCs. Due to interferences with other organic material in the same emission range, i.e., from the more humified compounds (C1, C3 and C4), the photodecay method was used. Figure S3 shows the photodecay ratio plotted against the proportion of component C2. A very similar relationship and curve had been established by using the FWC and Suwannee River NOM, as shown in Dubber and Gill [35], which supports the indication that PARAFAC component C2 includes signals from FWCs. Furthermore, the householders confirmed the use of liquid washing detergent brands that are known to contain DSBP, so that FWCs are the likely source for the fluorescence signal attributed to component C2 (Table 1).

3.2. DOM Characterisation in Effluent and Trench Samples

In order to characterize the DOM composition and describe the transformation within the DWWTS, including the percolation area, only the results from the sampling in February and March 2017 were used. These were selected as being the most reliable and representative in terms of system functioning.
The results from the individual samples separated by the level of pre-treatment demonstrate that contributions from proteins (47%) were significantly higher (p = 0.046) in primary effluent than in secondary effluent (22%) (Table 2). Aerated secondary treatment caused the contribution of compound C5 (mixed tyr and trp) to decrease significantly (p = 0.009) while the contribution from microbially derived low-MW organics (C4) increased (p = 0.03). However, a significant removal of FWC was only observed in the soil (see C2 in Figure 2). As the primary effluent percolates through the soil beneath the trenches, the overall DOC removal is largely attributed to the removal of proteins (C5) as well as FWCs (C2) for which a significant reduction in fluorescence was observed. As a result, even though the total fluorescence intensity loading from the higher-MW, more decomposed, organics did not increase significantly (see C1 in Figure 2), their contribution increased from 4.1% to 22% (p < 0.001). This is also reflected in an increase in the HI (Table 2, p = 0.003). The FI also indicates higher aromaticity of humic substances in samples from percolation trenches compared to effluent samples (Table 2). A value of around 1.4 indicates terrestrially derived organic compounds of higher aromaticity whereas microbially derived organic compounds are characterized by an FI of around 1.9 and more aliphatic compounds [29]. It should be noted that some studies have used SUVA (254) to characterize changes in aromaticity. While SUVA can be used to estimate the proportion of aromatic C vs aliphatic C in OM, it cannot estimate humified compounds vs. proteins. Given that one aim of this research is to demonstrate the type of information that can be obtained from fluorometric methods, this SUVA analysis was not carried out. However, the combined use of absorbance/SUVA and fluorescent composition would yield valuable additional insights as it would include all absorbing organics (not just those that are fluorescent). Overall, it appears that the DOM composition in all trench samples was very similar regardless of whether they received primary or secondary effluent (Table 2, Figure 2). A statistically significant difference was only observed for the contribution of the protein-like compound C5 (p = 0.015), which was higher in PE trench samples (17%) than in SE trench samples (14%). In terms of the fluorescence intensity loadings, however, there were four significantly different components (C1, C4, C5, and C6, p ≤ 0.032) due to the overall significantly lower DOC in SE trench samples (p < 0.001).
Figure 3 shows EEMs of samples collected from Site 2 in March 2017. The selected EEMs are characteristic and representative for typical fluorescence profiles for PE, SE, as well as PE and SE trench samples. Based on other monitoring parameters, the biomat development was estimated to extend out to a maximum of 10 m along the trench. While most samples were taken within this range, soil moisture samples collected over time from a lysimeter installed at the end of the SE trench (17.5 m along the trench) had clearly indicated that it was located outside the effluent plume and was representative of more natural soil moisture conditions at the site; hence, it can be considered as a control soil sampling point. The sample from this position was characterized by a high HI (11.6) and high contributions of humified compounds (86%), which compares well to the organic composition of Suwannee River NOM (90%) (Table 2). The similarity with the Suwannee River NOM can also be seen in the EEMs in Figure 3. In comparison to the other SE trench samples which lie within the effluent plume, this sample had a significantly higher proportion of high-MW compounds (C1, p = 0.047) while protein-like compounds contributed less (C5, p = 0.02). Consequently, the sample’s organic matter also had a higher degree of humification (HI, p < 0.001).
The PCA found that two factors can be extracted that together explain 83% of the variance in the dataset (Factor 1: 46.5% and Factor 2: 36.5%). The highest factor loadings were obtained for the components C1 (high MW, high aromaticity), C5 (tyr & trp), and C2 (FWC) which are consequently most important to characterize the organic matter in DWWTS samples (Figure 4). The biplot (Figure 5) obtained from the PCA again highlights the similarity in OM composition between the sample from outside the plume and the Suwannee River NOM which are plotted very near to each other. Furthermore, no distinct clustering within the group of trench samples, neither with respect to effluent type nor sampling depth, can be observed. Furthermore, with a correlation coefficient ranging from −0.189 to 0.211, no significant correlation between components and sampling depth was found. These findings strongly indicate, therefore, that the biomat which forms underneath the percolation trenches is the key factor in OM transformation and that, after effluent has passed, the percolation through soil has a rather insignificant additional effect with only minor changes observed with depth.

4. Discussion

To investigate the DOM of influent and effluents from constructed wetland beds, Yao et al. [44] carried out a PARAFAC analysis and identified six fluorescent components very similar to the ones in this study. The study found two protein-like components, three components linked to natural humified decomposition, and one non-humified, synthetic organic component. The protein-like trp component was the dominant component in the influent DOM, which agrees with findings from primary effluents in this study. Trp is probably present as part of larger protein molecules but only three of the amino acids which make up proteins are fluorescent: the aromatic amino acids phenylalanine, tyr, and trp [43]. The latter two were also part of the fluorescence components found in both studies. However, the non-humified component that was found by Yao et al. [44] does not correspond to the FWC component (C2) in this study. Equally, Riopel et al. [45] used PARAFAC analysis to characterize NOM in raw sewage and effluent of a large-scale wastewater treatment plant (WWTP) applying a three component model which picked up higher-MW humified and protein-like components, consistent with those found in this study, but failed to isolate FWCs as an important fluorescence component [44,45,46]. Our study not only identifies FWCs as one of the fluorophores (C2) but further highlights its major contribution in primary and secondary effluent as the second highest (33%) and highest contributor (52%) to the fluorescence signal respectively (Table 2). This is somewhat expected as FWCs are commonly used as optical brighteners in washing detergents and end up in domestic wastewater through the greywater waste stream [35,47,48]. The findings in this study showed no significant removal during secondary treatment which resulted in FWCs becoming the highest contributor in secondary effluent. This is consistent with earlier findings where no biodegradation was observed in either aerobic biological wastewater treatment systems or during anaerobic sludge treatment [47]. Moreover, the primary removal processes for FWCs are known to be adsorption/sedimentation [47,49] which explains the observed removal in water samples from the percolation trenches (see Figure 2). This also explains why FWCs were not found to be particularly useful as fingerprinting technique for DWWTS effluent contamination in private wells (i.e., groundwater) [50].
Riopel et al. [45] found that signals of the FDOM components in the raw sewage had protein-like characteristics, followed by more humified decomposition characteristics. Conversely, after treatment, the FDOM signals were dominated by lower-MW aromatic compounds components derived predominantly from microbial activities, followed by approximately equal signals of more humified, higher-MW and protein-like components. This generally agrees with the observation in this study where the contribution from protein-like components decreased with treatment, while that of organic decomposition products increased. This shift in contributions can be explained with observations made in constructed wetlands which suggest that labile protein-like material is degraded more easily and that removal rates of humic-like compounds with a high degree of aromatic poly-condensation and chemical stability were relatively low compared to the lower-MW substances [44]. Overall, they detected an increase in the degree of humification which is also concordant with the observation in this study. Here, the removal of protein-like compounds and FWC resulted in a relative shift in contributions and increase in the higher-MW fractions that could be measured by the HI which increased consistently with higher degrees of treatment (Table 2). An alternative explanation, however, can be found in other studies that directly link the consumption of protein-like material with the concurrent production of DOM with more decomposed, humified characteristics [45,51,52]. Parlanti et al. [52], for example, studied the change in fluorescence spectra (EEMs) for macro-algae degradation in water and observed a characteristic sequential appearance and disappearance of different peaks at longer wavelength which suggested that the protein-like compounds (possibly from macro-algae cells and/or exudates) may be used to produce the other fluorophores and/or are undergoing a transformation/humification process.
Fox et al. [51] were able to demonstrate that common environmental bacteria can produce FDOM. This production can be mainly attributed to structural biological compounds, specific functional proteins, and/or metabolic by-products. In particular, the trp fluorescence peak, which is mainly of intracellular origin (>75%), can be used as measure of microbial activity and has been suggested as a rapid and reagentless method to determine wastewater contamination in water bodies and the microbial quality of potable water [26,53,54]. However, previous studies suggested that bacteria do not produce significant fluorescence signal at excitation wavelengths higher than 300 nm [42], Fox et al. [51] further observed an increase in MW, i.e., humic-like material that may be derived from either cell lysis or attributed to microbial metabolic by-products or extracellular proteins. This is further supported by Nielsen et al. [11] who found that, under certain environmental conditions, activated sludge bacteria produce extracellular polymeric substances (EPS) which have been characterized as containing significant concentrations of humic substances. Hence, an increase in higher-MW components in the present study could also partially be a result of bacterial production and/or die-off during (or after) the biological wastewater treatment processes within the septic tank and the soil treatment unit.
Riopel et al. [45] as well as Parlanti et al. [52] performed their experiments in a closed system so they could draw conclusions regarding OM transformation processes. Here, however, there is a net removal of FDOM and, hence, an increase in the relative contribution of one component does not necessarily result from an increase in that compound’s concentration. In fact, results from the fluorescence intensity loadings have demonstrated that removal (reduction in concentration) of specific components led to increased contributions of others without increasing their actual concentration (e.g., for FWCs). It appears that the removal of protein-like compounds did not necessarily coincide with an increase in the concentrations of higher-MW decomposed organic compounds in the percolation trench samples of the DWWTS. These compounds, however, could have been produced by the microbial activities within the biomat below the percolation trenches but might have been contained in that area due to adsorption to soil particles and therefore not picked up in the soil moisture samples.
The results from this study also suggest that, as well as the largest FDOM removal being attributable to the biomat, it has the most significant impact on the transformation processes of FDOM and hence on the FDOM composition of percolating effluent. Other studies have also indicated that most of the contaminant attenuation occurs within these first few cm depths beneath where the effluent infiltrates into the soil [6,7,8,9,10,16,17]. Field research on soil samples taken at and below the infiltrative surface have shown high concentrations of OM which declined rapidly within 1 to 2 cm of soil depth [8] while water samples of percolating effluent in the present study were extracted from depth ranging from 10 to 55 cm. Less degradable materials, such as the humified products of the organic decomposition process especially, can accumulate in soil pores which was found when investigating key agents responsible for long-term soil clogging in DWWTS percolation areas [13]. On the contrary, research from soil in agricultural catchments has also suggested that these higher-MW products could leach from soil, thereby representing another source for the FDOM in percolating effluents [41], especially after periods of higher precipitation.
Previous research suggests that fluorescence spectroscopy can be useful in the qualitative differentiation of DOM compounds from varying origins and even subcomponents with varying composition and functional properties [29,40,55,56]. High fluorescence intensities relative to the total OM content can generally be associated with low molar mass components, low condensation and low aromatic degree [56]. The chemical characteristics of microbially derived breakdown products in surface water vary depending on the type of precursor OM and the type of geochemical processes acting. Organics derived from plant litter and soils generally contain a higher content of aromatic carbon (25–30% of total C) than microbially derived organics (12–17% of total C) [29,55]. McKnight et al. [29] found a reasonable correspondence between aromaticity (determined using 13C-NMR) and the FI which suggests that the ratio may serve as a surrogate for general structural features of the carbon skeleton which are related to the source of OM. An FI of 1.3–1.4 indicates predominantly terrestrially derived organic decomposition products while an FI around 1.7–2.0 indicates a microbial origin [29]. Comparing the PARAFAC results in this study with the FI obtained for the different sample types (Table 2) supports the idea that FI could be used as a good measure of aromaticity and as an estimation for contributions from different origins for the humified breakdown substances. Both types of effluent samples had an FI of around 2 and were dominated by microbially sourced organic materials (protein-like and non-humified precursor compounds) which typically have a lower content of aromatic carbon. For the trench samples, the FI decreased to around 1.6 due to the increase in contributions from terrestrially derived organic decomposition compounds as well as humic substances from soil which would be expected to be of higher aromaticity. In comparison, the sample collected outside of the effluent plume had an FI of 1.58, and an FI of 1.15 was obtained for the reference Suwannee River NOM which had an even higher contribution of higher MW and aromaticity from chemically stable organics of a terrestrial origin (i.e., the soil), but with fewer carboxyls or hydroxyls than aquatic organic decomposition compounds, thus making it less polar [40].
This type of information about the composition and structural/functional properties of OM within the DWWTS percolation area, as obtained from the applied fluorometric methods, could be of great interest for studies regarding bacterial/viral transport and the effect that OM can have on bacterial attachment to soil particles. For example, the polarity and hydrophobicity of OM is thought to have a significant impact on such microbial transport. The sorption of highly aromatic and less polar DOM for instance would increase grain surface hydrophobicity and, thus, increase the sorption in hydrophobic entities [57], thus affecting bacteria and virus attachment depending on their surface properties, which varies amongst different strains. In another study, it was found that negatively charged and hydrophilic OM blocked virus sorption sites in the soil and hence facilitated excessive transport [23]. Other research [21] found that OM affected bacterial transport mainly through modification of the substratum’s surface charge. The sorption of DOM can alter the surface charge of bacteria and/or sediment which consequently changes electrostatic interactions (repulsion or adhesion) within the soil matrix, thus affecting bacterial/virus attachment to soil particles and transport.
Overall, this study demonstrates the high potential and suitability of fluorometric methods to be used for the characterization of fluorescent DOM in the context of DWWTS studies. These methods have yielded insights into how the nature of dissolved organic material in wastewater effluent changes as it percolates down through the biomat and underlying soil towards the water table, mediated by organic decomposition processes. This information can then be used to assess how such dissolved organic decomposition products might facilitate or constrain other contaminant transport processes. The traditional isolation procedures for DOM characterization require large sample volumes and are labor-intensive which is especially impractical in studies with many samples. The low processing time, sensitivity, and non-destructive nature of fluorescence techniques have been highlighted in other studies as distinctive advantages [29,37,40]. In addition, only a small amount of sample is required for these analyses which supports their practical applicability for studies of contaminant transport through the unsaturated zone where only a limited sample volume can be extracted from the soil.

5. Conclusions

In this study, the use and applicability of fluorescence spectroscopy and PARAFAC analysis has been shown with respect to the characterization of fluorescent DOM in septic tank effluent and its subsequent transformations as it passes through the biomat/biozone, infiltrating into the unsaturated zone beneath DWWTSs. The PARAFAC analysis has determined that a six-component model is appropriate whereby individual model components have been assigned to organic decomposition products, fluorescent whitening compounds (FWCs), and protein-like compounds. The applied fluorometric methods have shown that FDOM in domestic wastewater was characterized by protein-like compounds and FWCs and that, with treatment in the percolation area, protein-like compounds and FWCs are removed and contributions from terrestrially derived soil organic compounds increase, leading to a higher degree of humification and aromaticity. The results also suggest that the biomat is the most important element determining FDOM removal and consequently affecting FDOM composition.

Supplementary Materials

The following are available online at https://www.mdpi.com/article/10.3390/w13192627/s1, additional results supporting the source assignment and interpretation of the obtained PARAFAC components (Figure S1: General schematic of soil treatment system, for Sites 1 and 2, Figure S2: Schematic diagram of analytical procedure, Figure S3: Correlation between Humification Index and contributions from each of the six PARAFAC components, Figure S4: Correlation between the proportion of PARAFAC component 2 and results from FWC photodecay analysis.

Author Contributions

Conceptualization, L.W.G. and D.D.; methodology, D.D.; experimental design, L.W.G., D.D. and J.K.; field sampling, J.K.; laboratory analysis, D.D.; data processing, D.D.; writing—original draft preparation, D.D. and L.W.G.; writing—review and editing, L.W.G., D.D. and J.K.; and project administration, L.W.G. All authors have read and agreed to the published version of the manuscript.

Funding

This research was funded by the Science Foundation Ireland [Project codes 15/ERC/B3128 and 13/IA/1923].

Institutional Review Board Statement

Not applicable.

Informed Consent Statement

Not applicable.

Data Availability Statement

The data used to support the findings of this study are available from the corresponding author upon request.

Acknowledgments

The authors would also like to thank the house owners for their cooperation as well as Manuel Ruether, Department of Chemistry, Trinity College Dublin, for making equipment available to us.

Conflicts of Interest

The authors declare no conflict of interest.

References

  1. Cooper, J.A.; Loomis, G.W.; Kalen, D.V.; Amador, J.A. Evaluation of water quality functions of conventional and advanced soil-based onsite wastewater treatment systems. J. Environ. Qual. 2015, 44, 953–962. [Google Scholar] [CrossRef]
  2. Dubber, D.; Gill, L. Application of on-site wastewater treatment in Ireland and perspectives on its sustainability. Sustainability 2014, 6, 1623–1642. [Google Scholar] [CrossRef] [Green Version]
  3. Siegrist, R.L. Decentralized Water Reclamation Engineering. A Curriculum Workbook; Springer International Publishing: Cham, Switzerland, 2017. [Google Scholar]
  4. Beal, C.D.; Rassam, D.W.; Gardner, E.A.; Kirchhof, G.; Menzies, N.W. Influence of hydraulic loading and effluent flux on surface surcharging in soil absorption systems. J. Hydrol. Eng. 2008, 13, 681–692. [Google Scholar] [CrossRef] [Green Version]
  5. Bouma, J. Unsaturated flow during soil treatment of septic tank effluent. J. Environ. Eng. Div. 1975, 101, 967–983. [Google Scholar] [CrossRef]
  6. Beal, C.D.; Gardner, E.A.; Menzies, N.W. Process, performance, and pollution potential: A review of septic tank-soil absorption systems. Aust. J. Soil Res. 2005, 43, 781–802. [Google Scholar] [CrossRef] [Green Version]
  7. Gill, L.W.; O’Luanaigh, N.; Johnston, P.M.; Misstear, B.D.R.; O’Suilleabhain, C. Nutrient loading on subsoils from on-site wastewater effluent, comparing septic tank and secondary treatment systems. Water Res. 2009, 43, 2739–2749. [Google Scholar] [CrossRef]
  8. McKinley, J.W.; Siegrist, R.L. Accumulation of organic matter components in soil under conditions imposed by wastewater infiltration. Soil Sci. Soc. Am. J. 2010, 74, 1690–1700. [Google Scholar] [CrossRef]
  9. Siegrist, R.L.; Boyle, W.C. Waste-water-induced soil clogging development. J. Environ. Eng. 1987, 113, 550–566. [Google Scholar] [CrossRef]
  10. Knappe, J.; Somlai, C.; Fowler, A.C.; Gill, L.W. The influence of pre-treatment on biomat development in soil treatment units. J. Contam. Hydrol. 2020, 232, 103654. [Google Scholar] [CrossRef]
  11. Nielsen, P.H.; Frolund, B.; Keiding, K. Changes in the composition of extracellular polymeric substances in activated sludge during anaerobic storage. Appl. Microbiol. Biotechnol. 1996, 44, 823–830. [Google Scholar] [CrossRef]
  12. Wu, J.Q.; Gui, S.X.; Stahl, P.; Zhang, R.D. Experimental study on the reduction of soil hydraulic conductivity by enhanced biomass growth. Soil Sci. 1997, 162, 741–748. [Google Scholar] [CrossRef]
  13. Siegrist, R.L. Soil clogging during subsurface waste-water infiltration as affected by effluent composition and loading rate. J. Environ. Qual. 1987, 16, 181–187. [Google Scholar] [CrossRef]
  14. Lehmann, J.; Kleber, M. The contentious nature of soil organic matter. Nature 2015, 528, 60–68. [Google Scholar] [CrossRef]
  15. Baveye, P.C.; Wander, M. The (bio)chemistry of soil humus and humic substances: Why is the “New View” still considered novel after more than 80 years? Front. Environ. Sci. 2019, 7, 27. [Google Scholar] [CrossRef] [Green Version]
  16. Gill, L.W.; O’Sulleabhain, C.; Misstear, B.D.R.; Johnston, P.J. The treatment performance of different subsoils in Ireland receiving on-site wastewater effluent. J. Environ. Qual. 2007, 36, 1843–1855. [Google Scholar] [CrossRef]
  17. O’Luanaigh, N.D.; Gill, L.W.; Misstear, B.D.R.; Johnston, P.M. The attenuation of microorganisms in on-site wastewater effluent discharged into highly permeable subsoils. J. Contam. Hydrol. 2012, 142–143, 126–139. [Google Scholar] [CrossRef]
  18. Bradford, S.A.; Schijven, J.; Harter, T. Microbial transport and fate in the subsurface environment: Introduction to the special section. J. Environ. Qual. 2015, 44, 1333–1337. [Google Scholar] [CrossRef] [Green Version]
  19. Flynn, R.M.; Yang, X.Y.; Hofmann, T.; von der Kammer, F. Bovine Serum Albumin Adsorption to Iron-Oxide Coated Sands Can Change Microsphere Deposition Mechanisms. Environ. Sci. Technol. 2012, 46, 2583–2591. [Google Scholar] [CrossRef]
  20. Harvey, R.W.; Metge, D.W.; Barber, L.B.; Aiken, G.R. Effects of altered groundwater chemistry upon the pH-dependency and magnitude of bacterial attachment during transport within an organically contaminated sandy aquifer. Water Res. 2010, 44, 1062–1071. [Google Scholar] [CrossRef]
  21. Johnson, W.P.; Logan, B.E. Enhanced transport of bacteria in porous media by sediment-phase and aqueous-phase natural organic matter. Water Res. 1996, 30, 923–931. [Google Scholar] [CrossRef]
  22. Schijven, J.F.; Hassanizadeh, S.M. Removal of viruses by soil passage: Overview of modeling, processes, and parameters. Crit. Revs. Environ. Sci. Technol. 2000, 30, 49–127. [Google Scholar] [CrossRef]
  23. Zhuang, J.; Jin, Y. Virus retention and transport as influenced by different forms of soil organic matter. J. Environ. Qual. 2003, 32, 816–823. [Google Scholar] [CrossRef]
  24. Harvey, R.W.; George, L.H.; Smith, R.L.; Leblanc, D.R. Transport of microspheres and indigenous bacteria through a sandy aquifer—Results of natural-gradient and forced-gradient tracer experiments. Environ. Sci. Technol. 1989, 23, 51–56. [Google Scholar] [CrossRef]
  25. Scholl, M.A.; Harvey, R.W. Laboratory investigations on the role of sediment surface and groundwater chemistry in transport of bacteria through a contaminated sandy aquifer. Environ. Sci. Technol. 1992, 26, 1410–1417. [Google Scholar] [CrossRef]
  26. Baker, A.; Ward, D.; Lieten, S.H.; Periera, R.; Simpson, E.C.; Slater, M. Measurement of protein-like fluorescence in river and waste water using a handheld spectrophotometer. Water Res. 2004, 38, 2934–2938. [Google Scholar] [CrossRef]
  27. Carstea, E.M.; Bridgeman, J.; Baker, A.; Reynolds, D.M. Fluorescence spectroscopy for wastewater monitoring: A review. Water Res. 2016, 95, 205–219. [Google Scholar] [CrossRef] [PubMed]
  28. Holbrook, R.D.; Yen, J.H.; Grizzard, T.J. Characterizing natural organic material from the Occoquan Watershed (Northern Virginia, US) using fluorescence spectroscopy and PARAFAC. Sci. Total Environ. 2006, 361, 249–266. [Google Scholar] [CrossRef]
  29. McKnight, D.M.; Boyer, E.W.; Westerhoff, P.K.; Doran, P.T.; Kulbe, T.; Andersen, D.T. Spectrofluorometric characterization of dissolved organic matter for indication of precursor organic material and aromaticity. Limnol. Oceanogr. 2001, 46, 38–48. [Google Scholar] [CrossRef]
  30. Murphy, K.R.; Butler, K.D.; Spencer, R.G.M.; Stedmon, C.A.; Boehme, J.R.; Aiken, G.R. Measurement of Dissolved Organic Matter Fluorescence in Aquatic Environments: An Interlaboratory Comparison. Environ. Sci. Technol. 2010, 44, 9405–9412. [Google Scholar] [CrossRef]
  31. Sierra, M.M.D.; Giovanela, M.; Parlanti, E.; Soriano-Sierra, E.J. Fluorescence fingerprint of fulvic and humic acids from varied origins as viewed by single-scan and excitation/emission matrix techniques. Chemosphere 2005, 58, 715–733. [Google Scholar] [CrossRef]
  32. Stedmon, C.A.; Markager, S. Resolving the variability in dissolved organic matter fluorescence in a temperate estuary and its catchment using PARAFAC analysis. Limnol. Oceanog. 2005, 50, 686–697. [Google Scholar] [CrossRef]
  33. EPA. Code of Practice: Wastewater Treatment and Disposal Systems Serving Single Houses; Environmental Protection Agency: Wexford, Ireland, 2009.
  34. BSI. BS 5930: 2015—The Code of Practice for Site Investigations; British Standards Institute: Milton Keynes, UK, 2015. [Google Scholar]
  35. Dubber, D.; Gill, L.W. Suitability of fluorescent whitening compounds (FWCs) as indicators of human faecal contamination from septic tanks in rural catchments. Water Res. 2017, 127, 104–117. [Google Scholar] [CrossRef]
  36. Murphy, K.R.; Stedmon, C.A.; Graeber, D.; Bro, R. Fluorescence spectroscopy and multi-way techniques: PARAFAC. Anal. Methods 2013, 5, 6557–6566. [Google Scholar] [CrossRef] [Green Version]
  37. Zsolnay, A.; Baigar, E.; Jimenez, M.; Steinweg, B.; Saccomandi, F. Differentiating with fluorescence spectroscopy the sources of dissolved organic matter in soils subjected to drying. Chemosphere 1999, 38, 45–50. [Google Scholar] [CrossRef]
  38. Coble, P.G. Characterization of marine and terrestrial DOM in seawater using excitation emission matrix spectroscopy. Mar. Chem. 1996, 51, 325–346. [Google Scholar] [CrossRef]
  39. Mobed, J.J.; Hemmingsen, S.L.; Autry, J.L.; McGown, L.B. Fluorescence characterization of IHSS humic substances: Total luminescence spectra with absorbance correction. Environ. Sci. Technol. 1996, 30, 3061–3065. [Google Scholar] [CrossRef]
  40. Chen, J.; LeBoef, E.J.; Dai, S.; Gu, B.H. Fluorescence spectroscopic studies of natural organic matter fractions. Chemosphere 2003, 50, 639–647. [Google Scholar] [CrossRef]
  41. Stedmon, C.A.; Markager, S.; Bro, R. Tracing dissolved organic matter in aquatic environments using a new approach to fluorescence spectroscopy. Mar. Chem. 2003, 82, 239–254. [Google Scholar] [CrossRef]
  42. Determann, S.; Lobbes, J.M.; Reuter, R.; Rullkotter, J. Ultraviolet fluorescence excitation and emission spectroscopy of marine algae and bacteria. Mar. Chem. 1998, 62, 137–156. [Google Scholar] [CrossRef]
  43. Lakowicz, J.R. (Ed.) Protein Fluorescence. In Principles of Fluorescence Spectroscopy; Springer: Boston, MA, USA, 2006. [Google Scholar]
  44. Yao, Y.; Li, Y.Z.; Guo, X.J.; Huang, T.; Gao, P.P.; Zhang, Y.P.; Yuan, F. Changes and characteristics of dissolved organic matter in a constructed wetland system using fluorescence spectroscopy. Environ. Sci. Pollut. Res. 2016, 23, 12237–12245. [Google Scholar] [CrossRef] [PubMed]
  45. Riopel, R.; Siemann, S.; Caron, F. Microbial changes in the fluorescence character of natural organic matter from a wastewater source. J. Water Resour. Prot. 2016, 8, 873–883. [Google Scholar] [CrossRef] [Green Version]
  46. Riopel, R.; Caron, F.; Siemann, S. Fluorescence characterization of natural organic matter at a northern Ontario wastewater treatment plant. Water Air Soil Pollut. 2014, 225, 1–17. [Google Scholar] [CrossRef]
  47. Poiger, T.; Field, J.A.; Field, T.M.; Siegrist, H.; Giger, W. Behavior of fluorescent whitening agents during sewage treatment. Water Res. 1998, 32, 1939–1947. [Google Scholar] [CrossRef]
  48. Hartel, P.G.; Hagedorn, C.; McDonald, J.L.; Fisher, J.A.; Saluta, M.A.; Dickerson, J.W.; Gentit, L.C.; Smith, S.L.; Mantriprayada, N.S.; Ritter, K.J.; et al. Exposing water samples to ultraviolet light improves fluorometry for detecting human fecal contamination. Water Res. 2007, 41, 3629–3642. [Google Scholar] [CrossRef]
  49. Stoll, J.M.A.; Ulrich, M.M.; Giger, W. Dynamic behavior of fluorescent whitening agents in Greifensee: Field measurements combined with mathematical modeling of sedimentation and photolysis. Environ. Sci. Technol. 1998, 32, 1875–1881. [Google Scholar] [CrossRef]
  50. Fennell, C.; Gill, L.; O’Connell, D.; Dubber, D.; Behan, P.; Danaher, M.; Misstear, B. The impact of domestic wastewater treatment systems on private water wells: An assessment of contamination fingerprinting techniques. Environ. Pollut. 2021, 268, 115687. [Google Scholar] [CrossRef]
  51. Fox, B.G.; Thorn, R.M.S.; Anesio, A.M.; Reynolds, D.M. The in situ bacterial production of fluorescent organic matter; an investigation at a species level. Water Res. 2017, 125, 350–359. [Google Scholar] [CrossRef]
  52. Parlanti, E.; Wörz, K.; Geoffroy, L.; Lamotte, M. Dissolved organic matter fluorescence spectroscopy as a tool to estimate biological activity in a coastal zone submitted to anthropogenic inputs. Org. Geochem. 2000, 31, 1765–1781. [Google Scholar] [CrossRef]
  53. Cumberland, S.; Bridgeman, J.; Baker, A.; Sterling, M.; Ward, D. Fluorescence spectroscopy as a tool for determining microbial quality in potable water applications. Environ. Technol. 2012, 33, 687–693. [Google Scholar] [CrossRef]
  54. Sorensen, J.P.R.; Lapworth, D.J.; Marchant, B.P.; Nkhuwa, D.C.W.; Pedley, S.; Stuart, M.E.; Bell, R.A.; Chirwa, M.; Kabika, J.; Liemisa, M.; et al. In-situ tryptophan-like fluorescence: A real-time indicator of faecal contamination in drinking water supplies. Water Res. 2015, 81, 38–46. [Google Scholar] [CrossRef] [Green Version]
  55. Malcolm, R.L. The uniqueness of humic substances in each of soil, stream and marine environments. Anal. Chim. Acta 1990, 232, 19–30. [Google Scholar] [CrossRef]
  56. Senesi, N.; Miano, T.M.; Provenzano, M.R.; Brunetti, G. Characterization, differentiation, and classification of humic substances by fluorescence spectroscopy. Soil Sci. 1991, 152, 259–271. [Google Scholar] [CrossRef]
  57. Murphy, E.M.; Zachara, J.M.; Smith, S.C. Influence of mineral-bound humic substances on the sorption of hydrophobic organic compounds. Environ. Sci. Technol. 1990, 24, 1507–1516. [Google Scholar] [CrossRef] [Green Version]
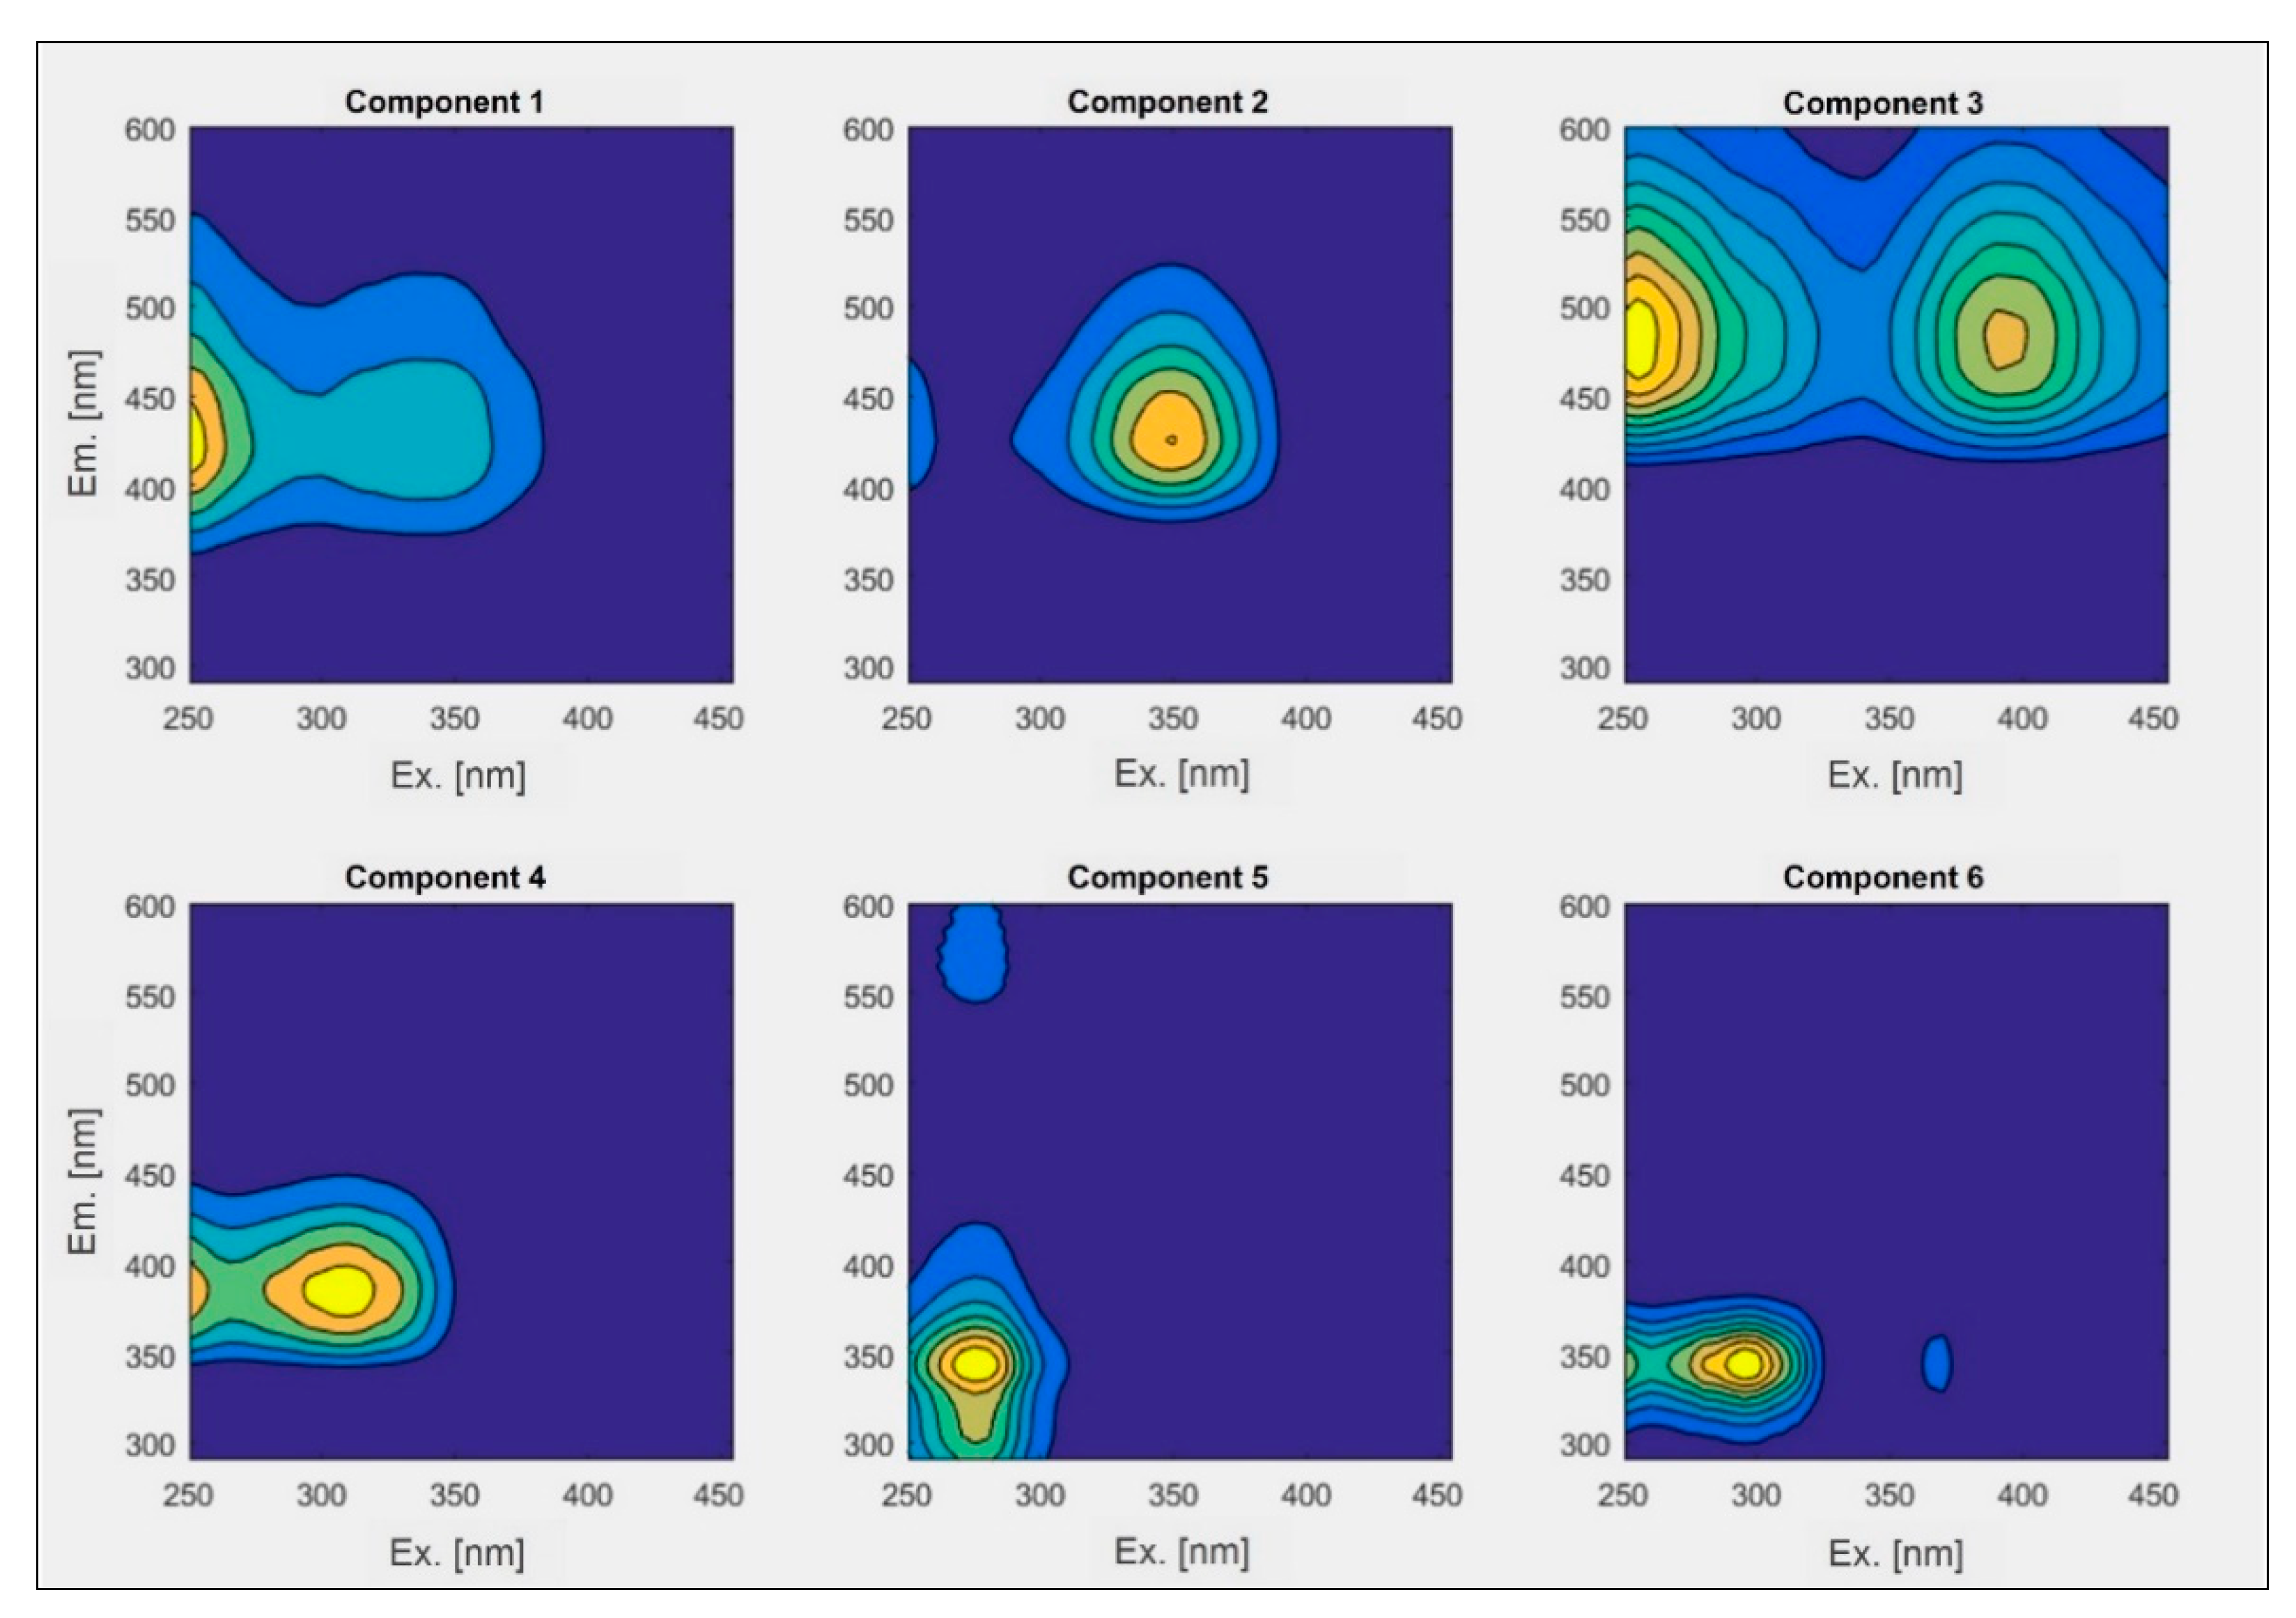
Figure 1. EEMs for the 6 components identified by PARAFAC analysis.
Water 13 02627 g001
Figure 2. Total fluorescence intensity loadings for effluent and percolation trench samples from February and March 2017. C1 is attributed to HA, C2 to FWCs, C3 to soil HA, C4 to FA, C5 to protein-like (tyr & trp) compounds and C6 to tryptophan.
Water 13 02627 g002
Figure 3. EEMs for primary, secondary effluent, trench samples and Suwannee river NOM. The selected examples are from Site 2 in March 2017. The “PE trench” sample was collected from 10 m, the “SE trench” sample from 1 m and the “End of SE trench” control sample from 17.5 m along the trench.
Water 13 02627 g003
Figure 4. Factor loading for the variable components C1 to C6 from the PCA performed for all effluent and trench samples.
Water 13 02627 g004
Figure 5. Biplot for primary effluent (PE) and secondary effluent (SE) trench samples from February and March 2017 using the relative proportion of the PARAFAC components as variables for the statistical analysis. S, M, and D indicates the sampling depth within the trench (S: <15 cm, M: 15–34 cm, D: 35–55 cm). For comparison effluent samples and Suwannee River NOM (SR-NOM) are included.
Water 13 02627 g005
Table 1. Summary of fluorescence excitation–emission maxima (λexem) and source assignment of fluorophores for each component obtained from the PARAFAC analysis.
Fluorescent ComponentλexλemDescription and Source Assignment of Fluorophores
C1(250 nm)
335–350 nm
422 nmHigh MW a, high aromaticity, chemically stable; from both, microbial and terrestrially derived DOM
C2350 nm425 nmFluorescent whitening compounds; here specifically DSBP
C3(255 nm)
390 nm
484 nmVery high MW a, condensed, aromatic and chemically very stable; derived from soil
C4(240 nm)
310 nm
385 nmLower MW a and aromaticity; predominantly from microbial activities
C5275 nm343 nmProtein-like; presence of amino acids tyrosine and tryptophan; intact and denatured proteins
C6295 nm343 nmProtein-like; attributed to tryptophan; intact proteins from bacterial activity
a Molecular weight.
Table 2. Average contribution [%] of the PARAFAC model compounds C1–C6, fluorometric indices and dissolved organic carbon (DOC) for effluent (PE = primary effluent, SE = secondary effluent) and percolation trench samples taken from both study sites in February and March 2017.
C1C2C3C4C5C6HI aFI bDOC [mg/L]
PE4.1 ± 3.132.9 ± 19.07.2 ± 0.58.9 ± 2.843.3 ± 15.23.5 ± 3.50.91 ± 0.42.06 ± 0.462.97 ± 35.7
PE trench22.0 ± 8.113.4 ± 4.414.3 ± 2.620.4 ± 2.217.0 ± 3.512.8 ± 3.83.05 ± 1.21.58 ± 0.0610.47 ± 3.6
SE2.2 ± 1.952.4 ± 1.99.1 ± 1.913.8 ± 2.114.0 ± 1.68.4 ± 2.72.45 ± 0.62.22 ± 0.0317.45 ± 2.5
SE trench25.7 ± 9.913.5 ± 10.113.9 ± 4.319.8 ± 1.813.9 ± 3.413.2 ± 7.53.77 ± 1.21.63 ± 0.15.87 ± 3.1
Outside plume c48.27.517.920.14.41.811.561.583.57
SR-NOM d55.56.226.67.75.7−1.722.321.156.99
a Humification Index, b Fluorescence Index, c Sample taken from outside the plume, d IHSS Suwannee River reference material at concentration of 14 mg/L.
Publisher’s Note: MDPI stays neutral with regard to jurisdictional claims in published maps and institutional affiliations.

