Article

Impacts of Massive Sediment Input on the Channel Geometry Adjustment of Alluvial Rivers: Revisiting the North Fork Toutle River Case

State Key Laboratory of Hydraulics & Mountain River Engineering, Sichuan University, Chengdu 610065, China
*
Author to whom correspondence should be addressed.
Water 2021, 13(20), 2802; https://doi.org/10.3390/w13202802
Submission received: 13 September 2021 / Revised: 2 October 2021 / Accepted: 8 October 2021 / Published: 9 October 2021
(This article belongs to the Section Water Erosion and Sediment Transport)

Abstract

:
In this study, the impacts of massive sediment input on channel geometry adjustment were analyzed across decades based on the downstream hydraulic geometry. Massive amounts of field data and evolution models showed that the alternation of degradation and aggradation in short-to-medium-term channel adjustment is common in evolving rivers. This phenomenon has always been challenging in research; most existing studies have focused on unidirectional adjustment in short-term channel adjustment. A few studies have considered the alternation of degradation and aggradation in short-to-medium-term channel adjustment, presuming that this phenomenon is caused by water and sediment changes. However, we found that the alternations also occurred under stable water and sediment transport in the North Fork Toutle River, southwestern Washington, USA. This adjustment across decades was analyzed by downstream hydraulic geometry in this study. It was concluded that the river consumes surplus energy to reach the optimal cross section through this short-to-medium-term adjustment under stable water and sediment transport. The objective of channel adjustment is minimal energy loss.

1. Introduction

Increases in sediment input may be triggered by landslide, debris flow, and volcanic eruption [1,2]. Massive sediment input has a significant impact on rivers, with channels often severely blocked up in the short term. However, channels undergo more complex evolutionary processes in the short-to-medium-term. Researchers have summarized the short-to-medium-term development of channel morphology for different disturbances and proposed a six-stage model: pre-modified, constructed, degradation, degradation and widening, aggradation and widening, and quasi-equilibrium [3,4]. Thereafter, the six-stage model was developed by adding a pilot stage and transforming the previous model from a linear relationship to a cyclic model [5]. Based on the common river evolution stage, the river system under different conditions omits certain stages or cycles and returns to previous stages, finally reaching equilibrium again. The developed model showed the degradation and aggradation cycle in short-to-medium-term channel adjustment. Field data and related research proved their models in different types of river systems [6,7]. The rivers affected by massive sediment input also presented the same processes, as shown in Figure 1 [8]. The alternation of degradation and aggradation in short- to-medium-term adjustments was widespread during fluvial processes, even lasting for decades.
Many analyses and simulations can explain aggradation processes through sudden changes in sediment input [9,10,11,12]. However, the understanding of the alternation of degradation and aggradation in the short-to-medium-term is not sufficient. Only a few studies have recognized the limitations of existing research, presenting a general framework and explaining the alternation of the aggradation and degradation phenomena through the fluctuation of discharge and sediment load [13,14].
It is reasonable that fluctuations in discharge and sediment load will cause changes in degradation and aggradation. In this study, the North Fork Toutle River’s (NFTR) disturbance by the sudden and heavy input of sediments due to volcanic eruption has been analyzed. However, previous studies showed that the sediment input remained stable after five years of volcanic eruption [10,15], but the alternation of degradation and aggradation was still distinct and regular, even lasting for tens of years [8]. Therefore, the mechanism of the degradation and aggradation cycle is not clear in the NFTR. The NFTR has been surveyed for more than 30 years since the eruption on 18 May 1980, so there is a large amount of reliable data. Therefore, it presents an excellent opportunity for the study of channel adjustment. In this study, field data from the NFTR were analyzed, and downstream hydraulic geometry was employed to analyze the adjustment processes and explore the mechanism of short-to-medium-term channel adjustment under massive sediment input.

2. Study Area

The eruption of Mount St. Helens on 18 May 1980 was one of the largest volcanic eruptions that occurred in the 20th century. The North Fork Toutle River (NFTR), which originates from the volcano, was extremely affected. Areas 27.4 km upstream of the NFTR were buried under an avalanche of debris with a volume of 2.5 km3. The thickness of the debris that buried the area exceeded 140 m, with an average of approximately 40 m [10]. Considering the presence of loose and erodible avalanche debris, severe damage to vegetation, and the impact of volcanic ash and other factors, the sediment volume increase in the NFTR basin is considerable. At the beginning of the volcanic eruption, the sediment erosion rate reached 130,000 t/(km2/year), representing one of the highest rates of sediment erosion to have ever occurred worldwide [16,17]. This remarkable increase in sediment supply has become a major problem for the NFTR since the volcanic eruption.
Several hydrological stations are present in the NFTR, and the studied cross sections are characterized by a river length of approximately 33 km; study cross sections NF105–NF375 are arranged from upstream to downstream. Cross sections NF105–130 are located at the most upstream area of the NFTR, belonging to the river’s source region. Valleys NF300–NF320 are narrow and widen at cross section NF345. Therefore, cross sections NF300–NF320 and NF345–NF375 belong to a narrow valley region and wide valley region, respectively (Figure 2). In the downstream area near cross section NF130, two tributaries (Castle Creek and Coldwater Creek) merge into the NFTR (Figure 2); no branch inflow is present between NF130 and the sediment retention structure (SRS). The end of the volcanic collapse accumulation area is located downstream of cross section NF375. All cross sections have been affected by the volcanic collapse [18]. To control sediments in the upper reaches of the NFTR and ensure the safety of the downstream channel and flood control, temporary Debris Retaining Structures (DRS) were constructed on the North Fork Toutle River. A larger DRS-N1, with a capacity of 4.6 million m3, was built in 1980 at the toe of the debris avalanche deposit on the NFTR (Figure 2b). The DRSs were, however, only ever intended to provide a temporary solution and quickly filled to capacity. In September 1981, DRS N-1 was also largely buried and was no longer functional [15]. Then, the U.S. Army Corps of Engineers built an SRS in 1987. As shown in Figure 2, the studied cross sections are far from the backwater region of the SRS; thus, they have been unaffected by this structure [19].
In this study, the channel adjustment of the NFTR was analyzed, and the aspect ratio and channel slope in a stable state were calculated by downstream hydraulic geometry. The measured data of topography in the channel adjustment analysis were from [8,14] and/or provided by Zheng S. in personal communication. The data covered 11 cross sections (NF105–NF375 in Figure 2) from 1980 to 2016. The measured data of discharge, sediment flux, and bed material are needed in downstream hydraulic geometry. The discharge was derived from the flow series developed in [20]. The annual sediment transport and bed material were derived from [10]; the measured data covered the sediment flux from 1980 to 1992 and the bed material of six cross sections in 1980 and 1991.

3. Methodology

In some cases, the rivers are subjected to violent and transient disturbances, but the time of channel adjustment may extend to decades or centuries. In this study, through the calculation of the geometry of the stable channel, the channel evolutionary processes in short-to-medium-term adjustment were analyzed.
The downstream hydraulic geometry provides a means for calculating the geometry and hydraulic variables of a stable channel. In the previous study, the downstream hydraulic geometry solution was usually obtained by the three basic flow relationships: flow continuity, flow resistance, and sediment flux. The flow continuity is expressed as follows:
Q = W D V
where W, D, V, and Q are the flow width (m), flow depth (m), flow velocity (m/s), and discharge (m(/s), respectively.
The flow resistance relationship is used to quantify the resistance of the channel boundary on the flow. The Manning-Strickler flow equation, as the most common equation, has the form:
V = 7.68 ( R d ) 1 / 6 g R S
where g, R, d, and S are the gravity constant, hydraulic radius, the representative sediment size (mm), and channel slope, respectively.
The sediment flux relationship is commonly written as follows:
Q s / W = c b ( τ 0 τ c ) α
where Q s , τ 0 , τ c , and c b are the sediment flux (m3/s), shear stress, critical shear stress, and a coefficient related to sediment size, respectively. Among them, τ 0 = γ R S ; γ is the bulk density of water. The following values of α , τ c , and c d are suggested: α = 1.5 , τ c = 0.047 , c d = 4.93 [21].
Combining Equations (1)–(3), the following relationship is obtained:
Q s = K 1 ξ 3 / 8 ( ξ + 2 ) 1 / 4 [ K 2 ξ 3 / 8 ( ξ + 2 ) 3 / 4 K 3 ] 1.5
where the coefficients K 1 , K 2 , and K 3 are defined as follows:
K 1 = 4.93 ( ρ S / ρ 1 ) g d 25 / 16 ( Q 7.68 g S ) 3 / 8 K 2 = S 13 / 16 ( ρ S / ρ 1 ) d 15 / 16 ( Q 7.68 g ) 3 / 8
K 3 = 0.047
where ξ is the aspect ratio (W/D), ρ s is the sediment density, and ρ is the density of water. The detailed derivations can be found in [22].
The channel geometry under equilibrium water and sediment transport can be calculated by Equation (4) with known values of Q,   Q s , and d. As shown in Equation (4), the channel geometry under equilibrium water and sediment transport is not a fixed value; it is a relationship between the aspect ratio and channel slope, as shown in Figure 3.
The curve in Figure 3 shows all of the channel geometries that satisfy the equilibrium water and sediment transport with given values of Q and Qs. However, it is still unable to give the fixed solution of the channel in stable state. Therefore, researchers have proposed multiple extremal hypotheses. All of these hypotheses indicate that the channel attains stability at the extreme point of the relationship curve (Figure 3). The extremal hypotheses have been explained through the energy theory [23,24]. This states that the equilibrium condition should satisfy the conditions for equilibrium water and sediment transport. Hence, a channel in equilibrium must provide the kinetic energy that is necessary for water and sediment transport. Except for the point where energy (energy slope) reaches the lowest level (Figure 3), the other points on the curve have potential energy. In any system, the existence of potential energy renders the system unstable; therefore, the channel reaches the equilibrium state only at the extremal point with zero potential energy.
In summary, Equation (4) can be used to calculate all of the channel geometries that meet the equilibrium of water and sediment transport with given values of Q,   Q s , and d (the calculated curve in Figure 3). The channel geometry in a stable state is at the extreme point of the calculated curve in Figure 3. In this study, hydraulic geometry has been used to calculate the channel geometries under water and sediment transport and the stable state. The calculation results have been compared with the measured data to analyze the adjustment over decades.

4. Results and Discussion

4.1. Runoff and Sediment Flux

Given that the study area has been seriously affected by the volcanic collapse, the sediment supply has considerably increased, significantly affecting the channel and flood control safety of downstream reaches. Accordingly, several prediction studies and observations relative to sediment transport have been conducted; two representative studies have been selected in Figure 4 [10,15]. In addition, the bed material has changed a lot. The particle size of the debris avalanche is usually less than 1 mm. The debris avalanche covering the channel significantly reduced the particle size of the bed material. Thereafter, the particle size of bed material was coarser due to the water sorting. Table 1 shows the particle size of bed material sampled through the pebble-count method [10].
The climate in the NFTR basin is characterized by cool and wet winters and warm and dry summers. Seasonal hydrological characteristics are dominated by long-term, low-intensity rainfall in autumn and winter, combined with the effects of spring snowmelt [25]. The developed NFTR flow series for the upstream area of the SRS is shown in Figure 5 [20].
As shown in Figure 4, at the beginning of the volcanic eruption, the sediment load was at the maximum level. In 1980–1985, the sediment load rapidly decreased; after 1985, the sediment load was basically stable. Under the existing conditions, this load is expected to remain unchanged for many years. Table 1 shows the bed materials obviously roughening after 1980. Figure 5 shows that three flood events occurred in 1982, 1996, and 2006. The 1982 event was caused by multiple factors, including pumping from Spirit Lake, the breakout of debris-dammed lakes, a lahar, and a rainstorm. On 8 February 1996, the mean daily discharge peaked at 318 m3/s, which is the record flood of the last 35 years. In 2006, a smaller flood and debris flow in the upstream tributaries resulted in a peak daily flow of 198 m3/s. However, except for these three, the NFTR discharge presents a seasonal annual distribution without any distinct trend over the years. The influences of those three flood events on the channel adjustment has been estimated later. In summary, the discharge has no characteristic trend, and the sediment load has remained stable after 1985. In 1980–1985, the channel was of non-equilibrium water and sediment transport; thereafter, equilibrium water and sediment transport were achieved.

4.2. Vertical Morphological Adjustments

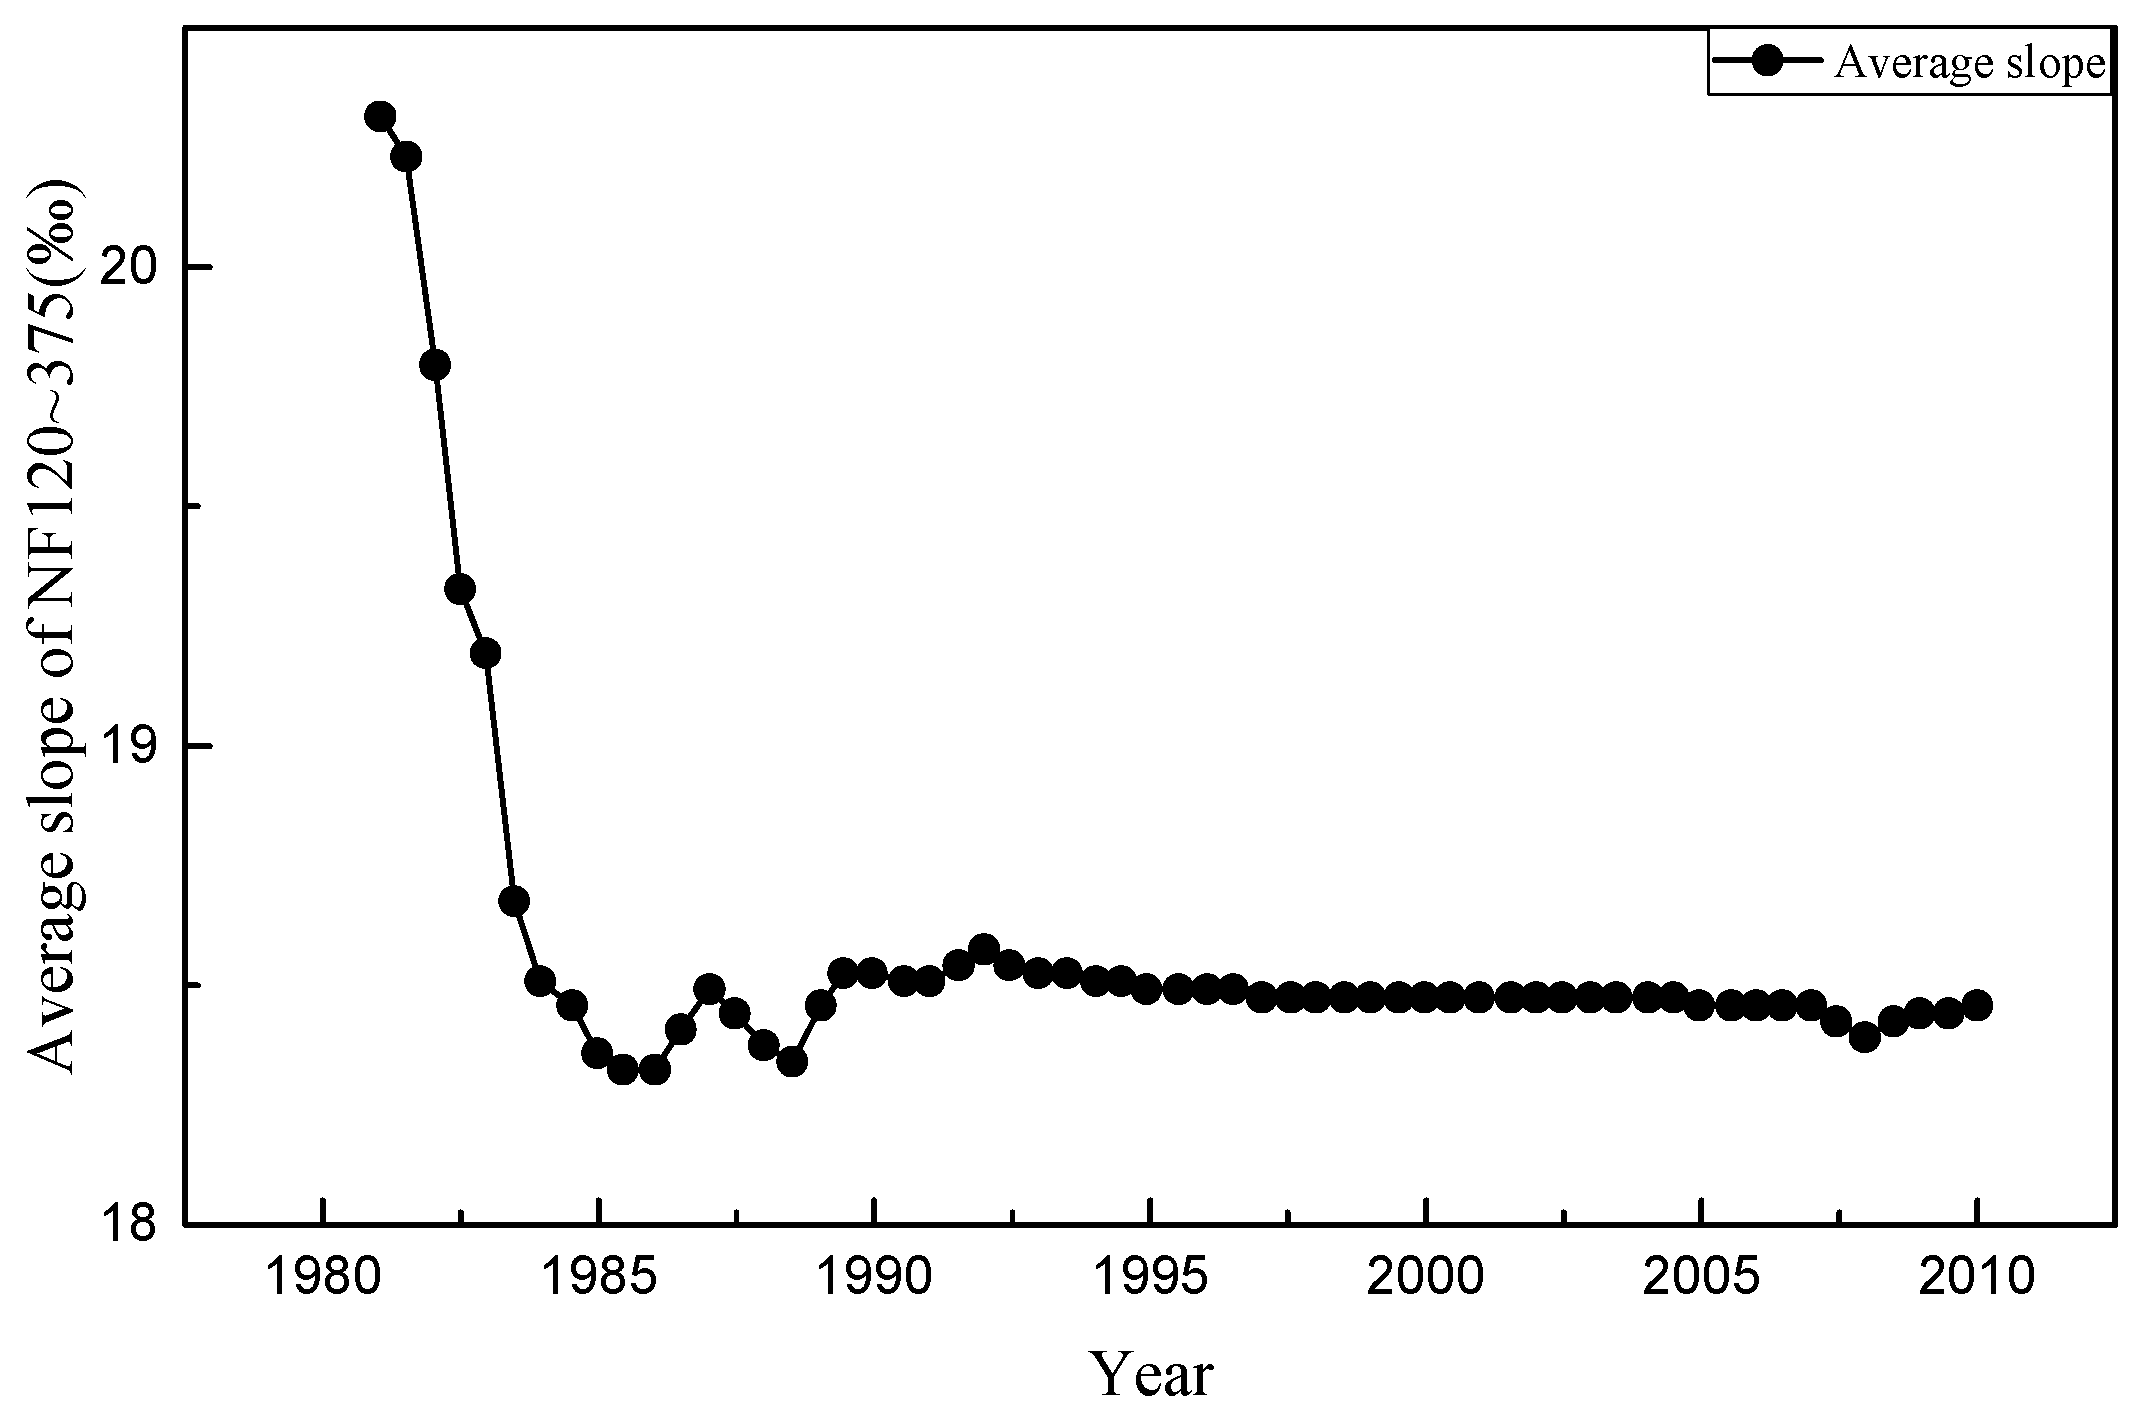
After the eruption of Mount St. Helens on 18 May 1980, the upstream of the NFTR was buried under a debris avalanche, which increased the channel slope. Figure 6 shows the adjustment of the averaged measured slope between sections N120 and N375 from the measured thalweg elevation of each cross section. At the beginning of the volcanic eruption, the initial average slope was steep because of the influence of volcanic collapse accumulation, as shown in Figure 6. After 1985, the measured slope remained stable. Combined analysis of discharge and sediment load showed that the channel reached the equilibrium water and sediment transport after 1985. At the same time, the measured average slope was basically stable.
Figure 7 shows the elevation changes from 1980 level in the NFTR. As shown in Figure 7, in the first few years of the volcanic eruption, the upper and middle sections of the study area began to degrade, and the downstream began to aggrade (Figure 7a); cross sections NF105–NF320 experienced degradation, and cross sections NF345–NF375 experienced aggradation in 1980–1985 (Figure 7b). In this way, the channel slope decreased. However, although the channel met the equilibrium water and sediment transport, and the channel slope was around stable after 1985, alternation of degradation and aggradation still occurred over the decades. As shown in Figure 7b, all of the cross sections alternated between degradation and aggradation after 1985; the scales of those adjustments were over 5 m. Figure 6 and Figure 7 also show that there were no significant changes in the channel slope and the trends of elevation changes for each cross section in 1982, 1996, and 2006. Therefore, the flood events in 1982, 1996, and 2006 had no significant effects on the channel adjustment.
Figure 8 shows the time series of profiles for cross sections. As shown in Figure 8, each cross section still had a large adjustment. Cross section NF110 experienced degradation from 1980 to 1984, then aggradation from 1984 to 1998, and a return to degradation until 2016; cross section NF130 experienced degradation from 1980 to 1983, then aggradation from 1983 to 1987, and a return to degradation until 2007; cross section NF320 experienced degradation from 1980 to 1987, then aggradation from 1987 to 1990, and a return to degradation until 2011; cross section NF345 experienced aggradation from 1980 to 1985, then degradation from 1985 to 1990, and a return to degradation until 2009.

4.3. Application of the Downstream Hydraulic Geometry to Channel Adjustment Processes

As mentioned above, the channel in the study area had equilibrium water and sediment transport after 1985, and the channel slope was close to stable. However, the channel morphology still experienced large-scale changes over the decades. In this chapter, the downstream hydraulic geometry has been used to calculate the channel geometries under equilibrium water and sediment transport and also the channel geometry in a final stable state. The calculation results will be compared with the measured data to explore the channel adjustment under water and sediment transport after 1985.
Equation (4) can be used to obtain the relationship between the aspect ratio and channel slope under equilibrium water and sediment transport, with known discharge, sediment flux, and bed material. Besides those three inputs, many boundary conditions, such as the geological structure of the substrate and the presence of bars and inlands separating the channels, also limit the channel adjustment [26,27,28]. In the study area, there was a gravel-bed river, featuring a predominantly meandering channel, with a well-developed pool–riffle bedform, prior to the 1980 eruption [17]. Following the eruption, the channel reformed with the debris–avalanche deposit under the action of surface runoff [18,20]. Therefore, those boundary conditions have less impact in the NFTR, and the channel adjustment met the hydraulic dominant. Q1 discharge (discharge that is equaled or exceeded 1% of the time) has been suggested as a representative measure of discharge, because temporal changes in hydraulic characteristics of the Q1 discharge reflect changes in bed elevation and active-channel width in the NFTR [10]. The Q1 discharge is about five times the mean annual flow at the Kid Valley gauging station. We also chose the Q1 of the developed flow series in Figure 5 as the representative discharge in calculation. The sediment flux was another input in Equation (4). For a gravel-bed stream, the bed load was generally chosen as the input. However, the suspended load and wash load accounted for a considerable fraction of the total load in the NFTR. Despite this, the grain size after 1985 (Table 1) shows that the particle size of the bed material (tens of mm) was much greater than the suspended load and wash load (<2 mm), so the suspended load and wash load have a relatively small impact on the riverbed adjustment. Therefore, the bed load was chosen in the calculation. The annual bed load transport after 1985 is shown in Figure 4a. We chose the average sediment transport between 1985 and 1992 as the representative sediment flux in the calculation. The average bed material of each cross section in 1991–1992 (shown in Table 1) was chosen for the calculation. Substituting the above data into Equation (4), we see that all of the channel geometries meet the conditions of equilibrium water and sediment transport shown in the calculated curve in Figure 9. Channel geometry is an approximation that involves uncertainty; therefore, the use of the results without an evaluation of uncertainty is irresponsible. An uncertainty analysis was conducted with the variability of the bed-load transport and the particle size of the bed. The uncertainty in the bed-load transport was found to be ±15% (Figure 4), while the uncertainty in the particle size of bed material was ±40% (Table 1). The reliability band is also shown in Figure 9. The stable state of channel geometry is at the extreme point on the curve.
In Figure 9, the measured data are the geometries of the main channel in cross sections NF105–NF320 at different times after 1985. The aspect ratio of the main channel in the aggradation reach (NF345–NF375) was difficult to obtain due to the channel experiencing a complex flat adjustment (Figure 8). The calculated curve and reliability band were well fitted to the measured data, so the channel adjustment was basically along the calculated curve under equilibrium water and sediment transport after 1985. As shown in Figure 9, the channel achieved a stable state when the aspect ratio was 31 and the channel slope was 0.0201. The channel was adjusted around the extreme point along the calculated curve. The error bar of the extreme point in Figure 9 shows that the stable slope ranged from 0.017 to 0.023 (±15%); the stable aspect ratio ranged from 19 to 43 (±35%). However, the channel adjustment was much greater than the variation of the stable aspect ratio. The change amplitude of the aspect ratio was between 10 and 100, and this change amplitude will have caused severe adjustment of geometries of cross sections.
The extremal hypothesis has already been proven [23,24]. The field study in the NFTR also verified the extremal hypothesis [10]. Therefore, the channel will adjust to the extreme point. Figure 10 shows the time series of channel geometries for the researched cross sections. The calculated stable state (extremal point) for NF105–NF375 shown in Figure 9 is also presented. As shown in Figure 10, the channel adjustments continued after 1985, and these adjustments were not random; the aspect ratio had periodic adjustments with the channel slope along the calculated curve, and the aspect ratio continued to alternate between increasing and decreasing. The channel geometries of cross sections NF120, NF130, and NF300 were periodically adjusted around the extremal point along the calculated curve. The stable state was calculated by the mean discharge, particle size, and sediment flux of NF105–NF375. Therefore, there was a difference in different cross sections. The aspect ratios of cross section NF310 were larger than the calculated stable state, but the channel geometries of NF310 were also periodically adjusted along the calculated curve in a range.
Figure 9 and Figure 10 show the cross-section adjustments when the channel met equilibrium water and sediment transport. Some researchers believe that the channel can stay stable once the channel meets equilibrium water and sediment transport, such that the extremal hypothesis is not a necessary condition [29,30]. However, in this study, the channel could not stay stable when the channel met equilibrium water and sediment transport; adjustments were still continuing. The extremal hypothesis was regarded as implying that, except for the extremal point on the calculated curve, the remaining points on the curve have potential energy. For a system, the existence of potential energy makes the system not in a stable state. Therefore, the channel will adjust toward the extremal point. In this study, it has been shown that the channel adjustment does not directly arrive at the extremal point during the processes of channel adjusting. As shown in Figure 10, the channel did not immediately stop adjustments when the channel geometry arrived at the extremal point but continued to periodically adjust around the extremal point along the calculated curve. The aspect ratio increased and decreased periodically; the channel slope was also adjusted in a small range.
The adjustment processes in Figure 10 are similar to the ball rolling on the calculated curve. As shown in Figure 11, the ball will move to the extremal point under the action of potential energy when the ball is located at any point on the curve except the extremal point. However, after the ball reaches the extremal point, it will not stop immediately, but it continues moving due to the excessive compensation of potential energy. The potential energy continues to be consumed during the processes of periodic moving, and eventually, it stops at the extremal point. In the similar adjustment of channel, the aspect ratio continues to change. The aspect ratio increases stand for the channel widening and aggradation; the aspect ratio decreases stand for the channel narrowing and degradation. Therefore, the channel will still experience alternations of degradation and aggradation, and this adjustment may even last for decades.

5. Conclusions

This study has analyzed the runoff and sediment flux, vertical morphological adjustments, and channel adjustment processes in the NFTR over decades. The adjustment processes were analyzed based on the downstream hydraulic geometry. The extremal point of the channel in a stable state and the calculated curve of channel under equilibrium water and sediment transport were calculated. We showed that the channel met equilibrium water and sediment transport after 1985; channel adjustments after 1985 in the NFTR were basically around the extremal point along the calculated curve. The adjustment processes were significant and periodic. It has been presumed that morphological adjustments continued even when the channel met the equilibrium water and sediment transport. A new mechanism for short-to-medium-term channel adjustments after a violent disturbance has been proposed in this study. These adjustment processes are regarded as the processes by which a river consumes surplus energy to reach the stable state. In these processes, the alternations of degradation and aggradation occurred.

Author Contributions

X.W. collected data, wrote the paper, and did most of the analysis. X.M. and X.L. proofread the paper and provided a lot of valuable advice on the results presentation and writing. All authors have read and agreed to the published version of the manuscript.

Funding

This research was supported by the National Natural Science Foundation of China (U20A20319).

Acknowledgments

We thank Shan Zheng for assisting with the case study.

Conflicts of Interest

The authors declare no conflict of interest.

References

  1. Wang, W.; Godard, V.; Liu-Zeng, J.; Scherler, D.; Xu, C.; Zhang, J.; Xie, K.; Bellier, O.; Ansberque, C.; de Sigoyer, J.; et al. Perturbation of fluvial sediment fluxes following the 2008 Wenchuan earthquake. Earth Surf. Proc. Land. 2017, 42, 2611–2622. [Google Scholar] [CrossRef]
  2. Fan, N.N.; Nie, R.H.; Wang, Q.; Liu, X.N. Dramatic undercutting of piedmont rivers after the 2008 wenchuan ms 8.0 earthquake. Sci. Rep. 2016, 6, 37108. [Google Scholar] [CrossRef] [PubMed] [Green Version]
  3. Schumm, S.A.; Harvey, M.D.; Watson, C.C. Incised Channels: Morphology, Dynamics, and Control; Water Resources Publications: Littleton, CO, USA, 1984. [Google Scholar]
  4. Simon, A.; Hupp, C.R. Geomorphic and vegetative recovery processes along modified Tennessee streams: An interdisciplinary approach to disturbed fluvial systems. For. Hydrol. Watershed Manage. 1986, 167, 251–262. [Google Scholar]
  5. Cluer, B.; Thorne, C.R. A stream evolution model integrating habitat and ecosystem benefits. River Res. Appl. 2014, 30, 135–154. [Google Scholar] [CrossRef]
  6. Doyle, M.W.; Shields, F.D. Incorporation of bed texture into a channel evolution model. Geomorphology 2000, 34, 291–309. [Google Scholar] [CrossRef]
  7. Hawley, R.J.; Bledsoe, B.P.; Stein, E.D.; Haines, B.E. Channel evolution model of semiarid stream response to urban-induced hydromodifications. JAWRA J. Am. Water Resour. Assoc. 2012, 48, 722–744. [Google Scholar] [CrossRef]
  8. Zheng, S.; Thorne, C.R.; Wu, B.S.; Han, S.S. Application of the Stream Evolution Model to a Volcanically Disturbed River: The North Fork Toutle River, Washington State, USA. River Res. Appl. 2017, 33, 937–948. [Google Scholar] [CrossRef]
  9. Simon, A. Energy, time, and channel evolution in catastrophically disturbed fluvial systems. Geomorphology 1992, 5, 345–372. [Google Scholar] [CrossRef]
  10. Simon, A.; Thorne, C.R. Channel adjustment of an unstable coarse-grained stream: Opposing trends of boundary and critical shear stress, and the applicability of extremal hypotheses. Earth Surf. Proc. Land. 1996, 21, 155–180. [Google Scholar] [CrossRef]
  11. Kasai, M. Channel processes following land use changes in a degrading steep headwater stream in North Island, New Zealand. Geomorphology 2006, 81, 421–439. [Google Scholar] [CrossRef]
  12. Leon, C.; Julien, P.Y.; Baird, D.C. Case study: Equivalent widths of the middle Rio Grande, New Mexico. J. Hydraul. Eng. 2009, 135, 306–315. [Google Scholar] [CrossRef] [Green Version]
  13. Wu, B.S.; Zheng, S.; Thorne, C.R. A general framework for using the rate law to simulate morphological response to disturbance in the fluvial system. Prog. Phys. Geogr. 2012, 36, 575–597. [Google Scholar] [CrossRef]
  14. Zheng, S.; Wu, B.S.; Thorne, C.R.; Simon, A. Morphological evolution of the North Fork Toutle River following the eruption of Mount St. Helens, Washington. Geomorphology 2014, 208, 102–116. [Google Scholar] [CrossRef]
  15. Biedenharn, G. Toutle-Cowlitz River Sediment Budget; US Army Corps of Engineers Portland District: Portland, OR, USA, 2010. [Google Scholar]
  16. Janda, R.J.; Meyer, D.F.; Childers, D. Sedimentation and geomorphic changes during and following the 1980–1983 eruptions of Mount St. Helens, Washington (1). J. Jpn. Soc. Eros. Control. Eng. 1984, 37, 10–23. [Google Scholar]
  17. Meyer, D.F.; Martinson, H.A. Rates and Processes of Channel Development and Recovery Following the 1980 Eruption of Mount St. Helens, Washington. Hydrol. Sci. J. 1987, 34, 115–127. [Google Scholar] [CrossRef]
  18. Simon, A. Channel and Drainage-basin Response of the Toutle River System in the Aftermath of the 1980 Eruption of Mount St. Helens, Washington, USA Geological Survey Open-file Report; USA Geological Survey: Washington, DC, USA, 1999; p. 99-633. [Google Scholar]
  19. U.S. Army Corps of Engineers. Cowlitz River Basin Water Year 2002 Hydrologic Summary: Mount St. Helens, Washington, Toutle River and North FORK Toutle River; U.S. Army Corps of Engineers: Wilmington District, DE, USA, 2003.
  20. Major, J.J.; Mark, L.E. Peak flow responses to landscape disturbances caused by the cataclysmic 1980 eruption of Mount St. Helens, Washington. Geol. Soc. Am. Bull. 2006, 118, 938–958. [Google Scholar] [CrossRef]
  21. Wong, M.; Parker, G. Reanalysis and Correction of Bed-Load Relation of Meyer-Peter and Müller Using Their Own Database. J. Hydraul. Eng. 2006, 132, 1159–1168. [Google Scholar] [CrossRef] [Green Version]
  22. Huang, H.Q.; Nanson, G.C. Hydraulic geometry and maximum flow efficiency as products of the principle of least action. Earth Surf. Process. Landf. 2000, 25, 1–16. [Google Scholar] [CrossRef]
  23. Huang, H.Q.; Chang, H.H.; Nanson, G.C. Minimum energy as the general form of critical flow and maximum flow efficiency and for explaining variations in river channel pattern. Water Resour. Res. 2004, 40, 1–13. [Google Scholar] [CrossRef]
  24. Nanson, G.C.; Huang, H.Q. Least action principle, equilibrium states, iterative adjustment and the stability of alluvial channels. Earth Surf. Proc. Land. 2008, 33, 923–942. [Google Scholar] [CrossRef] [Green Version]
  25. Simon, A.; Klimetz, D. Analysis of Long-Term Sediment Loadings from the Upper North Fork Toutle River System, Mount St. Helens, Washington; National Sedimentation Laboratory Technical Report Number 77; U.S. Department of Agriculture: Washington, DC, USA, 2012. [Google Scholar]
  26. Słowik, M.; Dezso, J.; Marciniak, A.; Toth, G.; Kovacs, J. Evolution of river planforms downstream of dams: Effect of dam construction or earlier humaninduced changes? Earth Surf. Proc. Land. 2019, 43, 2045–2063. [Google Scholar] [CrossRef]
  27. Gierszewski, P.J.; Habel, M.; Szmanda, J.B.; Luc, M. Evaluating effects of dam operation on flow regimes and riverbed adaptation to those changes. Sci. Total Environ. 2020, 710, 136202. [Google Scholar] [CrossRef] [PubMed]
  28. Szmanda, J.B.; Gierszewski, P.J.; Habel, M.; Luc, M.; Witkowski, K.; Bortnyk, S.; Obodovskyi, O. Response of the Dnieper river fluvial system to the river erosion caused by the operation of the Kaniv hydro-electric power plant (Ukraine). Catena 2021, 202, 105265. [Google Scholar] [CrossRef]
  29. Knighton, D. Fluvial Forms and Processes: A New Perspective; Arnold Hodder Headline, PLC: London, UK, 1998. [Google Scholar]
  30. Darby, S.E.; Thorne, C.R. Discussion: Effect of bank stability on geometry of gravel rivers by Millar and Quick. J. Hydraul. Eng. 1995, 121, 382–384. [Google Scholar] [CrossRef]
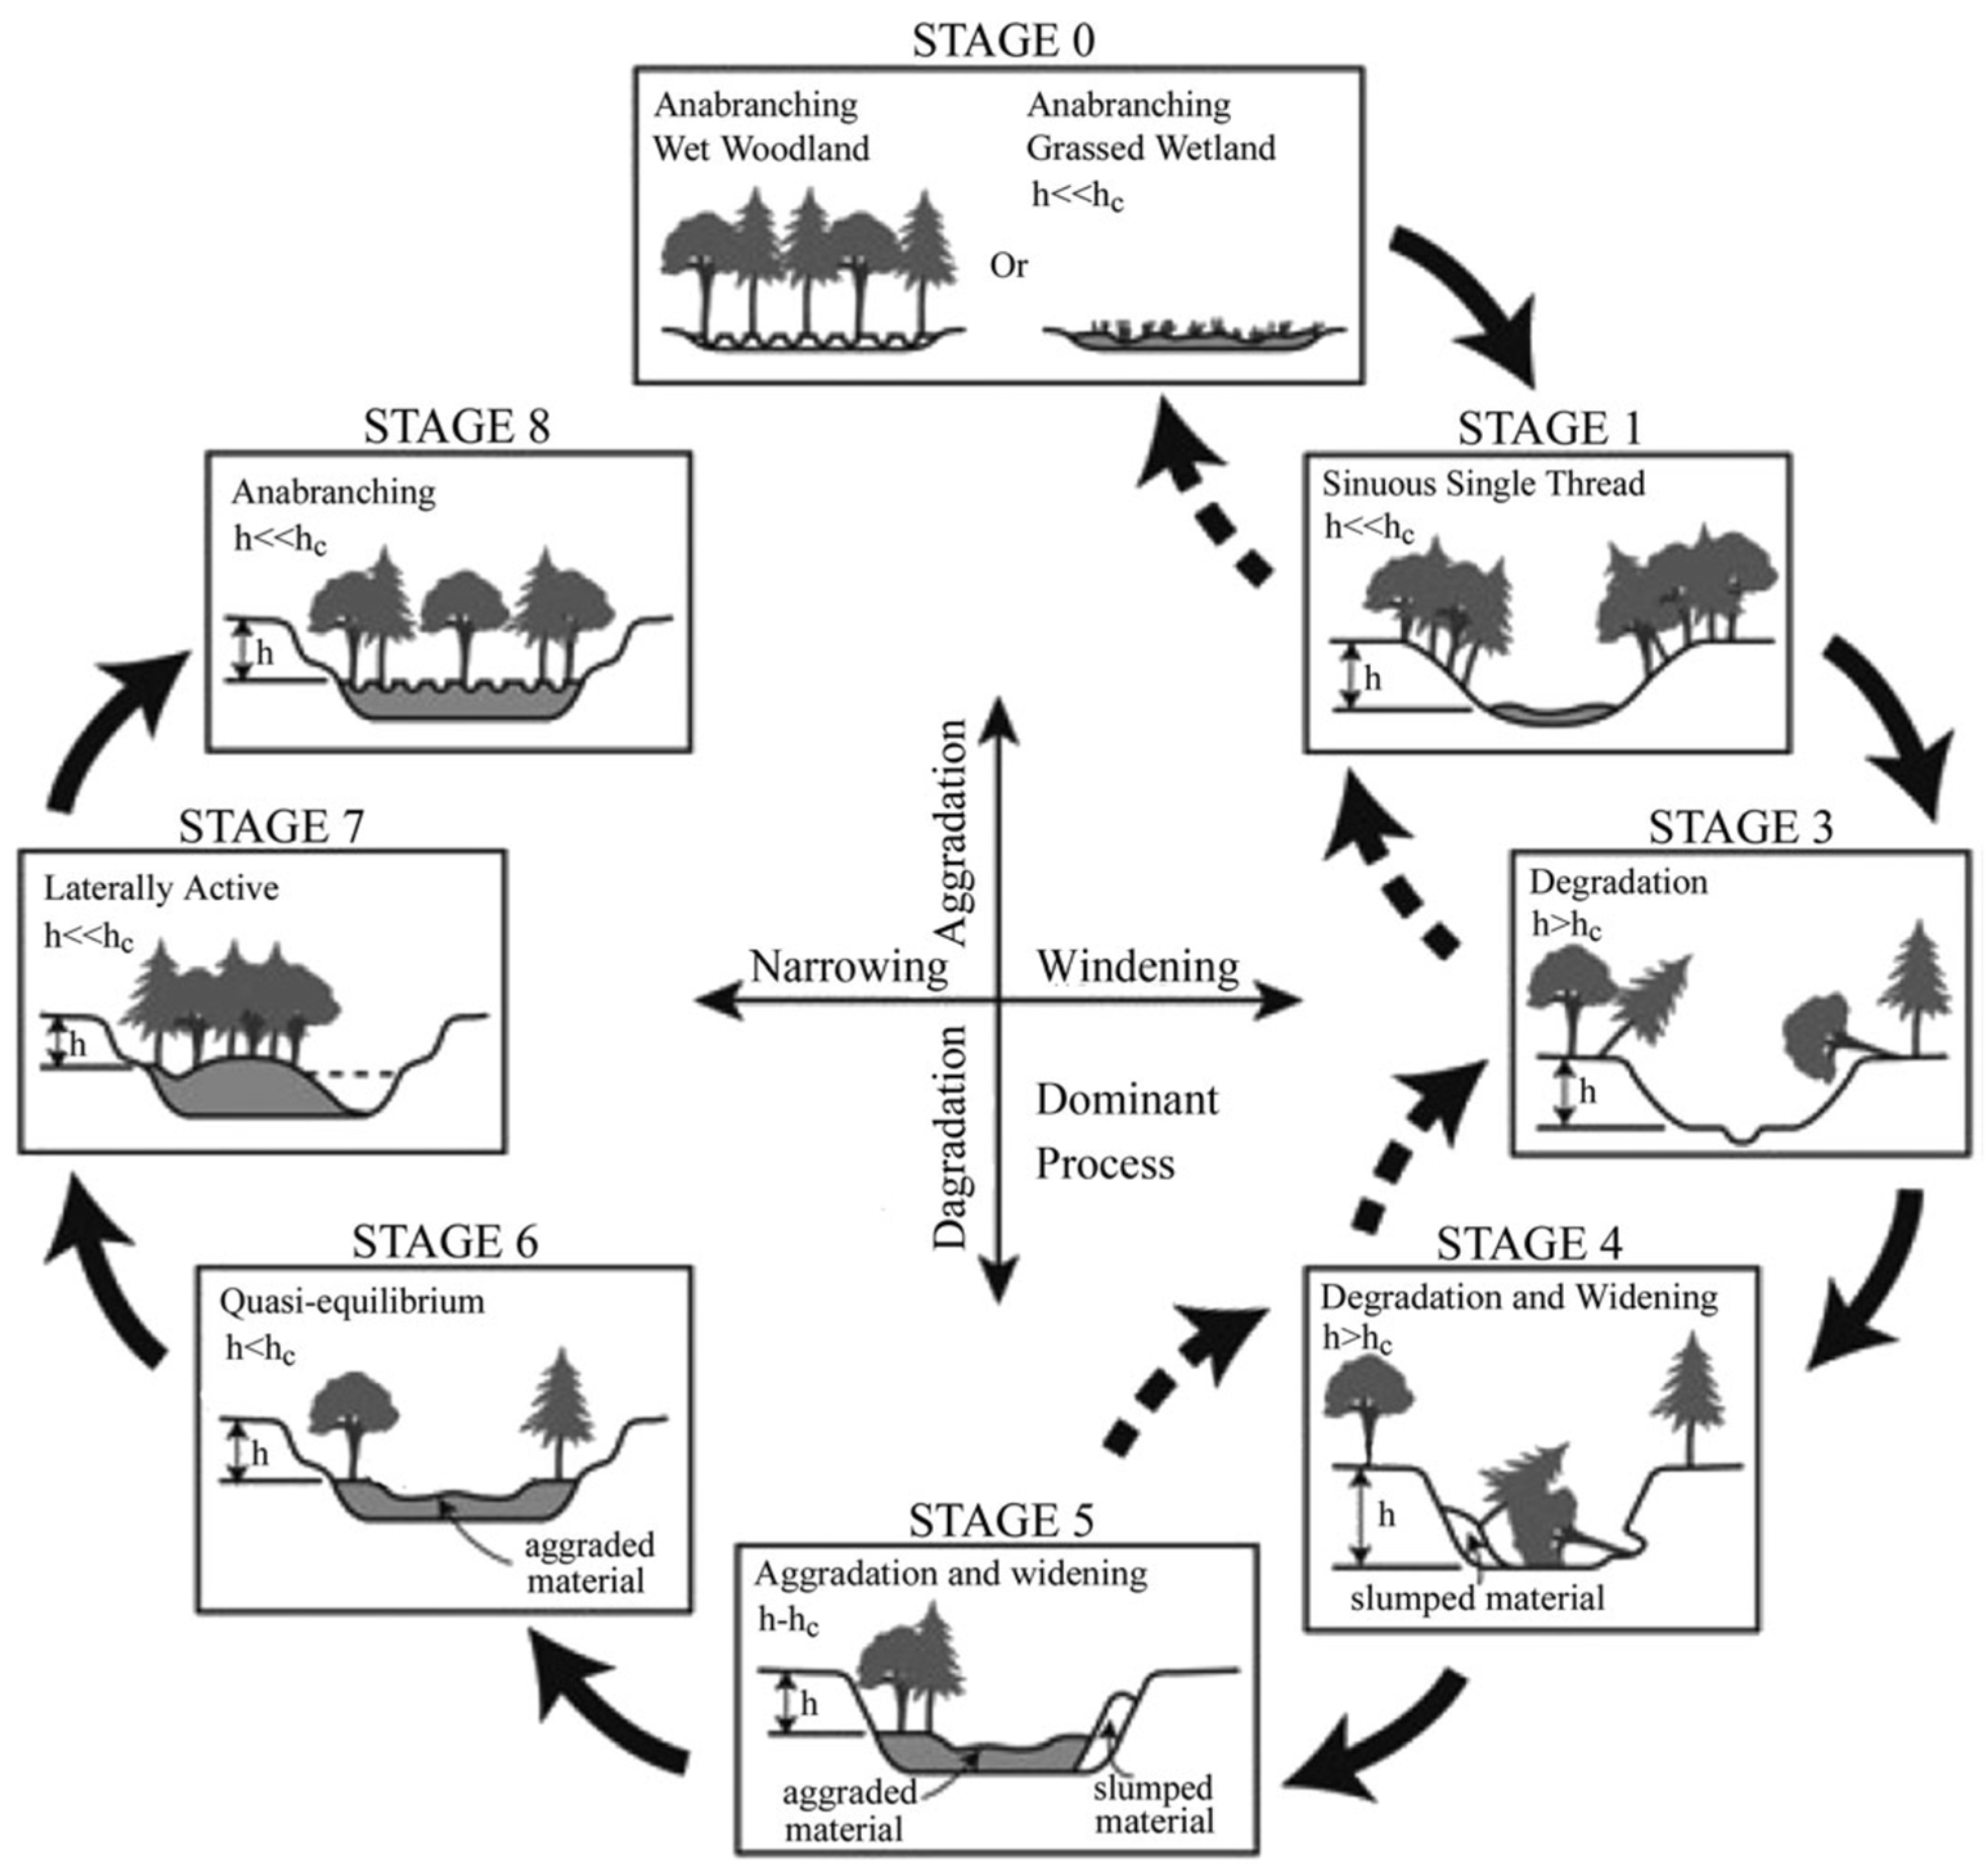
Figure 1. Developed model for channel adjustment, affected by massive sediment input in the North Toutle River (NFTR) [8] (h is the bank height, and hc is the critical stability bank height). Stage 2 in the original SEM is omitted as it is not relevant to the evolution of the upper NFTR. ‘Anabranching’ is used instead of ‘anastomosing’ in stages 0 and 8 to better reflect the conditions in the NFTR. Reprinted with permission from ref. [8]. Copyright 2021 John Wiley & Sons-Books.
Water 13 02802 g001
Figure 2. Study area: (a) study channel and cross sections and (b) Toutle River Basin [8]. Reprinted with permission from ref. [8]. Copyright 2021 John Wiley & Sons-Books.
Water 13 02802 g002
Figure 3. Plot of energy slope vs. aspect ratio for hydraulic geometry with constant Q, Qs, and d.
Water 13 02802 g003
Figure 4. Sediment flux in NFTR. (a) Measured sediment flux [10]; (b) predicted cumulative sediment yield (dashed lines refer to 1999 and 2035) [15].
Water 13 02802 g004
Figure 5. Flow series developed for upper NFTR at SRS [20].
Water 13 02802 g005
Figure 6. Adjustment of average measured slopes of NF120–375 cross sections.
Water 13 02802 g006
Figure 7. Elevation changes from the 1980-level in the NFTR. (a) Elevation changes along the channel since 1980; (b) elevation changes from 1980 for cross sections NF105–NF375.
Water 13 02802 g007
Figure 8. Time series of profiles for cross sections.
Water 13 02802 g008
Figure 9. The calculation results and reliability band of Equation (4) compared with the measured data.
Water 13 02802 g009
Figure 10. Time series of channel geometries for cross sections NF120, NF130, NF300, and NF310. (a) Time series of channel geometries for NF120 from 1981 to 1998; (b) time series of channel geometries for NF130 from 1981 to 2007; (c) time series of channel geometries for NF300 from 1981 to 2009; (d) time series of channel geometries for NF310 from 1981 to 2009.
Water 13 02802 g010
Figure 11. Schematic of the channel adjustment under equilibrium water and sediment transport.
Water 13 02802 g011
Table 1. Particle size of sampled bed material [10].
SiteDistance from NF105 (km)1980
D50 (mm)
1991–1992
D50 (mm)
Initial Vertical Adjustment
NF1050--Degradation
NF1101.42--Degradation
NF1204.630.915.6Degradation
NF1255.53--Degradation
NF1307.590.925.9Degradation
NF30010.87--Degradation
NF31014.040.5316.0Degradation
NF32015.990.5350.2Degradation
NF34519.070.5328.1Aggradation
NF35019.570.5332.0Aggradation
NF37524.73--Aggradation
Publisher’s Note: MDPI stays neutral with regard to jurisdictional claims in published maps and institutional affiliations.