1. Introduction
China is a major cotton producer in the world. In 2010, China’s cotton output accounted for 31% of the world’s total. However, after 10 years of changes, China’s cotton output showed a downward trend, and the proportion was also gradually declining. In 2019, China’s cotton output accounted for only 23%. In order to increase cotton production, since 2014, the Chinese target price policy of cotton has considered the reform undertaken in Xinjiang as a pilot, replacing the temporary cotton purchase and storage system, and adjusting the ‘separation of price and compensation’ with a ‘combination of price and compensation’ [
1]. This is a major reform considering the policies for cotton support since the beginning of the century, marking the formal beginning of the supply-side structural reform of cotton. By the end of the pilot period in 2016, China had adjusted and improved Xinjiang’s target price subsidy policy for cotton with a plan to retain the overall framework and manage the upper limit of the quantity of cotton receiving the subsidy at the target price. The upper limit of the subsidy was 85% of the national average cotton output prevalent in the base period (2012–2014). Those exceeding the upper limit were not expected to be subsidized, and the target price remained unchanged for 3 years (2017–2019) at 18,600 yuan per ton. The target price of cotton was determined by adding the production cost and reasonable income for the previous 3 years, and the specific value of reasonable income was determined by factors such as the development needs of the cotton industry, financial-bearing capacity, and changes in the market situation.
Subsequent to the implementation of Xinjiang’s target cotton price, the domestic and foreign cotton prices became steady, the competitiveness of domestic cotton improved, income for farmers was guaranteed, and the domestic cotton production stabilized. However, it resulted in a few problems and raised questions. During the 2017 reform, the pricing mechanism of the target price of cotton was ‘production cost and basic income’. As such, the target price of cotton set under the particular principle guaranteed basic income for farmers. As a result of stable income and farmers’ enthusiasm for production, cotton cultivation in Xinjiang expanded rapidly, significantly increasing cotton yield. A number of growers blindly expanded cultivation, ignoring its ecological impact. Therefore, the annual cotton acreage and output of Xinjiang published by the National Bureau of Statistics are often different from the planting acreage of cotton and output of Xinjiang’s local statistics (as the area and output of planting acreage of cotton and output of agricultural land are only calculated by the National Bureau of Statistics). The primary field crops in Xinjiang include cotton, corn, and wheat. Although Xinjiang has been implementing the wheat purchase policy of ‘government pricing, open purchase, and open direct subsidy’ for wheat, the implementation of the target price policy theoretically guides farmers to change the planting structure owing to the different policy support provided for wheat and cotton. The target price subsidy policy is essentially a price support policy. From an economic analysis, the price support policy will reduce production risks and increase the expected income of farmers, thereby forming a positive incentive effect for production, promoting farmers to expand the scale of production, and affecting the entire agricultural production structure. From actual observations, since the cotton target price subsidy policy was stabilized in 2016, the area of cotton planted in Xinjiang has continued to grow, while the area of grain, especially wheat, has declined significantly, and the per capita share of wheat has fallen to the lowest level since 2009. In particular, in 2018, Xinjiang abandoned the wheat purchase and storage system and adopted a new wheat purchase and storage mechanism featuring ‘government guidance, market pricing, multi-agent acquisition, producer subsidy, high quality and preferential price, high quality and preferential subsidy, and emergency market purchase’, which reduced the support for wheat significantly. The obvious question is whether the implementation of the cotton target price subsidy policy has had a greater stimulus effect on Xinjiang cotton production. Has it affected the entire crop planting structure in Xinjiang and caused grain and cotton coordination problems? The Xinjiang Autonomous Region is an inland province in the northwest of China; the special geographical location and regional conditions determine the balance of crop planting structure in the Xinjiang Autonomous Region, and the issue of grain and cotton balance is especially important.
At present, studies on the impact of target price on the production of cotton mainly focus on the theory and necessity of the target price policy, the impact assessment of the target price policy, the impact of the target price policy on cotton production, and the relationship between the target price policy and agricultural productivity [
2,
3,
4]. Regarding the necessity and theoretical significance of the target price policy, compared with other agricultural product price policies (minimum purchase price policies), the aforementioned price policy has great advantages in protecting producer interests, subsidizing efficiency, and maintaining the internal formation mechanism of market price [
5,
6]. From the perspective of the overall implementation situation of the policy, most of the existing research has obtained the certain result that the two main pilots of target price policy, cotton and soybean, have reached the expected goals of narrowing the price gap between the international market and that in China, improving the market price formation mechanism, to protect the interests of the farmers, and promote industry development, improve the production enthusiasm, and stabilize the production [
7,
8]. With regard to the impact of the target price policy on agricultural production (cotton), at the micro level, the target price subsidy policy has a positive effect on guaranteeing farmers’ planting income and improving their income level [
9]. However, in the context of the current WTO (World Trade Organization) restrictions on the ’yellow box’ policy, its ability to continuously increase the benefits of cotton farmers is limited [
10]. In respect of the relationship between target price policy and agricultural productivity, many studies have shown that there is a negative correlation between target price subsidy policy and agricultural productivity [
11,
12,
13].
Regarding what has been discussed above, previous studies mainly focus on the policy significance and practical experience summary of the target price policy; few papers have empirically analyzed the impact of the cotton target price policy on cotton planting and its influencing mechanism through panel data. Considering this, the current article is based on county-level samples from Xinjiang and Shandong province for 2011–2018 using the double-difference method (DID) and provides insights on the synchronic control factors that influence domestic cotton cultivation. In the traditional way, the effect of the policy is mainly evaluated by setting a dummy variable of whether the policy takes place or not and then regression. In contrast, the model setting of the double-difference method is more scientific and can estimate the policy effect more accurately by comparing the differences between the control group and the treatment group before and after the implementation of the policy [
14]. This article also verifies the policy reform, adjusts the cause-and-effect relationship between cotton-planting areas, and provides theoretical evidence for updating the target price adjustment and policy support for cotton.
2. Literature Review
2.1. Research on the Necessity and Theoretical Significance of the Target Price Policy
The target price subsidy policy is a significant part of the agricultural subsidy support policy system in China. It is a price policy that protects producers’ profit on the basis of realizing market-clearing through the market price formation mechanism. It can also increase producer and consumer surplus [
15,
16,
17]. From an international perspective, the ’government and market’ policy model based on target price policy is also a trend in policy reform under the dual demands of both protecting the weak agriculture and maintaining the order of the agricultural products market. Since the 1973 Farm Bill, the agricultural policy system in the United States has gradually lowered the minimum protective price and strengthened the role that market service plays in policy support through introducing the target price subsidy policy to improve the efficiency of policy support and reduce the interference on market operation [
18,
19,
20]. As a cotton producer and exporter with a long cultivation tradition, the Ethiopian cotton market is also constrained by price suppression and lack of market information. The government should give great emphasis to standardized grading in line with target price incentives and constantly strengthening market-oriented services. In 2004, China fully liberalized the purchase and price of grains, gradually forming a mechanism for protecting and minimizing purchase prices of agricultural products. With the increase in production costs, the disadvantages of this mechanism, such as distorted market signals and expanded financial pressures, become more and more obvious. In addition, China’s agricultural product market suffers from issues of excessive circulation and lack of proper order. Therefore, it is necessary to introduce the target price system of agricultural products to alleviate problems in the operation of the agricultural product market and guarantee the stability of agricultural development and grain production and supply [
21,
22,
23]. In China’s new round of reform of the price formation mechanism of major agricultural products and grain purchase and storage system launched in 2014, target price subsidy has become the most important pilot reform policy [
24,
25].
2.2. Research on the Policy Effect of the Target Price Policy
The goal of the target price policy is mainly to improve the price formation mechanism of agricultural products while protecting farmers’ interests and stabilizing production. To improve the agricultural products price formation mechanism, most scholars believe that the target price policy stabilizes agricultural prices, reduces the degree of market distortions [
26,
27], strengthens the connection between prices for agricultural products in the international market and that in China, and straightens out the relationship between different aspects of the industrial chain link [
28,
29]. At the same time, it also reduces the asymmetry of agricultural products futures, improves the futures market efficiency, and strengthens the guidance function of the futures market to the spot market [
30,
31]. In addition, the direct payment subsidy policy is beneficial to make the farmers’ income distribution more fair [
32,
33]. However, some scholars raised the possibility of improving the implementation of target price policy from the perspective of welfare. By comparing the changes of social welfare under the grain stabilization policy and the target price policy, some scholars believe that compared with the grain price stabilization policy, the target price policy can better protect the welfare of producers and consumers under the background of agricultural product price fluctuation, but its impact on the overall welfare level of society depends on the rationality of the target price and the efficiency of the policy implementation [
34]. By constructing the soybean market equilibrium movement model, two scholars have studied the welfare effect of the soybean target price policy, and the analysis shows that the government’s subsidy expenditure for the price difference is more flexible to the change of the target price, and the government’s invalid welfare loses more, that is, the weak output increase effect is replaced by high fiscal expenditure [
35].
2.3. Research on the Impact of the Target Price Policy on Agricultural Production (Cotton)
With regard to the impact of the target price policy on agricultural production (cotton), according to the economic analysis of how policies function, the implementation of the target price policy will increase the expected income of farmers and reduce the expected production risk, thus forming a positive incentive effect on production and promoting farmers to expand the scale of production [
36,
37], but farmers’ decisions are also affected by factors such as their wealth level and whether the policy implementation in the previous period has reached the expected income [
38,
39]. Specifically, from the perspective of farmers’ decision-making behaviors, the effect of policy implementation also depends on farmers’ confidence in policies, the stability they felt, comparative benefits of soybeans and corn, and subsidy methods [
40,
41].
2.4. Research on the Relationship between the Target Price Policy and Agricultural Productivity
With respect to the relationship between target price policy and agricultural productivity, Latruffe expresses that there is a significant negative correlation between management efficiency and capped direct payments [
42]. However, the negative impacts of food expenditure subsidy and fertilizer subsidy on TFP are negligible [
43]. Using the data of French farms from 1996 to 2003, some scholars conducted empirical studies showing that some subsidy policies had negative effects on production efficiency [
44]. Subsidy policy has a negative effect on the technical efficiency score but a positive effect on both technical efficiency and productivity [
45]. Through research, Chinese scholars have shown that subsidy policy fails to effectively improve the total factor productivity of cotton production in China [
46]. In addition, some scholars also found that decoupling policies in some countries had a significant positive impact on agricultural productivity [
47,
48,
49].
Regarding what has been discussed above, previous studies mainly focus on the policy significance and practical experience summary of the target price policy, very few of which analyze the impact of the target price policy on cotton planting based on panel data and empirical methods. In this context, the present paper provides the following contributions: (a) it empirically analyzes the impact of the target price policy on the planting structure by using county-level panel data of Xinjiang province and Shandong province in China. (b) It also discusses how cotton planting is affected by the target price policy.
3. Theoretical Analysis of the Effect of Target Price Policy on the Yield of Cotton
Using the classical theory of supply and demand, the target price of cotton production can be analyzed [
50].
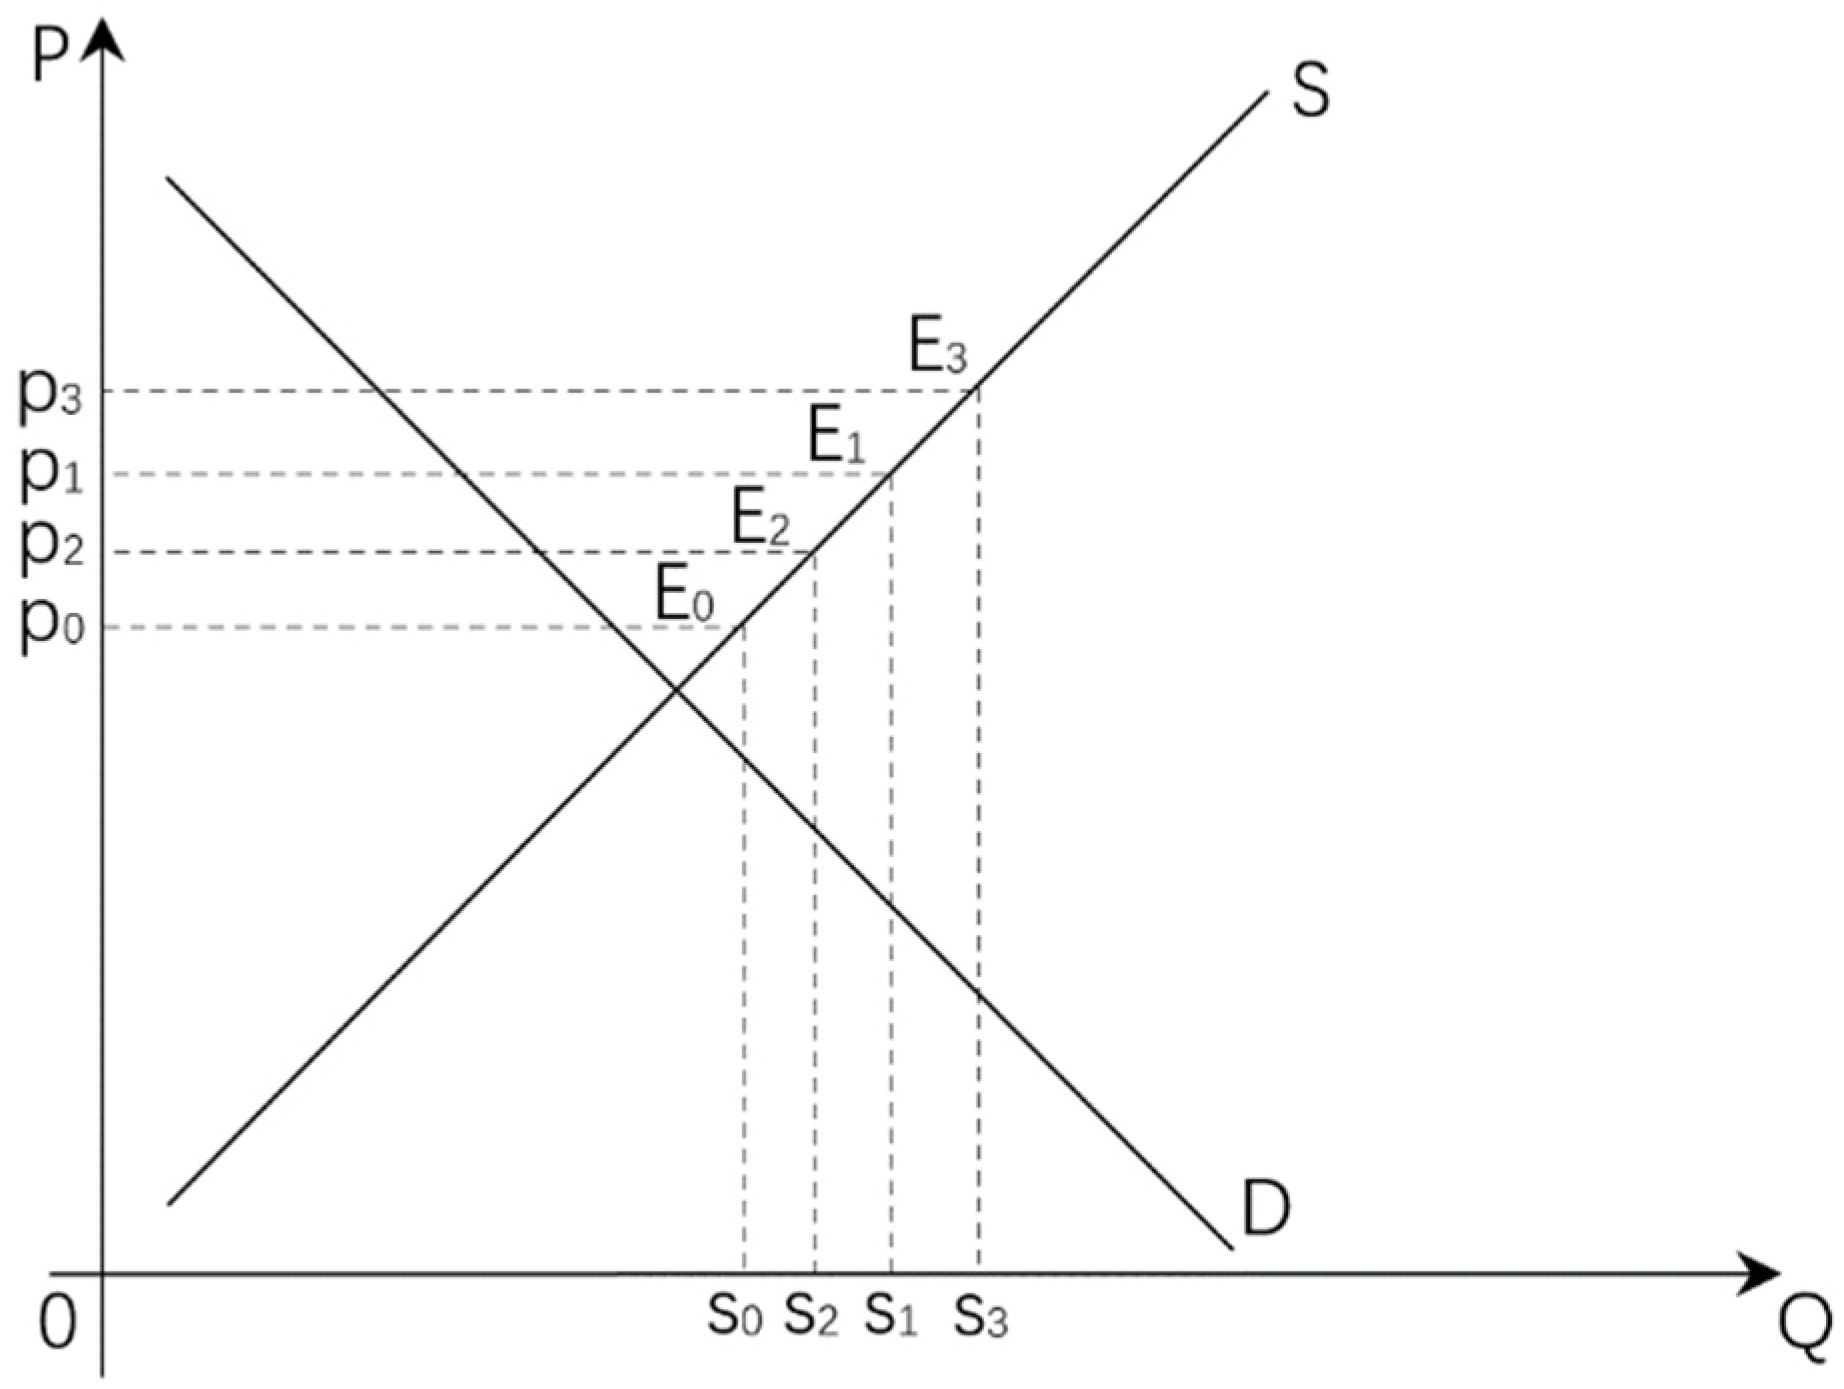
Figure 1 shows the influence of cotton target price on cotton production after the cancellation of temporary purchase and storage policy of cotton, where the ordinate is cotton’s price, the abscissa is cotton’s production, curve S is the supply curve, and curve D is the demand curve. Firstly, under the policy of temporary purchase and storage of cotton, it is assumed that P
1 is the temporary purchase and storage price of cotton established by the state, and P
0 is the actual transaction price between cotton farmers and cotton purchasers. In practice, due to traffic and transportation costs, most cotton farmers do not directly sell cotton to cotton-processing companies but to cotton purchasers, and cotton purchasers sell cotton to cotton-processing companies; the price is deducted for reasons such as impurities and moisture. Therefore, cotton merchants acquire cotton on the premise of maintaining profit, and cotton farmers buy cotton at prices lower than those of the reserve price. As such, the reserve price P
1 is greater than the actual cotton sales price P
0. When there is no temporary cotton purchase and storage policy, the supply curve point E
0 corresponding to P
0 and the projected point S
0 on the abscissa is the supply level of P
0. When the policy of temporary purchase and storage price of cotton is implemented, the price of cotton rises from P
0 to P
1. In this period, the profit generated by the difference between the temporary purchase and storage price and the actual transaction price will accrue to the cotton buyer and not to the cotton farmer. Subsequent to the implementation of the target price policy, it is assumed that the target price is equal to the temporary purchase and storage price. In other words, the target price policy is still P
1. The income of cotton farmers changes based on the method adopted by the government to provide a subsidy, from the original subsidy, purchasing enterprises, direct subsidy, and finally, producers. At this point, the income of cotton farmers from selling cotton flowers is not less than the income from selling cotton flowers at the price of P
1, and the corresponding supply level is S
1. Therefore, in comparison to the implementation of the target price policy, the temporary purchase and storage policy provides more benefits to cotton farmers and increases their enthusiasm for cotton production, thereby increasing the supply of cotton.
Certainly, this is the case when the target price of cotton is equal to the temporary purchase and storage price. If the target price is higher than the temporary purchase and storage price, then the target price is expressed as P3. At this point, the income of cotton farmers is higher, their enthusiasm for production is greater, and the corresponding supply increases to S3. If the target price is lower than the temporary purchase and storage price, then the target price is expressed as P2. In comparison to the price level P1, cotton farmers’ income and production enthusiasm reduce, thereby resulting in a corresponding supply level of S2. On the whole, after the implementation of the target price policy, in comparison to the temporary purchase and storage price, the target price increases the enthusiasm of cotton farmers for production and encourages them to increase the planting area, thereby increasing cotton production.
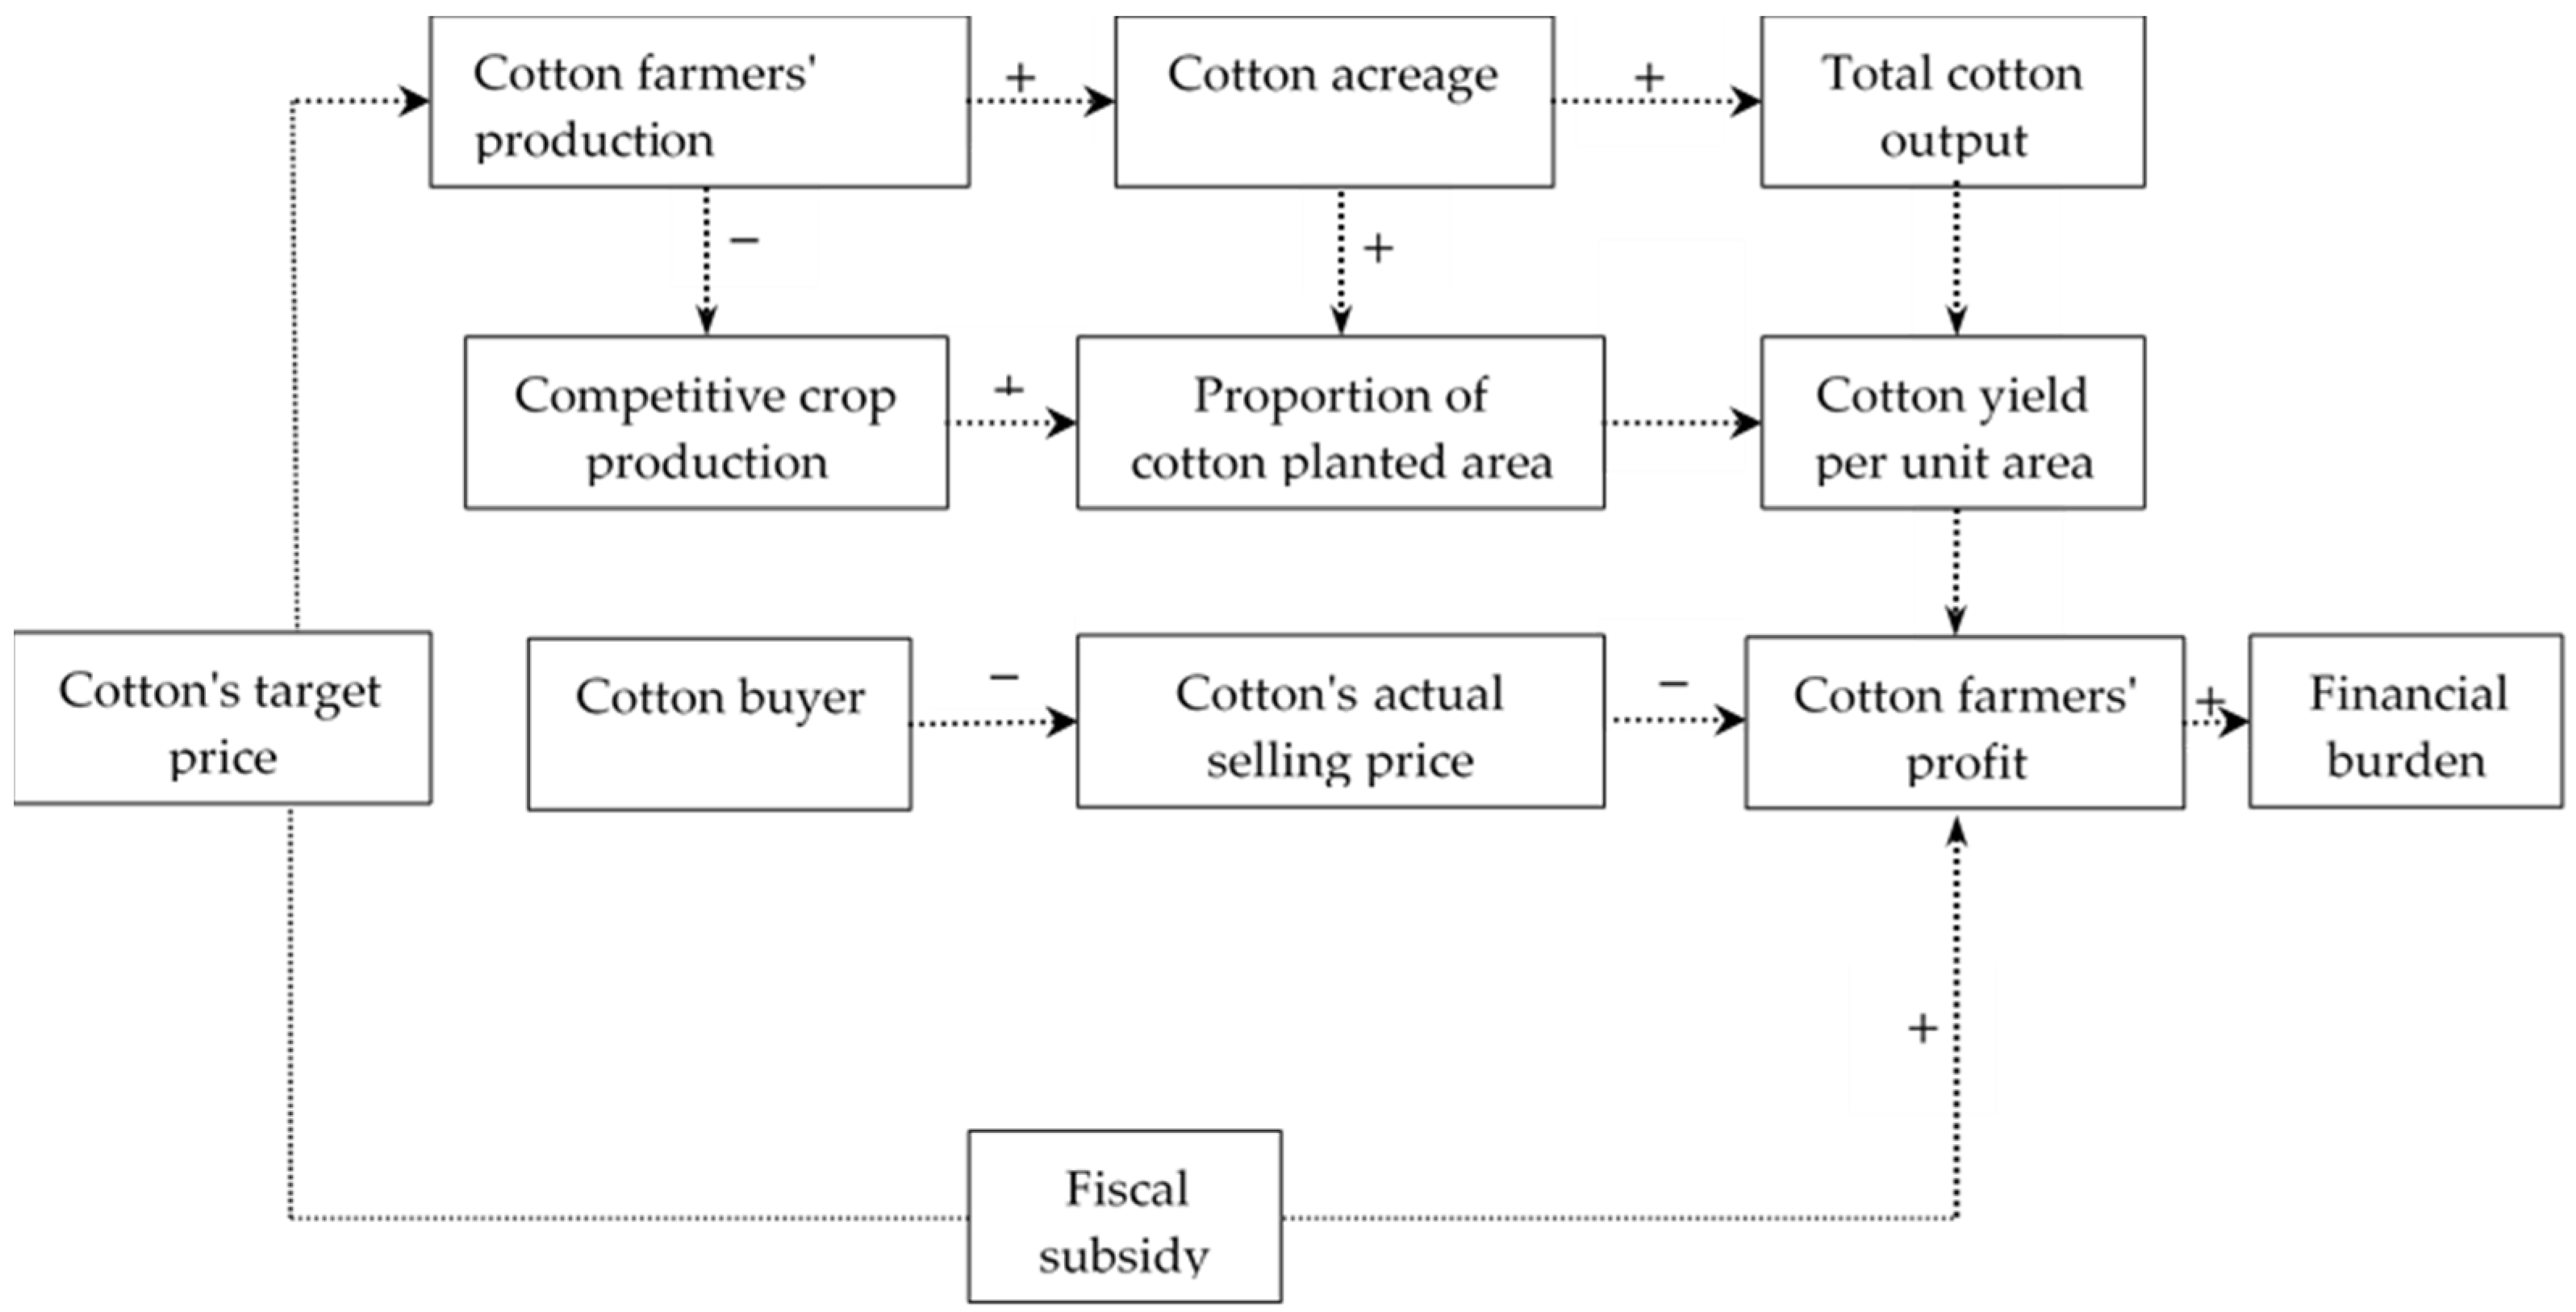
Further, in order to understand the influence of target price policy on cotton production, according to the theory of farmers’ behavior,
Figure 2 is provided [
51]. It is certain from the above analysis that the implementation of a target price for cotton can increase the enthusiasm of cotton farmers and affect their production decisions. Subsequent to the implementation of a target price policy, when cotton farmers decide to expand the production area of cotton, as the cultivated area owned by cotton farmers is relatively unchanged, expanding the planting area will simultaneously reduce the production of competitive crops, such as wheat and corn. Furthermore, when the proportion of planting area of cotton increases, the planting structure will change. In addition, the implementation of target price can lead to the simultaneous increase of cotton’s total output and cotton’s acreage; if the total yield of cotton does not rise as fast as the acreage of cotton, cotton farmers’ production of the cotton area yield will be reduced.
In the same way, if the total yield of cotton increases faster than the acreage of cotton, cotton farmers’ production of cotton area yield will be improved. Based on the target price policy implemented in Xinjiang, the expansion of the scale of cotton-planting area will not be economic, owing to the implementation of the target price policy, wherein the growth factors of production input is often lower than cotton-planting area of growth, resulting in a decline in the yield of cotton. However, considering the presence of the target price policy, even if the per mu yield decreases (Mu is a unit of land area in the Chinese municipal system, 1 mu is equal to 60 square feet), cotton farmers are willing to expand the planting area of cotton to increase their income, resulting in a blind expansion of planting area of cotton and leading to the increase of cotton output. The total output of cotton will lead to a large number of financial subsidies, thus increasing the national financial burden [
52].
4. Data and Methods
4.1. Data Source
The data used in this paper are from the county-level panel data constituting 60 counties and cities in Xinjiang province and 82 counties and cities in Shandong province; the data of all counties include the indicators from 2011 to 2018. Since 2014, the target price subsidy policy of cotton considers Xinjiang as the pilot, while counties in Shandong Province have not implemented the target price subsidy policy. As such, the counties and cities in Xinjiang are selected as the processing group. Further, Shandong province, which has a similar planting structure and is also a major cotton-producing province, is selected as the control group. Data have been collected from 2011 as it was the year when the temporary purchase and storage policy for cotton production was implemented, and it avoids the systematic differences caused by policy changes before 2011. Data pertaining to cotton production, cotton-planting area, seeded area of corn, and wheat-planting area are derived from various sources, such as the Easy Professional Superior (EPS) statistical database, China’s social and economic development statistical database, statistical yearbook of Chinese provinces (autonomous regions), cities and counties, while the per mu yield of cotton is calculated according to cotton’s sown area and total yield (mu is a unit of land area in Chinese municipal system; 1 mu is equal to 60 square feet), and the production cost of cotton, the sales price of cotton, the sales price of corn and the sales price of wheat are derived from the Chinese Agricultural Cost–Benefit Data Compilation (CACDC). In 2014, China began to implement the target price policy of cotton in Xinjiang. Therefore, this paper considered 60 counties and cities in Xinjiang as the treatment group, adopted the propensity score matching (PSM) method, matched control samples from 82 counties and cities in Shandong as the control group, and finally, obtained 960 sample observations.
4.2. Methods
4.2.1. Selection and Definition of Model Variables
The explained variables are the proportion of cotton-planting area, total cotton production, and per mu yield of cotton, referring to the proportion of cotton sown area to the main crop sown area, total regional cotton production, and output per mu of cotton, respectively. All the variables are logarithmically treated in this paper. The core explanatory variable of this paper is whether to implement the target price policy of cotton or not. Since the target price policy of cotton is only implemented in counties and districts of Xinjiang, this paper assigns a value of 1 to the districts and counties of Xinjiang after 2014 and assigns a value of 0 otherwise. In the PSM-DID robustness test in the following part, this paper also sets the regional variable as an individual, uses the Logit model to estimate the propensity score and carry out kernel matching, and conducts corresponding tests on this basis.
In order to control the influence of other factors on explained variables, corresponding control variables are also set in this paper. Cotton price (Cprice) and cotton production cost (ln cost) will influence the production decision of cotton farmers. In addition, competitive crops may also affect cotton cultivation. This article selects Xinjiang and Shandong county-level data as a sample as the planting structures in the provinces are relatively similar, and as a majority of the farmers cultivate cotton, corn, and wheat. Acreage (ln marea) of wheat, corn (mprice) price, (ln warea), and wheat prices (wprice) reflect the competitive crop production and market situation. The definition and description of each variable are shown in
Table 1.
4.2.2. The Models
Target price can be observed from the perspective of a national policy reform of soybean, cotton, grain, and livestock such as pigs and other agricultural products to a natural experiment. The pilot reform for the cotton price target policy was only carried out in the cotton-growing counties of Xinjiang. The target price policy has been implemented since 2014 in the Xinjiang region. This paper considers the counties and cities of Xinjiang as the treatment group and the counties and cities of Shandong, where the target price policy of cotton was not implemented, as the control group. Considering this, the influence of external factors, such as international cotton price fluctuation on cotton planting, can be eliminated.
The following double-difference benchmark regression model was constructed to test the impact of target price policy on cotton cultivation:
In (1), is the explained variable; and represent the county and year, respectively; the ratio of cotton area, total cotton output, and per mu yield of cotton were selected as the explained variables; represents the choice of whether to implement a target price policy or not; represents the implementation of the target price policy to differentiate between the length of time before and after the experiment; and is the core variable of this article. Its corresponding coefficient is the key object of this paper. If the coefficient of is significantly positive, it indicates that the target price policy of cotton promotes cotton planting. represents other control variables, is used to control for individual effects that do not change over time, and represents the random error term of the model.
In order to analyze whether there is a dynamic effect of the implementation of target price policy on cotton planting or not, Equation (1) can be modified to the following:
Considering the above equation, the cross term is the dummy variable in the year k after a county implemented the target price policy in 2014. represents the effect of the policy on cotton planting in the k year after the implementation of the target price policy.
We will also discuss the parallel trend test. To be specific, time is added on the basis of Equation (2), and the year 2011 is taken as 1, while the year 2012 is taken as 2 to represent the time trend. Bounded by the year 2014 (‘Current’) of the target price policy implementation, Beforek and Afterk represent the year before and after the policy implementation and are replaced by ‘Current’. In other words, samples Before3, Before2, and Before1 are before the policy is implemented, and Before3, Before2, and Before1 all have a value of 1; otherwise, they have a value of 0. The ‘Current’ sample in the year of policy implementation is 1; otherwise, it is 0. After1, After2, and After3 of samples in the first, second, and third year of policy implementation are all set as 1; otherwise, the value is 0. In addition to the impact of the target price policy on cotton planting, there may be other policies or random factors that affect cotton planting that are unrelated to the implementation of the target price policy but ultimately affect the accuracy of the conclusions of this paper. In order to eliminate the potential influence of such factors, this paper draws on the practice of most works of literature [
53,
54,
55], constructs a counterfactual hypothesis, advances the year before the implementation of the target price policy by 2 or 3 years, and then conducts a parallel trend test.
Finally, in order to verify the mechanism of the impact of the implementation of the target price policy on cotton planting, the following model is constructed:
In (3), the control variable of (1) is taken as the explained variable, and then the least-squares regression is carried out for the key variable , in order to reveal the mechanism of the influence of the target price policy on cotton planting.
The premise of the double-difference method is that there is a common trend between the treatment and control groups. In other words, without the implementation of the target price policy for cotton, the growth of cotton output in counties and cities of Xinjiang and Shandong will change over time without any systematic difference. However, neither the classical production model theory nor the cotton production practice can satisfy the premise of the double-difference method. The PSM-DID method proposed by Heckman can effectively avoid this problem and justify the double-difference method and the premise hypothesis of the common trend, and mitigate the self-selection bias and the counterfactual framework to some extent [
56,
57]. PSM-DID selects a county
from the control group that has not implemented the target price policy of cotton so that this county has the same characteristics as
county in the treatment group, namely,
.
When the growth of cotton output in these two counties is completely dependent on the control variable, the probability of implementing the target price policy of cotton in county and county is similar; thus, a comparative analysis is possible. The matching estimator is helpful to solve the problem of whether there is a systematic difference between the treatment group and the control group before being affected by the target price policy in the differential method. In general, control variables include multiple variables if the control variables are directly used for matching, where matching in the high-dimensional space may lead to data sparsity. As such, it is necessary to measure the individual distance.
Considering the above, function
can be used to treat
as a one-dimensional variable; then, it can be matched according to
. When measuring distance, a propensity score was used and matched as a distance function [
58,
59]. The advantage of the tendency-score-matching method is that it reduces the dimension of the control variable
and ensures that the value ranges between 0 and 1. In this paper, the kernel-matching method was used to determine the weight. First, the Logit model was used to calculate the propensity score and eliminate the unreasonable control group samples. Then, the changes to cotton planting before and after the implementation of the target price policy were calculated. For counties in Xinjiang, the changes of cotton planting before and after the implementation of the target price policy in the corresponding counties and cities in Shandong were calculated to obtain ATT (the policy’s average treatment effect), and then the influence of cotton planting caused by the implementation of the policy is deduced. Finally, the PSM-DID method was used for the robustness test.
5. Results
5.1. Descriptive Statistics of the Variables
Table 2 shows descriptive statistics of the variables in the model. Overall, the data of cotton planting in Xinjiang and Shandong are quite different, and cotton planting in Xinjiang has more advantages than that in Shandong. Specifically, from 2011 to 2018, the proportion of cotton planting in Xinjiang was larger than that in Shandong. The average proportion of cotton-planting area in Xinjiang was 0.7155 in 2011–2018, while the average proportion of cotton-planting area in Shandong was 0.1432 in 2011–2018. There is also a large difference in the total cotton yield between Xinjiang and Shandong. The total cotton yield in Xinjiang is much greater than that in Shandong, but the difference in cotton yield per mu between the two regions is not very obvious. There are some differences between cotton price and cotton production cost. The average cotton price in Xinjiang is higher than that in Shandong, and the cotton production cost in Xinjiang is lower than that in Shandong. The average level of corn planting area and wheat-planting area in Xinjiang is less than that in Shandong, but there is little difference between the corn price and wheat price in the two regions.
5.2. Effect of Cotton Price Target Policy on Cotton Planting
In 2014, China began to implement the pilot reform of the cotton target price policy in Xinjiang to protect the interests of cotton farmers through price difference subsidies. The target price policy of cotton is equivalent to a quasi-natural experiment. The experimental group included counties and cities in Xinjiang province that implemented the target price policy of cotton, while the control group included counties and cities in Shandong province that did not implement the target price policy of cotton. Therefore, in order to analyze the impact of the target price policy on cotton planting, this paper uses the double-difference method.
Table 3 shows the impact of the target price policy on cotton planting, where columns (1), (3), and (5) indicate the estimated results without control variables, and columns (2), (4), and (6) indicate the estimated results after the control variables are included. One can observe that in columns (1) and (2), when none of the control variables were introduced, the target price policy for cotton acreage proportion had a significant positive influence. When the control variables were introduced, the results showed that the cotton price target effectively promoted the growth of the cotton-planting area, thereby significantly increasing the proportion of cotton acreage. The estimation of control variables showed that cotton sales price had a significant effect on the proportion of cotton acreage, and cotton-planting cost, corn planting acreage, corn price, and wheat price all had a significant negative effect on the proportion of cotton-planting acreage. Columns (3) and (4) provide the impact of the target price policy on the total output of cotton. It can be observed that the implementation of the target price has a significant positive impact on the main output of cotton, which is verified by the absence of control variables and the introduction of control.
The estimation of control variables showed that cotton sales price had a significant effect on the total cotton production, and cotton-planting cost, corn planting area, corn price, and wheat price had a significant negative effect on the total cotton production. Columns (5) and (6) are listed as the influences of target price policy on per mu cotton yield. It can be observed that the implementation of the target price policy has led to the decline of per mu cotton yield. Both the non-introduction of control variables and the introduction of control variables indicate that the target price policy has a significant negative effect on per mu cotton yield. Control variable estimates indicate that the sale price of cotton per mu has a significant negative effect. When cotton sales price is higher, the income expectations of farmers increase, the incentive to produce is more, and the cotton-planting area is larger, while the increase in cotton output is less than the extent of the cotton-planting area, leading to the lower cotton per mu. Cotton-planting cost, wheat-planting area, corn selling price, and wheat selling price all had significant positive effects on cotton yield per mu. Therefore, although the target price policy promoted the growth of the cotton-planting area and cotton output, it reduced the per mu yield of cotton. In other words, the target price policy had a good effect on improving the enthusiasm of cotton farmers, but cotton production did not show economies of scale.
5.3. Dynamic Influence of Target Price Policy on Cotton Planting
The impact of the implementation of the cotton target price policy on cotton planting may be delayed. As time passes, the cotton target price policy may gradually affect cotton farmers’ cotton-planting decisions, leading to changes in the proportion of cotton-planting area and yield per mu. Therefore, this paper further analyzes the dynamic effect of the target price policy on the growth of cotton output.
Table 4 tests whether or not there is a dynamic effect of the target price policy on cotton output. Considering the time effect of cotton target price policy, the target price of cotton policy on cotton-planting area proportion, the total output of cotton, and influence area yield certainly increase. Further, subsequent to adding control variables, the cotton price target of policy on the cotton area of area yield and growth of dynamic effect is significant. However, when the implementation time of the cotton price target policy is longer, it has a greater influence on the proportion of cotton-planting area and total cotton production. On the contrary, the per mu yield of cotton shows a downward trend as the policy is implemented over time. This indicates that although the target price policy can mobilize the enthusiasm of cotton farmers for production, it may also excessively stimulate the demand for cotton planting, leading to the increase of cotton-planting area and yield while decreasing the cotton-planting quality.
5.4. Parallel Trend Test
Table 5 shows the results of the average trend test. The coefficient on Before
k fails the significance test, whether the target price policy was implemented two or three years earlier. Therefore, it also suggests that there is no significant difference to satisfy the parallelism hypothesis. The coefficient estimation of the key variable
obtained above is unbiased. In addition, after the treatment group implemented the target price policy, the coefficient corresponding to After
k gradually increased and passed the significance test, which indicates that the implementation of the target price policy of cotton had a significant impact on cotton planting. In other words, the parallel trend test was verified, indicating the robustness of the results of the above double difference.
Before the double-difference method was used to estimate, the tendency of the score-matching method was adopted to deal with the matched group, control group, matching of the variables including cotton-planting cost, cotton sales prices, competitive crop planting proportion of planting structure, etc., after the replacement of matching variable, estimating the double difference again. The results are shown in
Table 6. The results in
Table 6 are similar to those in
Table 3 and
Table 4. Therefore, the result of the propensity-score-matching method used in this paper is robust.
5.5. Influence Mechanism of Target Price Policy on Planting Cotton
The implementation of the target price policy promoted the increase of the proportion of cotton-planting area but also led to the decline of cotton yield per unit area, and this trend will become more obvious as time passes. As such, how does the target price policy affect cotton planting, and what mechanism exists to lead to the increase of cotton-planting area yield and the decline of cotton quality? To answer this question, this paper uses Equation (3) to estimate the mechanism of the impact of the target price policy on the cultivation of cotton and competitive crops, and the results are shown in
Table 7. The coefficient of the first column (1) is negative, and the increasing absolute value size shows that with the passage of time, the sale price of cotton is decreasing. This could be owing to the existence of a target price policy; when the cotton price is lower than a usual monohydrate, producers are given corresponding price subsidies by the government, whereby the producers’ income is unchanged, while bidders have pricing power and lower cotton purchase price can provide more profits. In column (2), the coefficient is positive, indicating that the cotton production cost will increase with the implementation of the target price policy. The coefficients of columns (3) and (4) are positive, indicating that after the implementation of the target price, the planting areas of corn and wheat will decrease as time passes, while the coefficients of columns (5) and (6) are all positive, indicating that the selling price of corn and wheat will increase with the passage of time. In conclusion, the implementation of the target price policy has affected cotton prices, cotton-planting costs, and competitive crop production, thus resulting in an increase in the proportion of the planted area of cotton and a decrease in yield per mu.
6. Discussion
In 2014, Xinjiang implemented the pilot reform of the target price policy for cotton, and many scholars carried out studies on the effect and influence of the implementation of the target price policy. Different from the existing literature, this paper adopts the panel data of Xinjiang and Shandong counties from 2011 to 2018 and analyzes the impact of the implementation of the target price policy on cotton planting by using the PSM-DID method. The contributions of this study are: (a) it empirically analyzes the impact of the target price policy on the planting structure by using county-level panel data of Xinjiang province and Shandong province in China. (b) It discusses how cotton planting is affected by the target price policy. (c) It also verifies the policy reform, adjusts the cause-and-effect relationship between cotton-planting areas, and provides theoretical evidence for updating the target price adjustment and policy support for cotton.
The results showed that the target price policy promoted the growth of cotton-planting area and output but reduced the per mu yield of cotton, and the target price policy did not bring about the scale economy of cotton production, which is the same as the research conclusion that the subsidy policy failed to effectively improve the cotton productivity. Based on the effect of the implementation of the target price policy on cotton planting, the paper further analyzes the dynamic effect of the target price policy on the growth of cotton output. The empirical results show that the longer the implementation time of the target price policy of cotton, the greater its influence on the proportion of cotton-planting area and total cotton production. On the contrary, the per mu yield of cotton shows a downward trend with the implementation time. This indicates that the target price policy can arouse the enthusiasm of cotton farmers for production, but it may also excessively stimulate the demand for cotton planting, thus leading to the increase of cotton-planting area and yield, while the cotton-planting quality decreases. In addition, this paper also considers the potential impact of other policies or random factors on cotton cultivation that have nothing to do with the implementation of the target price policy. A counterfactual hypothesis is constructed, and a parallel trend test is carried out. The results showed that the influence of cotton planting came from the implementation of the target price policy and was not affected by other policies or random factors. The parallel trend test was verified, indicating the robustness of the results of the above double difference. Before the double-difference method, this paper adopts the propensity-score-matching method to match the treatment group to obtain the control group. After the matching variable is replaced, double-difference estimation is conducted again, and the result is similar to the conclusion above. Therefore, the result of the propensity-score-matching method used in this paper is robust.
As for how the target price policy affects cotton planting, what mechanism exists to lead to the increase of cotton-planting area yield and the decline of cotton quality? This paper uses the corresponding model to estimate the mechanism of the impact of the target price policy on the planting of cotton and competitive crops. The results show that the implementation of the target price policy affects the price of cotton, the planting cost of cotton, and the production of competitive crops, thus leading to the increase of the proportion of cotton-planting area and the decrease of yield per mu.
However, there are still some deficiencies. For example, this paper only tested China’s cotton production, but other agricultural products, such as rice, wheat, soybean, and pigs, need to be measured so as to effectively verify the model and explore the mechanism of action of corresponding policies on agricultural products. At the same time, by t it is difficult to obtain county-level data in this paper; there are more relevant indicators that we could not employ. In addition, in order to avoid the bias caused by policy differences before and after 2011 and ensure that the data constructed in this paper are conducive to PSM-DID analysis, this paper selected 2011–2014 as the data year before the cotton target price subsidy policy and 2015–2018 as the data year after the target price policy. The time period may be too short for some research.
7. Conclusions and Implications
Based on the above analysis, this paper draws the following conclusions. First, subsequent to the change from a temporary storage policy to the target price system, cotton production is overly stimulated, cotton farmers have a high enthusiasm for cotton production, cotton output has grown rapidly, but the yield per unit area has declined, indicating that there is a ‘bubble’ in cotton cultivation. Second, the target price policy primarily realizes the expansion of cotton planting by scale by reducing the area for the cultivation of competitive crops. The target price policy of cotton cultivation encourages the usage of the production space of competitive crops, which may affect food supply and food security in the region.
In view of the above conclusions, the target price policy of cotton should be optimized and adjusted accordingly. First, the target price level should be formulated with full consideration of the comparative benefits between different crops. The establishment of the cotton target price level should not only consider the future supply and demand of cotton at home and abroad, the income of cotton farmers in Xinjiang, and the stable development of cotton production, but also pay close attention to the coordination of grain and cotton, balance the comparative benefits of grain and cotton, and prevent single products. The relatively high yield of planting crops and the rapid expansion of planting areas have caused the imbalance of crop structure in Xinjiang. Second, it is important to restrict the subjects enjoying subsidies and the upper limit of subsidies. In the implementation of the cotton target price subsidy policy, there is no distinction between basic farmers and business units, and both of them can receive subsidies. In order to avoid and prevent producers from over-expanding cotton-planting areas to obtain subsidies, based on the experience of other countries, it is recommended to cancel the qualification for subsidies for business units, and at the same time limit the maximum production area and output of basic farmers that enjoy subsidies, exceeding the prescribed maximum production area and the part of production that no longer enjoys state subsidies. Third, we recommend implementing green development concepts and strict environmental protection policies. Guide cotton production to concentrate on advantageous production areas and strictly prohibit the reclamation of wasteland and planting cotton in ecologically fragile areas. Another goal is to improve the accountability system. Once it is discovered that cotton is cultivated in the ecologically fragile area, the producer will be immediately disqualified from enjoying the cotton target price subsidy and will not be able to enjoy other national subsidy policies for three consecutive years. Lastly, it is important to raise the standard of water resource usage fees in ecologically fragile areas and increase the cost of agricultural production activities in ecologically fragile areas.
In addition, there are the following improvements for future research. First, we should continue to promote and apply this model to other agricultural products so as to improve this model and obtain greater policy significance. Second, more consideration should be given to the selection of variables, and more complete and easily accessible data should be selected. Finally, in order to draw far-reaching conclusions, the time period should be sufficient for the study.


